54
Market Perspectives June 2015 Jun. 2 nd , 2015 www.finlightresearch.com if you pull a rubber-band too far, it eventually snaps.
| Date post: | 28-Jan-2018 |
| Category: |
Economy & Finance |
| Upload: | finlight-research |
| View: | 209 times |
| Download: | 0 times |

Market Perspectives
June 2015
Jun. 2nd, 2015
www.finlightresearch.com
if you pull a rubber-band too far, it eventually snaps.

“When you combine ignorance and leverage,
you get some pretty interesting results.”– Warren Buffett
“ I have reluctantly reached the conclusion that
nothing is more suicidal than a rational
investment policy in an irrational world. ”- John Maynard Keynes (1931)
2
FinLight Research | www.finlightresearch.com

Executive Summary: Global Asset Allocation
� After 6 years of monetary pumping and low volatility, dark clouds are now
rising on risky assets
� Actually, a perfect storm is building… It combines historically overvalued stocks
with a stretched government bond market.. Unlike previous storms (2000, 2008),
investors would be left with almost no place to hide.
� Economic news has been generally weaker than expected. The market is around all-
time highs during a very uncertain period for the global economy. And any
additional signs of economic improvement are likely to have a negative impact on
the market (this is the “good news are bad news” syndrome)
� Rising inflationary expectations are about to change the existing dynamic in
place, on interest rates, stocks, forex and commodities. We find the sell-off in bond
markets seems rational but puzzling… Nowadays, rationality appears puzzling in
such irrational markets.
� The ECB QE compression trade is exhausted.
� Greece remains the wild card, but an answer appears now closer than it has been
� Markets remain focused on reading the minds of Fed. Given the tone of the last
FOMC meeting, it seems unlikely that the Fed will raise rates in June. We still see
the first rate hike coming in Sep. meeting, when the market prices it in Dec ‘15.
� The perspective of loosing their Mr. Zero interest rate friend is already causing
portfolio managers some palpitations. We expect it, when it is effective, to
depress all asset prices for at least part of next year.
� The prospect of rising interest rates, a stronger US dollar and economic uncertainty ,
could also be a trigger for higher cross-asset volatility.
� We summarize our views as follows �
3
FinLight Research | www.finlightresearch.com

Executive Summary: Global Asset Allocation
� Historically, the mixture of rising volatility and interest rates has had a bad
effect on equity prices
� At this stage, valuation levels in equity (coupled with a deteriorating US corporate
earnings growth and a slowing productivity) and credit are high enough to make us
cautious. But we stay Neutral equities as far as our hurdles are not breached.
� We still see a solid case for further dollar strength, lower oil prices and lower
commodities.
� Maintain UW government bonds and corporate credit overall (but with an intra-
asset class preference for IG vs HY, Eurozone vs US in HY, US vs Eurozone in IG),
OW US dollar and UW commodities (especially energy and precious metals)
� Long-term investors should do like us, raise their cash holdings and wait for
better investment opportunities / entry points
� We summarize our views as follows �
4
FinLight Research | www.finlightresearch.com

MACRO VIEW
� The Good
� US Employment remains the most positive economic indicator � US Housing starts and permits hit multi-year highs, and the existing home sales trend is
oriented to the upside
� The Bad
� US GDP was revised into negative territory (-0.7% as a second estimate)� YoY US growth rate of forward earnings estimate is still negative� Both capacity utilization and industrial production fell for a fifth straight month� Real Retail Sales have contracted for 4 of the past 5 months. April contraction indicates that
weak consumer spending is probably driven by something beyond weather (unlike Q1-2015 anemic data).
� Durable goods continued the recent decline
� The Ugly
� Greece remains the wild card. Everyone on the market is expecting a last-minute compromise. A Greek default would induce a global downside on risky assets
� Main systemic risk resides in China: After a decade of economic boom, China has accumulated significant imbalances. China’s economy is supported by approximately six trillion dollars of 'shadow debt', coupled with an unprecedented credit-fueled construction madness, and now a bubble-like stock market � Systemic risk is around the corner
5
FinLight Research | www.finlightresearch.com

6
FinLight Research | www.finlightresearch.com
The Big Four Economic Indicators
� The overall picture had been one of a slow recovery, but there is no indication of a recession using the indicators monitored by the NBER.
� After March bounce, Retail Sales in April declined -0.10% in real terms, implying that weak consumer spending is probably driven by something beyond weather (unlike Q1-2015 anemic data).
� Industrial Production has decline for 5 months in a row and Real Retail Sales have contracted for
4 of the past 5 months.

7
FinLight Research | www.finlightresearch.com
Industrial Production
� Both US industrial production and capacity utilization (of the manufacturing output potential) fell for a fifth straight month

8
FinLight Research | www.finlightresearch.com
Consumer Sentiment
� The University of Michigan final Consumer Sentiment for May came in at 90.7, down from 95.9 in April and well below the local high of 98.1 in January
� Michigan survey shows a similar mood to that of small business owners as captured by the NFIB Business Optimism Index

9
FinLight Research | www.finlightresearch.com
Inflation Expectations
� Sentiment is shifting on the inflation
front, in the US but also in Europe.
� Fresh signs show that US inflation has bottomed, pushing long-term yields higher
� Deflationary concerns has clearly eased in Europe. QE is currently leading to the reflation of the economy and the injection of liquidity into the system � 5yx5y inflation is rebounding
Source: Goldman Sachs

10
FinLight Research | www.finlightresearch.com
GS – Global Leading Indicator (GLI)
� … But nothing exciting yet on
the GLI front!
� The May Final GLI came in at1.1%yoy. It momentum is near0+%.
� Since March, GLI growth has beenpositive and increasing. But this‘Expansion’ phase is anemic andcrossing the border to the“Slowdown” phase could occuranytime.
� 8 of the 10 underlying componentsof the GLI improved in May
� We’ve been thinking for a while
now that the acceleration we’ve
seen last year was quite modest
for a typical expansion phase.

11
FinLight Research | www.finlightresearch.com
EQUITY
� Is the market at an inflection point after 6 years of (almost) straight rally? The denouement is not
too far off.
� Despite the mixed macroeconomic environment and the toppish pattern we witness on earnings and margins, global equity markets have remained complacent, with small caps outperforming large caps and growth outperforming value.
� At this stage, there is no sign yet of a bearish trend formation… The market momentum is still technically bullish but halting. Our rule of thumb for that is to wait for the S&P500 to start making lower lows and lower highs. This is a necessary (but not a sufficient) condition to raise the alert.
� However, the market seems trapped in a sideways trading range, probably awaiting a catalyst to breakout one way or another.
� Recent data shows more evidence of lower productivity, lower potential GDP growth and higher
inflation risk. � This is a bad scenario for stocks
� We still believe that equity markets are living on borrowed time because…Earnings season hasn't provided the catalyst needed for the breakout to the upside� Stocks are entering a seasonally unfavorable period, with no earnings growth expected in the first
half of 2015� Valuations are well above historical norms, especially when we take into account the slower
revenue growth, the lower margins and the starting wage pressures � The coming rate hikes will depress all asset prices for at least a part of next year� But US equity options already appear to price a less optimistic scenario. The S&P 500 skew is at a
10-year high.

12
FinLight Research | www.finlightresearch.com
EQUITY
� Bottom line :
� Nothing new compared to our previous report. We remain Neutral equities as long as they stay trapped in their sideways trading range
� We may revise our view to OW after a clean break of the 2075-2125 range to the upside on the S&P500, and to UW below the trend since Nov. ‘12 lows
� We think it is wise to incrementally "de-risk" your portfolios by focusing on higher quality / more defensive / more favorably priced companies
� We remain OW on Japan (always on an FX hedged basis) as we see further upside for Japanese stocks from the improvement in macro data and corporate earnings momentum.
� We remain Neutral on Europe vs. US despite the massive ECB’s QE. According to the 12 month forward P/E, Europe is trading at 15 year highs, relative to the US
� We remain OW EM stocks (ex-China) given the improvement in relative growth forecasts in EM vs DM and the strong momentum in place. We prefer to keep away from Chinese market.
� We remain UW in US small caps vs large caps.
13
FinLight Research | www.finlightresearch.com
US Earnings
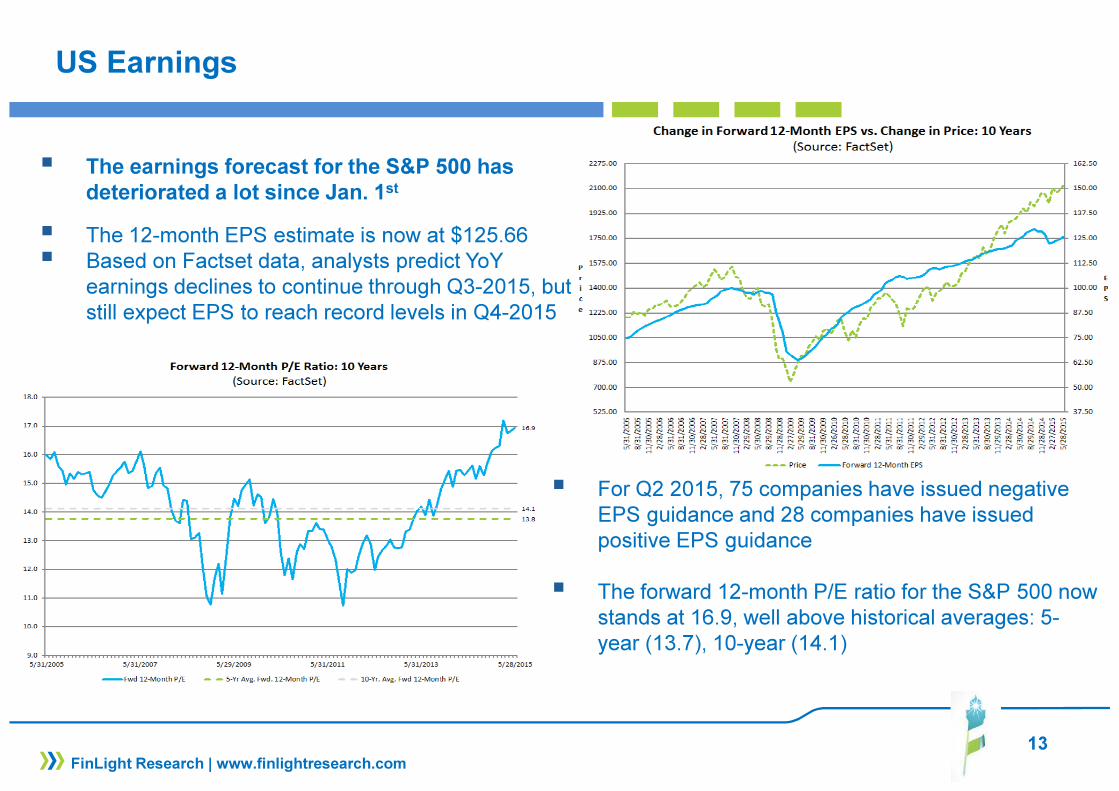
� For Q2 2015, 75 companies have issued negative EPS guidance and 28 companies have issued positive EPS guidance
� The forward 12-month P/E ratio for the S&P 500 now stands at 16.9, well above historical averages: 5-year (13.7), 10-year (14.1)
� The earnings forecast for the S&P 500 has
deteriorated a lot since Jan. 1st
� The 12-month EPS estimate is now at $125.66 � Based on Factset data, analysts predict YoY
earnings declines to continue through Q3-2015, but still expect EPS to reach record levels in Q4-2015

14
FinLight Research | www.finlightresearch.com
US Net Margin
� 12-month trailing net profit
margin remains high but is
finally heading south
� Nevertheless, analysts are still expecting margins to continue to rise to record levels in H2-2015
� Main risks for profit margins are: a tighter labor market,
and a stagnation in
productivity.

15
FinLight Research | www.finlightresearch.com
Equities: Eurozone vs US
� In Europe, we witness some positive developments in expected earnings and EPS revisions. � EPS revisions for Eurozone have moved back into positive territory for the first time in 4 years� Eurozone earnings seem to move up relative to the US.
� Nevertheless, we remain Neutral on Europe vs. US. According to the 12 month forward P/E, Europe is trading at 15 year highs, relative to the US

16
FinLight Research | www.finlightresearch.com
Equities: Japan vs US
� We’ve been long-term OW Japanese equities versus US equities since Nov. ’14 (on a currency-hedged basis).
� We still think that Japanese equity
outperformance has room to
continue

17
FinLight Research | www.finlightresearch.com
Equities: Small Caps vs Large Caps
� Russell 2000 – S&P500 ratio has improved since Oct. ‘14 but without regaining its previous highs � We interpret this as a cautionary sign

18
FinLight Research | www.finlightresearch.com
Transports Divergence
� Another cautionary sign…
� While the Dow have made new highs, the Transports have made a new 6-month low.
� Over the past 50 years, this kind of divergence has only happened twice : around the 1973 and 2000 peaks

19
FinLight Research | www.finlightresearch.com
Equity Valuation
� 12-month forward PEs are already showing that equity valuations are elevated, especially in
Europe and US
Source: Goldman Sachs

20
FinLight Research | www.finlightresearch.com
Equity Long-Term Valuation
� The market cap of non-financialequities to gross value added(including foreign revenues) ratio isalso showing that the market is
currently at the second most
overvalued level since the 50s

21
FinLight Research | www.finlightresearch.com
Market Sentiment
� Cash ratios (Retail money market to S&P500 market cap and mutual fund cash-to-assets ratio) paint an excessively optimistic picture.
� No money is kept in reserve…
� The current situation bears no similarity to the early 80s when the last secular bull market started.

22
FinLight Research | www.finlightresearch.com
Market Sentiment
� The CSFB fear barometer isbased on a 3-month zero-costcollar on the S&P500. Itshows how far out of themoney the put we buy shouldbe in order to have the samepremium as the 10%-OTMcall we sell.
� The higher the index, themore expensive S&P500 putsare relative to calls.
� The CSFB fear barometerhas been near record highssince mid 2014, showing thatbig traders believe the
market is dangerous at
current levels. They areputting more money on thetable to acquire protection onstocks.

23
FinLight Research | www.finlightresearch.com
S&P500 – A Long-Term Perspective
� There is no more long-term value in
equities!
� According to Shiller's Price Earnings Ratio (CAPE, the S&P 500 is set to deliver anemic real returns over the next one or two decades.
� With current CAPE above 27, the total (inflation-adjusted) return in the subsequent 20 years is expected to be at 2% per annum, at best.
CAPE
20-y
ear
Su
bseq
uen
t
(To
tal
Real)
Retu
rns
Current CAPE
~27.4

24
FinLight Research | www.finlightresearch.com
S&P500 – A Short-Term Perspective
� The S&P500 failed to gain any momentum on the break above the 2125 threshold, and sharply reversed back in its previous trading range
� Main levels to watch over the short term are: 2125 and 2075.

25
FinLight Research | www.finlightresearch.com
Trading Model – S&P500
� As of June 3rd, our prop. Short-Term trading model is modestly short on the S&P500 (2114.07).
� The model is short since June 2nd (2109.6)
� The model targets 2083, 2062 and 2041 on the downside.
26
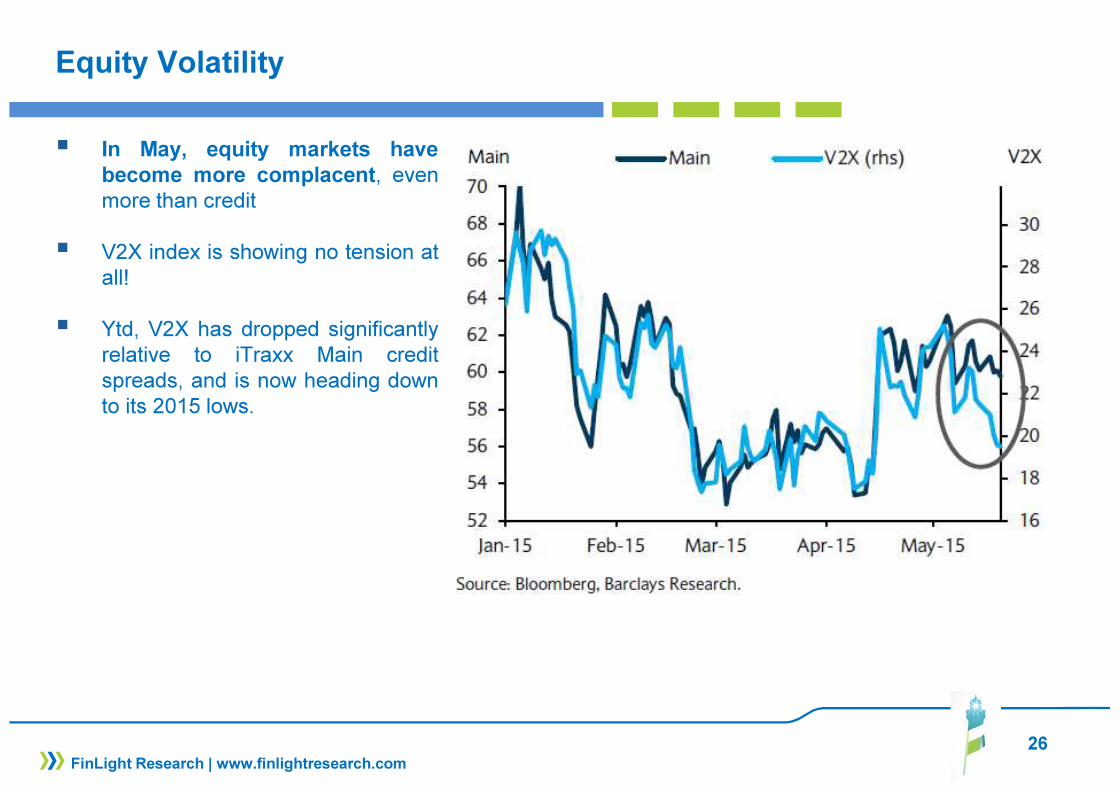
Equity Volatility
� In May, equity markets have
become more complacent, evenmore than credit
� V2X index is showing no tension atall!
� Ytd, V2X has dropped significantlyrelative to iTraxx Main creditspreads, and is now heading downto its 2015 lows.
FinLight Research | www.finlightresearch.com

27
Chinese Equities
� The spectacular rise in Chinese equitiescontinues despite the continued weakness inChina’s economy
� The most probable explanation for that break isthat markets are just factoring a turn up ingrowth later this year (supported by policystimulus).
� Only time will tell…
FinLight Research | www.finlightresearch.com
Note: Chinese equities are the MSCI China index.
Source: Bloomberg, Barclays Research

28
FIXED INCOME & CREDIT
� Sentiment is shifting on inflation expectations, Treasuries falling across the board and volatility
going up.
� Fed’s June rate hike seems to be off the table, given the weak Q1 data in the US. We still expect the Fed to raise rates in September. UST yields remain underpriced relative to this scenario, and speculative positions remain long.
� We believe the higher volatility regime in fixed-income is here to stay.
� Inflationary signs should be watched closely as they will foreshadow a steepening decline in govies.
� We still look for the bear market on USTs to resume.
� We’ve been Neutral UST since end of Nov. ’14. US long-term rates are stuck in a range. 10-year yield is poised to trade 1.85-2.05% (perhaps 1.75-2.25%) until we get closer to Fed hikes. Our medium-term outlook would stay neutral as far as the 10y UST yield remains below 2.25. We’ll move UW above.
� We interpret the last sell-off in German Bund as the reversal we’ve been awaiting. We remain UW on
German Bund (within the sovereign FI asset class) as long as the 10-year yield stays above the
0.45 – 0.50 area.
� We will switch to Neutral again as the 10-year yield reaches our short-term target around 0.75 – 0.90.Bund yields will rise hardly further given the intensive buying by the ECB
FinLight Research | www.finlightresearch.com

29
FIXED INCOME & CREDIT
� The search for yield within the fixed income complex remains strong. We think that higher rates will
weigh on lower-rated assets as investors would move up along the credit scale � We are UW BBs as this rating class is vulnerable to:� outflows from investment grade retail funds with large BB holdings� new issuance as BB spreads are still near their historical tights
� Lower rated new-issue volume has been increasing since the financial crisis. That should drive the default rate higher and HY spreads wider.
� 2Q15 is on track to see the highest volume of M&A since 2007 � this is usually credit negative as corporates focus on shareholder returns at the expense of creditors.
� We remain UW on corporate credit, due to valuation, to rising corporate leverage (specially in the US), to rising volatility, to position within the credit cycle and given the weak total return forecast
� Within the credit pocket, and over the very short-term, we stick with our preference for Eurozone HY
corps vs US HY corps, because of the ECB massive QE, more resilient macro in the Eurozone, and the still elevated beta of US credit spreads to oil prices. Institutional allocation to HY is completely influenced by the ECB-QE. That should support European HY till the Fed hikes its rates.
� However, we remain UW on Eurozone vs US IG given our view on the Bund vs UST� We still prefer IG over HY on a risk-adjusted basis as we expect higher volatility on spreads
� Bottom line : UW Govies, UW Eurozone vs. US Govies, Long flatteners on the US yield curve, UW credit, OW Eurozone vs US HY credit, UW Eurozone vs US IG credit, Neutral TIPS and OW HICP Inflation, UW High Yield vs High Grade, Neutral on EM corporates
FinLight Research | www.finlightresearch.com

30
US Govies – 10y UST
� We’ve been Neutral UST since
end of Nov. ’14.
� We assume that 10-year yield ispoised to trade 1.75-2.25% until weget closer to Fed hikes.
� Our medium-term outlook would
stay neutral as far as the 10y
UST yield remains below 2.25.,
and move UW above to play thelong awaited bear market on USTs.
� Nevertheless, we think that the riskis still biased to the upside on the10y yield.
� As a confirmation, the 2.094support should hold.
FinLight Research | www.finlightresearch.com

31
Eurozone Govies – German Bund
� Last month, we moved UW on
German Bund (within the
sovereign FI asset class) and
decided to:
� remain so as long as the 10-
year yield stays above the
0.45 – 0.50 area.
� switch to Neutral again as the10-year yield reaches ourshort-term target around 0.75 –0.90.
� Our target of 0.75 was reached andwe moved to Neutral. But the yieldrolled back to its range lows and weswitched again to UW.
� Today, we stands within the 0.45-
0.50 support area � We are UW
again and will stay so as long as
the support is preserved.. Wetarget 0.90, then 1.15
FinLight Research | www.finlightresearch.com

32
US TIPS
� Inflation expectations are clearlybottoming. They even seem tobe heading higher…
� We prefer, however, to wait for
more positive economic news
before going OW TIPS.
FinLight Research | www.finlightresearch.com

33
Credit Migration & Default
� 2Q15 is on track to see the highest volume of M&A since 2007 � this is usually credit negative as corporates focus on shareholder returns at the expense of creditors.
� We expect the credit rating drift to move in negative territories with downgrades exceeding upgrades and, finally, default rates going up from their current lows…
FinLight Research | www.finlightresearch.com

34
FinLight Research | www.finlightresearch.com
Releveraging is back
� “Companies are increasing their
leverage to finance their
shareholder return policy” (Source: Exane BNP Paribas)
� We see a wave of buybacks and M&A, financed by debt, arriving at the high of the cycle. A reminiscence of the one we saw with the M&A Telecom wave of 1999?
� This releveraging should be bullish for stocks, but less so for credit spreads
.
Source: Exane BNP Paribas

35
EXCHANGE RATES
� Several weak macro data have led to US$ depreciation. But we do not believe this weakness will persist� Historically, USD cycles have been persistent, lasting 5-6 years in the appreciation phase. We thus see
further medium term USD gains against the major crosses (especially EUR and JPY) and expect a cyclical low in EUR/USD somewhere in 2016 (with the ECB tapering)
� The DXY uptrend is still intact even if the pace slows. But current dollar valuation implies 25 to 50 bps higher rates in the US. Without a September hike the uptrend on the US dollar may be damaged
seriously.
� We’ve seen a sharp reversal on EUR-USD, mainly driven by Bunds. But EUR/USD failed to clear 1.1390, which needs to be cleared to eliminate the persistent risk of a renewed downtrend
� Our positioning on USD is dictated by the same trading rules:� On the DXY index, our 100 hurdle was not reached and we decided, in the beginning of the month,
to switch from a bullish to a more neutral stance as the 96 level was broken to the downside. End of May, the index reemerged above the 96.25 threshold and we switched to OW again.
� On EUR-USD, 1.10 threshold has finally been broken to the downside. Thus, we’ve resumed our UW positioning, but only for a few days and switched back to Neutral as the spot broke above 1.1040. Our strategy is to move back to UW if the pivot breaks below 1.1040, and to OW above the July ‘14 downtrend (~1.1417)
� On USD-JPY, our ultimate target of 124 has been reached. We decide to switch from OW to
Neutral and wait to see how the pivot behaves near the 124.73 level.
FinLight Research | www.finlightresearch.com

36
US Dollar: A Mid-Term Perspective
� We are probably entering the last
part of the game on the US
dollar.
� Since Bretton Woods, USD has seen two important periods of appreciation (lasting 5-6 years each)
� Based on these episodes, we expect the current uptrend to go a little bit further: an additional 10-
15% appreciation before mid-
2016
FinLight Research | www.finlightresearch.com

37
EUR-USD
� The 1.10 threshold has finally
been broken to the downside.
Thus, we’ve resumed our UW
positioning, but only for a few days (with targets at 1.0843 and 1.07)
� We switched again to Neutral as the spot broke above 1.1040
� We will move back to UW if the pivot breaks below 1.1040, and to OW above the July ‘14 downtrend (~1.1417)
FinLight Research | www.finlightresearch.com

38
USD-JPY
� In our May Monthly Report, we’ve said “USD-JPY was unable to break the 122.04 highs, but held nicely against its 100-days MA. We
remain OW USD-JPY as far as the pivot stays above 118 and below the 124-125 area”
� The 122.04 level has finally been cleared and our ultimate target of 124 has been reached.
FinLight Research | www.finlightresearch.com

39
USD-JPY
� From a multi-month/year perspective, the 124-125 level appears to be very important and should be watched closely for signs of a turning point formation
� We decide to switch from OW to
Neutral and wait to see how the
pivot behaves near the 124.73
level.
FinLight Research | www.finlightresearch.com
40
COMMODITY
� After the strongest monthly returns for six years in April, commodity is falling again in May� We are still neutral-to-bearish across many complexes in the near term. To mid-2016, return forecasts
are negative for commodities as a whole.
� Despite the rally seen in April (mainly driven by a weaker US dollar and expectation of morestimulus in China), the trend remains bearish. There is no indication of a bottom formation yet.
� Global commodity prices could stay suppressed as less demand from China leads to greateroversupply
� We think that it is still too early to get in the “reflation trade” of a weaker dollar and highercommodity prices
� We remain UW commodities. We continue, however, to like owning the GSCI index, and think
that commodities hold value as cross-asset portfolio diversifiers.
Bottom Line :
� Base Metals: Base metals prices were up over 7% in April, without any fundamental justification(except Copper for which we’ve seen a modest increase in Chinese demand). We remain Neutral on
base metals, but do not like holding Copper as it appears highly overvalued relative to the dollarand the global growth. We move from OW to Neutral on aluminum and zinc as they proved lessresilient than the average base metal. Zinc net speculative length on the LME recently reached itshighest level since mid-2014
FinLight Research | www.finlightresearch.com

41
COMMODITY
� Agriculture: We keep our bearish outlook on this sector. Strong production and substantial stocks (builtsince the 2012 drought) are weighing on prices. Absent a severe weather shock, it is unlikely thatagriculture prices will spike this year. We still anticipate they will revert to 2009 level, over the medium-term. Nevertheless, we decided last month to tactically switch from UW to Neutral because of thebearish bets on agricultural commodities accumulated by managed money. Short positions are near all-time record highs, particularly in corn and wheat. A crowded deal we don’t like…
� Energy: Market is facing a huge oversupply on crude oil, and still seems ripe for a downside pricecorrection, as OPEC is unlikely to cut.� In April, and according to our trading rule (please see our March monthly report), we switched to
Neutral at 54 on WTI.
� We will move to OW if the WTI breaks above 63, and to UW again if it trades below 56.5 (to targetMarch lows).
� We still think it is too early to expect major upside for the price of oil as the US is sinking
deeper in a glut of excess oil
� From a relative value point of view, we expect the WTI’s contango will disappear progressively asthe spot price goes up and futures go down.
FinLight Research | www.finlightresearch.com

42
COMMODITY
� Precious Metals: Gold prices have been caught within range-bound trading. Higher rates set to continue to exert fundamental pressure on gold price. � We change nothing to our view on precious metals. The stimulus provided by the ECB & BoJ is
already factored in gold prices. Precious metals are vulnerable to higher US real yields and
stronger dollar � We maintain the view that Q3 15 is likely to be the weakest quarter for gold
� We think that as long as gold is trading below 1225, it could be heading back down to test theMarch low
� We remain UW above 1150-1170 band. We will move Neutral below 1150 and switch
progressively to OW (accumulate) as the spot slides down towards 1000-980, which is likely
the final leg down. Only a clean break above 1225 may push us to reconsider our view.
� Silver is supported by Chinese imports. Our first target on silver stands at 14.70. We still think that Silver (like gold) is probably ready for its final leg down towards 12.50. At current levels, we are
UW. we will switch progressively to OW (accumulate) as the spot breaks the first material resistance around 14.70 and slides down towards 12.50
� We may reconsider our UW position if the Silver breaks above 16.7-17.
FinLight Research | www.finlightresearch.com

43
S&P GSCI Index
� Commodity prices appear moreand more correlated to the USdollar and China (Chinese assetsand its stimulus policy )
FinLight Research | www.finlightresearch.com

44
Crude Oil – Fundamentals
� It is unlikely that crude prices will move
upwards much further
� Market is facing a huge oversupply on crude oil,and still seems ripe for a downside pricecorrection
� Although the number of rigs in the US hasdropped by 60% since last November, US oilproduction is still going up. The world is stilloversupplied with oil. And this trend seems to behere for a while…
� This explains the huge build we witness in oilinventories.
FinLight Research | www.finlightresearch.com

45
Gold
� Gold is still testing importantsupport at 1,175. A break belowwill open the door to 1165 andthen to March lows (1142).
� We change nothing to ourstrategy: We remain UW Gold. Wemove Neutral below 1150 andswitch progressively to OW(accumulate) as the spot slides
down towards 1000-980, which
is likely the final leg down.
� Only a clean break above 1225may push us to reconsider ourview.
� We think that as long as gold is
trading below 1225, it could be
heading back down to test the
March low.
FinLight Research | www.finlightresearch.com

46
Base Metals - Copper
� We think that Copper is still in astructural downtrend, with lower highsand lower lows since 2012
� In the short-term, we expect Copper tobreak its local uptrend and toaccelerate to new lows.
� We remains UW Copper within the
base metals complex.
� The main level to watch forconfirmation is 6010.
� Our view will be invalidated if the spotbreaks above the top of the channel at6550
FinLight Research | www.finlightresearch.com

47
ALTERNATIVE STRATEGIES
� Against a choppy market backdrop, hedge funds were broadly positive…
� In May, hedge funds posted gains with the HFRX Global Hedge Fund Index gaining +0.26% and the HFRX Absolute Return Index gaining +0.59%. The HFRI Composite Index advanced +0.7% (+3.9% Ytd)
� Performance was led by :� Merger Arb (+0.83%) as deal activity continued to surge. The current year is on track to be the best
year for M&A ever. Even in Europe, conditions appear to be ripe for another M&A boom. � Macro/CTA (+0.69%) with contributions from Discretionary Global Fixed Income and Global Macro
strategies. � CB arbitrage, despite the spread widening, as implied volatility went up (for HY issuers) and the
primary market saw an upsurge in converts issuance. RV Arb. performance was led by HFRI RVA: Volatility Index, which took +1.4% in May, making money from the mismatch in implied vs realized volatility
� Quantitative, trend-following, systematic CTAs, as represented by HFRX Macro: Systematic Diversified/CTA Index, were flat to negative for the period. The CTA drawdown is now over as market conditions normalized after the trend reversal we’ve seen last month.
� Global Macro and CTAs delivered strong returns over the last week, with their long position on USD (vs EUR, USD and GBP). CTAs also made money on short exposure to agri. (coffee and sugar, especially)
� April was a another bad month for Equity Market-Neutral (-0.45%)� Crowding remains a risk to Merger Arb strategy as some event names are widely held…
FinLight Research | www.finlightresearch.com

48
ALTERNATIVE STRATEGIES
� We stick to our preference for risk diversifiers (pure alpha generation strategies) over return enhancers.
� We are comfortable with our current positioning within the alternative universe, and change nothing to our strategy selection. We maintain our OW positioning on:� Equity Market Neutrals both for their “intelligent” beta and their alpha contribution. � CTA’s and Global Macro as a diversifier and tail hedge. � Vol. Arb strategy and prefer funds that trade volatility globally (all assets / all regions). This is our
way to position for a higher volatility regime.
FinLight Research | www.finlightresearch.com

49
Equity Hedge
� Equity return dispersion (cross-sectional standard deviation of S&P 500 stock returns), reachedhistorical lows in 2014, increased in late 2014 before falling again since the beginning of the year.
� Low return dispersion poses challenges to equity hedge funds as it narrows the opportunity for stock-pickers to generate alpha
� We expect equity dispersion to restart its upwards movement as more uncertainty tarnishesearnings and revenues, and the Fed starts its hiking cycle � OW Equity MN managers
FinLight Research | www.finlightresearch.com

Bottom Line: Global Asset Allocation
� After 6 years of monetary pumping and low volatility, dark clouds are now
rising on risky assets
� Actually, a perfect storm is building… It combines historically overvalued stocks
with a stretched government bond market.. Unlike previous storms (2000, 2008),
investors would be left with almost no place to hide.
� Economic news has been generally weaker than expected. The market is around all-
time highs during a very uncertain period for the global economy. And any
additional signs of economic improvement are likely to have a negative impact on
the market (this is the “good news are bad news” syndrome)
� Rising inflationary expectations are about to change the existing dynamic in
place, on interest rates, stocks, forex and commodities. We find the sell-off in bond
markets seems rational but puzzling… Nowadays, rationality appears puzzling in
such irrational markets.
� The ECB QE compression trade is exhausted.
� Greece remains the wild card, but an answer appears now closer than it has been
� Markets remain focused on reading the minds of Fed. Given the tone of the last
FOMC meeting, it seems unlikely that the Fed will raise rates in June. We still see
the first rate hike coming in Sep. meeting, when the market prices it in Dec ‘15.
� The perspective of loosing their Mr. Zero interest rate friend is already causing
portfolio managers some palpitations. We expect it, when it is effective, to
depress all asset prices for at least part of next year.
� The prospect of rising interest rates, a stronger US dollar and economic uncertainty ,
could also be a trigger for higher cross-asset volatility.
� We summarize our views as follows �
50
FinLight Research | www.finlightresearch.com

Bottom Line: Global Asset Allocation
� Historically, the mixture of rising volatility and interest rates has had a bad
effect on equity prices
� At this stage, valuation levels in equity (coupled with a deteriorating US corporate
earnings growth and a slowing productivity) and credit are high enough to make us
cautious. But we stay Neutral equities as far as our hurdles are not breached.
� We still see a solid case for further dollar strength, lower oil prices and lower
commodities.
� Maintain UW government bonds and corporate credit overall (but with an intra-
asset class preference for IG vs HY, Eurozone vs US in HY, US vs Eurozone in IG),
OW US dollar and UW commodities (especially energy and precious metals)
� Long-term investors should do like us, raise their cash holdings and wait for
better investment opportunities / entry points
� We summarize our views as follows �
51
FinLight Research | www.finlightresearch.com

52
Disclaimer
FinLight Research | www.finlightresearch.com
This writing is for informational purposes only and does not constitute an
offer to sell, a solicitation to buy, or a recommendation regarding any
securities transaction, or as an offer to provide advisory or other services
by FinLight Research in any jurisdiction in which such offer, solicitation,
purchase or sale would be unlawful under the securities laws of such
jurisdiction. The information contained in this writing should not be
construed as financial or investment advice on any subject matter.
FinLight Research expressly disclaims all liability in respect to actions
taken based on any or all of the information on this writing.

About Us…
� FinLight Research is a research-centric company focused on Asset Allocation from a top-down
perspective, on Portfolio Construction, and all related quantitative aspects and risk management issues.
� Our expertise expands along 3 axes:
� Asset Allocation with risk control and/or risk budgeting techniques
� Allocation to alternative investments : Hedge funds, rule-based strategies (momentum, value, carry, volatility), real assets (real estate, infrastructure, farmland, timberland and natural resources). Private equity and venture capital should be the next step…
� Allocation with a factorial approach built on the understanding (profiling) of the risk/return drivers of the different asset classes
� FinLight Research is an innovation-oriented company. We target to fill the gap between the academic research and the investment community, especially on real assets and alternatives. We survey on a continuous basis the academic literature for interesting published and working papers related to quantitative investing, non-linear profiling, asset allocation, real assets...
53
FinLight Research | www.finlightresearch.com

Our Standard Offer
Provide tailor-made quantitative analysis of your
portfolios in terms of asset allocation, risk profiling and risk contribution
Provide tailor-made quantitative analysis of your
portfolios in terms of asset allocation, risk profiling and risk contribution
•Risk Profiling
Offer a turnkey 3-step factor-based process in GAA
with factor selection, risk budgeting and
dynamic portfolio protection
Offer a turnkey 3-step factor-based process in GAA
with factor selection, risk budgeting and
dynamic portfolio protection
•Factor-based GAA Process
Provide assistance with alternative
investments (including real
assets) in terms of profiling, and
integration in a GAA
Provide assistance with alternative
investments (including real
assets) in terms of profiling, and
integration in a GAA
•Alternative Investments
Provide assistance with asset
allocation and related risk control
and/or risk budgeting techniques
Provide assistance with asset
allocation and related risk control
and/or risk budgeting techniques
•Global Asset Allocation (GAA)
54
FinLight Research | www.finlightresearch.com


