20
Finnair Group Financial Statements Release 1 January–31 December 2019 7 February 2020
Finnair Group Financial Statements Release 1 January–31 December 2019 7 February 2020
1
Finnair Financial Statements Release 1 January–31 December 2019* Year 2019 ended with a strong quarter; full-year comparable operating profit totalled 162.8 million euros October–December 2019
• Earnings per share were 0.17 euros (0.24). • Revenue increased by 13.4% to 774.9 million euros (683.4)**. • Unit revenue (RASK) increased by 2.5%. Unit revenue at constant currency increased by
1.8%. • Unit cost (CASK) increased by 2.3%. Unit cost at constant currency excluding fuel increased
by 1.3%. • Fuel costs increased by 26.0 million euros (+17.9%) of which the impact of fuel price*** was
12 million euros. • Comparable operating result was 31.2 million euros (26.5). Operating result was 34.7 million
euros (73.1). • Net cash flow from operating activities was 120.1 million euros (68.3), and net cash flow from
investing activities was -185.7 million euros (-51.5).**** • Number of passengers increased by 11.0% to 3.5 million (3.2). • Available seat kilometres (ASK) grew by 10.6%. • Passenger load factor (PLF) was 79.0% (+2.1 points).
January–December 2019
• Earnings per share were 0.49 euros (0.70). • Revenue increased by 9.2% to 3,097.7 million euros (2,836.1)**. • Unit revenue (RASK) decreased by 1.9%. Unit revenue at constant currency decreased by
2.4%. • Unit cost (CASK) increased by 0.7%. Unit cost at constant currency excluding fuel decreased
by 1.2%. • Fuel costs increased by 106.3 million euros (+18.3%) of which the impact of fuel price*** was
42 million euros. • Comparable operating result was 162.8 million euros (218.4). Operating result was 160.0
million euros (256.3). • Net cash flow from operating activities was 564.5 million euros (503.6), and net cash flow
from investing activities was -513.2 million euros (-202.6).**** • Number of passengers increased by 10.3% to 14.7 million (13.3). • Available seat kilometres (ASK) grew by 11.3%. • Passenger load factor (PLF) was 81.7% (-0.1 points). • The Board of Directors proposes to the Annual General Meeting that a dividend of 0.20 euros
per share be distributed for 2019.
* Quarterly and full-year figures for 2018 have been restated to reflect the adoption of the IFRS 16 standard, changes in accounting principles relating to aircraft components and the changes in the presentation of profit and loss, balance sheet and cash flow statements. The restated figures were published on 21 March 2019. In addition, IFRS interpretation committee (IFRIC) concluded in its meeting in September 2019 that customer (passenger) compensations related to delayed or cancelled flights need to be treated as deductions of revenue instead of passenger and handling costs. Due to this, Finnair has made a decision to apply the change retrospectively for quarterly and full-year figures for 2018 and 2019 in order for the years to be comparable. More information on the restatement is available in Note 20.

2
** Unless otherwise stated, comparisons and figures in parentheses refer to the comparison period, i.e. the same period last year.
*** Fuel price including impact of currencies and hedging. **** In Q4, net cash flow from investing activities includes 59.7 million euros of investments in money market
funds or other financial assets maturing after more than three months. In 2019, these increased in net terms by 53.4 million euros. These investments are part of the Group’s liquidity management.
Outlook Guidance on 7 February 2020: We are currently seeing strong performance continuing in Europe. As stated earlier, the direct financial impact of coronavirus during Q1 2020 is relatively limited, even if the mainland China cancellations continued until end of Q1 2020. We currently forecast our capacity to increase by approximately 4 per cent in 2020. Due to the situation with coronavirus, we do not provide a full year revenue estimate at this time. The guidance will be updated in connection to Q1 2020 interim report. CEO Topi Manner: Year 2019 was a year of rapid growth. In addition to that, it stood out due to our fantastic, and highly committed personnel. We have now moved to a new phase of sustainable, profitable growth covering the years 2020-2025. The year 2019 was characterised by an unstable operating environment due to slower economic growth in our main markets as well as uncertainties in world trade. As a result, year 2019 was a volatile one for us but it ended with a strong quarter as the market situation improved: I was particularly happy with the strength of our European traffic and the improving unit revenues. With capacity growth of 11.3 per cent in passenger traffic and an increase of 10.3 per cent in passenger volume, we reached a new all-time high of 14.7 million passengers, leading to 9.2 per cent growth in revenue. Our revenue for the year amounted to 3.1 billion euros and our comparable operating result for the full year was 162.8 million euros, down from 218.4 million euros in the previous year primarily due to changes in fuel price. A central objective for sustainable, profitable growth is to grow cost-effectively, allowing us to maintain our healthy balance sheet and cash flow while carrying out significant investments of approximately 3.5–4.0 billion euros to substantially reduce our emissions and enable profitable growth. Above all, the investments are aimed at the renewal of our narrow-body fleet to make it more fuel-efficient, economic and environmentally friendly. This represents a significant step towards our long-term goal of carbon neutrality. During my first year as the CEO, I have been pleased to see how passionate our customers and employees are about Finnair. This provides an ideal foundation for the implementation of our new strategy. I want to take this opportunity to thank our shareholders and customers for their trust in Finnair. I am also grateful to everyone at Finnair for their strong commitment and hard work in 2019. Business environment in Q4 Traffic grew in Finnair’s main markets, routes between Asia and Europe. The continuing impact of global uncertainties, such as Brexit and the US-China trade war, was reflected mostly in our cargo operations in Q4 Competitors’ capacity reductions, especially on some Nordic routes and from Finland to the Mediterranean, had a beneficial effect on the competitive situation in European traffic. Measured in available seat kilometres, scheduled market capacity between origin Helsinki and Finnair’s European destinations decreased by 2.1 per cent (17.3). Demand developed well in Asia-Europe transfer traffic
3
and in intra-European and point-to-point traffic. In European traffic, Finnair’s market share increased to 60.8 per cent (56.1).1 Direct market capacity between Finnair’s Asian and European destinations grew by 1.6 per cent (7.4) year-on-year. Market capacity grew especially between Europe and Mainland China, whereas Finnair’s capacity growth was focused on Greater China and Bangkok routes. Demand from Europe to certain Asian destinations, especially to Hong Kong, softened during the period. In Asian traffic, Finnair’s market share increased to 6.1 per cent (5.8).2 Finnair engages in closer cooperation with certain oneworld partners through participation in joint businesses, namely the Siberian Joint Business (SJB) on flights between Europe and Japan, and the Atlantic Joint Businesses (AJB) on flights between Europe and North America. Joint businesses strengthen Finnair’s market position, reduce the risks related to growth and make a significant contribution to Finnair’s revenue. For customers, they provide more route and pricing options whereas for airlines, joint businesses are a way to gain benefits typically associated with consolidation. In both joint businesses, revenue growth was close to capacity growth in Q4, resulting in good development within the joint business traffic. In Finland, customer demand for travel services returned to a normal level during the fourth quarter after low demand in 2018. Decreased market offering of allotment-based package holidays together with the growing demand positively affected the travel services result. Demand both for dynamic package holidays and outside the Finnish capital area is likely to continue to grow. The ongoing global air freight market pressure continued in Q4, decreasing industry freight volumes and yields. The weakening demand also clearly suppressed Finnair’s cargo revenue. Market softness was visible particularly in Finnair’s key cargo markets in Asia. Finnair's global cargo volumes continued to grow year-on-year driven by the capacity increase, but the load factor decreased. In addition, the Q4 performance was strongly impacted by the postal and support strikes in Finland which took place in November. The US dollar, which is the most significant expense currency for Finnair after the euro, appreciated by 3.0 per cent against the euro year-on-year. With regard to key income currencies, the Japanese yen was 6.5 per cent stronger against the euro than in the comparison period. The Chinese yuan appreciated by 1.2 per cent against the euro. The market price of jet fuel was 7.2 per cent lower in the fourth quarter than in the comparison period, but this decline does not fully impact Finnair’s Q4 fuel costs due to its hedging policy. Finnair hedges its fuel purchases and key foreign currency items; hence, market fluctuations are not reflected directly in its result. Finnair’s Q4 fuel bill was approximately 18 per cent higher than in the comparison period, and capacity growth explains roughly half of this increase. Financial performance in Q4 Revenue in Q4 Finnair revenue grew by 13.4 per cent to 774.9 million euros (683.4). Passenger revenue grew by 16.0 per cent, ancillary revenue by 13.6 per cent and travel services revenue by 7.5 per cent. Cargo revenue decreased by 4.6 per cent. Unit revenue (RASK) increased by 2.5 per cent and amounted to 6.69 euro cents (6.53). The unit revenue at constant currency increased by 1.8 per cent. RASK increase was supported by excellent performance in European and domestic traffic as well as improved travel services performance mainly due to capacity reductions. On the other hand, cargo provided soft yields.
1 Based on external sources (capacity data from SRS Analyser and market share data based on DDS passenger volume estimates for October and November 2019). The basis for calculation is Finnair’s non-seasonal destinations. 2 Based on external sources (capacity data from SRS Analyser and market share data based on DDS passenger volume estimates for October and November 2019). The basis for calculation is Finnair’s non-seasonal destinations.
4
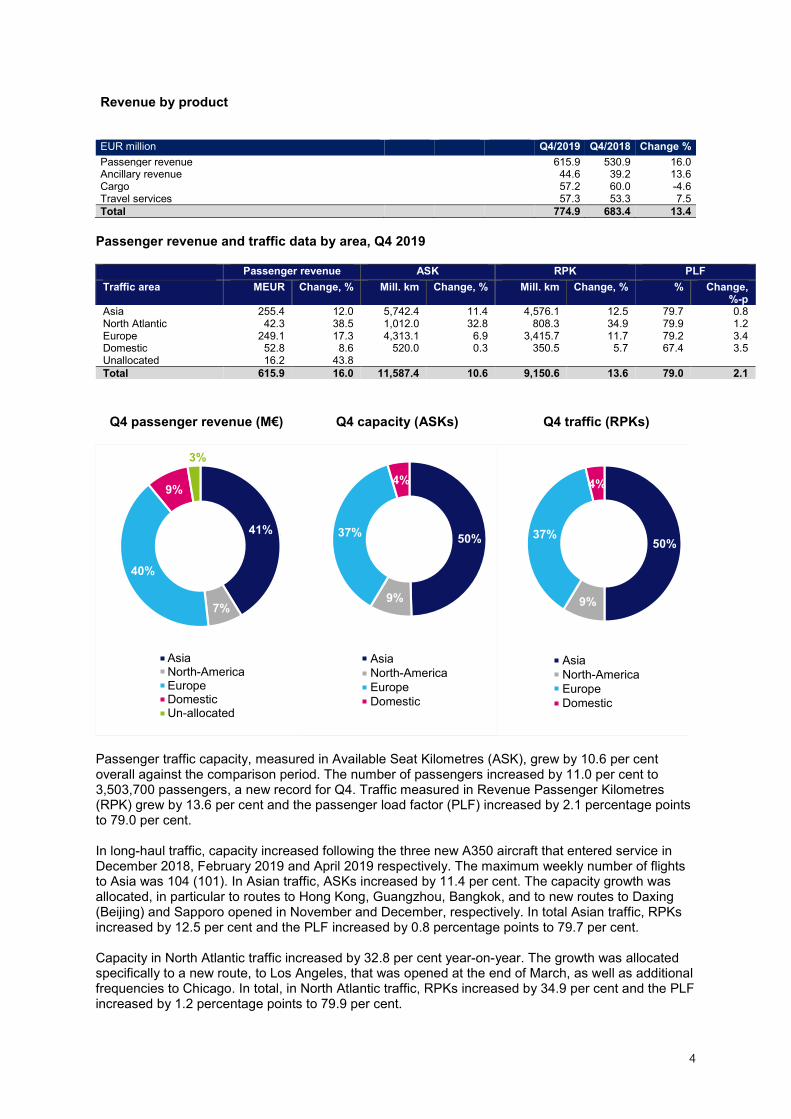
Revenue by product EUR million Q4/2019 Q4/2018 Change % Passenger revenue 615.9 530.9 16.0 Ancillary revenue 44.6 39.2 13.6 Cargo 57.2 60.0 -4.6 Travel services 57.3 53.3 7.5 Total 774.9 683.4 13.4
Passenger revenue and traffic data by area, Q4 2019 Passenger revenue ASK RPK PLF Traffic area MEUR Change, % Mill. km Change, % Mill. km Change, % % Change,
%-p Asia 255.4 12.0 5,742.4 11.4 4,576.1 12.5 79.7 0.8 North Atlantic 42.3 38.5 1,012.0 32.8 808.3 34.9 79.9 1.2 Europe 249.1 17.3 4,313.1 6.9 3,415.7 11.7 79.2 3.4 Domestic 52.8 8.6 520.0 0.3 350.5 5.7 67.4 3.5 Unallocated 16.2 43.8 Total 615.9 16.0 11,587.4 10.6 9,150.6 13.6 79.0 2.1
Q4 passenger revenue (M€) Q4 capacity (ASKs) Q4 traffic (RPKs)
Passenger traffic capacity, measured in Available Seat Kilometres (ASK), grew by 10.6 per cent overall against the comparison period. The number of passengers increased by 11.0 per cent to 3,503,700 passengers, a new record for Q4. Traffic measured in Revenue Passenger Kilometres (RPK) grew by 13.6 per cent and the passenger load factor (PLF) increased by 2.1 percentage points to 79.0 per cent. In long-haul traffic, capacity increased following the three new A350 aircraft that entered service in December 2018, February 2019 and April 2019 respectively. The maximum weekly number of flights to Asia was 104 (101). In Asian traffic, ASKs increased by 11.4 per cent. The capacity growth was allocated, in particular to routes to Hong Kong, Guangzhou, Bangkok, and to new routes to Daxing (Beijing) and Sapporo opened in November and December, respectively. In total Asian traffic, RPKs increased by 12.5 per cent and the PLF increased by 0.8 percentage points to 79.7 per cent. Capacity in North Atlantic traffic increased by 32.8 per cent year-on-year. The growth was allocated specifically to a new route, to Los Angeles, that was opened at the end of March, as well as additional frequencies to Chicago. In total, in North Atlantic traffic, RPKs increased by 34.9 per cent and the PLF increased by 1.2 percentage points to 79.9 per cent.
41%
7%
40%
9%
3%
AsiaNorth-AmericaEuropeDomesticUn-allocated
50%
9%
37%
4%
AsiaNorth-AmericaEuropeDomestic
50%
9%
37%
4%
AsiaNorth-AmericaEuropeDomestic
5
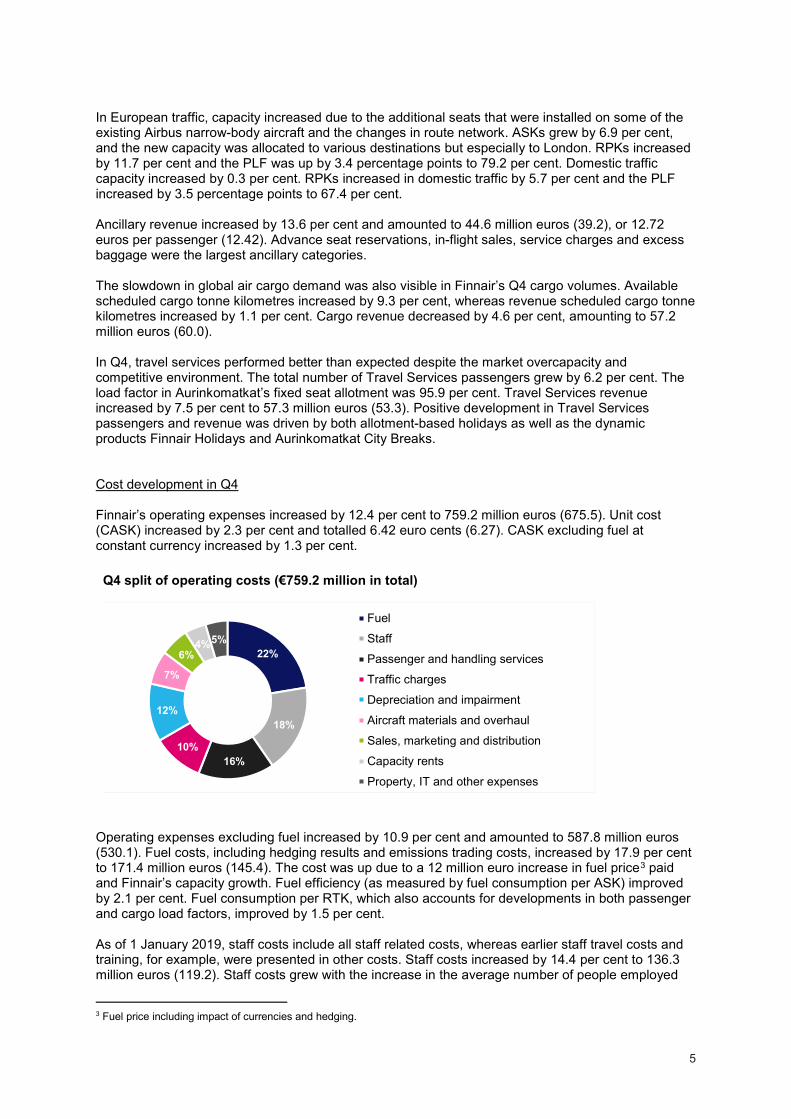
In European traffic, capacity increased due to the additional seats that were installed on some of the existing Airbus narrow-body aircraft and the changes in route network. ASKs grew by 6.9 per cent, and the new capacity was allocated to various destinations but especially to London. RPKs increased by 11.7 per cent and the PLF was up by 3.4 percentage points to 79.2 per cent. Domestic traffic capacity increased by 0.3 per cent. RPKs increased in domestic traffic by 5.7 per cent and the PLF increased by 3.5 percentage points to 67.4 per cent. Ancillary revenue increased by 13.6 per cent and amounted to 44.6 million euros (39.2), or 12.72 euros per passenger (12.42). Advance seat reservations, in-flight sales, service charges and excess baggage were the largest ancillary categories. The slowdown in global air cargo demand was also visible in Finnair’s Q4 cargo volumes. Available scheduled cargo tonne kilometres increased by 9.3 per cent, whereas revenue scheduled cargo tonne kilometres increased by 1.1 per cent. Cargo revenue decreased by 4.6 per cent, amounting to 57.2 million euros (60.0). In Q4, travel services performed better than expected despite the market overcapacity and competitive environment. The total number of Travel Services passengers grew by 6.2 per cent. The load factor in Aurinkomatkat’s fixed seat allotment was 95.9 per cent. Travel Services revenue increased by 7.5 per cent to 57.3 million euros (53.3). Positive development in Travel Services passengers and revenue was driven by both allotment-based holidays as well as the dynamic products Finnair Holidays and Aurinkomatkat City Breaks. Cost development in Q4 Finnair’s operating expenses increased by 12.4 per cent to 759.2 million euros (675.5). Unit cost (CASK) increased by 2.3 per cent and totalled 6.42 euro cents (6.27). CASK excluding fuel at constant currency increased by 1.3 per cent. Q4 split of operating costs (€759.2 million in total)
Operating expenses excluding fuel increased by 10.9 per cent and amounted to 587.8 million euros (530.1). Fuel costs, including hedging results and emissions trading costs, increased by 17.9 per cent to 171.4 million euros (145.4). The cost was up due to a 12 million euro increase in fuel price3 paid and Finnair’s capacity growth. Fuel efficiency (as measured by fuel consumption per ASK) improved by 2.1 per cent. Fuel consumption per RTK, which also accounts for developments in both passenger and cargo load factors, improved by 1.5 per cent. As of 1 January 2019, staff costs include all staff related costs, whereas earlier staff travel costs and training, for example, were presented in other costs. Staff costs increased by 14.4 per cent to 136.3 million euros (119.2). Staff costs grew with the increase in the average number of people employed
3 Fuel price including impact of currencies and hedging.
22%
18%
16%10%
12%
7%
6%4%5%
Fuel
Staff
Passenger and handling services
Traffic charges
Depreciation and impairment
Aircraft materials and overhaul
Sales, marketing and distribution
Capacity rents
Property, IT and other expenses
6
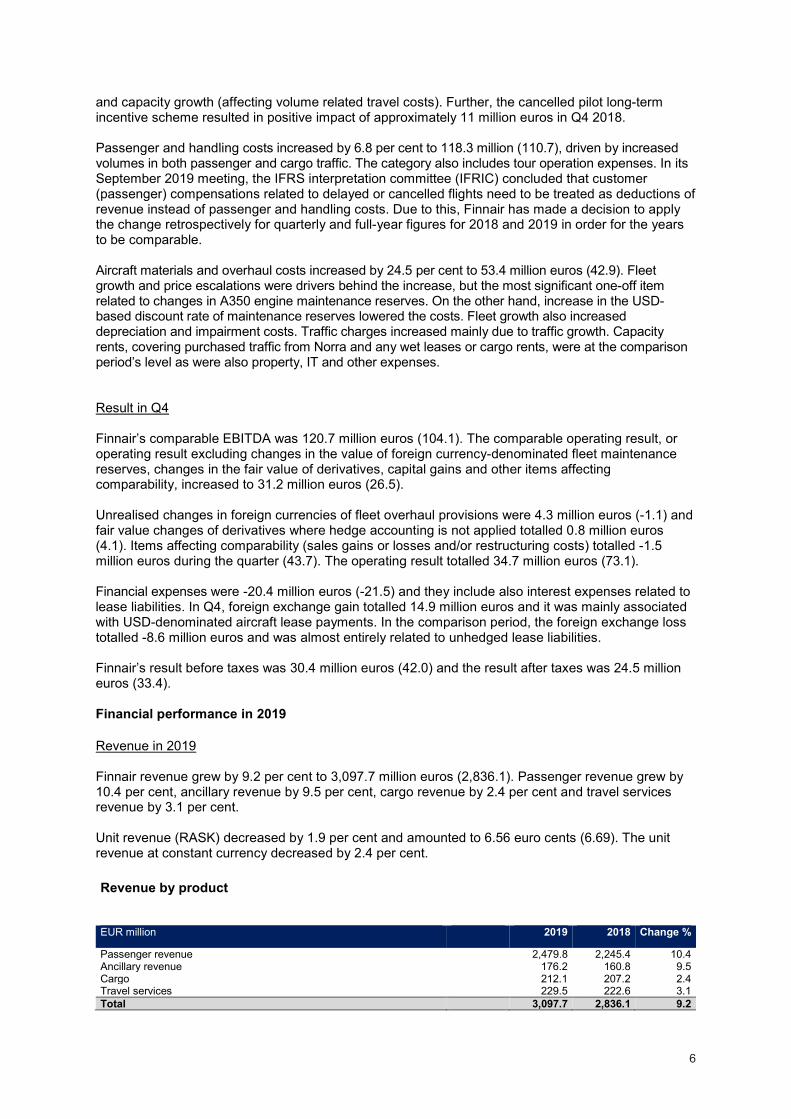
and capacity growth (affecting volume related travel costs). Further, the cancelled pilot long-term incentive scheme resulted in positive impact of approximately 11 million euros in Q4 2018. Passenger and handling costs increased by 6.8 per cent to 118.3 million (110.7), driven by increased volumes in both passenger and cargo traffic. The category also includes tour operation expenses. In its September 2019 meeting, the IFRS interpretation committee (IFRIC) concluded that customer (passenger) compensations related to delayed or cancelled flights need to be treated as deductions of revenue instead of passenger and handling costs. Due to this, Finnair has made a decision to apply the change retrospectively for quarterly and full-year figures for 2018 and 2019 in order for the years to be comparable. Aircraft materials and overhaul costs increased by 24.5 per cent to 53.4 million euros (42.9). Fleet growth and price escalations were drivers behind the increase, but the most significant one-off item related to changes in A350 engine maintenance reserves. On the other hand, increase in the USD-based discount rate of maintenance reserves lowered the costs. Fleet growth also increased depreciation and impairment costs. Traffic charges increased mainly due to traffic growth. Capacity rents, covering purchased traffic from Norra and any wet leases or cargo rents, were at the comparison period’s level as were also property, IT and other expenses. Result in Q4 Finnair’s comparable EBITDA was 120.7 million euros (104.1). The comparable operating result, or operating result excluding changes in the value of foreign currency-denominated fleet maintenance reserves, changes in the fair value of derivatives, capital gains and other items affecting comparability, increased to 31.2 million euros (26.5). Unrealised changes in foreign currencies of fleet overhaul provisions were 4.3 million euros (-1.1) and fair value changes of derivatives where hedge accounting is not applied totalled 0.8 million euros (4.1). Items affecting comparability (sales gains or losses and/or restructuring costs) totalled -1.5 million euros during the quarter (43.7). The operating result totalled 34.7 million euros (73.1). Financial expenses were -20.4 million euros (-21.5) and they include also interest expenses related to lease liabilities. In Q4, foreign exchange gain totalled 14.9 million euros and it was mainly associated with USD-denominated aircraft lease payments. In the comparison period, the foreign exchange loss totalled -8.6 million euros and was almost entirely related to unhedged lease liabilities. Finnair’s result before taxes was 30.4 million euros (42.0) and the result after taxes was 24.5 million euros (33.4). Financial performance in 2019 Revenue in 2019 Finnair revenue grew by 9.2 per cent to 3,097.7 million euros (2,836.1). Passenger revenue grew by 10.4 per cent, ancillary revenue by 9.5 per cent, cargo revenue by 2.4 per cent and travel services revenue by 3.1 per cent. Unit revenue (RASK) decreased by 1.9 per cent and amounted to 6.56 euro cents (6.69). The unit revenue at constant currency decreased by 2.4 per cent. Revenue by product
EUR million 2019 2018 Change % Passenger revenue 2,479.8 2,245.4 10.4 Ancillary revenue 176.2 160.8 9.5 Cargo 212.1 207.2 2.4 Travel services 229.5 222.6 3.1 Total 3,097.7 2,836.1 9.2
7
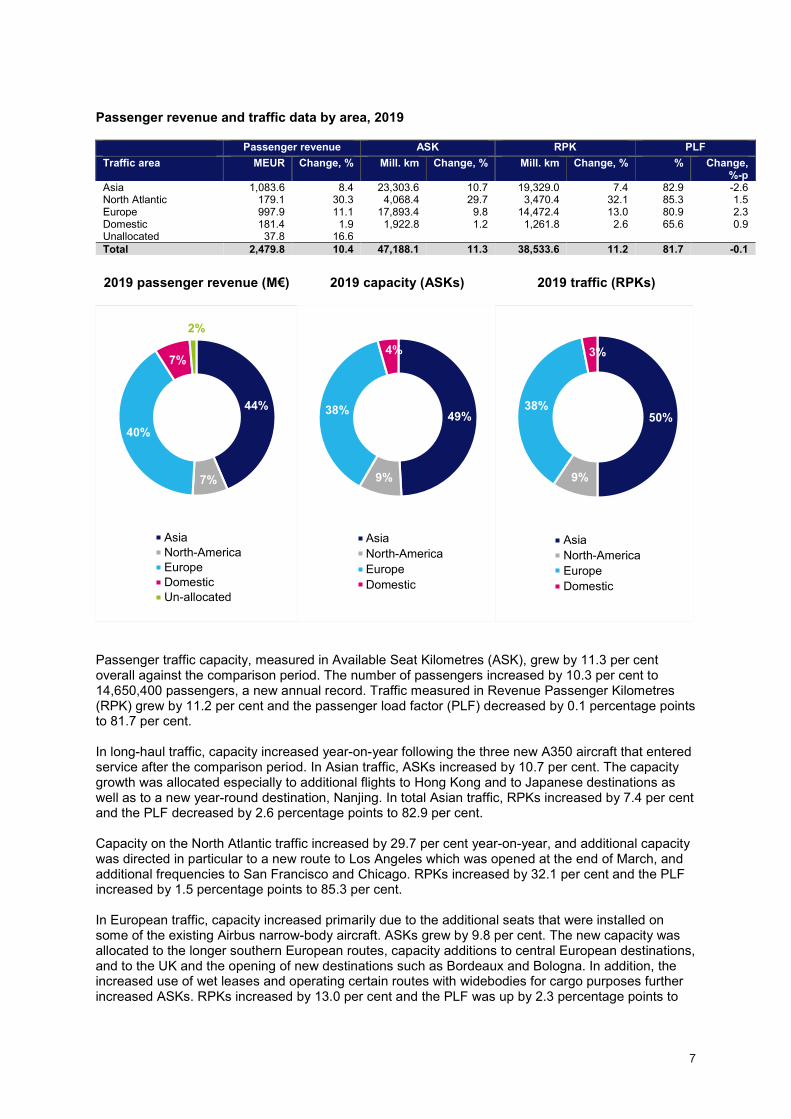
Passenger revenue and traffic data by area, 2019 Passenger revenue ASK RPK PLF Traffic area MEUR Change, % Mill. km Change, % Mill. km Change, % % Change,
%-p Asia 1,083.6 8.4 23,303.6 10.7 19,329.0 7.4 82.9 -2.6 North Atlantic 179.1 30.3 4,068.4 29.7 3,470.4 32.1 85.3 1.5 Europe 997.9 11.1 17,893.4 9.8 14,472.4 13.0 80.9 2.3 Domestic 181.4 1.9 1,922.8 1.2 1,261.8 2.6 65.6 0.9 Unallocated 37.8 16.6 Total 2,479.8 10.4 47,188.1 11.3 38,533.6 11.2 81.7 -0.1
2019 passenger revenue (M€) 2019 capacity (ASKs) 2019 traffic (RPKs)
Passenger traffic capacity, measured in Available Seat Kilometres (ASK), grew by 11.3 per cent overall against the comparison period. The number of passengers increased by 10.3 per cent to 14,650,400 passengers, a new annual record. Traffic measured in Revenue Passenger Kilometres (RPK) grew by 11.2 per cent and the passenger load factor (PLF) decreased by 0.1 percentage points to 81.7 per cent. In long-haul traffic, capacity increased year-on-year following the three new A350 aircraft that entered service after the comparison period. In Asian traffic, ASKs increased by 10.7 per cent. The capacity growth was allocated especially to additional flights to Hong Kong and to Japanese destinations as well as to a new year-round destination, Nanjing. In total Asian traffic, RPKs increased by 7.4 per cent and the PLF decreased by 2.6 percentage points to 82.9 per cent. Capacity on the North Atlantic traffic increased by 29.7 per cent year-on-year, and additional capacity was directed in particular to a new route to Los Angeles which was opened at the end of March, and additional frequencies to San Francisco and Chicago. RPKs increased by 32.1 per cent and the PLF increased by 1.5 percentage points to 85.3 per cent. In European traffic, capacity increased primarily due to the additional seats that were installed on some of the existing Airbus narrow-body aircraft. ASKs grew by 9.8 per cent. The new capacity was allocated to the longer southern European routes, capacity additions to central European destinations, and to the UK and the opening of new destinations such as Bordeaux and Bologna. In addition, the increased use of wet leases and operating certain routes with widebodies for cargo purposes further increased ASKs. RPKs increased by 13.0 per cent and the PLF was up by 2.3 percentage points to
44%
7%
40%
7%
2%
AsiaNorth-AmericaEuropeDomesticUn-allocated
49%
9%
38%
4%
AsiaNorth-AmericaEuropeDomestic
50%
9%
38%
3%
AsiaNorth-AmericaEuropeDomestic
8
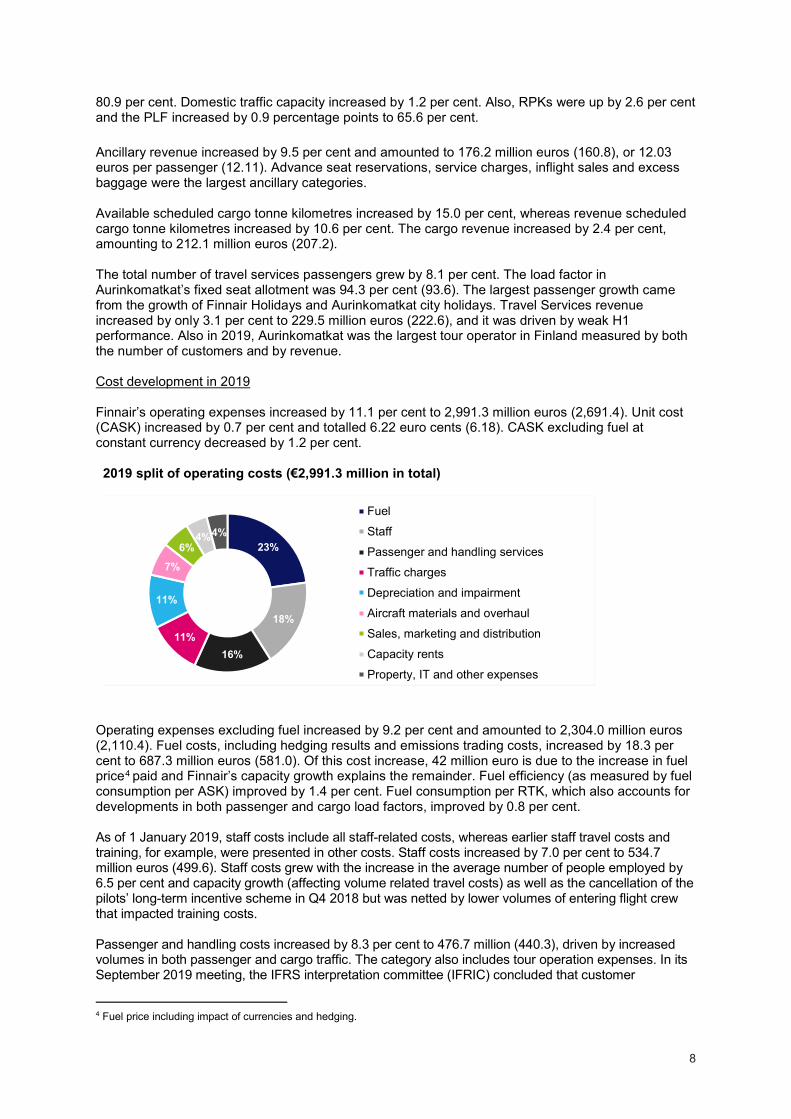
80.9 per cent. Domestic traffic capacity increased by 1.2 per cent. Also, RPKs were up by 2.6 per cent and the PLF increased by 0.9 percentage points to 65.6 per cent. Ancillary revenue increased by 9.5 per cent and amounted to 176.2 million euros (160.8), or 12.03 euros per passenger (12.11). Advance seat reservations, service charges, inflight sales and excess baggage were the largest ancillary categories. Available scheduled cargo tonne kilometres increased by 15.0 per cent, whereas revenue scheduled cargo tonne kilometres increased by 10.6 per cent. The cargo revenue increased by 2.4 per cent, amounting to 212.1 million euros (207.2). The total number of travel services passengers grew by 8.1 per cent. The load factor in Aurinkomatkat’s fixed seat allotment was 94.3 per cent (93.6). The largest passenger growth came from the growth of Finnair Holidays and Aurinkomatkat city holidays. Travel Services revenue increased by only 3.1 per cent to 229.5 million euros (222.6), and it was driven by weak H1 performance. Also in 2019, Aurinkomatkat was the largest tour operator in Finland measured by both the number of customers and by revenue. Cost development in 2019 Finnair’s operating expenses increased by 11.1 per cent to 2,991.3 million euros (2,691.4). Unit cost (CASK) increased by 0.7 per cent and totalled 6.22 euro cents (6.18). CASK excluding fuel at constant currency decreased by 1.2 per cent. 2019 split of operating costs (€2,991.3 million in total)
Operating expenses excluding fuel increased by 9.2 per cent and amounted to 2,304.0 million euros (2,110.4). Fuel costs, including hedging results and emissions trading costs, increased by 18.3 per cent to 687.3 million euros (581.0). Of this cost increase, 42 million euro is due to the increase in fuel price4 paid and Finnair’s capacity growth explains the remainder. Fuel efficiency (as measured by fuel consumption per ASK) improved by 1.4 per cent. Fuel consumption per RTK, which also accounts for developments in both passenger and cargo load factors, improved by 0.8 per cent. As of 1 January 2019, staff costs include all staff-related costs, whereas earlier staff travel costs and training, for example, were presented in other costs. Staff costs increased by 7.0 per cent to 534.7 million euros (499.6). Staff costs grew with the increase in the average number of people employed by 6.5 per cent and capacity growth (affecting volume related travel costs) as well as the cancellation of the pilots’ long-term incentive scheme in Q4 2018 but was netted by lower volumes of entering flight crew that impacted training costs. Passenger and handling costs increased by 8.3 per cent to 476.7 million (440.3), driven by increased volumes in both passenger and cargo traffic. The category also includes tour operation expenses. In its September 2019 meeting, the IFRS interpretation committee (IFRIC) concluded that customer
4 Fuel price including impact of currencies and hedging.
23%
18%
16%11%
11%
7%
6%4%4%
Fuel
Staff
Passenger and handling services
Traffic charges
Depreciation and impairment
Aircraft materials and overhaul
Sales, marketing and distribution
Capacity rents
Property, IT and other expenses
9
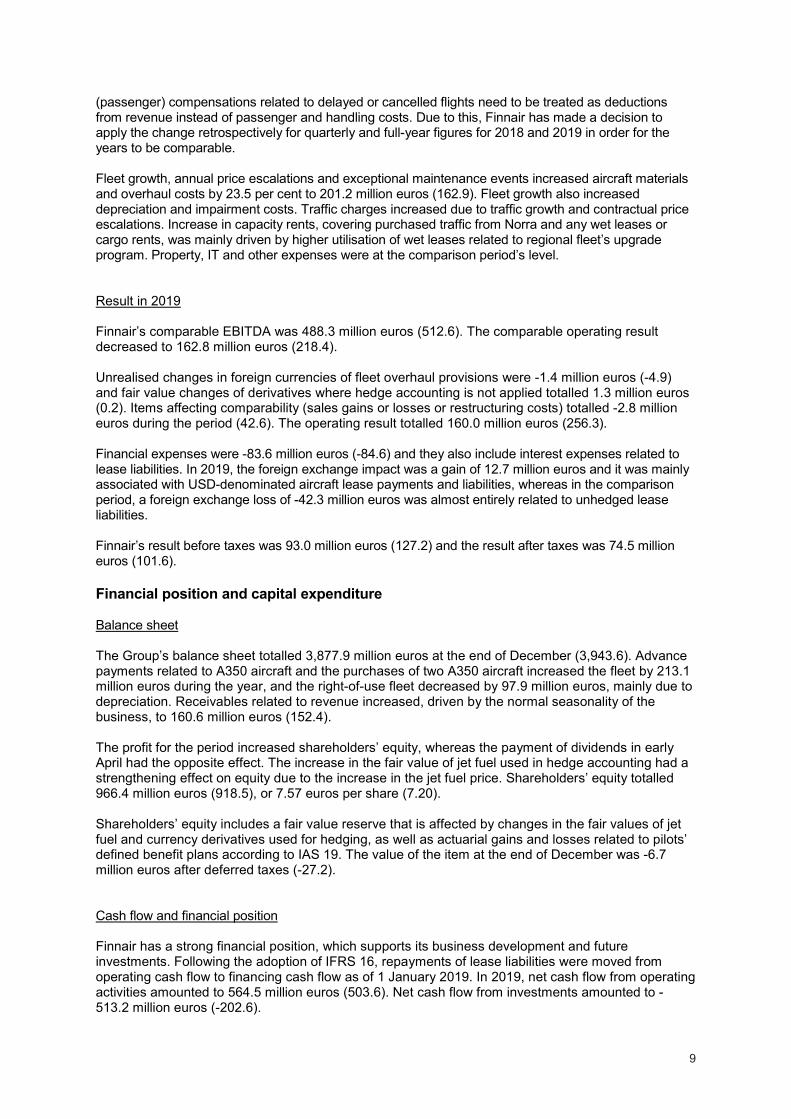
(passenger) compensations related to delayed or cancelled flights need to be treated as deductions from revenue instead of passenger and handling costs. Due to this, Finnair has made a decision to apply the change retrospectively for quarterly and full-year figures for 2018 and 2019 in order for the years to be comparable. Fleet growth, annual price escalations and exceptional maintenance events increased aircraft materials and overhaul costs by 23.5 per cent to 201.2 million euros (162.9). Fleet growth also increased depreciation and impairment costs. Traffic charges increased due to traffic growth and contractual price escalations. Increase in capacity rents, covering purchased traffic from Norra and any wet leases or cargo rents, was mainly driven by higher utilisation of wet leases related to regional fleet’s upgrade program. Property, IT and other expenses were at the comparison period’s level. Result in 2019 Finnair’s comparable EBITDA was 488.3 million euros (512.6). The comparable operating result decreased to 162.8 million euros (218.4). Unrealised changes in foreign currencies of fleet overhaul provisions were -1.4 million euros (-4.9) and fair value changes of derivatives where hedge accounting is not applied totalled 1.3 million euros (0.2). Items affecting comparability (sales gains or losses or restructuring costs) totalled -2.8 million euros during the period (42.6). The operating result totalled 160.0 million euros (256.3). Financial expenses were -83.6 million euros (-84.6) and they also include interest expenses related to lease liabilities. In 2019, the foreign exchange impact was a gain of 12.7 million euros and it was mainly associated with USD-denominated aircraft lease payments and liabilities, whereas in the comparison period, a foreign exchange loss of -42.3 million euros was almost entirely related to unhedged lease liabilities. Finnair’s result before taxes was 93.0 million euros (127.2) and the result after taxes was 74.5 million euros (101.6). Financial position and capital expenditure Balance sheet The Group’s balance sheet totalled 3,877.9 million euros at the end of December (3,943.6). Advance payments related to A350 aircraft and the purchases of two A350 aircraft increased the fleet by 213.1 million euros during the year, and the right-of-use fleet decreased by 97.9 million euros, mainly due to depreciation. Receivables related to revenue increased, driven by the normal seasonality of the business, to 160.6 million euros (152.4). The profit for the period increased shareholders’ equity, whereas the payment of dividends in early April had the opposite effect. The increase in the fair value of jet fuel used in hedge accounting had a strengthening effect on equity due to the increase in the jet fuel price. Shareholders’ equity totalled 966.4 million euros (918.5), or 7.57 euros per share (7.20). Shareholders’ equity includes a fair value reserve that is affected by changes in the fair values of jet fuel and currency derivatives used for hedging, as well as actuarial gains and losses related to pilots’ defined benefit plans according to IAS 19. The value of the item at the end of December was -6.7 million euros after deferred taxes (-27.2). Cash flow and financial position Finnair has a strong financial position, which supports its business development and future investments. Following the adoption of IFRS 16, repayments of lease liabilities were moved from operating cash flow to financing cash flow as of 1 January 2019. In 2019, net cash flow from operating activities amounted to 564.5 million euros (503.6). Net cash flow from investments amounted to -513.2 million euros (-202.6).
10
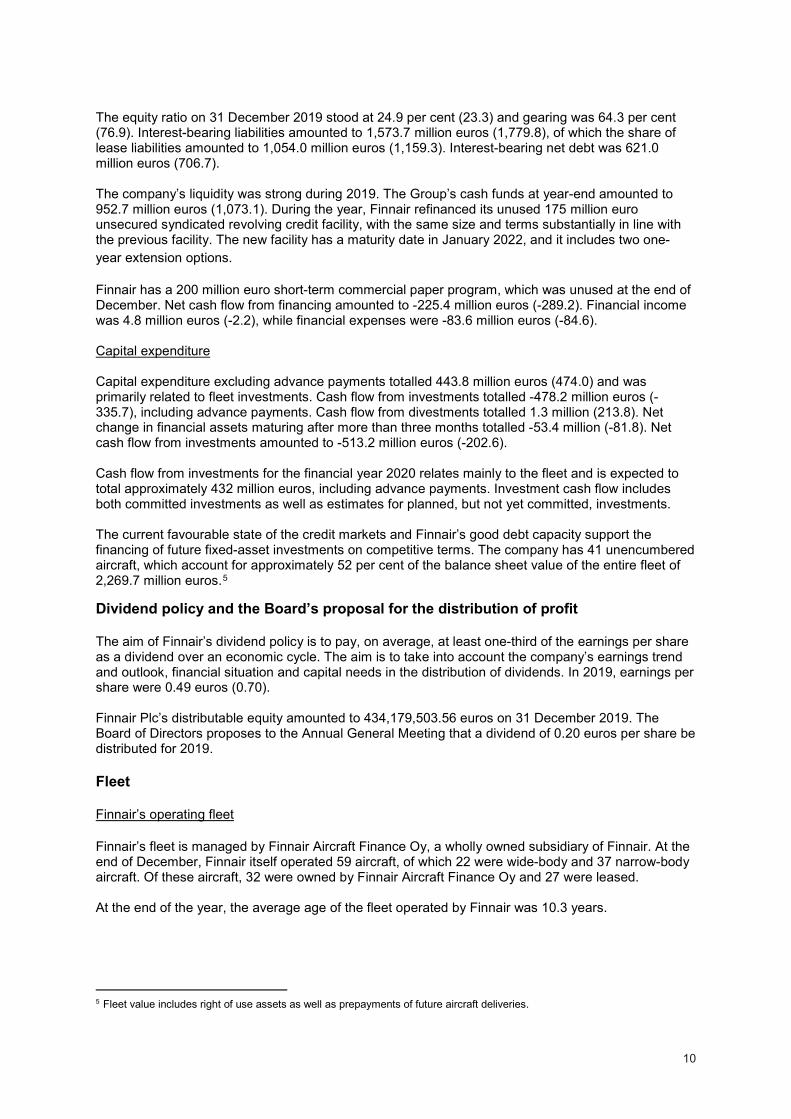
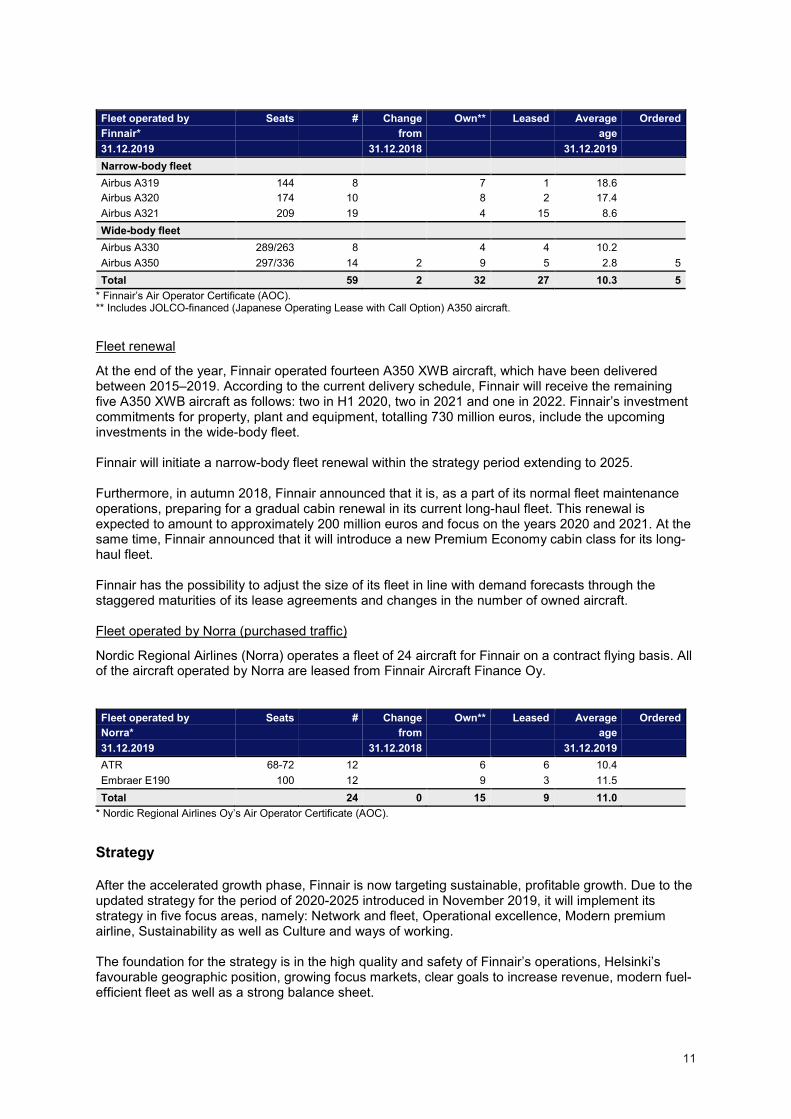
The equity ratio on 31 December 2019 stood at 24.9 per cent (23.3) and gearing was 64.3 per cent (76.9). Interest-bearing liabilities amounted to 1,573.7 million euros (1,779.8), of which the share of lease liabilities amounted to 1,054.0 million euros (1,159.3). Interest-bearing net debt was 621.0 million euros (706.7). The company’s liquidity was strong during 2019. The Group’s cash funds at year-end amounted to 952.7 million euros (1,073.1). During the year, Finnair refinanced its unused 175 million euro unsecured syndicated revolving credit facility, with the same size and terms substantially in line with the previous facility. The new facility has a maturity date in January 2022, and it includes two one-year extension options. Finnair has a 200 million euro short-term commercial paper program, which was unused at the end of December. Net cash flow from financing amounted to -225.4 million euros (-289.2). Financial income was 4.8 million euros (-2.2), while financial expenses were -83.6 million euros (-84.6). Capital expenditure Capital expenditure excluding advance payments totalled 443.8 million euros (474.0) and was primarily related to fleet investments. Cash flow from investments totalled -478.2 million euros (-335.7), including advance payments. Cash flow from divestments totalled 1.3 million (213.8). Net change in financial assets maturing after more than three months totalled -53.4 million (-81.8). Net cash flow from investments amounted to -513.2 million euros (-202.6). Cash flow from investments for the financial year 2020 relates mainly to the fleet and is expected to total approximately 432 million euros, including advance payments. Investment cash flow includes both committed investments as well as estimates for planned, but not yet committed, investments. The current favourable state of the credit markets and Finnair’s good debt capacity support the financing of future fixed-asset investments on competitive terms. The company has 41 unencumbered aircraft, which account for approximately 52 per cent of the balance sheet value of the entire fleet of 2,269.7 million euros.5 Dividend policy and the Board’s proposal for the distribution of profit The aim of Finnair’s dividend policy is to pay, on average, at least one-third of the earnings per share as a dividend over an economic cycle. The aim is to take into account the company’s earnings trend and outlook, financial situation and capital needs in the distribution of dividends. In 2019, earnings per share were 0.49 euros (0.70). Finnair Plc’s distributable equity amounted to 434,179,503.56 euros on 31 December 2019. The Board of Directors proposes to the Annual General Meeting that a dividend of 0.20 euros per share be distributed for 2019. Fleet Finnair’s operating fleet Finnair’s fleet is managed by Finnair Aircraft Finance Oy, a wholly owned subsidiary of Finnair. At the end of December, Finnair itself operated 59 aircraft, of which 22 were wide-body and 37 narrow-body aircraft. Of these aircraft, 32 were owned by Finnair Aircraft Finance Oy and 27 were leased. At the end of the year, the average age of the fleet operated by Finnair was 10.3 years. 5 Fleet value includes right of use assets as well as prepayments of future aircraft deliveries.
11
Fleet operated by Seats # Change Own** Leased Average Ordered Finnair* from age 31.12.2019 31.12.2018 31.12.2019 Narrow-body fleet Airbus A319 144 8 7 1 18.6
Airbus A320 174 10 8 2 17.4
Airbus A321 209 19 4 15 8.6 Wide-body fleet Airbus A330 289/263 8 4 4 10.2
Airbus A350 297/336 14 2 9 5 2.8 5 Total 59 2 32 27 10.3 5
* Finnair’s Air Operator Certificate (AOC). ** Includes JOLCO-financed (Japanese Operating Lease with Call Option) A350 aircraft.
Fleet renewal
At the end of the year, Finnair operated fourteen A350 XWB aircraft, which have been delivered between 2015–2019. According to the current delivery schedule, Finnair will receive the remaining five A350 XWB aircraft as follows: two in H1 2020, two in 2021 and one in 2022. Finnair’s investment commitments for property, plant and equipment, totalling 730 million euros, include the upcoming investments in the wide-body fleet. Finnair will initiate a narrow-body fleet renewal within the strategy period extending to 2025. Furthermore, in autumn 2018, Finnair announced that it is, as a part of its normal fleet maintenance operations, preparing for a gradual cabin renewal in its current long-haul fleet. This renewal is expected to amount to approximately 200 million euros and focus on the years 2020 and 2021. At the same time, Finnair announced that it will introduce a new Premium Economy cabin class for its long-haul fleet. Finnair has the possibility to adjust the size of its fleet in line with demand forecasts through the staggered maturities of its lease agreements and changes in the number of owned aircraft. Fleet operated by Norra (purchased traffic)
Nordic Regional Airlines (Norra) operates a fleet of 24 aircraft for Finnair on a contract flying basis. All of the aircraft operated by Norra are leased from Finnair Aircraft Finance Oy. Fleet operated by Seats # Change Own** Leased Average Ordered Norra* from age 31.12.2019 31.12.2018 31.12.2019 ATR 68-72 12 6 6 10.4
Embraer E190 100 12 9 3 11.5 Total 24 0 15 9 11.0
* Nordic Regional Airlines Oy’s Air Operator Certificate (AOC). Strategy After the accelerated growth phase, Finnair is now targeting sustainable, profitable growth. Due to the updated strategy for the period of 2020-2025 introduced in November 2019, it will implement its strategy in five focus areas, namely: Network and fleet, Operational excellence, Modern premium airline, Sustainability as well as Culture and ways of working. The foundation for the strategy is in the high quality and safety of Finnair’s operations, Helsinki’s favourable geographic position, growing focus markets, clear goals to increase revenue, modern fuel-efficient fleet as well as a strong balance sheet.
12
Finnair’s Board of Directors has defined the following targets for the 2020-2025 strategy period:
• Comparable EBIT of over 7.5% over the cycle (at constant fuel and currency), after a 12-18-month build-up period
• ROCE of over 10% over the cycle (at constant fuel and currency), after a 12-18-month build-up period
• On-time-performance of over 85% • Improved Net Promoter Score and improved employee Net promoter score
Finnair aims to deliver these targets through a focused strategy that leverages the geographical advantage of Finnair’s hub in connecting Europe and Asia. Additional guidance for the 2020-2025 strategy period includes the following indicative items:
• Capacity growth, measured in Available Seat Kilometres (ASK) of 3-5% CAGR • Optimise liquidity, keeping cash-to-sales ratio above 15% (31% as per 31 December 2019) • Gearing ratio 175% at maximum (64% as per 31 December 2019) • Assess renewal and downsizing of the hybrid bond • Increase the share of owned aircraft vs. leased aircraft • Keep the dividend policy unchanged
Network and fleet Based on the updated strategy, Finnair is targeting Asian market level growth focusing primarily on the most profitable Asian mega cities and transfer traffic. The expected annual capacity growth between 3-5% is in line with the anticipated market growth. Transfer traffic brings half of Finnair's total revenue and two thirds of ticket sales. Three quarters of the transfer traffic is between Asia and Europe. It is anticipated that the growth will come from the transfer traffic in the future as well. Finnair continues to leverage its home hub's unique geographical location and getting the maximum efficiencies out of it. Building a fourth bank of flights enables better utilisation of the aircraft as well as airport capacity and, thus, traffic growth will be mostly outside the main afternoon bank. As a result, the network and fleet will be further optimised, and aircraft investments will be made to improve the narrow-body to wide-body ratio enabling better utilisation of the whole fleet. The indicative amount of investments is between 3.5 and 4.0 billion euros out of which two thirds will be into renewal and one third into growth. This includes all investments, including those committed of 730 million euros. Operational excellence Finnair is recognised as one of the safest airlines. The safety culture and efficiency as well as reliability and productivity of the operations continue to be at the core of the company’s strategy. As a result, more effort will be put into technology, automation and utilising data as well as into working together cross-functionally. Even though Finnair has reached its previous growth targets, productivity can be improved. The focus will be especially in fuel efficiency and on-time performance which have a great impact on both cost and productivity as well as customer experience. In terms of on-time performance and fuel efficiency, Finnair aims to develop from being in line with peers to being one of the leaders. Modern premium airline Finnair aims to be defined as a modern, premium airline. This will be achieved by offering even more extensive destination and product portfolios as well as additional frequencies and by enabling a smooth travel experience. The extensive destination and product portfolios together with added
13
frequencies cover different customer needs and ancillary products allow the customers to tailor the way they want to travel. Finnair will additionally continue to develop its distribution channels, Finnair.com and the travel agent channel. During Q4, the average number of monthly unique Finnair website visitors totalled 2.3 million (1.5)6. The renewed Finnair.com website, which makes it easier for the customer to buy tickets and services, has already been opened in more than 30 markets. The number of active users of the Finnair mobile application increased by 28.4 per cent to 365,000. Direct sales in Finnair’s digital channels represented 27.6 per cent (25.0) of all tickets sold and 47.8 per cent of ancillary sales (56.2). The indicative investments of 3.5 to 4.0 billion euros during 2020-2025 also include the new long-haul travel class, Premium Economy, which will be installed in the whole long-haul fleet starting from Q4 2020. Located in its own cabin, the Premium Economy class will feature highly customized designs for Finnair and provide customers with increased space and comfort along with an enhanced service offering. The rollout is expected to be completed by the end of 2022. Detailed planning of the cabin design and service concept as well as the commercial aspects will be communicated in 2020. Sustainability Sustainability is an essential part of Finnair and, thus, it is visible in everything done at Finnair. Finnair’s long-term goal is carbon neutrality. In order to achieve this goal, Finnair will e.g. continue the biofuel flights it has operated since 2011, investigate the use of other sustainable aviation fuels, utilise recycling and reduce single-use plastic waste, take part in the voluntary and non-voluntary offsetting schemes and target significant operational improvements to secure more fuel-efficient flying. The fleet-related investment is not only impacting the customer experience but is also a significant investment in more sustainable flying. Finnair wants to be a frontrunner in sustainability and is, therefore, working on a sustainability program which will be presented in more detail during the first half of 2020. Culture and ways of working The updated strategy will be implemented by engaging the entire Finnair personnel and thus the strategy will be closely linked to their everyday work and targets. The strategy emphasises genuine collaboration, target-oriented leadership and utilising of new working methods such as lean and agile. A genuine service culture resonates well with customers in the NPS scores, which is something Finnair wants to continue improving on during the strategy period. Finnair employed an average of 6,772 (6,422) people in Q4 2019, which is 5.4 per cent more than in the corresponding period. The number of employees increased during Q4 by 31 or 0.5 per cent, totalling 6,788 at the end of December (6,462). Altogether 153 new people were hired at Finnair in Q4 2019. The increase in personnel was mostly due to growth in the number of Cabin Crew members and Aurinkomatkat Travel Guides. The attrition rate for the last 12 months was 3.8 per cent (3.3). LTIF (Lost Time Incident Frequency), which measures the frequency of accidents at the company level, was 6.2 (10.6) in Q4, and the number of absences due to illness was slightly higher than in the comparison period and was 4.58 per cent (3.89). Corporate sustainability Economic, social and environmental aspects are integral to Finnair’s overall business strategy and operations. Finnair wants to be a responsible global citizen and respond to its stakeholders’ needs, including those concerned with corporate sustainability. Finnair cooperates with industry operators and the authorities in areas such as reducing the climate impacts of aviation, promoting equality and
6 The measurement method was changed in Q2 2018 due to EU GDPR.
14
inclusion and the consideration of sustainability within the supply chain. Finnair is currently preparing a new corporate sustainability strategy which will be published during the first half of 2020. Finnair’s corporate sustainability is reflected in its strategy and vision, as well as its values of commitment to care, simplicity, courage and working together. Its current sustainability strategy embeds sustainability even deeper into the group strategy, brand and product development. The strategy measures are geared to contribute to cost containment and risk mitigation as well as value creation. Finnair’s ethical business principles are outlined in its Code of Conduct. The Code applies to all Finnair personnel and all locations. Finnair requires that its suppliers comply with ethical standards essentially similar to those which Finnair complies with in its own operations. Finnair’s Supplier Code of Conduct provides clear principles to ensure ethical purchasing, including zero tolerance for corruption. Safety has the highest priority in Finnair operations. Finnair is committed to implementing, maintaining and constantly developing strategies and processes to ensure that all its aviation activities take place under an appropriate allocation of organisational resources. This is to achieve the highest level of safety performance and compliance with the regulatory requirements while delivering our services. Finnair is also committed to the sector’s common goals of carbon-neutral growth from 2020 onwards and its long-term goal is carbon neutrality. In addition, Finnair has set an ambitious target to cut 17 per cent of its carbon dioxide emissions/RTK (Revenue Tonne Kilometre) by 2020 (from the 2013 level). Finnair estimates that this target will not be reached in full, but that its carbon dioxide emissions/RTK will decrease by 12–13 per cent by 2020 from the 2013 level. From January 2019 on, Finnair has offered its customers the possibility of offsetting the CO2 emissions of their flights through an emissions reduction project, and/or through the support of the use of biofuel on Finnair flights. The Push for Change service is available on our web pages in the Finnair Shop, and can be bought before, during or after a flight. Customers can also use their Finnair Plus points to buy the service. By the end of December, a total of 14,000 products were sold to compensate for emissions through either a carbon reduction project or biofuel. Total funds for emission compensation amounted to 91,172 euros. Finnair flew three biofuel flights backed by the “Push for change” carbon-decreasing initiative in 2019 from San Francisco to Helsinki. Two of the flights were flown with a biofuel mix of 12 percent and the third with a biofuel mix of 36 percent, reducing the total CO2 emissions for the three flights by approximately 82 tons. The key performance indicators for corporate sustainability are presented in the Key Figures table of this interim report. Changes in company management Topi Manner started as Finnair CEO on 1 January 2019. Manner transferred to Finnair from Nordea, where he worked as a member of Nordea's Group Executive Management and as Head of Personal Banking. Mika Stirkkinen, Vice president, Revenue Management and Pricing, started as interim Head of Commercial unit and interim member of the Executive Board on 1 January 2019, as Finnair’s former CCO Juha Järvinen left the company. Finnair appointed two new members to its Executive Board on 16 April 2019. Ole Orvér was appointed as Chief Commercial Officer, and Nicklas Ilebrand as Senior Vice President, Strategy. Both new Executive Board members started in their roles on May 1, 2019. Ole Orvér has a long international career in several airlines, where he has mainly served in leadership positions in strategy, network management and sales. Nicklas Ilebrand has previously worked at Nordea mainly in strategy and product and business development roles. Prior to that, he worked in international business consulting at McKinsey. He has also served on the board of several companies. During the third quarter, three members of Finnair's Executive Board changed. Finnair's CFO Pekka Vähähyyppä left the company on July 1, 2019, and his successor Mika Stirkkinen took up the position on the same day. Previously, Mr Stirkkinen has also held several financial management positions at
15
Finnair. Eija Hakakari, Finnair's SVP, Human Resources and Katri Harra-Salonen, Finnair's Chief Digital Officer, left the company on September 30, 2019. Johanna Karppi, appointed Ms Hakakari's successor, and Tomi Pienimäki, appointed successor to Ms Harra-Salonen, took up their duties on 1 October 2019. Johanna Karppi joined Finnair from Terveystalo, where she was SVP, Human Resources. She has previously held HR leadership positions at both Rautaruukki and Orion. Tomi Pienimäki has served as the CEO of Vincit and Jolla, and as the Chief Information Officer of Itella and Hackman. Share price development and trading Finnair’s market capitalization was 753.4 million euros at the end of December (31/12/2018: 907.8). The closing price of the share on 31 December 2019 was 5.88 euros (31/12/2018: 7.09 euros). During January–December, the highest price for the Finnair Plc share on the Nasdaq Helsinki was 8.56 euros, the lowest price 5.50 euros and the average price 7.02 euros. Some 36.8 million company shares, with a total value of 257.7 million euros, were traded in Nasdaq Helsinki. The number of Finnair shares recorded in the Trade Register was 128,136,115 at the end of the period. The Finnish state owned 55.8 per cent (55.8) of Finnair’s shares, while 13.9 per cent (18.4) were held by foreign investors or in the name of a nominee. Own shares In January 2019, Finnair ended the share buy-back scheme initiated in December 2018. After share buy-backs that ended on 10 January 2019, Finnair held a total of 797,008 own shares, representing 0.62 per cent of the total number of shares. In 2019, Finnair did not exercise the authorisation granted by the AGM 2019 to acquire or dispose of, its own shares. In Q1, Finnair transferred, using the authorisation granted by the AGM, a total of 105,112 own shares as incentives to the participants of the FlyShare employee share savings plan. It also transferred, in March, 149,894 own shares as a reward to the key personnel included in Finnair’s share-based incentive scheme 2015–2017. The shares remaining on the joint book-entry account, totalling 16,651 after Finnair Plc’s AGM 2019 that decided on the forfeiture of the shares registered on the joint book-entry account and the rights carried by such shares, were transferred to Finnair Plc’s book-entry account on 9 April 2019. After the transfer the total number of own shares owned by Finnair was 558,653, which corresponded to 0.44 per cent of Finnair Plc’s total number of shares and votes. In October, 6,340 own shares were transferred to the participants of the FlyShare employee share savings plan using the authorisation granted by the AGM. On 31 December 2019, Finnair held a total of 552,313 own shares (649,008), representing 0.43 per cent (0.51) of the total number of shares and votes. Share-based incentive schemes Employee share savings plan FlyShare
In December, Finnair’s Board of Directors decided to launch a new, in order the eighth, 12-month savings period under the FlyShare Employee Share Plan. The objective of the plan, established in 2013, is to encourage the employees to become shareholders in the company, and thereby strengthen the employees’ interest in the development of Finnair’s shareholder value and to reward them over the long term. The share savings plan is described in a stock exchange release issued on 18 December 2019, in the Remuneration Statement 2019 and on the company’s website. Share-based incentive plan for key personnel
In December, the Board of Directors of Finnair also approved a new individual performance share plan covering the years 2020–2022. Within the plan, the participants have the opportunity to earn Finnair shares as a long-term incentive reward, if the performance targets set by the Board of Directors for the plan are achieved. The potential share rewards will be delivered to the participants in the spring of 2023. The plan applies to some 70 persons, and it is described in a stock exchange
16
release issued on 18 December 2019, in the Remuneration Statement 2019 and on the company’s website. Authorisations granted by the Annual General Meeting 2019 Finnair's Annual General Meeting was held in Helsinki on 20 March 2019. The AGM authorised the Board of Directors to decide on the repurchase of the company’s own shares and/or on the acceptance as pledge and on the disposal of own shares held by the company. The authorisation shall not exceed 5,000,000 shares, which corresponds to approximately 3.9 per cent of all the shares in the company. The authorisations are effective for a period of 18 months from the resolution of the AGM. The AGM also authorised the Board of Directors to decide on donations up to an aggregate maximum of EUR 250,000 for charitable or corresponding purposes. The authorisation is effective until the next Annual General Meeting. The resolutions of the AGM are available in full on the company’s website https://investors.finnair.com/en/governance/general-meetings/previous-agms/agm-2019. Significant near-term risks and uncertainties Aviation is an industry that is sensitive to global economic cycles and reacts quickly to external disruptions, seasonal variation and economic trends. In the implementation of its strategy, Finnair is faced with various risks and opportunities. Finnair has a comprehensive risk management process to ensure that risks are identified and mitigated as much as possible, although many risks are not within the company’s full control. The risks and uncertainties described below are considered as potentially having a significant impact on Finnair’s business, financial result and future outlook within the next 12 months. This list is not intended to be exhaustive. Exceptional variations in the fuel price affect capacity growth in Finnair’s main markets. This together with changes in ticket prices pose a risk to Finnair’s revenue development, as do sudden adverse changes in the foreign exchange rates and slowing growth in demand. Generally, Finnair aims to pass exceptional variations in the fuel price to customers via ticket prices, however, the market conditions prevailing from time to time may not allow this. Capacity increases and product improvements among Finnair’s existing or new competitors may have an impact on the demand for, and yield of, Finnair’s services. In addition, joint operations involving closer cooperation than airline alliances and joint businesses are expected to develop further. Potential industry consolidation could have a significant impact on the competitor landscape. Introduction of new digital distribution technologies and channels in Finnair’s distribution strategy, including transition towards differentiation of fare content and availability between the channels, involves implementation and commercial risks. The aviation industry is affected by a number of regulatory trends. Estimating the impacts of the regulatory changes on airlines’ operational activities and/or costs in advance is difficult. Examples of such regulatory trends include regulation related to emissions trading, noise regulation and other environmental regulation, as well as regulations on privacy and consumer protection. Geopolitical uncertainty, the threat of trade wars, the threat of terrorism, cyber-attacks and pandemic risks (such as coronavirus) as well as other potential external disruptions may, if they materialise, significantly affect the demand for air travel and Finnair’s operations. Potentially increasing protectionism in the political environment may have an adverse impact on the market access required for the implementation of Finnair’s strategy. The UK´s exit from the European Union at the end of January is not expected to have an immediate effect on the aviation industry. However, the transition period until the end of 2020 includes many commercial threats. In case of unsuccessful trade and traffic negotiations, there is a danger that the traffic rights of the UK and European airlines regarding flights between and via the UK and EU would
17
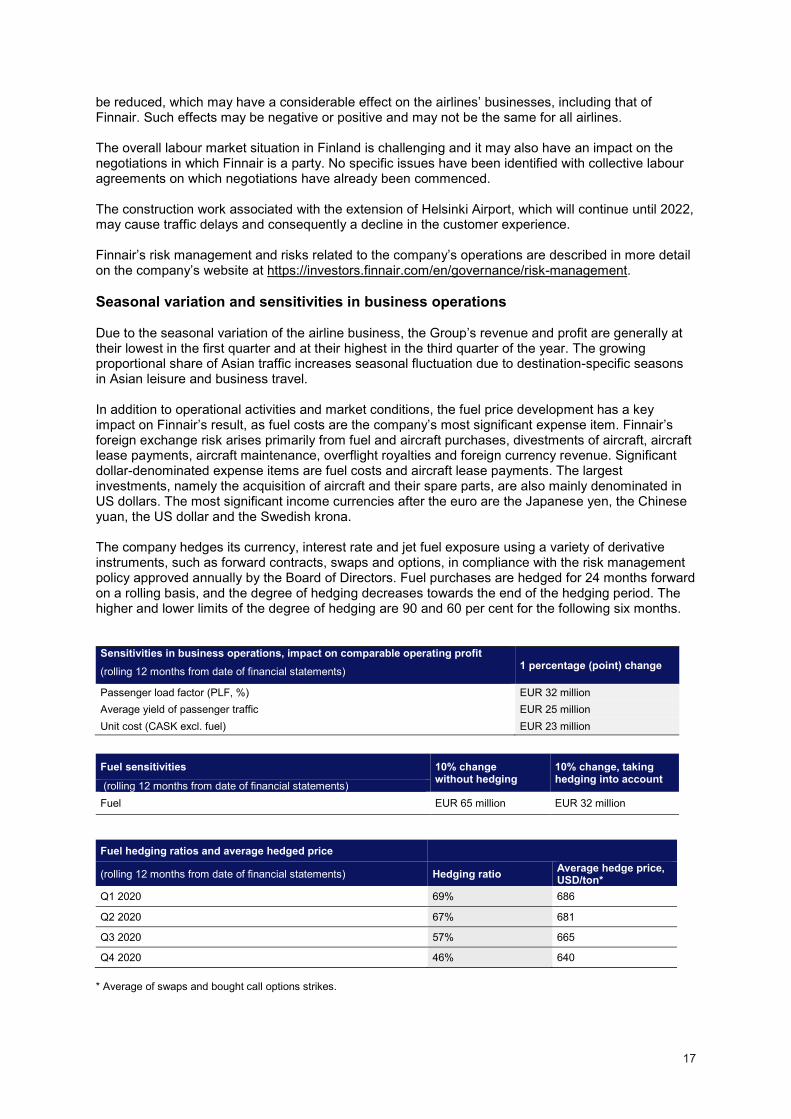
be reduced, which may have a considerable effect on the airlines’ businesses, including that of Finnair. Such effects may be negative or positive and may not be the same for all airlines. The overall labour market situation in Finland is challenging and it may also have an impact on the negotiations in which Finnair is a party. No specific issues have been identified with collective labour agreements on which negotiations have already been commenced. The construction work associated with the extension of Helsinki Airport, which will continue until 2022, may cause traffic delays and consequently a decline in the customer experience. Finnair’s risk management and risks related to the company’s operations are described in more detail on the company’s website at https://investors.finnair.com/en/governance/risk-management. Seasonal variation and sensitivities in business operations Due to the seasonal variation of the airline business, the Group’s revenue and profit are generally at their lowest in the first quarter and at their highest in the third quarter of the year. The growing proportional share of Asian traffic increases seasonal fluctuation due to destination-specific seasons in Asian leisure and business travel. In addition to operational activities and market conditions, the fuel price development has a key impact on Finnair’s result, as fuel costs are the company’s most significant expense item. Finnair’s foreign exchange risk arises primarily from fuel and aircraft purchases, divestments of aircraft, aircraft lease payments, aircraft maintenance, overflight royalties and foreign currency revenue. Significant dollar-denominated expense items are fuel costs and aircraft lease payments. The largest investments, namely the acquisition of aircraft and their spare parts, are also mainly denominated in US dollars. The most significant income currencies after the euro are the Japanese yen, the Chinese yuan, the US dollar and the Swedish krona. The company hedges its currency, interest rate and jet fuel exposure using a variety of derivative instruments, such as forward contracts, swaps and options, in compliance with the risk management policy approved annually by the Board of Directors. Fuel purchases are hedged for 24 months forward on a rolling basis, and the degree of hedging decreases towards the end of the hedging period. The higher and lower limits of the degree of hedging are 90 and 60 per cent for the following six months. Sensitivities in business operations, impact on comparable operating profit (rolling 12 months from date of financial statements) 1 percentage (point) change
Passenger load factor (PLF, %) EUR 32 million Average yield of passenger traffic EUR 25 million Unit cost (CASK excl. fuel) EUR 23 million
Fuel sensitivities 10% change
without hedging 10% change, taking hedging into account (rolling 12 months from date of financial statements)
Fuel EUR 65 million EUR 32 million
Fuel hedging ratios and average hedged price
(rolling 12 months from date of financial statements) Hedging ratio Average hedge price, USD/ton*
Q1 2020 69% 686
Q2 2020 67% 681
Q3 2020 57% 665
Q4 2020 46% 640 * Average of swaps and bought call options strikes.
18
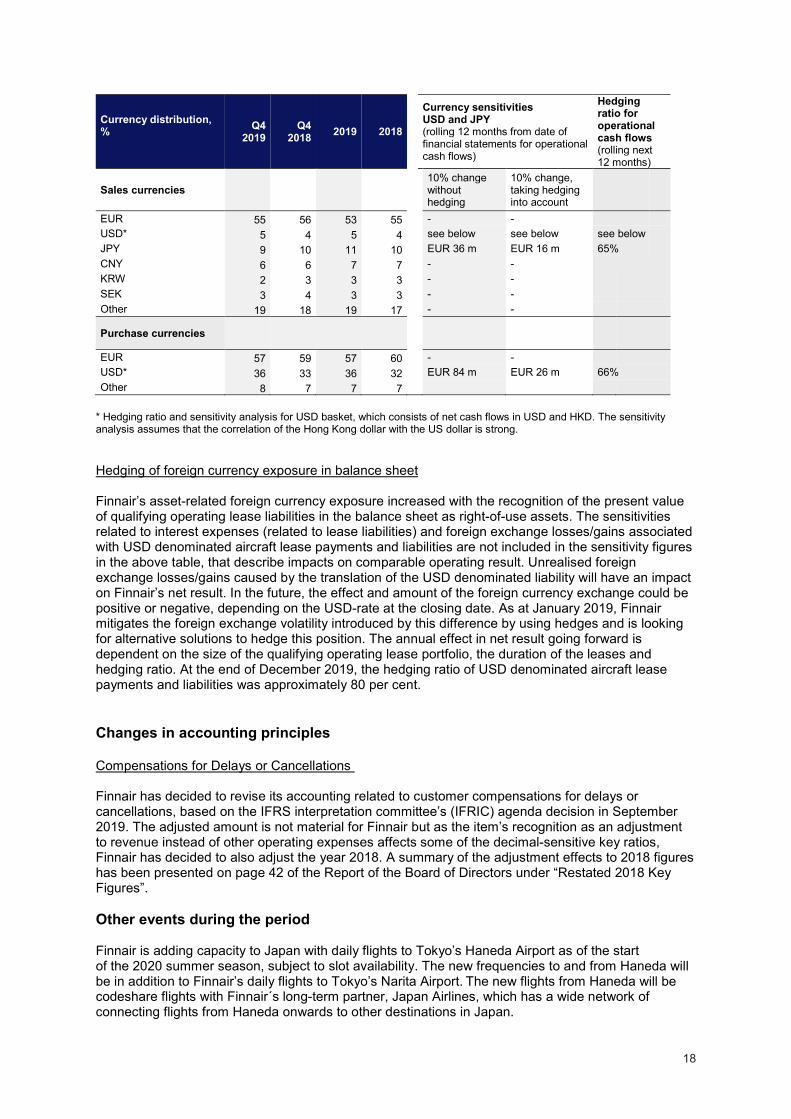
Currency distribution, %
Q4 2019
Q4 2018 2019 2018
Currency sensitivities USD and JPY (rolling 12 months from date of financial statements for operational cash flows)
Hedging ratio for operational cash flows (rolling next 12 months)
Sales currencies 10% change without hedging
10% change, taking hedging into account
EUR 55 56 53 55 - - USD* 5 4 5 4 see below see below see below JPY 9 10 11 10 EUR 36 m EUR 16 m 65% CNY 6 6 7 7 - - KRW 2 3 3 3 - - SEK 3 4 3 3 - - Other 19 18 19 17 - -
Purchase currencies
EUR 57 59 57 60 - - USD* 36 33 36 32 EUR 84 m EUR 26 m 66% Other 8 7 7 7
* Hedging ratio and sensitivity analysis for USD basket, which consists of net cash flows in USD and HKD. The sensitivity analysis assumes that the correlation of the Hong Kong dollar with the US dollar is strong. Hedging of foreign currency exposure in balance sheet Finnair’s asset-related foreign currency exposure increased with the recognition of the present value of qualifying operating lease liabilities in the balance sheet as right-of-use assets. The sensitivities related to interest expenses (related to lease liabilities) and foreign exchange losses/gains associated with USD denominated aircraft lease payments and liabilities are not included in the sensitivity figures in the above table, that describe impacts on comparable operating result. Unrealised foreign exchange losses/gains caused by the translation of the USD denominated liability will have an impact on Finnair’s net result. In the future, the effect and amount of the foreign currency exchange could be positive or negative, depending on the USD-rate at the closing date. As at January 2019, Finnair mitigates the foreign exchange volatility introduced by this difference by using hedges and is looking for alternative solutions to hedge this position. The annual effect in net result going forward is dependent on the size of the qualifying operating lease portfolio, the duration of the leases and hedging ratio. At the end of December 2019, the hedging ratio of USD denominated aircraft lease payments and liabilities was approximately 80 per cent. Changes in accounting principles Compensations for Delays or Cancellations Finnair has decided to revise its accounting related to customer compensations for delays or cancellations, based on the IFRS interpretation committee’s (IFRIC) agenda decision in September 2019. The adjusted amount is not material for Finnair but as the item’s recognition as an adjustment to revenue instead of other operating expenses affects some of the decimal-sensitive key ratios, Finnair has decided to also adjust the year 2018. A summary of the adjustment effects to 2018 figures has been presented on page 42 of the Report of the Board of Directors under “Restated 2018 Key Figures”. Other events during the period Finnair is adding capacity to Japan with daily flights to Tokyo’s Haneda Airport as of the start of the 2020 summer season, subject to slot availability. The new frequencies to and from Haneda will be in addition to Finnair’s daily flights to Tokyo’s Narita Airport. The new flights from Haneda will be codeshare flights with Finnair´s long-term partner, Japan Airlines, which has a wide network of connecting flights from Haneda onwards to other destinations in Japan.
19
Events after the financial period Due to the coronavirus and its impacts on air travel to and from mainland China, Finnair cancelled all its flights to mainland China between 6 February and 29 February 2020, its two weekly flights to Guangzhou between 5 February and 29 March 2020, its flights to Beijing Daxing airport between 5 February and 29 March 2020 and its flights to Nanjing between 8 February and 29 March 2020. Further, Finnair stopped accepting bookings to its mainland China flights between 31 January and 29 February 2020. As the first quarter and especially the weeks following the Chinese New Year are typically seasonally weak for Finnair’s mainland China routes in terms of profitability, Finnair estimates that the direct financial impact of group cancellations, ticket refunds and flight cancellations during the first quarter in 2020 is relatively limited, even in the case the mainland China cancellations would continue until the end of March 2020. Financial Reporting in 2020 The publication dates of Finnair’s financial reports in 2020 are the following:
• Interim Report for January–March 2020 on Wednesday 29 April 2020 • Half-Year Report for January–June 2020 on Friday 17 July 2020 • Interim Report for January–September 2020 on Wednesday 28 October 2020
FINNAIR PLC Board of Directors Briefings Finnair will hold a results press conference (in Finnish) on 7 February 2020 at 11:00 a.m. at its office located at Tietotie 9, Vantaa. An English-language telephone conference and webcast will begin at 1:00 p.m. Finnish time. The conference may be attended by dialling your local access number +358 9 7479 0361 (Finland), 0200 880 389 (Sweden), 0800 358 6377 (UK) or +44 (0)330 336 9105 (all other countries). The confirmation code is 8099758. To join the live webcast, please register at: https://slideassist.webcasts.com/starthere.jsp?ei=1280834 For further information, please contact: Chief Financial Officer Mika Stirkkinen, tel. +358 9 818 4960 [email protected] Director, IR Erkka Salonen, tel. +358 9 818 5101, [email protected]


