1 Adjusted EBITDA is an Alternative Performance Measure (APM) that reflects our usual operations results. Organic sales growth is the sum of volume and price/mix. Adjusted Net Operating Free Cash Flow is the CF from operating activities, corrected for the CF of the APM adjustments, minus the CF of capital expenditures and drawing rights. 2 Results and KPIs throughout this document reflect continued operations, excluding the Resins & Functional Materials and associated businesses, classified as ‘held for sale’ in September 2020 and sold on 1 April 2021. Press Release Heerlen (NL), 3 August 2021 23E DSM reports H1 2021 results Highlights 1 Continuing operations results 2 : • DSM delivered a very good first half year • Group sales +10% and Adjusted EBITDA +22% Nutrition: sales +6%, organic sales +6%, Adjusted EBITDA +8% Materials: sales +33%, volumes +33%, Adjusted EBITDA +86% • Adjusted net profit up 21% to €444m Total Group: • Net profit of €1,010m including the book profit of €567m from the divestments • Adjusted Net Operating Free Cash Flow of €380m, up 11% • Interim dividend of €0.80 per ordinary share • Significant step-up in greenhouse gas reduction target to 50% by 2030 • Full year outlook 2021: updated to reflect stronger Materials results Key figures – continuing operations 2 in € million H1 2021 H1 2020 % Change Volume Price/mix FX Other Sales 4,488 4,065 10% 11% 0% -5% 4% Nutrition 3,404 3,224 6% 7% -1% -6% 6% Materials 971 730 33% 33% 4% -4% 0% Adjusted EBITDA 925 761 22% Nutrition 730 674 8% Materials 232 125 86% Innovation 12 11 Corporate -49 -49 EBITDA 879 683 Adjusted EBITDA margin 20.6% 18.7% Co-CEOs statement Geraldine Matchett and Dimitri de Vreeze, co-CEOs, commented: “Our very good start to the year has continued with ongoing positive momentum in our Nutrition business. Materials saw a strong recovery, supported by ongoing restocking through the supply chain. This strong performance in Materials, combined with our unchanged positive outlook for Nutrition, leads us to further increase the full year outlook for the Group. We have achieved these results while also making good progress on our long-term strategic priorities and are realigning our organization following last year’s acquisitions in Nutrition and the divestment of Resins & Functional Materials. Good progress has also been made in building our innovation- focused growth platforms, including the launch of several new initiatives in personalized and precision nutrition. As a purpose-led company, we constantly seek to maximize our positive impact for all stakeholders. Today we are further accelerating our route to net zero by 2050 by raising our greenhouse gas scope 1 and 2 reduction targets for 2030 from 30% to 50%, independently validated by the Science Based Targets initiative.” Outlook 2021 For the full year, DSM continues to expect an Adjusted EBITDA increase in Nutrition at the upper end of its mid-term strategic ambition of high single digit growth. Together with a stronger performance in Materials than foreseen at the Q1 2021 Trading Update, DSM now expects an Adjusted EBITDA growth rate for the Group in the mid-teens, with a continued good Adjusted Net Operating Free Cash Flow.
Transcript
1 Adjusted EBITDA is an Alternative Performance Measure (APM) that reflects our usual operations results. Organic sales growth is the sum of volume and price/mix. Adjusted Net Operating Free Cash Flow is the CF from operating activities, corrected for the CF of the APM adjustments, minus the CF of capital expenditures and drawing rights. 2 Results and KPIs throughout this document reflect continued operations, excluding the Resins & Functional Materials and associated businesses, classified as ‘held for sale’ in September 2020 and sold on 1 April 2021.
Press Release Heerlen (NL), 3 August 2021
23E
DSM reports H1 2021 results
Highlights1 Continuing operations results2:
• DSM delivered a very good first half year• Group sales +10% and Adjusted EBITDA +22%
Total Group: • Net profit of €1,010m including the book profit of €567m from the divestments• Adjusted Net Operating Free Cash Flow of €380m, up 11%• Interim dividend of €0.80 per ordinary share• Significant step-up in greenhouse gas reduction target to 50% by 2030• Full year outlook 2021: updated to reflect stronger Materials results
Co-CEOs statement Geraldine Matchett and Dimitri de Vreeze, co-CEOs, commented: “Our very good start to the year has continued with ongoing positive momentum in our Nutrition business. Materials saw a strong recovery, supported by ongoing restocking through the supply chain. This strong performance in Materials, combined with our unchanged positive outlook for Nutrition, leads us to further increase the full year outlook for the Group.
We have achieved these results while also making good progress on our long-term strategic priorities and are realigning our organization following last year’s acquisitions in Nutrition and the divestment of Resins & Functional Materials. Good progress has also been made in building our innovation-focused growth platforms, including the launch of several new initiatives in personalized and precision nutrition.
As a purpose-led company, we constantly seek to maximize our positive impact for all stakeholders. Today we are further accelerating our route to net zero by 2050 by raising our greenhouse gas scope 1 and 2 reduction targets for 2030 from 30% to 50%, independently validated by the Science Based Targets initiative.”
Outlook 2021 For the full year, DSM continues to expect an Adjusted EBITDA increase in Nutrition at the upper end of its mid-term strategic ambition of high single digit growth. Together with a stronger performance in Materials than foreseen at the Q1 2021 Trading Update, DSM now expects an Adjusted EBITDA growth rate for the Group in the mid-teens, with a continued good Adjusted Net Operating Free Cash Flow.
H1 2021 results DSM | Page 2 of 25
Strategy DSM’s purpose-led, performance-driven strategy sees sustainability and innovation as key growth drivers of a long-term focused plan, underpinned by ambitious targets across People, Planet and Profit. In markets related to Nutrition, Health and Sustainable Living, DSM is well-positioned to use its capabilities to create a positive impact and deliver value for all stakeholders. In Nutrition, DSM sees significant headroom for further growth and innovation. The success of its unique business model combining ‘global products’ and ‘local solutions’ is evident in a track record of 6% organic sales growth and a 10% Adjusted EBITDA growth CAGR 2015-2020. Nutrition will continue to grow by building on this business model and by adding a third dimension of precision and personalization that captures emerging big data, digital and bioscience capabilities. As examples, in the first half of the year, DSM launched Sustell™, a data-driven sustainability service that helps drive improvements in the environmental footprint and economics of animal farming. It also created Hologram Sciences, a consumer-facing company that provides people with holistic solutions to manage their health by combining health diagnostics, digital coaching and personalized nutrition. In Materials, DSM has strong growth and earnings potential, and is well positioned in the strategic area of Sustainable Living. After completing the sale of the Resins & Functional Materials businesses to Covestro AG, the Materials’ activities now consist of DSM Engineering Materials and DSM Protective Materials. The company will continue to develop these into a resilient, higher-growth, and high-margin specialty business. Its offering addresses the increasing demand for materials that protect the health of both people and planet by adding further bio-based and circular solutions. Overall, DSM aims to deliver mid-single digit % organic sales growth, an above 20% Adjusted EBITDA margin, and high-single digit % Adjusted EBITDA growth on a mid-term basis in both Nutrition and Materials, supported by its strong innovation pipeline. Recent acquisitions and disposals On 31 March 2021, DSM acquired the flavor and fragrance bio-based intermediates business of Amyris, Inc., extending its offerings in Personal Care & Aroma Ingredients. The transaction included an initial consideration of USD 150 million, together with profit-related earn-outs over the period 2021-2024 expected to be in the range of USD 100-150 million. On 1 April 2021, DSM closed the sale of DSM’s Resins & Functional Materials business (including DSM Niaga®, DSM Additive Manufacturing and the coatings activities of DSM Advanced Solar) to Covestro AG. DSM received about €1.4 billion net in cash and recorded a net book profit of €567 million. DSM’s remaining solar back sheet business was sold to Worthen Industries, Inc. on 1 June 2021. Events after the reporting period On 13 July 2021, CVC Partners announced the proposed sale of AOC, in which DSM owns a minority position, to an affiliate of Lone Star Funds. It is estimated that DSM will receive, upon closing of the transaction, about €300 million in cash for its shareholding. On 27 July 2021, DSM acquired full ownership of Midori USA Inc., a biotechnology company which has developed a new generation of eubiotics for animal health. DSM already owns 38.5% of the shares of Midori and acquired the remaining 61.5% for a consideration of USD 63m.
Sustainability DSM’s commitment to creating value for all stakeholders is fully anchored in its long-term purpose-led, performance-driven strategy. Through the focused development and application of scientific innovation, DSM aims to enable its customers to positively impact the health of people today and the health of the planet for future generations. This is supported by DSM’s own improvements in its operations, reducing emissions and increasing the use of renewable energy, continually raising of safety standards, and promoting health and well-being among its workforce.
In H1 2021, DSM made significant progress on improving its environment impact. DSM is now well positioned to outpace its purchased renewable electricity target in particular. Building on the company-wide energy transition in recent years, all DSM Protective Materials sites worldwide now use 100% renewable electricity after its site in Laiwu, China, switched this year. DSM signed an additional power purchase agreement in July 2021 which means all its North American electricity needs will become 100% renewable this year. At the same time, DSM has exceeded its energy efficiency improvement targets with on-site initiatives such as the installation of a new chiller in Xinghuo, China, as well as the introduction of heat recovery systems and energy dashboarding. DSM has announced today a major increase of its greenhouse gas (GHG) emissions reduction target. DSM now aims to halve its 2016 scope 1 and 2 emissions by 2030, accelerating its ambitions from a 30% reduction to 50%. The updated GHG target has been reviewed and approved by the Science Based Targets initiative and provides a strong foundation for DSM to achieve net zero by 2050. DSM has set solid interim goals, such as for 2025 and 2030, to drive action in both the short- and medium-term, ensuring it can deliver on this long-term ambition. DSM’s long-standing priority remains the safety, health and well-being of people. The company has continued to take proactive measures to support employees and their families during H1 2021, distributing millions more free immunity-optimizing micro-nutrients doses and providing homeworking equipment, remote learning and development, and assistance programs worldwide. Despite the ongoing personal challenges for many individuals in the context of a global pandemic, employee engagement remains good. DSM has also stepped up its broad inclusion and diversity efforts, supporting highly-motivated employee resource groups and improving female representation at the executive level in H1 2021. DSM’s measure of recordable safety incidents remained low, with the company striving to be incident and injury free. Products and services that DSM considers to have a better environmental and/or social impact than mainstream alternatives in the market are measured and reported as Brighter Living Solutions. By constantly reviewing its portfolio, launching new innovations, and improving its footprint, DSM aims to maintain a high positive impact with its portfolio. DSM will ensure its methodology will allow reporting against new and future requirements of regulating authorities and create transparency in mapping the impact of DSM’s sales on achieving the UN Sustainability Development Goals. DSM is committed to continue to obtain reasonable assurance on its impact reporting.
All data presented in the Sustainability Statements are subject to the non-financial reporting policies as disclosed in the IAR 2020.
H1 2021 results DSM | Page 4 of 25
Q2 Highlights Continuing operations results:
• DSM delivered a very good second quarter • Group sales +14% and Adjusted EBITDA +30%
o Nutrition: sales +5%, organic sales +4%, Adjusted EBITDA +8% o Materials: sales +59%, volumes +50%, Adjusted EBITDA +210%
Nutrition performed well in the second quarter delivering 4% organic sales growth, a particularly notable performance given the prior year comparable period in which strong COVID-19 effects had resulted in very strong 9% organic sales growth. Good overall business conditions in both Animal and Human Nutrition remained, while Personal Care saw increased demand for its products after weakness in the segment since Q2 2020 directly related to COVID-19. Nutrition Adjusted EBITDA was up 8%, with the 6% contribution from the Erber acquisition being offset by a 6% negative foreign exchange effect. The Adjusted EBITDA margin was up 70 bps at 21.9% versus 21.2% in Q2 last year, driven by positive sales mix effects. Materials reported an exceptionally strong performance, supported by a temporary margin expansion due to good pricing momentum, which resulted in a very strong Adjusted EBITDA margin of 24.6% (versus 12.6% in Q2 last year). Adjusted EBITDA was up 210% versus Q2 2020 (+28% versus Q2 2019).
H1 2021 results DSM | Page 5 of 25
Key figures and indicators
in € million 2021 2020 % Change Volume Price / mix
Adjusted Net profit - continuing operations2 444 368 21%
Net profit - continuing operations2 422 240 76%
Adjusted net EPS 2.54 2.13 19%
Net EPS 2.41 1.38
Operating cash flow 580 545 6%
Adj. Net Operating Free Cash Flow 388 330 18%
Capital expenditures3 229 229
Total Group in € million H1 2021 H1 2020 % Change Q2 2021 Q2 2020 % Change
Net profit2 1,010 270 274%
Net EPS 5.82 1.54 277%
Operating cash flow 579 584 -1%
Adj. Net Operating Free Cash Flow 380 342 11%
Net debt 1,219 2,102
Average number of ordinary shares 172.5 171.1
Workforce (headcount end of period)4 21,173 23,127 cc
1 Over Adjusted taxable result2 Including result attributed to non-controlling interest3 Cash, net of customer funding, investment grants and excluding leases4 Headcount 2020 refers to headcount at year end
H1 2021 results DSM | Page 6 of 25
Review by Cluster Nutrition
in € million H1 2021 H1 2020 % Change Q2 2021 Q2 2020 % Change
Sales 3,404 3,224 6% 1,726 1,649 5%Adjusted EBITDA 730 674 8% 378 350 8%Adjusted EBITDA margin (%) 21.4% 20.9% 21.9% 21.2%Adjusted EBIT 491 478 3%Capital Employed 8,749 7,481Average Capital Employed 8,598 6,967ROCE (%) 11.4% 13.7%Total Working Capital 1,818 1,695Average Total Working Capital as % of Sales 26.0% 27.0%
Sales development
H1 2021 Sales Nutrition delivered a good performance in the first half of the year, with 6% organic sales growth. The contribution from acquisitions was offset by foreign exchange effects. Nutrition saw continued good business conditions. • Animal Nutrition delivered 5% organic sales growth, a very good performance especially against
the +10% organic growth in H1 2020. Animal Nutrition saw good business conditions in the first half across all species with an especially strong performance in China and LatAm. In the first quarter, Animal Nutrition saw volumes positively impacted by high levels of customer pre-buying driven by concerns relating to logistics disruptions. The second quarter saw no significant stocking or destocking effects.
• Human Nutrition delivered 5% organic sales growth, with continued strong demand for Pharma and immunity-optimizing Dietary Supplements. Food & Beverages saw continued good demand, while Early Life Nutrition remained soft in the first half of the year.
• Other Nutrition reported 9% organic sales growth. Food Specialties delivered a very good performance in the first half with 8% organic sales growth with good volume growth in dairy, baking, brewing and savory. Personal Care & Aroma reported a 13% organic sales growth driven by a very strong performance in the second quarter due to post COVID-19 recovery of demand for sun care, skin care and fine fragrances.
H1 2021 results DSM | Page 7 of 25
H1 2021 Adjusted EBITDA Nutrition reported 8% growth in Adjusted EBITDA driven by higher volumes. The 7% contribution from the acquisition of Glycom and Erber was offset by a 7% negative foreign exchange effect. The Adjusted EBITDA margin was up 50 bps at 21.4% versus 20.9% in the same period last year, driven by positive sales mix effects.
H1 2021 results DSM | Page 8 of 25
Animal Nutrition Sales development
Q2 2021 Sales Animal Nutrition delivered 5% organic sales growth with +10% volumes. The reported strong volume growth was against a comparison of +2% in Q2 2020. After the stocking effect in the first quarter, there was no significant de-stocking effect in Q2. The business saw good global demand for animal proteins and delivered a very strong performance in China and LatAm in the second quarter. Poultry, pet and beef continued to perform well. Beef in particular was supported by the continued strong exports from LatAm to China. Swine also performed well, benefitting from the ongoing recovery from the African Swine Fever disease in China. Aquaculture started to see a recovery with a gradual reopening in food services. Prices were -5% against a tough comparable of +7% in Q2 2020 when the business experienced COVID-19 related price effects with pass-through pricing of externally sourced ingredients, foreign exchange related price increases and strong sales mix effects across regions. Erber, one of the world’s largest suppliers of eubiotics and the market leader in mycotoxin risk management, which was consolidated from 1 October 2020, delivered another strong quarter with €81 million sales and with a total Adjusted EBITDA of €18 million.
H1 2021 results DSM | Page 9 of 25
Human Nutrition Sales development
Q2 2021 Sales Human Nutrition performed well in the second quarter. The reported flat volume growth is a particularly notable performance given the very tough comparable of 13% volume growth in Q2 2020, when the business saw a very strong increase in demand for immunity-optimizing Dietary Supplements and pantry loading in Food & Beverages and Early Life Nutrition. Business conditions for immunity optimizing Dietary Supplements remained favorable. Food & Beverages delivered a solid performance, driven by good demand for packaged foods as well as an increased demand for food services. Early Life Nutrition sales were soft as this business continued to be negatively impacted by lower global birth rates exacerbated by COVID-19. Pharma and Medical recorded a very strong performance.
H1 2021 results DSM | Page 10 of 25
Materials Continuing operations
in € million H1 2021 H1 2020 % Change Q2 2021 Q2 2020 % Change
Sales 971 730 33% 504 317 59%Adjusted EBITDA 232 125 86% 124 40 210%Adjusted EBITDA margin (%) 23.9% 17.1% 24.6% 12.6%Adjusted EBIT 183 75Capital Employed 965 1,038Average Capital Employed 955 1,056ROCE (%) 38.2% 14.2%Total Working Capital 235 259Average Total Working Capital as % of Sales 11.9% 17.5%
Sales development
DSM Engineering Materials saw an exceptionally strong demand in automotive and electronics & electrics from the start of the year, which continued throughout the second quarter. This demand is driven by a combination of strong end user demand and restocking through the supply chain. The extremely tight supply chain conditions limit the visibility for the second half of the year. DSM Protective Materials has seen a more gradual improvement in business conditions during the first half of the year, with the second quarter being back to pre COVID-19 levels in Personal Protection, as well as in the other segments. Volumes were up 33% versus H1 2020 (+11% versus H1 2019) and up 50% versus Q2 2020 (+9% versus Q2 2019). Prices reflect changes in raw materials costs. Adjusted EBITDA Adjusted EBITDA was up +86% versus H1 2020 (+23% versus H1 2019), driven by strong operational leverage in both quarters and the benefit in Q2 of a temporary margin expansion due to good pricing momentum. The Adjusted EBITDA margin for H1 was up 680 bps at 23.9% versus 17.1% in H1 last year, with the Q2 Adjusted EBITDA margin up 1200 bps at 24.6% versus 12.6% in Q2 last year.
Half year sales were in line with the previous year when corrected for the negative US dollar effect. DSM Biomedical sales were still impacted by postponement of elective surgeries due to COVID-19.
Half year Adjusted EBITDA was slightly up, supported by licensing income for biofuels. Corporate Activities
H1 Adjusted EBITDA was in line with previous year. Discontinued Operations DSM’s Resins & Functional Materials in H1 2021 include only the first quarter of operational results up until divestment, compared to six months in H1 2020:
Discontinued Operations captured the Q1 results of DSM’s Resins & Functional Materials businesses (including DSM Niaga®, DSM Additive Manufacturing and the coatings activities of DSM Advanced Solar), which were previously included in the Materials and Innovation segments. These activities have been sold to Covestro as of 1 April 2021.
H1 2021 results DSM | Page 12 of 25
Condensed Cash Flow Statement and (Operating) Working Capital
in € million H1 2021 H1 2020 H1 2021 H1 2020
Cash provided by Operating Activities 580 545 579 584- Cash from APM adjustments 42 41 42 42- Cash from capital expenditures -229 -246 -236 -274- Cash from drawing rights -5 -10 -5 -10Adjusted Net Operating Free Cash Flow 388 330 380 342
Operating Working Capital (OWC) 2,285 2,203 2,285 2,346Average OWC as % of Sales 24.8% 27.3% 23.7% 26.0%OWC as % of Sales - end of period 24.9% 27.3% 24.9% 26.2%Total Working Capital (WC) 1,744 1,682 1,744 1,813Average Total WC as % of Sales 20.1% 22.4% 19.0% 21.5%Total WC as % of Sales - end of period 19.0% 20.8% 19.0% 20.2%
Continuing operations Total Group
Adjusted Net Operating Free Cash Flow was up 18% in H1 2021. The increase was predominantly driven by the step-up in Adjusted EBITDA, partially offset by an increase in operating working capital (OWC). The increase in OWC was driven by the strong increase in sales and a temporary increase in inventory in transit, stemming from global supply chain issues. Operating Working Capital and Total Working Capital as a % of sales continued to improve when comparing to H1 2020. The improvements in OWC and working capital realized in H2 2020 were largely maintained into 2021. Dividend
On 1 June 2021, the final dividend of €1.60 per share for the year 2020 was paid to holders of ordinary shares and a dividend of about €0.10 per share was paid to holders of cumulative preference shares A. The total distribution to shareholders amounting to €280 million was recorded against retained earnings. An interim dividend for 2021 of €0.80 per ordinary share and €0.05 for cumulative preference shares A was recognized as a liability in the second quarter of 2021. This distribution to shareholders amounting to €141 million will take place in Q3 2021. The interim dividend represents one third of the total dividend paid over the prior year. The interim dividend will be payable in cash or in the form of ordinary shares at the option of the shareholder, with a maximum of 40% of the total dividend amount available for stock dividend. If more than 40% of the total dividend is requested by the shareholders to be paid out in shares, those shareholders who have chosen to receive their dividend in shares will receive their stock dividend on a pro rata basis, the remainder being paid out in cash. Dividend in cash will be paid after deduction of 15% Dutch dividend withholding tax. The ex-dividend date is 5 August 2021. The interim dividend will be payable as from 27 August 2021.
H1 2021 results DSM | Page 13 of 25
Treasury
As of 29 April 2021, DSM had completed the cancellation of 6.6 million ordinary shares held in treasury concluding the reduction in share capital following the share buyback program executed in the period 1 April 2019 to February 2020. As of 17 June, DSM completed the repurchase of 0.8 million of its own ordinary shares at an average price of €150 for a total consideration of €120 million. The repurchase, announced on 16 March 2021, covered the commitments for the final stock dividend 2020. On 18 June 2021, DSM redeemed the €500 million 1.375% bond, earlier than its scheduled maturity of 26 September 2022. Overview of Alternative Performance Measures (APM) adjustments
The following overview provides a summary of the APM adjustments for the first half of 2021 (for the reconciliation see page 15).
Nutrition: EBITDA adjustments amounted to -€17 million (EBIT -€17 million) of which -€5 million related to restructuring cost and -€12 million to acquisition related costs. Materials: EBITDA adjustments amounted to -€18 million (EBIT -€18 million) fully related to restructuring costs. Innovation Center: EBITDA adjustments amounted to -€1 million (EBIT -€1 million) of which -€5 million related to restructuring costs and +€4 million related to an adjustment of the write down of assets. Corporate Activities: EBITDA adjustments amounted to -€10 million (EBIT -€10 million) fully related to restructuring costs. Discontinued Operations: EBITDA adjustments amounted to €641 million (EBIT €641 million) fully related to the book profit of the sales of the Resins and Functional Materials Business to Covestro.
H1 2021 results DSM | Page 14 of 25
Condensed consolidated statement of income for the first half
Sales 4,488 4,065
EBITDA 879 683
Depreciation and amortization 319 289
Operating profit (EBIT) 560 394Financial income and expense -68 -31
Profit before income tax expense 492 363Income tax expense -90 -56Share of the profit of associates/jointly controlled entities 20 -67
Net profit from continuing operations 422 240
Of which: Attributable to non-controlling interests -2 0Attributable to equity holders of DSM 420 240
Dividend on cumulative preference shares -4 -4 Available to holders of ordinary shares 416 236
Discontinued operations in € millionNet profit from discontinued operations 588 30
Of which: Attributable to non-controlling interests 0 -2 Attributable to equity holders of DSM 588 28
Total in € million Net profit 1,010 270
Of which:Attributable to non-controlling interests -2 -2Attributable to equity holders of DSM 1,008 268Dividend on cumulative preference shares -4 -4
Net profit available to holders of ordinary shares 1,004 264
Continuing operations in € million
H1 2021
H1 2020
H1 2021 results DSM | Page 15 of 25
Reconciliation to Alternative Performance Measures for the first half
APM adjustments to EBITDA 46 78Impairments of PPE and Intangible assets 0 0
Sub-total APM adjustments to operating profit (EBIT) 46 78
Adjusted operating profit (EBIT) 606 472
Net profit from continuing operations 422 240APM adjustments to operating profit (EBIT) 46 78APM adjustments to financial income and expense 0 0Income tax related to APM adjustments -14 -19APM adjustments to share of the profit of associates/jointly controlled entities -10 69
Net profit continuing operations available to holders of ordinary shares 416 236
APM adjustments 22 128Adjusted Net profit continuing operations available to holders of ordinary shares 438 364
Continuing operations in € million
H1 2021
H1 2020
H1 2021 results DSM | Page 16 of 25
Condensed Consolidated Statement of Comprehensive Income
Condensed Consolidated Statement of Changes in Equity
H1 H1in € million 2021 2020
Total Equity (at beginning of the period) 7,487 7,835Changes:Total Comprehensive Income 1,540 105Dividend -421 -425Repurchase of Shares -120 -283Proceeds from Re-issue of Ordinary Shares 131 130Other Changes -22 18
Total Equity (end of period) 8,595 7,380
H1 H1in € million 2021 2020
Items that will not be reclassified to profit or lossRemeasurements of Defined Benefit Pension Plans 199 -47Change in Fair Value Reserve 208 42FX on Translation of Foreign Operations Related to Non-Controlling Interest 3 -2
Items that may subsequently be reclassified to profit or lossFX on Translation of Foreign Operations 152 -170Change in Hedging Reserve -12 9Equity accounted investees - share of Other comprehensive income 2 -3
Other Comprehensive Income (before tax) 552 -171Income Tax Expense -22 6
Other Comprehensive Income (net of tax) 530 -165Profit for the Period 1,010 270
Total Comprehensive Income 1,540 105
H1 2021 results DSM | Page 17 of 25
Condensed Consolidated Balance Sheet in € million 30 June 2021 year-end
Sub-total 2,321 2,010Liabilities associated with the assets held for sale 8 254
Current Liabilities 2,329 2,264
Total Equity and Liabilities 15,095 14,364
Net debt 1,219 2,577Equity/Total Assets 57% 52%
H1 2021 results DSM | Page 18 of 25
Condensed Consolidated Cash Flow Statement
H1 H1in € million 2021 2020
Cash, Cash Equivalents and Current Investments (at beginning of period) 914 1,488Current Investments (at beginning of period) 43 688
Cash & Cash Equivalents (at beginning of period) 871 800
Operating ActivitiesEBITDA 1,548 746Change in Working Capital -260 -186Income Tax -51 -51Other -658 75
Cash provided by Operating Activities (Operating cash flow) 579 584of which provided by continuing operations 580 545
Investing ActivitiesCapital Expenditures -236 -274Payments regarding drawing rights -5 -10Acquisitions -212 -729Disposal of Subsidiaries, Businesses & Associates 1,462 1Disposal of Other Non-current Assets 131 1Change in Fixed-term Deposits -172 34Interest Received 3 4Dividend and capital (re)payments -19 -9Other 18 -6
Cash used in Investing Activities 970 -988
Financing ActivitiesDividend -170 -163Interest Paid -46 -26Repurchase of shares -120 -283Proceeds from re-issued treasury shares 18 33Change in Commercial Paper 0 459Proceeds from / repayments of corporate bonds -500 991Payment of lease liabilities -27 -27Other Cash from/ used in Financing Activities 74 -64
Cash from / used in Financing Activities -771 920Exchange Differences -9 -16
Cash and Cash Equivalents (end of period) 1,640 1,300Current Investment (end of period) 215 655
Cash and Cash Equivalents & Current Investments (end of period) 1,855 1,955
H1 2021 results DSM | Page 19 of 25
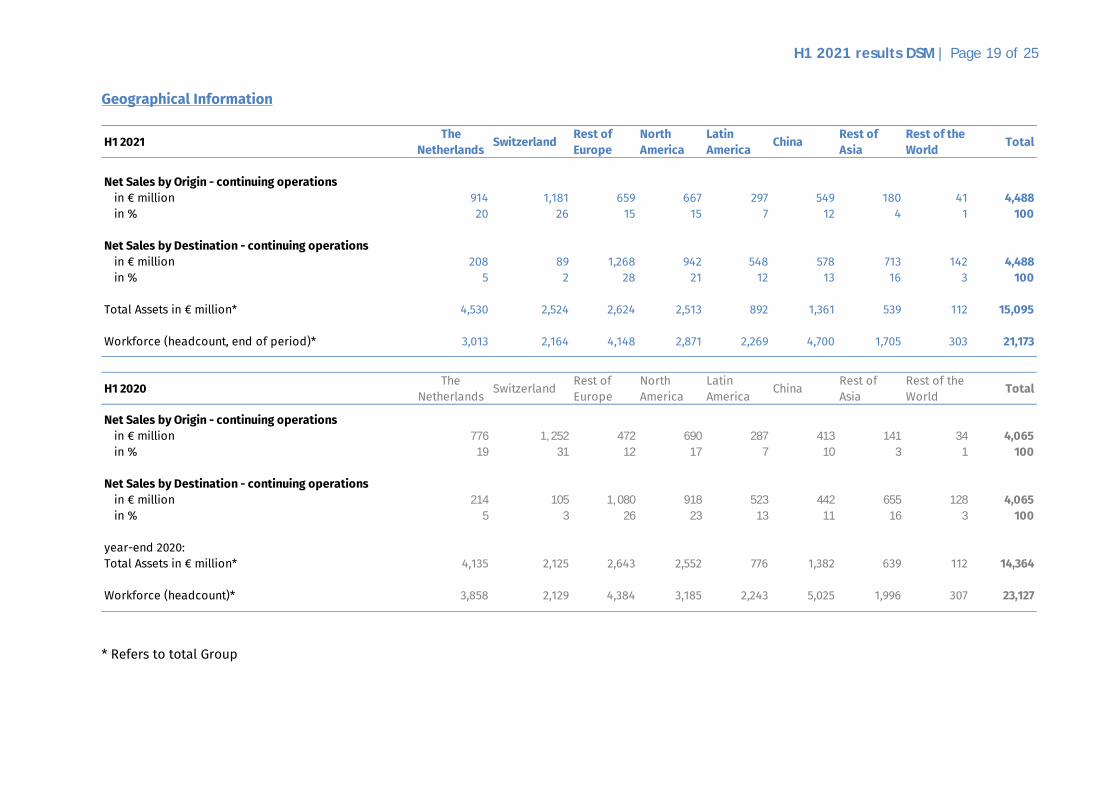
Geographical Information
* Refers to total Group
H1 2021 The Netherlands Switzerland Rest of
EuropeNorth America
Latin America China Rest of
AsiaRest of the World Total
Net Sales by Origin - continuing operationsin € million 914 1,181 659 667 297 549 180 41 4,488in % 20 26 15 15 7 12 4 1 100
Net Sales by Destination - continuing operationsin € million 208 89 1,268 942 548 578 713 142 4,488in % 5 2 28 21 12 13 16 3 100
Total Assets in € million* 4,530 2,524 2,624 2,513 892 1,361 539 112 15,095
Workforce (headcount, end of period)* 3,013 2,164 4,148 2,871 2,269 4,700 1,705 303 21,173
H1 2020 The Netherlands Switzerland Rest of
EuropeNorth America
Latin America China Rest of
AsiaRest of the World Total
Net Sales by Origin - continuing operationsin € million 776 1,252 472 690 287 413 141 34 4,065in % 19 31 12 17 7 10 3 1 100
Net Sales by Destination - continuing operationsin € million 214 105 1,080 918 523 442 655 128 4,065in % 5 3 26 23 13 11 16 3 100
Notes to the condensed financial statements Accounting policies and presentation The consolidated financial statements of DSM for the year ended 31 December 2020 have been prepared in accordance with International Financial Reporting Standards (IFRS) as adopted by the European Union. These accounting policies are applied in these interim financial statements that are in compliance with IAS 34 ‘Interim Financial Reporting’ and need to be read in conjunction with the Integrated Annual Report 2020 (IAR 2020) and the H1 2021 report by the Managing Board earlier in this press release. Audit The financial statements and other reported data in this press release have not been audited. Seasonality In cases where businesses are significantly affected by seasonal or cyclical fluctuations in sales, this is discussed in the ’Review by Cluster’ earlier in this report. Risks and uncertainties DSM has a risk management system in place. A description of the system and an overview of potentially important risks for DSM are provided in the IAR 2020 and in the governance section on www.dsm.com. DSM has reviewed the developments and incidents in the first half of 2021 and assessed the risks for the year. Based on these assessments DSM has concluded that the most important risks and responses as reported in the Integrated Annual Report 2020 are still applicable.
H1 2021 results DSM | Page 21 of 25
Scope of the consolidation Acquisitions In the first half of 2021, DSM acquired business for a total consideration of €211 million (in 2020: €1,579 million). DSM acquired the Flavor and fragrance (F&F) bio-based intermediates business of Amyris, Inc. for an upfront consideration of USD 150 million, plus an earn-out in the range of USD 100-150 million. In accordance with IFRS 3, the purchase price amounting to €202 million was provisionally allocated to identifiable assets and liabilities acquired and is based on a draft initial purchase price allocation prepared by an independent valuator. Completion of the independent valuation process is expected in the second half of 2021. Main intangible provisionally recognized is technology for €183 million. The acquisition is expected to result in tax-deductible goodwill to the amount of €17 million. The provisional accounting of the F&F acquisition and the follow-up on the provisional accounting of earlier acquisitions resulted in the following (adjustments to) assets and liabilities (measured at the date of acquisition):
F&F Other TotalAssetsIntangible assets 183 42 225Property, plant & equipment 1 1Other non-current assets 1 1Inventories 2 2Receivables and other current assets -5 -5Total assets 185 39 224
LiabilitiesOther non-current liabilities 5 5Other current liabilities -15 -15Total non-controlling interest and liabilities 0 -10 -10
Net assets at fair value 185 49 234
Acquisition price in cash at closing 128 7 135Acquisition price payable 74 2 76Consideration 202 9 211
Goodwill 17 -40 -23
H1 2021 results DSM | Page 22 of 25
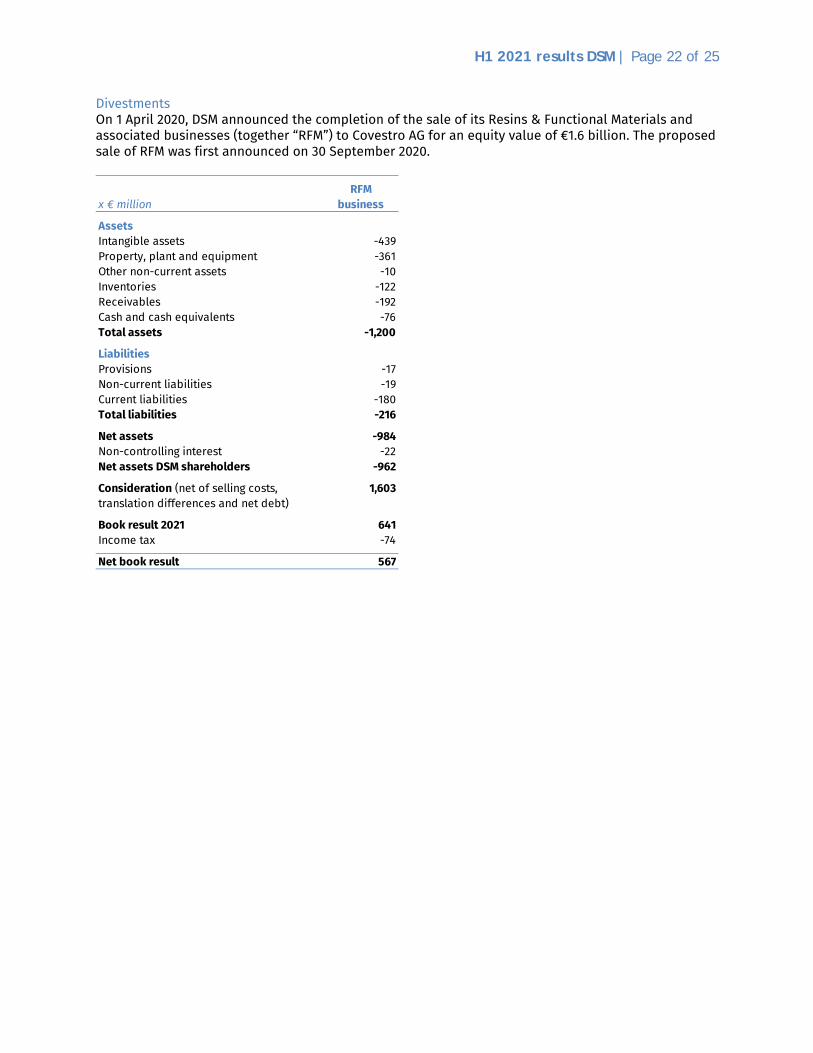
Divestments On 1 April 2020, DSM announced the completion of the sale of its Resins & Functional Materials and associated businesses (together “RFM”) to Covestro AG for an equity value of €1.6 billion. The proposed sale of RFM was first announced on 30 September 2020.
x € millionRFM
business
AssetsIntangible assets -439Property, plant and equipment -361Other non-current assets -10Inventories -122Receivables -192Cash and cash equivalents -76Total assets -1,200
Net assets -984Non-controlling interest -22Net assets DSM shareholders -962
Consideration (net of selling costs, translation differences and net debt)
1,603
Book result 2021 641Income tax -74
Net book result 567
H1 2021 results DSM | Page 23 of 25
Fair value of financial instruments In the following tables, the carrying amounts and the estimated fair value of the financial instruments are given. For methods and assumptions used to determine the fair value as well as information on the fair value hierarchy used, please refer to the IAR 2020.
*Level 1: Quoted prices in active markets for identical assets or liabilities Level 2: Other techniques for which all inputs that have a significant effect on the fair value are observable, either directly or indirectly Level 3: Techniques that use inputs that have a significant effect on the fair value that are not based on observable market data
Statement of the Managing Board The half-year condensed financial statements give a true and fair view of the assets, liabilities, financial position and profit or loss of DSM and its consolidated companies. The half-yearly management report gives a true and fair view of the information required pursuant to section 5.25d paragraph 8 and 9 of the Dutch Act on Financial Supervision. Heerlen, 3 August 2021 The Managing Board Geraldine Matchett, co-CEO Dimitri de Vreeze, co-CEO
H1 2021 results DSM | Page 25 of 25
Financial calendar 2 November 2021 Publication of the trading update first nine months of 2021 15 February 2022 Publication of the full year results of 2021 3 May 2022 Publication of the trading update first three months of 2022 10 May 2022 Annual General Meeting of Shareholders 2 August 2022 Publication of the half year results of 2022 1 November 2022 Publication of the trading update first nine months of 2022 Contact Information Investor Relations Dave Huizing
Additional Information Today DSM will host a webcast for investors and analysts at 14:00 CET. Details on how to access the webcast can be found on the DSM website. DSM – Bright Science. Brighter Living.™ Royal DSM is a global, purpose-led, science-based company active in Nutrition, Health and Sustainable Living. DSM’s purpose is to create brighter lives for all. DSM addresses with its products and solutions some of the world’s biggest challenges while simultaneously creating economic, environmental and societal value for all its stakeholders – customers, employees, shareholders, and society at large. DSM delivers innovative solutions for human nutrition, animal nutrition, personal care and aroma, medical devices, green products and applications, and new mobility and connectivity. DSM and its associated companies deliver annual net sales of about €10 billion with approximately 23,000 employees. The company was founded in 1902 and is listed on Euronext Amsterdam. More information can be found at www.dsm.com. Find us on: Forward Looking Statements This press release may contain forward-looking statements with respect to DSM’s future (financial) performance and position. Such statements are based on current expectations, estimates and projections of DSM and information currently available to the company. DSM cautions readers that such statements involve certain risks and uncertainties that are difficult to predict and therefore it should be understood that many factors can cause actual performance and position to differ materially from these statements. DSM has no obligation to update the statements contained in this press release, unless required by law. The English language version of the press release is leading.