743 [ Journal of Labor Economics, 2001, vol. 19, no. 4] 2001 by The University of Chicago. All rights reserved. 0734-360X/2001/1904-0001$02.50 Firm-Wide Incentives and Mutual Monitoring at Continental Airlines Marc Knez, Lexecon Strategy Group Duncan Simester, Massachusetts Institute of Technology In February 1995 Continental Airlines introduced an incentive scheme that promised monthly bonuses to all 35,000 hourly em- ployees if the company achieved a firm-wide performance goal. Con- ventional wisdom suggests that free riding will render such schemes ineffective. We present evidence indicating that the incentive scheme raised employee performance despite the apparent threat of free rid- ing. To explain why the scheme may have been effective we argue that the organization of employees into autonomous work groups enabled Continental to induce mutual monitoring among employees within each work group. I. Introduction Firm-wide incentive schemes are common at large firms. A 1987 Gov- ernment Accounting Office survey of 326 Fortune 1,000 firms reported that 54% of nonunion and 39% of unionized firms had profit-sharing schemes for hourly employees (cited in Cooke 1994). Moreover, their use We wish to thank Eric Anderson, Michael Browne, Colin Camerer, Rob Gert- ner, John Hauser, and Birger Wernerfelt for their helpful comments. The article has benefited from comments by seminar participants at the University of Chicago, Columbia University, MIT, Stanford University, and the Boston/Cambridge Sem- inar on the Economics of Organizations. Many people at Continental Airlines also contributed to this study. For their generous contributions of time and data we would particularly like to thank Gordon Bethune, Gregory Brenneman, Beth Ballew, Thomas Yourke, and the employees and supervisors at Midway Airport, Chicago, Illinois.
Transcript
743
[ Journal of Labor Economics, 2001, vol. 19, no. 4]� 2001 by The University of Chicago. All rights reserved.0734-360X/2001/1904-0001$02.50
Firm-Wide Incentives and MutualMonitoring at Continental Airlines
Marc Knez, Lexecon Strategy Group
Duncan Simester, Massachusetts Institute of Technology
In February 1995 Continental Airlines introduced an incentivescheme that promised monthly bonuses to all 35,000 hourly em-ployees if the company achieved a firm-wide performance goal. Con-ventional wisdom suggests that free riding will render such schemesineffective. We present evidence indicating that the incentive schemeraised employee performance despite the apparent threat of free rid-ing. To explain why the scheme may have been effective we arguethat the organization of employees into autonomous work groupsenabled Continental to induce mutual monitoring among employeeswithin each work group.
I. Introduction
Firm-wide incentive schemes are common at large firms. A 1987 Gov-ernment Accounting Office survey of 326 Fortune 1,000 firms reportedthat 54% of nonunion and 39% of unionized firms had profit-sharingschemes for hourly employees (cited in Cooke 1994). Moreover, their use
We wish to thank Eric Anderson, Michael Browne, Colin Camerer, Rob Gert-ner, John Hauser, and Birger Wernerfelt for their helpful comments. The articlehas benefited from comments by seminar participants at the University of Chicago,Columbia University, MIT, Stanford University, and the Boston/Cambridge Sem-inar on the Economics of Organizations. Many people at Continental Airlinesalso contributed to this study. For their generous contributions of time and datawe would particularly like to thank Gordon Bethune, Gregory Brenneman, BethBallew, Thomas Yourke, and the employees and supervisors at Midway Airport,Chicago, Illinois.
744 Knez and Simester
appears to be increasing, both in the form of employee stock ownershipplans (ESOP) and profit-sharing plans (Conte and Kruse 1991). Thisprevalence contrasts sharply with accepted economic wisdom that em-ployee free riding will render such schemes ineffective. We investigate theapparent inconsistency between managerial practice and common wisdomby studying the impact of a firm-wide incentive scheme implemented atone large firm (Continental Airlines).
In February 1995, following a sustained period of poor operational andfinancial performance, Continental Airlines introduced an incentivescheme that promised a monthly bonus to every hourly employee if theairline met firm-wide performance goals. We first investigate claims thatthe scheme contributed to improvements in Continental’s performance.The data offer support for these claims, and so we investigate the factorsthat may have mitigated free riding.
Evaluating the Impact of Continental’s Incentive Scheme
Previous empirical work includes several studies that investigate howincentives affect decisions and behavior in small groups. These studiesgenerally reveal modest positive associations between incentives andgroup performance; however, the results may not generalize beyond smallgroups.1 Previous studies of firm-wide incentive schemes at large firmsinclude substantial literatures investigating both ESOPs and profit-sharingschemes. In a review of 27 studies of ESOPs, Blasi, Conte, and Kruse(1996) conclude that few of the findings reveal strong and statisticallysignificant effects of employee ownership on performance. Studies ofprofit sharing have tended to yield slightly more positive outcomes. Kruse(1993) identifies a total of 26 studies of profit sharing, representing datafrom several countries. Within these studies he found 265 reported co-efficients measuring the impact of profit sharing, and reports that just8.7% of these coefficients take negative values, while 57.4% take positivevalues that are significantly different from zero ( ). The results ofp ! .05Kruse’s own analysis conducted using a new data source also reveal apositive association between profit sharing and average productivityincreases.
With few exceptions, these ESOP and profit-sharing studies compareperformance across firms and so are hampered by the multitude of unob-served idiosyncratic factors that influence firm performance. Other studiescompare the performance of a single firm over time but cannot controlfor intervening industry or firm changes that may also have affected per-formance. Resolving both types of limitations generally requires a cross-sectional comparison of time-series performance, preferably within the
1 See, e.g., Cooke (1994) and Welbourne, Balkin, and Gomez-Mejia (1993) andthe references cited therein.
Mutual Monitoring 745
same firm. Studying the impact of firm-wide incentives requires a com-parison of performance improvements across similar business units, wheresome units participate in the incentive program and others do not. Thedata we use from Continental offer a rare example of these conditions ina field setting.
In Section II we describe the group incentive scheme introduced byContinental and attempt to isolate the impact of the scheme from theeffects of other changes. We do so by comparing the improvement in on-time departure performance at two groups of airports. Airports in thefirst (test) group are all locations at which Continental’s operations wereperformed by its own employees. In the second (control) group theseoperations were performed by employees of separate companies withwhich Continental had outsourcing contracts. Because only Continentalemployees were eligible for the bonus scheme, the bonus scheme was notexpected to affect behavior at airports where operations were outsourced.Outsourced airports therefore provide us with a natural control group to(cross-sectionally) separate the impact of the bonus scheme from inter-vening firm or industry changes. Moreover, by comparing performanceof individual airports over time, we control for airport differences thatmay also have affected performance.
Our analysis reveals a significantly larger improvement at nonout-sourced airports. This result is consistent with the bonus scheme raisingthe efforts of employees that were eligible to receive it and survives severaltests designed to rule out alternative interpretations. To explain why theincentive scheme may have been effective, we build on recent work inboth economics and sociology that suggests that mutual monitoring mayprovide an effective solution to free riding.
Free Riding and Mutual Monitoring
Compensating employees for improvements in joint output leads toemployees sharing the rewards from higher effort. The dilution in theresulting incentives and mitigation of additional effort is often termed“free riding” and is aggravated in large firms.2 In small firms, employeesshare their rewards with fewer colleagues, while mutual monitoring mayalso help to resolve free riding. In particular, if employees collusively
2 This observation forms the basis of Alchian and Demsetz’s (1972) theorydistinguishing partnerships and firms. They argue that the weakening of incentivesin partnerships leads to a transfer of residual rights to a single principal whoenforces efficient effort by direct monitoring. It also provides the starting pointfor Holmstrom’s (1982) work on moral hazard in teams. Holmstrom formalizesthe incentives to free ride and shows that the problem is exacerbated in largefirms. He concludes that overcoming the free-rider problem may yield an alter-native role for the principal: enforcing a system of budget-breaking penalties (orbonuses) in order to implement efficient effort.
746 Knez and Simester
agree to exert high effort and then monitor and sanction their colleaguesto enforce the group decision, incentives to exert effort will increase.Group incentive schemes may encourage monitoring and sanctioning be-cause each employee’s actions affect payments to other members of thegroup.
Unfortunately, mutual monitoring is not expected to be effective inlarge firms. Employees in large groups are often unable to observe eachother’s efforts and are less willing to incur the costs of monitoring andsanctioning their colleagues (Heckathorn 1988; Coleman 1990; Kandeland Lazear 1992). Both concerns are relevant at Continental. The bonusscheme includes approximately 35,000 eligible employees, none of whomcan directly affect joint output. Moreover, employees are dispersed amongdifferent terminal and airport locations, which prevents direct monitoringof each other’s efforts. Notwithstanding these obstacles, our explanationfor the claimed success of Continental’s incentive scheme argues thatContinental exploits the benefits of mutual monitoring, despite its size.It does so because employees are organized into autonomous groups,dispersed between airports and terminals. Within these groups, collusionis sustainable. Moreover, the interdependence of the groups amplifies theimpact of poor performance, so that firm-level measures are sensitive toindividual group performance. As a result, rewards for improving firm-level performance are sufficient to prompt choice of high effort by eachgroup.
The remainder of the article is in two parts, beginning with a reviewof the impact of the incentive scheme on Continental’s performance, fol-lowed by an investigation of the factors that may have mitigated theapparent free riding problem. The empirical findings in Section II beginwith a description of the incentive scheme introduced at Continental. Wethen attempt to isolate the impact of the scheme from the effects of otherchanges. In Section III we explain why we might expect mutual moni-toring (collusion) to fail at a firm of Continental’s size. We then arguethat collusion may succeed within Continental’s autonomous workgroups and present anecdotal evidence consistent with this claim. Nextwe describe how the actions of each work group affect overall firm output.Finally, we discuss the possible existence of multiple equilibria and howimproving the flight schedule may have helped move to a high effortequilibrium. Section IV contains a summary of conclusions andlimitations.
II. Continental Airline’s Incentive Scheme
Prior to 1995, Continental Airlines was consistently one of the worst-performing airlines in the industry. Since deregulation of the industry in1978 it had entered bankruptcy protection twice, failed to make an annual
Mutual Monitoring 747
profit during periods it was not under bankruptcy protection, and av-eraged last among the 10 major domestic airlines in on-time arrival, bag-gage handling, and customer complaints.3 At the end of 1994, a new seniormanagement team was brought in to address these problems. This newteam represented the tenth change in senior management in 10 years andwas greeted with an immediate cash crisis. Persistent (and apparentlyaccurate) rumors were circulating that the company might not be able tomeet its January 1995 payroll obligations.
The new team unveiled a multifaceted turnaround strategy labeled the“Go Forward Plan.” Three actions were taken to improve on-time arrivaland departure performance: changing airport managers, improving theflight schedule, and introducing a group incentive scheme that paid amonthly bonus if a firm-wide on-time performance goal was met.4 Thenew flight schedule was implemented on January 9, 1995, and was de-signed to make on-time arrivals and departures feasible by reducing sched-ule conflicts and increasing turnaround times (slack) for equipment andpersonnel. The changes in airport managers involved replacing or rotatingthe senior manager at every airport, with the changes occurring through-out 1995 and 1996.
The bonus scheme was announced on January 15, 1995, and promised$65 to every hourly employee (including part-time employees) in everymonth that Continental’s on-time performance ranked among the top fivein the industry. The rankings were based on the proportion of flightsarriving on time (within 15 minutes of schedule) as reported by the De-partment of Transportation (DOT). In months when the bonus was paid,checks for the full $65 were distributed by managers to the approximately35,000 eligible employees, at a cost of approximately $2.3 million (ad-ditional taxes for the bonus were deducted from regular payroll pay-ments). The program began in February 1995 and continued unchangeduntil December of that year. In 1996, the scheme was modified, paying$65 in months in which Continental ranked second or third (in on-timearrival) and $100 when it finished first.5
There are several features of on-time arrival that made it an attractiveperformance measure. First, on-time arrival was accurately measured and
3 This assessment is based on Continental’s 1994 and 1995 annual reports andthe Department of Transportation’s Air Travel Consumer Reports, which reportmonthly on-time arrival, baggage handling, and customer complaint statistics forthe 10 major domestic airlines.
4 Other elements of the Go Forward Plan are described in more detail in thecompany’s annual reports.
5 It is interesting that this change was planned when the scheme was first in-troduced. After describing the new bonus plan in the 1994 annual report, theCEO predicted that the performance goal would increase as performanceimproved.
748 Knez and Simester
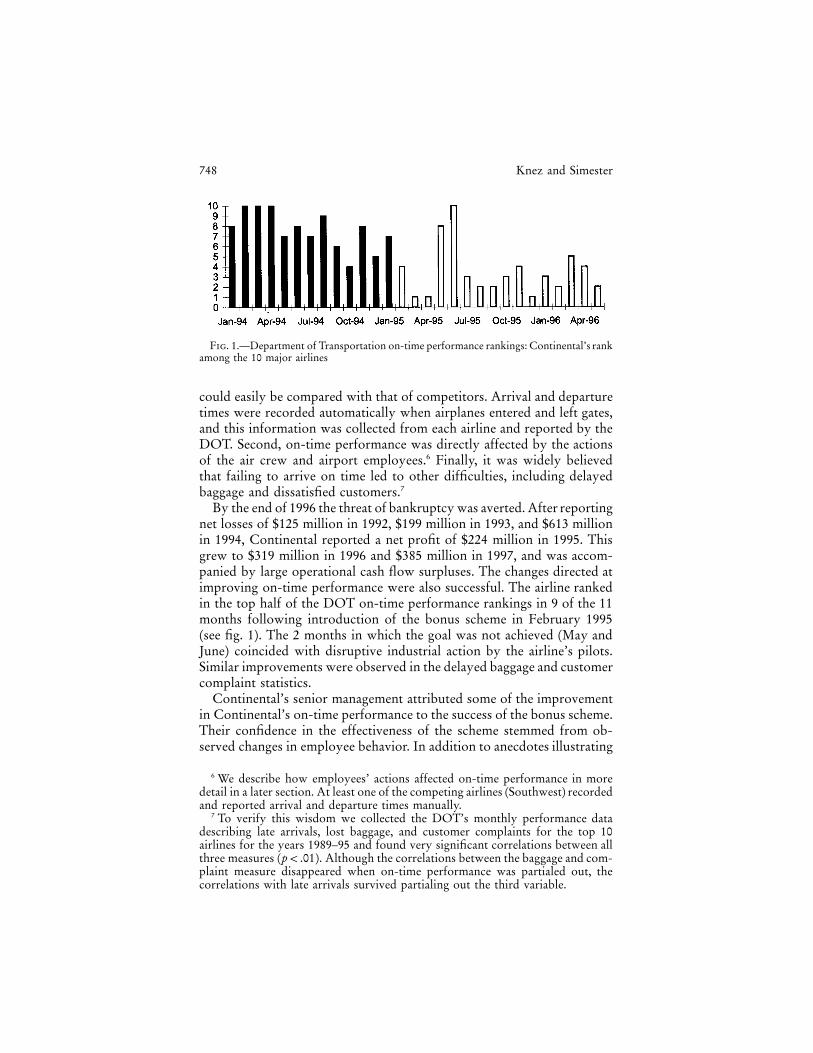
Fig. 1.—Department of Transportation on-time performance rankings: Continental’s rankamong the 10 major airlines
could easily be compared with that of competitors. Arrival and departuretimes were recorded automatically when airplanes entered and left gates,and this information was collected from each airline and reported by theDOT. Second, on-time performance was directly affected by the actionsof the air crew and airport employees.6 Finally, it was widely believedthat failing to arrive on time led to other difficulties, including delayedbaggage and dissatisfied customers.7
By the end of 1996 the threat of bankruptcy was averted. After reportingnet losses of $125 million in 1992, $199 million in 1993, and $613 millionin 1994, Continental reported a net profit of $224 million in 1995. Thisgrew to $319 million in 1996 and $385 million in 1997, and was accom-panied by large operational cash flow surpluses. The changes directed atimproving on-time performance were also successful. The airline rankedin the top half of the DOT on-time performance rankings in 9 of the 11months following introduction of the bonus scheme in February 1995(see fig. 1). The 2 months in which the goal was not achieved (May andJune) coincided with disruptive industrial action by the airline’s pilots.Similar improvements were observed in the delayed baggage and customercomplaint statistics.
Continental’s senior management attributed some of the improvementin Continental’s on-time performance to the success of the bonus scheme.Their confidence in the effectiveness of the scheme stemmed from ob-served changes in employee behavior. In addition to anecdotes illustrating
6 We describe how employees’ actions affected on-time performance in moredetail in a later section. At least one of the competing airlines (Southwest) recordedand reported arrival and departure times manually.
7 To verify this wisdom we collected the DOT’s monthly performance datadescribing late arrivals, lost baggage, and customer complaints for the top 10airlines for the years 1989–95 and found very significant correlations between allthree measures ( ). Although the correlations between the baggage and com-p ! .01plaint measure disappeared when on-time performance was partialed out, thecorrelations with late arrivals survived partialing out the third variable.
Mutual Monitoring 749
an increase in employee effort and mutual monitoring of co-workers, theycited reductions in employee turnover, on-the-job injuries, and sick days.When we asked about the possibility that the improvements were due toother changes, we were reminded that the bonus program was the primaryactivity directed at improving employee performance. At the suggestionof the senior managers we interviewed employees and/or airport managersat several Continental airports. Employees and airport managers almostuniversally volunteered the bonus scheme as one of the reasons for theturnaround in Continental’s on-time performance.8 Many employees be-lieved that the success of the scheme was self-evident. After recognizingthat it had affected their behavior, employees at one airport argued forintroduction of a similar scheme to improve performance elsewhere inthe company.
The incentive scheme was also self-funding. After introduction of thescheme fewer Continental customers missed connections and had to bereaccommodated on other airlines, and other airlines used Continentalmore frequently to reaccommodate their own customers. This yieldedadditional cash flow of over $8 million per month, yet the cost of theincentive scheme was less than $3 million per month (Brenneman 1998).
In the remainder of this section, we attempt to isolate the impact ofthe firm-wide bonus scheme to determine whether the scheme did in factcontribute to the performance improvements. We do so by exploitingContinental’s use of outsourcing at several airports. Because only Con-tinental employees were eligible for the bonus scheme, the bonus was notexpected to affect behavior where activities were outsourced. Hence, ifthe bonus scheme was effective we would expect smaller performanceimprovements at airports that were outsourced. In contrast, the changesin both the flight schedule and airport management were system-wide,designed to improve performance at every airport (Continental had man-agers at all airports, including locations at which activities wereoutsourced).
If the bonus scheme was effective, we might have expected introductionof similar on-time performance bonuses in outsourcing contracts. Dis-cussions with Continental management revealed that these contracts typ-ically did include bonuses for achieving on-time performance goals. How-ever, there was no systematic change in these bonuses during the courseof the study. Moreover, several contracting difficulties limited the size ofperformance bonuses in outsourcing contracts. First, due to interdepen-dencies between flights, on-time performance at one airport was affectedby the behavior of employees at other airports. Second, if the compen-sation received by outsourcing partners depended largely on performanceat their airport, the resulting focus on performance at that airport may
8 We describe the interview process in detail in a later section.
750 Knez and Simester
have had a detrimental impact on the rest of the system.9 Finally, con-trolling for environmental factors by comparing performance with therest of the industry was difficult at an airport level. Individual airportstended to be serviced primarily by two to three carriers, so that scaledifferences make comparisons difficult.
All of our data (except for local weather conditions) were provided byContinental Airlines. We begin by describing our dependent measure andthe nature and extent of outsourcing at the 32 domestic airports in thestudy. These 32 airports include Continental’s three hubs, its busiest non-hub domestic destinations and a sample of smaller locations (the 32 air-ports represent a large portion of Continental’s domestic route structure).To control for differences between airports we introduce a series of controlvariables and compare the improvements in on-time performance underthese controls. We finish this section by reviewing alternative explanationsfor the results.
Dependent Measure: Change in On-Time Departure Performance
Our primary dependent measure is the change in on-time departureperformance at each airport. Focusing on change in performance allowsus to control for the numerous unobservable (exogenous) factors thataffected performance at each airport. The decision to use on-time depar-ture rather than arrival was made after discussions with airport managersrevealed that departure measures more accurately reflect individual airportperformance. On-time arrival performance is subject to delays on depar-ture or in flight, which are largely outside the control of the destinationairport.
A departure was considered on time if it left the gate within 15 minutesof the scheduled departure time (a standard industry measure). For eachof the 32 airports in the study, Continental provided us with monthlydata describing the proportion of flights that departed on time for theperiod January 1994 through November 1996. The measures are extremelyaccurate (they are recorded electronically when planes depart from thegates) and summarize performance for an average of approximately 1,000monthly flights at each airport. We focus on the first month that em-ployees could receive the bonus (February 1995) through the end of thedata period (November 1996). Our dependent measure (Improvement)was calculated as the proportion of flights that departed on time in the
9 Analogous reasoning explains why payment of the performance bonus wasnot extended to employees of the outsourcing partners. This may have led tothese employees focusing on Continental flights to the detriment of other flightsthat they service.
Mutual Monitoring 751
Table 1Summary of Outsourcing Activity
Airport Type of OutsourcingDate Outsourcing
Was Introduced
Las Vegas Full October 1994Phoenix Full October 1994Seattle Full April 1995Salt Lake City Full February 1995Washington, D.C. Partial Before 1994Denver Partial November 1994Detroit Partial April 1995Orlando Partial Before 1994San Diego Partial Before 1994Tampa Partial Before 1994
month minus the percentage that departed on time in the correspondingmonth in 1994.10
Outsourcing
The independent variable of interest is the presence or absence of out-sourcing. The activities at each airport were divided into two main cat-egories: ramp and gate operations. The ramp operations included guidingin and pushing out aircraft and loading and unloading baggage. Gateoperations comprised ticketing and checking in passengers, updating pas-sengers’ documentation and reservations, answering passenger queries,positioning the air-bridge, and enplaning and deplaning passengers. Inaddition there were some incidental activities that were performed byseparate (often outsourced) employees, including fueling, catering, clean-ing, and maintenance. We received data describing whether gate and/orramp activities were outsourced at each airport.
Outsourcing of gate and/or ramp activities to other airlines or ground-handling firms occurred at 10 of the 32 airports in the sample (see table1). We distinguished between full and partial outsourcing using two di-chotomous variables: Full Outsourcing and Partial Outsourcing. Inmonths in which an airport was fully outsourced, the Full Outsourcingvariable was set equal to one, and in other months the variable was setequal to zero. The Partial Outsourcing variable was constructed in ananalogous manner.
Discussions with airport managers revealed that the introduction ofoutsourcing typically leads to a 2–3-month period of upheaval while the
10 For example, the dependent measure for July 1995 equals the proportion offlights that departed on time in July 1995 minus the proportion of flights thatdeparted on time in July 1994. The dependent measure for July 1996 equals theproportion of flights that departed on time in July 1996 minus the proportion offlights that departed on time in July 1994.
752 Knez and Simester
outsourced employees learned how to integrate Continental’s flights intotheir other operations. These short-term distortions could increase ordecrease Improvement (the dependent variable) depending on whetheroutsourcing was introduced in 1994 or 1995. To ensure that we did notmisattribute any short-term effects of outsourcing we constructed a var-iable to identify the 3 months following the introduction of outsourcingand allowed this variable to take values of one, zero, and negative one.If outsourcing was introduced less than 3 months before the currentmonth, the variable took a value of one; if it was introduced in 1994within 3 months of the corresponding (comparison) 1994 month, it tooka value of negative one; otherwise it was zero. Two separate variableswere calculated in this manner to describe the introduction of full andpartial outsourcing. Later in this section we discuss the factors that ledto outsourcing at some airports and the impact that the introduction ofoutsourcing had on on-time performance.
Control Variables
To control for possible systematic variance between outsourced andnonoutsourced airports we collected several measures of airport differ-ences. Our first concern was to identify factors that determined whichairports were outsourced. Discussions with the Chief Operating Officer(COO), who was responsible for the introduction of additional out-sourcing in 1994 and 1995, identified cost as the only criterion. Infrequentflights lead to equipment (tugs, luggage carts, de-icing trucks) lying idleand create difficulties in scheduling employees. As a result, ramp oper-ations can often be performed at lower cost by an airline or ground-handling firm that also services other flights at the same airport. Econ-omies of scale are not as large in gate operations where equipment(computer terminals) is specific to each airline and has to be suppliedirrespective of outsourcing.11
We collected four measures to control for scale differences betweenairports. First, the variable Continental’s Scale describes the monthlynumber of departures from each airport in each month (in thousands).The second scale variable, Continental’s Presence, reflects the proportionof an airport’s flights that were operated by Continental and is intendedto control for the availability of scale economies through outsourcing.The variable was calculated by dividing the number of monthly Conti-nental departures by the total number of departures across all airlines ateach airport for that month. Because it takes longer to load passengersand baggage when flights are full we calculated an approximate load factoreach month by dividing the number of passengers by the number of flights
11 Increased control of customer interactions was also suggested as an expla-nation for why gate operations are less likely to be outsourced.
Mutual Monitoring 753
(Load Factor). Finally, changes in the scale of Continental’s operationsat any airport may have affected performance either because greater com-plexity made coordination more difficult or because employees wereharder to monitor. To control for changes in scale we calculated the av-erage percentage change in the number of monthly departures (Changein Continental’s Scale) from the corresponding month in 1994.12
We were concerned that poor on-time performance in 1994 may havecontributed to the decision to outsource some airports. This was deniedby management, who claimed that outsourcing was determined solely bycost factors. Nevertheless, to control for this issue we calculated a measureof each airport’s 1994 on-time performance (1994 Performance). Thismeasure represented the percentage of flights departing on time for thecorresponding month in 1994. Including 1994 Performance as an inde-pendent variable also accounts for possible regression to the mean due tostochastic factors not captured by the other variables. Moreover, it ex-plicitly recognizes the possibility that it may be harder to improve per-formance when initial performance is high (we also address this issue withadditional analysis in later discussion).
The literature on organizational change suggests that resistance tochange increases with employee tenure. We included two variables de-scribing the average service time of nonmanagement employees at eachairport, where the two variables distinguished between part-time and full-time employees (Part-Time Service and Full-Time Service). This distinc-tion was prompted by discussions with airport managers, who observedthat part-time employees at partially outsourced airports were often em-ployees who had full-time positions prior to outsourcing and sought toreturn to that status. These employees generally had longer service recordsand were more highly motivated than other part-time employees who didnot have career ambitions with Continental. Service time measured yearsemployed in any capacity at Continental as of November 1996 (the datefor which we had data). Because service time was not available for out-sourced employees, for the four fully outsourced airports we used themean for the other 28 airports.13
To control for the possibility that sustained periods of poor weathermay have affected performance at some airports, we included a measureof weather differences (Weather) between each month and the corre-sponding month in 1994. The data were provided by the National Climatic
12 We also considered hub effects and nonlinear scale effects. The data did notsupport these effects and so, for the sake of brevity, we omit them from thediscussion.
13 Setting these variables to either the mean of the 22 nonoutsourced airportsor the mean of the six partially outsourced airports (for the four fully outsourcedairports) made little difference to the findings.
754 Knez and Simester
Data Center (NCDC) and measured monthly precipitation (in hundredsof inches) at each airport.
If flight schedule changes favored the nonoutsourced airports we wouldexpect to see larger performance improvements at these airports. Otherthan a possible focus on the hub cities (which would be reflected in ourattempts to identify scale effects) we have no reason to expect that flightschedule changes benefited the nonoutsourced airports more than theoutsourced airports. However, the change in on-time arrival at each airportmay offer a way to test and control for this possibility. The ramp andgate activities occurred after a flight arrived and before it departed. As aresult, although schedule changes were expected to influence both arrivaland departure performance, on-time arrival was less likely to be influencedby ramp and gate activities than on-time departure. Hence, improvementsin on-time arrival offer a measure of schedule improvements that is some-what independent of any change in the behavior of ramp and gate em-ployees at that airport.14 The Schedule Improvement variable measuresimprovement in on-time arrival by subtracting average on-time arrivalperformance from performance in the corresponding month in 1994. Aflight is considered on time if it arrived within 15 minutes of the scheduledarrival time, and (like departures) these data are recorded electronicallyand instantly transmitted to Continental’s Houston operations center.
Continental employed an airport manager at all of the airports in thesample, including the partially and fully outsourced airports. At all butfour airports the airport managers were changed during the measurementperiod. It is possible that these management changes may have affectedthe outsourced and nonoutsourced airports differently, either because onegroup of airports received the better managers or because the role ofmanagers varies at outsourced airports. To address these possibilities thevariable New Manager was set equal to one in months after a managementchange and zero otherwise. We then separately interacted New Managerwith Full Outsourcing and Partial Outsourcing to allow the effects of amanagement change to vary across outsourced and nonoutsourcedairports.
There are two airports in our sample for which operations were closeddown and then later restarted during our measurement period. One ofthese airports was fully outsourced when it reopened and the other wasnot outsourced. Although we were unable to get detailed information on
14 To the extent that arrival performance also reflects behavior changes due tothe on-time bonus, inclusion of this control will (conservatively) lead to under-estimation of the impact of the bonus. To support the claim that ramp and gateemployees have less influence over on-time arrival performance than departureperformance we used the outsourcing and control variables to predict the im-provement in on-time arrivals. As we expected, the outsourcing coefficients werenot significant (see later discussion).
Mutual Monitoring 755
Table 2Descriptive Statistics
Variables Mean Standard Deviation
Improvement 5.19 7.04Full Outsourcing .12 .33Partial Outsourcing .19 .393 Months after Full Outsourcing .01 .163 Months after Partial Outsourcing .00 .10Continental’s Scale .93 1.83Continental’s Presence .12 .20Load Factor 80.14 21.87Change in Continental’s Scale �.17 .361994 Performance 83.02 7.19Part-Time Service 6.04 2.92Full-Time Service 10.37 3.81Weather 300.41 270.99Schedule Improvement (Arrivals
Improvement) 4.78 10.33New Manager .49 .50New Manager with Full Outsourcing .05 .22New Manager with Partial
Outsourcing .09 .28Reopened .03 .18
Note.—The sample size for each variable is 648 (the sample used in the multivariate analysis).
changes that occurred at these two airports, the changes were apparentlymore wide-ranging than at other airports. The variable Reopened was setequal to one in months after these two airports had been reopened andzero otherwise.
Results
Summary statistics for all of the variables are presented in table 2 (sam-ple sizes vary due to missing data, caused largely by airport closures). Asimple comparison of means suggests that the level of outsourcing didmoderate the improvement in on-time performance. The average im-provement at nonoutsourced airports was 5.6% (from 82.4% to 88.0%),which compares with an improvement of just 4.9% at partially outsourcedairports and 2.8% at fully outsourced airports. The difference betweenthe nonoutsourced and fully outsourced airports is statistically significant( ), as is the difference between the partially and fully5.6 1 2.8, p ! .01outsourced airports ( ).4.9 1 2.8, p ! .05
Although we omitted months immediately following the introductionof outsourcing from these means, this comparison does not control forscale, weather, or any of the other sources of systematic variation betweenoutsourced and nonoutsourced airports that were expected to affect therate of improvement. To control for the effects of the pilots’ strike andother fixed monthly effects we included dummy variables separately iden-tifying the 22 months in the sample (February 1995 through November
756 Knez and Simester
Table 3Results of Multivariate Analysis
Variables Full Model Basic Model
Full Outsourcing �3.42 (.66) �1.52 (.81)Partial Outsourcing �1.63 (.58) �.37 (.46)3 Months after Full Outsourcing �4.34 (1.13) �7.31 (2.08)3 Months after Partial Outsourcing �2.53 (1.12) �7.69 (2.59)Continental’s Scale �.53 (.23)Continental’s Presence 4.57 (2.08)Load Factor �.03 (.01)Change in Continental’s Scale �2.11 (.85)1994 Performance �.55 (.03)Part-Time Service .41 (.09)Full-Time Service �.13 (.06)Weather �.31 (.06)Schedule Improvement (Arrivals
Improvement) .20 (.03)New Manager �1.60 (.42)New Manager with Full Outsourcing 2.16 (1.07)New Manager with Partial
Outsourcing 1.39 (.66)Reopened 4.91 (1.69)
Note.—Standard errors are in parentheses. The dependent variable is Improvement. The sample sizeand adjusted R2 are 680 and .39 for the basic model and 648 and .76 for the full model.
1996).15 Given the panel nature of the data and the use of 1994 data as acommon benchmark, we used generalized least squares (GLS) to correctthe standard errors. The results are presented in table 3, omitting estimatesof the fixed monthly effects. As a basis for comparison we also presenta much simpler version of the model, in which we control only for theshort-term effects of introducing outsourcing together with the fixedmonthly effects.
In the full model the coefficients for Full Outsourcing and Partial Out-sourcing are significantly less than zero ( ) and indicate that im-p ! .01provements at the fully and partially outsourced airports were signifi-cantly smaller than at the nonoutsourced airports. The relative magnitudesof the two coefficients suggests that improvements diminished with thelevel of outsourcing (the difference in the magnitude of the two coeffi-cients is significant, ). These findings could be interpreted as evi-p ! .05dence that the bonus scheme improved the performance only of thoseemployees eligible to receive it. If so, the findings offer support for claimsby Continental’s employees and senior management that the bonus pro-gram did have an impact on employee performance. The outsourcing
15 We do not include fixed airport effects because our outsourcing variables arelargely invariant across time. This suggests that it may be appropriate to aggregatethe time-series data and conduct a cross-sectional comparison of improvement inon-time performance across the 32 airports. The results when data are aggregatedin this manner are described in later discussion.
Mutual Monitoring 757
coefficients are also both negative in the basic model. We caution thatinterpreting the coefficients in this model is difficult, as the omission ofrelevant variables is likely to have biased the coefficients.
The other coefficients in the full model are also of interest, at least tothe extent that they accord with their predicted effects:
Outsourcing appeared to have a particularly detrimental impact onperformance in the 3 months immediately following its introduction.
High load factors, many departures (a large scale), and an increase inscale all acted to restrict improvements. Improvements appeared tobe larger at airports at which Continental had a greater presence.
The negative coefficient for 1994 Performance is consistent with bothregression to the mean and fewer opportunities to improve wheninitial performance is already high. The accuracy of the performancemeasures favors the initial performance interpretation, although re-gression to the mean may result from other stochastic factors.
The employee service coefficients suggest that resistance to change in-creases with the tenure of full-time employees. In contrast, the rateof improvement increases with the tenure of part-time employees.
Deterioration in the weather does appear to lead to flight delays.When on-time arrival performance improved, on-time departure per-
formance also improved.Management changes appear to have had a more favorable effect at
airports with more outsourcing. This could be due to reassignmentof the better managers to the outsourced airports or could reflect thedifferent role of managers at outsourced airports.
There were larger improvements in on-time performance following thetemporary closures of the two reopened airports.
In response to a reviewer’s concern that the arrivals measure may havebiased the other coefficient estimates, we reestimated the model afteromitting this measure. There was very little change in the coefficients forthe remaining variables. We also reestimated the full model using theimprovement in arrivals as the dependent measure. Neither of the out-sourcing coefficients were significant ( ), which is consistent withp ! .10our interpretation that ramp and gate crews at the arriving airport haveless influence on the timing of arrivals than departures. We also furtherinvestigated the two service measures by including a variable describingthe proportion of part-time employees at each airport. The coefficientwas not close to significance, and inclusion of this variable had little effecton the other coefficients.
Although the results in table 3 support the claim that the bonus programhad a direct impact on employee performance, the limited temporal var-iance in the two outsourcing variables may lead to concern as to whethera pooled time-series approach is appropriate. Recognizing this concern,we considered an alternative approach under which the data for each
Note.—Standard errors are in parentheses. The dependent variable is Improvement. The sample sizefor all three models is 32. The adjusted R2 is .003 for the basic model, .54 for the full model, and .61for the stepwise model.
airport are aggregated and a comparison is made between the outsourcedand nonoutsourced airports.
Aggregate Model
We compare on-time performance in the 9 months between January1996 and September 1996 with on-time performance between January1994 and September 1994. These time periods exclude the pilot’s strike,most of the management changes, and the introduction of outsourcing in1995 and at the end of 1994. The dependent variable was aggregated torepresent the difference at each airport in average on-time performancebetween the period January 1996–September 1996 and the period January1994–September 1994. An analogous approach was used to average thevarious scale measures, 1994 Performance, Weather, Schedule Improve-ment, and the management change variables. The remaining variables didnot vary over the respective aggregation periods. We estimated three mod-els, and the coefficients for these models are presented in table 4. Thefirst model includes just the two outsourcing variables, and the secondmodel includes all of the relevant control variables. In the third model,we used stepwise regression to select variables.
Both outsourcing coefficients variables entered the stepwise model. Theoutsourcing coefficients all maintained their negative signs, and the relativemagnitudes are generally consistent with the corresponding models in
Mutual Monitoring 759
table 3 (the larger standard errors are consistent with the loss of statisticalpower due to aggregation). It appears that despite the conservative natureof this approach the evidence that on-time performance improvementswere smaller at the outsourced airports is robust. Reassuringly, the co-efficients for the other variables estimated in the full model are also gen-erally consistent with those reported in table 3. We turn next to a dis-cussion of alternative explanations for the outsourcing results.
Introduction of Outsourcing
Outsourcing was introduced during our measurement period at all fourfully outsourced airports and at two partially outsourced airports. Ourresults suggest that the introduction of outsourcing led to short-termdisruptions in performance. If the negative effects of outsourcing weremore enduring, the introduction of outsourcing could explain the smallerobserved improvements in performance where it was introduced. Thereare reasons to believe that this was not the case.
Focusing on the two airports at which partial outsourcing was intro-duced (Denver and Detroit) with the four airports at which it was alreadypresent reveals a larger improvement where it was introduced. BetweenFebruary 1995 and November 1996 the average improvement in on-timedeparture at Denver and Detroit was 6.2%, compared to an average im-provement of just 4.4% at Washington, D.C., Orlando, San Diego, andTampa. If the introduction of outsourcing had worsened performance,we would expect to have seen smaller (not greater) performance increasesat these two airports.
We also reestimated the models in table 3 after separating the PartialOutsourcing variable into two variables denoting partial outsourcing priorto 1994 and partial outsourcing in 1994 and 1995. In the full model thesecoefficients were both negative, and in the basic model the coefficientswere consistent with the average improvements at Denver and Detroitand the other four partially outsourced airports (reported above). In par-ticular, in the reestimated basic model the partial outsourcing coefficientfor Denver and Detroit was positive and the coefficient for the other fourairports was negative. If the introduction of outsourcing had worsenedperformance we would have again expected smaller improvements at Den-ver and Detroit than at the four airports that were partially outsourcedbefore 1994.16
16 Furthermore, the average 1994 on-time performance at the four airports out-sourced prior to 1994 was higher than the average of the other 28 airports. Ifoutsourcing had a negative effect on performance we would expect lower (nothigher) 1994 performance at the four airports that were partially outsourced in1994.
760 Knez and Simester
Table 5Initial Performance and Management Changes
Variables Column 1 Column 2
Full Outsourcing �3.74 (.65) �3.66 (.60)Partial Outsourcing �2.11 (.58) �1.92 (.69)3 Months after Full Outsourcing �4.54 (1.05) �4.68 (1.04)3 Months after Partial Outsourcing �1.75 (1.22) �4.34 (1.47)Continental’s Scale �.28 (.21) .15 (.28)Continental’s Presence 2.78 (1.99) �.78 (2.68)Load Factor �.03 (.01) �.06 (.01)Change in Continental’s Scale �1.78 (.65) �2.49 (.91)1994 Performance �.58 (.03) �.58 (.05)Part-Time Service .57 (.09) .58 (.12)Full-Time Service �.17 (.05) �.29 (.07)Weather �.23 (.06) �.41 (.07)Schedule Improvement (Arrivals
Improvement) .21 (.02) .18 (.03)New Manager �1.55 (.44)New Manager with Full Outsourcing 1.74 (1.01)New Manager with Partial
Note.—Standard errors are in parentheses. The dependent variable is Improvement. In column 1 thefour nonoutsourced airports with the worst 1994 on-time departure performance are omitted, and incolumn 2 the months following a change in airport management are omitted. The sample size and adjustedR2 equal 581 and .77 for column 1 and 328 and .81 for column 2.
Higher Initial Performance at Outsourced Airports
On-time departure performance was on average 1.3% better at the 10outsourced airports than at the 22 nonoutsourced airports. Higher initialperformance at the outsourced airports is consistent with Continental’s1994 standing as the worst-performing major airline. However, if it washarder to improve airports that were already performing well, higherinitial performance may explain the smaller improvements observed atthe outsourced airports. We controlled for this possibility by includinga measure of each airport’s 1994 on-time performance (1994 Performance)in our analysis. We also reanalyzed the data after rescaling the performancemeasures using a log odds scale. The findings were unaffected by thischange. As further confirmation that our results were not due to differ-ences in initial conditions, we reestimated the model, omitting the fournonoutsourced airports that had the worst 1994 performances. Averageon-time performance in 1994 at the remaining 18 nonoutsourced airportswas slightly higher (0.14%) than at the 10 outsourced airports. The find-ings are presented in the first column of table 5 and confirm that theresults are robust to this modification. It appears that the smaller im-provements associated with outsourcing cannot be explained by higherinitial performance at the outsourced airports.
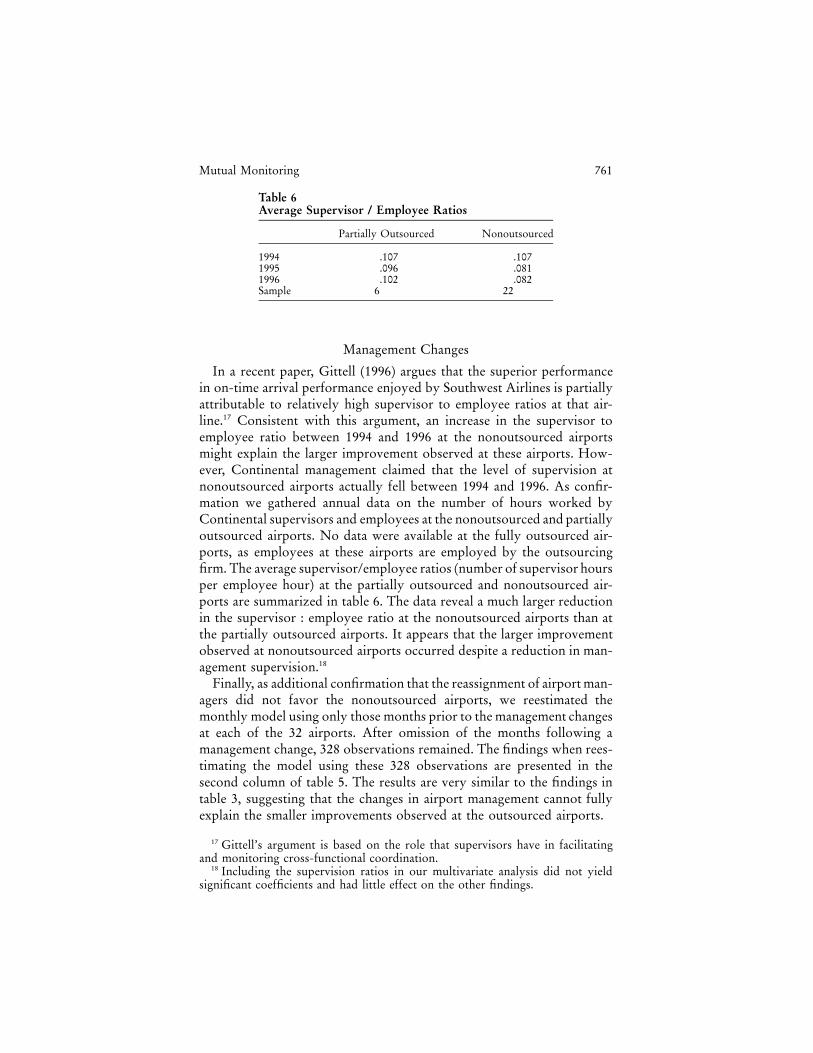
In a recent paper, Gittell (1996) argues that the superior performancein on-time arrival performance enjoyed by Southwest Airlines is partiallyattributable to relatively high supervisor to employee ratios at that air-line.17 Consistent with this argument, an increase in the supervisor toemployee ratio between 1994 and 1996 at the nonoutsourced airportsmight explain the larger improvement observed at these airports. How-ever, Continental management claimed that the level of supervision atnonoutsourced airports actually fell between 1994 and 1996. As confir-mation we gathered annual data on the number of hours worked byContinental supervisors and employees at the nonoutsourced and partiallyoutsourced airports. No data were available at the fully outsourced air-ports, as employees at these airports are employed by the outsourcingfirm. The average supervisor/employee ratios (number of supervisor hoursper employee hour) at the partially outsourced and nonoutsourced air-ports are summarized in table 6. The data reveal a much larger reductionin the supervisor : employee ratio at the nonoutsourced airports than atthe partially outsourced airports. It appears that the larger improvementobserved at nonoutsourced airports occurred despite a reduction in man-agement supervision.18
Finally, as additional confirmation that the reassignment of airport man-agers did not favor the nonoutsourced airports, we reestimated themonthly model using only those months prior to the management changesat each of the 32 airports. After omission of the months following amanagement change, 328 observations remained. The findings when rees-timating the model using these 328 observations are presented in thesecond column of table 5. The results are very similar to the findings intable 3, suggesting that the changes in airport management cannot fullyexplain the smaller improvements observed at the outsourced airports.
17 Gittell’s argument is based on the role that supervisors have in facilitatingand monitoring cross-functional coordination.
18 Including the supervision ratios in our multivariate analysis did not yieldsignificant coefficients and had little effect on the other findings.
762 Knez and Simester
Summary
We have presented evidence that improvements in on-time performancewere larger at nonoutsourced airports than at airports that were out-sourced. This evidence is consistent with the claims of Continental em-ployees and senior management who attributed Continental’s perform-ance improvement (at least in part) to changes in employee behavior dueto the bonus scheme. As support for this interpretation, we identified andexcluded several alternative explanations. In particular, we controlled fora variety of airport differences, including factors determining which air-ports were outsourced. We were also able to present evidence suggestingthat reassignment of airport management, changes in the outsourcingstatus of some airports, changes in the level of employee supervision, anddifferences in 1994 performance cannot fully explain the result. The dif-ferent improvements observed at the outsourced and nonoutsourced air-ports might be explained by other (nonmanagement) changes that sys-tematically affected just one of the groups of airports. For example, theintroduction of more efficient equipment or computers at the nonout-sourced airports or labor difficulties at the outsourced airports might offerexplanations. However, when asked, senior managers were unable to iden-tify any such systematic changes. They noted that outsourcing partnersare carefully monitored and that Continental would respond quickly inthe event of adverse changes.
Continental’s bonus scheme has been mimicked by at least one of itscompetitors. TWA also had a history of languishing at the bottom of theDOT’s performance ratings, ranking last in on-time arrivals in 1995 and1996 (a position occupied by Continental in previous years). In June 1996,TWA began paying all employees at director level and below monthlybonuses of up to $100 for improving its ratings. After the introductionof these incentives TWA improved steadily, and by June 1997 it reacheda ranking of first in on-time arrivals—its highest monthly ranking sinceJanuary 1993. In the 6-month period between May and October 1997 anaverage of 85.3% of TWA flights arrived on time, compared to just 69.9%over the same period in the previous year.19 We caution that TWA’s em-ployee incentives were accompanied by other operational changes thatmay have contributed to this improvement.
We conclude that the data are not able to rule out the claim that thebonus scheme was effective, and this explanation remains as a possible(and perhaps likely) explanation for our findings. However, while theoutsourced airports provide a natural control group, this was far from acontrolled experiment. Other factors may also explain the larger im-provements at the nonoutsourced airports. Most worrisome are those
19 This 15.4% improvement compares with an increase of 2.4% at Continentalover the same period.
Mutual Monitoring 763
changes that are managerial in nature and not captured by any of ourcontrols, including the influence of the new senior management team andtheir efforts to motivate and communicate with the Continental employ-ees. These efforts included introduction of bulletin boards and a quarterlyemployee magazine, regular voice-mail and video statements from theCEO and increased visibility and accountability of senior managers.Moreover, while the findings suggest that the bonus scheme may havecontributed to the improvements in on-time performance, they do notsupport a conclusion that the bonus scheme alone was sufficient. In apersonal conversation discussing our results, the COO succinctly sum-marized this caution: “There are a handful of critical steps taken to turnaround Continental Airlines; the on-time bonus was one of them.”
In the next section, we offer an explanation for why the bonus schememay have been effective. We do so by addressing the threat of free ridingand investigating how mutual monitoring may have helped to resolve thisthreat.
III. Free Riding and Mutual Monitoring
The claimed success of Continental’s bonus scheme is surprising. Thescheme included approximately 35,000 employees who individually hada negligible influence on overall performance. Moreover, Continental’semployees were (are) geographically dispersed, restricting direct inter-actions and preventing them from observing the efforts of employees atother locations. We might expect these conditions to favor free riding andlimit the development of mutual monitoring. In this section, we arguethat, despite its size, Continental exploited the benefits of mutual mon-itoring, thus mitigating the free-riding problem. There are three steps toour argument. First, we argue that structure of airport operations facil-itates mutual monitoring between employees. Next we argue that theorganization of these airports in a highly interdependent flight schedulesupports an equilibrium where each group of employees collectivelychoose the same level of effort. Finally, we argue that Continental’s adop-tion of the incentive scheme together with other coinciding improvementsraised expectations that other airports were improving their on-time per-formance, enabling movement to the high effort equilibrium.
Free Riding and Mutual Monitoring in Large Firms
An incentive scheme like Continental’s is expected to raise efforts onlyif the additional likelihood of receiving the bonus is sufficient to com-pensate employees for working harder. Formally, an individual employeedeciding whether or not to work hard will do so if and only if bg 1 c,where b describes the value of the bonus, g denotes the incremental like-lihood that the bonus is paid when the employee works hard, and c
764 Knez and Simester
represents the amount required to compensate an employee for additionaleffort. Because a single employee has a negligible influence on overallperformance, we expect g to be very small. It is this observation thatmakes the apparent success of Continental’s bonus scheme so surprising.In general, we expect g to be a decreasing function of firm size (n) becauseoverall firm performance is less sensitive to the actions of individual em-ployees in large firms.
By paying all employees a bonus based on satisfaction of a commongoal, Continental’s incentive scheme introduces externalities between theefforts of employees and the welfare of their colleagues. Choice of loweffort by any employee not only reduces the probability that he or shewill receive the bonus, it also affects the likelihood that other employeeswill receive the bonus. This creates incentives for employees to monitortheir colleagues and encourage them to work harder. Mutual monitoring(sanctioning) can take on two forms. First, there is peer pressure in theform of direct sanctioning of co-workers who do not work hard, togetherwith peer pressure generated by the feeling of shame from not workingas hard as colleagues (Kandel and Lazear 1992).20 Second, an employeemay sanction a co-worker by reporting low effort to management. Eitherway, mutual monitoring is an additional penalty imposed on co-workerswho work below (or above) the effort norm established by the group.
There are two reasons to doubt that mutual monitoring will supporta high effort norm. First, to the extent that it is costly to monitor andsanction co-workers, there is an incentive to free ride on the monitoringand sanctioning efforts of other co-workers. Moreover, just like the first-order free-rider problem, the larger the group the greater the second-order free-rider problem. Hence, the likelihood of effective mutual mon-itoring is decreasing in both the size of the group and cost of the mutualmonitoring. Second, Continental’s employees were geographically dis-persed, restricting direct interactions and preventing them from observingthe efforts of employees at other locations. Both reasons have been usedpreviously to support forceful predictions that mutual monitoring willnot occur in large firms.21
Mutual Monitoring within Continental’s Autonomous Work Groups
Like other large U.S. airlines, Continental is characterized by a largenumber of autonomous work groups, with one or more work groups ateach airport. In this section, we argue that interdependence within and
20 Kandel and Lazear (1992) also consider the impact of guilt, which does notrequire that co-workers observe an employee’s effort.
21 See, e.g., Abreu, Pearce, and Stacchetti (1986), Heckathorn (1988), Coleman(1990), and Kandel and Lazear (1992).
Mutual Monitoring 765
between each work group, together with the highly standardized activitiesthat they perform, facilitates mutual monitoring.
The presence of autonomous work groups mitigates the second-orderfree-rider problem by reducing group size. This makes monitoring morefeasible and limits the opportunity to free ride on the monitoring andsanctioning efforts of colleagues. Furthermore, there are reasons to believethat the structure of airport operations dramatically reduces the cost ofmonitoring. Ramp and gate employees typically work alongside eachother performing overt tasks: pushing out or waving in aircraft, loadingand unloading baggage, and greeting and boarding passengers. As a result,they are well placed to observe the performance of fellow team members.Moreover, tasks are standardized and rotated, so employees have a com-mon understanding of what behavior distinguishes high and low effort.22
For example, employees unloading baggage from a cart have also spenttime inside the hold and can recognize whether delays are due to unusuallyheavy baggage or neglect by an employee in the hold. Finally, the or-ganization of employees into groups ensures repeated interactions withthe same colleagues, revealing habitual (rather than isolated) behavioralpatterns.
We might expect that working repeatedly alongside the same colleagueswould aggravate sanctioning costs by increasing the cost of damagingsocial relationships. However, Coleman (1990) argues that in the generalcontext of group norms, sanctioning need not be costly if there is con-sensus that a high effort “norm” has been violated. Consensus reducesthe costs of sanctioning for several reasons. First, it provides social supportto the individual that implements the sanction. Second, it may lead tosanctions implemented at the group level (e.g., ostracism from the group’ssocial interaction). Third, it may increase the likelihood of managerialsanctions against the violator. Finally, the mere knowledge that othergroup members will discuss a norm violator’s behavior may ensure com-pliance with the norm.23
Some of the factors that facilitate monitoring also facilitate consensus.Regular interaction with the same employees provides ample opportunityfor information about poor performance to be disseminated. Because thework process is standardized, there is a common and accurate interpre-tation of poor performance. Finally, a high degree of interdependencebetween group members causes the costs of norm violation (low effort)to be shared. Interdependence is introduced both by the bonus itself
22 Kandel and Lazear (1992) argue that higher levels of employee homogeneityfacilitate mutual monitoring by increasing the accuracy of the monitoring.
23 Coleman’s (1990) arguments rely in part on Merry (1984) and the role ofgossip in supporting social behavior. See also Burt and Knez (1995), who doc-ument the impact of gossip and third-party ties on levels of trust among managersin a very large high-technology firm.
766 Knez and Simester
(everyone cares about joint output) and the nature of the ramp and gateoperations. A flight cannot depart until the entire ramp and gate activitieshave been performed, so that poor performance by one employee cannegate good performance by the rest of the group. For example, main-tenance or fueling delays will prevent a flight from leaving on time, evenif passengers and baggage are loaded and the plane is otherwise ready toleave. Similarly, if the flight crew is slow to complete their preflight checks,passengers cannot be boarded despite the completion of catering andcleaning activities.
The nature and organization of the gate and ramp activities appear tosupport our claim that monitoring and sanctioning within Continental’swork groups were feasible and may not have been costly. Conditional ona work group agreeing to adopt a high effort norm, consensus that anemployee is performing poorly will develop quickly and support sanc-tioning. Although formal evidence of sanctioning and monitoring is hardto collect, we did learn of several examples that offer further support forour claim.
Anecdotal Evidence
As a part of our initial data-gathering exercise we interviewed the CEO,the COO, three supervisors, five ramp and gate employees, and airportmanagers at three of Continental’s airports (including its largest hub).Four of the ramp and gate employees were interviewed as a focus group.We asked questions concerning the overall structure of operations andobserved the process of performing ramp and gate activities. We also poseda series of open-ended questions directed at identifying perceived changesin employee behavior and the reasons for these changes.24 Care was takento avoid leading questions, especially concerning the bonus scheme. Theresponses and anecdotes that follow are firsthand accounts of employee,supervisor, and airport manager experiences.
A consistent response from the focus group discussion was the emer-gence of a team orientation that had been absent prior to 1995. We wereconcerned that employees were reciting the new corporate “mantra” andso asked for explicit examples of employees behaving “more like a team.”We were told that after introduction of the scheme, employees beganinitiating their own performance reviews whenever airport operationscaused a flight to be delayed. These meetings, which were neither attendednor sponsored by managers, focused on identifying sources of delay. Em-ployees also began contacting colleagues who had called in sick, to ask
24 For example, to prompt discussion of general changes in the work environ-ment we asked the following questions: How do you think the work environmenthas changed? What factors do you think have caused these changes? Which ofthese factors do you think is most important?
Mutual Monitoring 767
whether any assistance was needed. According to the employees, thesecalls enabled them to monitor whether the absences were due to validillnesses.25
We also heard several examples of employees sanctioning each other,including employees being summoned from break rooms by colleagues,employees being chastised for leaving their stations, and gate agents climb-ing into aircraft holds to identify and help overcome sources of delay. Inone example, employees themselves initially attempted to improve a col-league’s performance by providing additional training and reallocating histasks. When this did not resolve the problem, they reported the situationto management, which (after further opportunities to improve) led to thatemployee’s dismissal. An increase in the use of social sanctions was ap-parently particularly noticeable during the pilots’ industrial action in Mayand June of 1995. The industrial action had a dramatic effect, resultingin rankings of eighth and tenth in on-time performance for May and June(respectively).26 Gate and ramp employee reacted strongly, directly con-fronting pilots who were causing delays and withdrawing cooperationsuch as access to break rooms and recommendations for dining andground transportation.
During the focus group the employees volunteered the bonus schemeas an important factor influencing changes in their own behavior. Oneemployee stated that the bonus plan proved that management was serious,and another employee admitted, in a somewhat embarrassed tone, that$65 was an attractive incentive. These sentiments appeared to be sharedby the other employees.
Inducing Work Groups to Select High Effort
Although there is reason to believe that mutual monitoring occurredwithin Continental’s autonomous work groups, this is not sufficient toexplain the claimed success of the scheme (even if the incentive schemecontributed to the development of mutual monitoring). We must alsoexplain why the scheme was able to induce the groups to select highereffort.
As we discussed, an incentive scheme like Continental’s will raise effortsonly if the additional likelihood of receiving the bonus is sufficient tocompensate employees for working harder. When a group acts collectivelyit considers how joint efforts affect each group member. Whereas an
25 According to the manager of this airport, similar activities had also emergedat other airports.
26 See fig. 1. Recall that these were the only months in 1995 for which the bonuswas not paid following introduction of the scheme in February 1995. The airportmanager confirmed the employees’ response to both the poorly performing col-league and the pilots’ industrial action.
768 Knez and Simester
individual will work hard only if the group will collectively preferbg 1 c,high effort when where gn measures the impact of the collectivenbg 1 nc,n
decision on the probability of receiving the bonus. Because this proba-bility is more sensitive to the efforts of a group than to those of anindividual ( ) this condition is weaker than the incentive compatibilityg » gn
condition for an individual, and so the bonus scheme is more likely toinduce high effort.27 If Continental’s on-time performance is not sensitiveto the efforts of the individual work groups, inducing high effort wouldstill require a very large bonus.28 However, there are reasons to believethat Continental’s overall on-time performance is sensitive to individualgroup efforts. When a flight departs late, employees, equipment, and ter-minal gates are unavailable to service other arrivals and departures. Theproblem is further compounded when flights carry connecting passengersbecause departing flights may have to be delayed to allow passengers tomake their connections. The capacity to disrupt the entire route systemincreases the sensitivity of overall performance to individual group effortand reduces the bonus required to induce high effort.29
However, the same interdependencies that increase sensitivity may alsohinder change by introducing characteristics similar to a Leontief pro-duction function. If a group expects other groups to work hard it canensure good performance by also working hard. When other groups areexpected to perform poorly, output will be low irrespective of that group’sdecision. In this manner, common expectations of low (or high) effortare both self-fulfilling and reinforcing. This contributed to the problemsfacing Continental’s new management team at the start of 1995. The airlinehad endured a sustained period of poor performance and (in interviews)many employees recalled being skeptical that the incentive scheme wouldchange behavior of colleagues at other airports. Moreover, after enduring
27 The firm can influence this condition by varying the performance goal and/or the size of the bonus. Moreover, because the probability of attaining the goaldepends on the actions of other employees, behavior may depend on how othercolleagues are expected to behave. We return to both points in later discussion.
28 This could have led to the well-known budget-balancing problem in whichthe required bonuses exceeded (in aggregate) the value of joint output (Holmstrom1982).
29 Recall from our earlier discussion of outsourcing contracts that several factorsprevent the use of airport level incentives. First, scale differences make industrycomparisons difficult at the airport level. Second, interdependencies betweenflights cause on-time performance at one airport to depend on performance atother airports. Finally, rewarding employees for local improvements may causeeffort to be misdirected, focusing attention on local improvements to the detrimentof the rest of the system. This is well illustrated by the response to an earlierincentive scheme directed at pilots. Prior to 1995 pilots participated in a fuel-saving profit-sharing scheme—the less fuel they used, the more they earned. Asa result, pilots responded to on-time departures by flying at slower speeds.
Mutual Monitoring 769
years of bad management, the employees were naturally skeptical of man-agement’s ability to take the additional complementary steps required totranslate their higher effort levels into higher levels of on-timeperformance.
Continental’s management responded in several ways to overcome thisinherent and legitimate skepticism. First, they initially set a modest per-formance goal, so that small improvements were sufficient to ensure pay-ment of the bonus. Following a sustained period of improvement, thegoal was later raised to ensure that the bonus remained sensitive to eachgroup’s efforts (see earlier discussion). Second, expectations may havebeen favorably affected by attribution bias. Introducing the bonus schemeat the same time as the flight schedule improvement led to an immediateimprovement in performance, and employees could not easily determinewhether the performance improvements were due to the flight schedulechanges alone or also reflected improvements in the performance of otheremployees. The possibility that others were working harder made it op-timal to increase effort, which in turn raised the likelihood that otherswere working harder.30 Third, senior management undertook several in-itiatives to improve communication with employees.31 Under these ini-tiatives, senior management described their strategy for improving per-formance and responded to employee questions and complaints. Togetherwith the flight schedule improvement, it is reasonable to conjecture thatthese efforts increased the new management’s credibility and created com-mon expectations (across airports) that performance would improve.
Mutual monitoring does not explain why the bonus was extended toemployees who do not affect on-time performance, including, for ex-ample, telephone reservation personnel. When we asked why the schemewas offered to all employees and not just employees that affect on-timeperformance, the CEO responded (quite forcefully) that it was importantthat all employees understand that everyone’s effort and commitment toimprovement is critical. This may be interpreted as a strategy for rein-forcing senior management’s commitment to improving on-time per-formance by changing employee behavior.
Summary
We have argued that the claimed success of Continental’s incentivescheme was partly due to employees monitoring each other. Althoughthere are obstacles to monitoring in large firms, Continental was appar-
30 Under this interpretation the response of the employees to Continental’sbonus scheme is an example of a subjective equilibrium in a repeated game (seeKalai and Lehrer 1993).
31 We briefly reviewed these initiatives at the end of the previous section. Foradditional details, see Brenneman (1998).
770 Knez and Simester
ently able to overcame these obstacles due to the division of employeesinto autonomous work groups and the nature of its ramp and gate ac-tivities. Collusion within the work groups effectively reduced the agencyproblem from 35,000 individual workers to a single agent at smaller air-ports and a handful of groups at larger airports. We claimed that inter-dependencies between the performance of the different groups bothhelped and hindered the incentive scheme. The interdependencies helpedovercome the lack of group-level measures by making overall firm per-formance more sensitive to individual group efforts. However, by in-creasing the dependence of groups on each other, they also reinforcedlow effort. Continental appears to have responded to this hindrance byintroducing the bonus scheme together with other changes and varyingthe performance goal. Although the initial goal was attainable even ifsome groups did not improve, it was later raised so that it continued tobe sensitive to individual group decisions.
Other explanations that may have contributed to the claimed successof Continental’s incentive scheme include “efficiency wage” and “implicitincentives” arguments. The “efficiency wage” argument posits that raisingnet compensation increases the opportunity cost of being dismissed forshirking (Akerlof and Yellen 1986). Although this cannot explain evidencethat monitoring and sanctioning activities were heightened following in-troduction of the bonus program, it seems clear that employees were moresatisfied in 1996 than in 1994, as evidenced by the reported reduction inemployee turnover. Additional satisfaction represented a premium thatmay have prompted increased concern for retaining employment.
Theories of “implicit incentives” recognize that not all compensationis linked to explicit compensation. Promotions and social recognition mayprovide strong incentives, yet they rarely depend on explicit criteria ordeterministic decisions. It is possible that Continental’s incentive schemehelped to reveal the criteria used to apportion implicit rewards, so thatincreased effort was not motivated solely by the explicit monthly bonus.However, this argument faces two limitations. First, the importance ofon-time performance was not surprising. Employees almost certainly al-ready recognized that actions taken to improve on-time performancewould influence the allocation of implicit rewards. Second, baggage, cus-tomer complaint, and other performance measures also improved, sug-gesting that employee effort was increased rather than simply reallocated.
A more behavioral view of employee behavior might argue that weplace too much emphasis on the role of mutual monitoring. Employeesof Continental had endured years of poor working conditions and lowperformance, and there are presumably nonmonetary benefits in workingfor a successful organization. Continental employees could have beeninduced to work harder because they perceived that they were now partof a successful organization. Under this more behavioral view, the firm-
Mutual Monitoring 771
wide incentive scheme is one of several measures that helped raise per-formance expectations.
IV. Conclusions
We isolated the impact of the firm-wide bonus scheme introduced byContinental Airlines by comparing the change in performance at out-sourced and nonoutsourced airports. We found evidence that performanceimprovements were larger at nonoutsourced airports, which is consistentwith the bonus scheme raising the efforts of those employees eligible toreceive it. The result is robust, surviving several tests designed to rule outalternative explanations. However, the apparent success of the programis surprising: we might have expected that the incentives created by thescheme were too weak to prevent free riding. Our explanation for thissurprising result focuses on how mutual monitoring may mitigate freeriding by forcing employees to internalize the impact of their actions oneach other. In support of this explanation, we argued that the nature andorganization of Continental’s operations were particularly conducive tothe development of mutual monitoring between employees.
References
Abreu, Dilip; Pearce, David; and Stacchetti, Ennio. “Optimal CartelEquilibria with Imperfect Monitoring.” Journal of Economic Theory 39(1986): 251–69.
Akerlof, George, and Yellen, Janet. Efficiency Wage Models of the LaborMarket. New York: Cambridge University Press, 1986.
Alchian, Arman A., and Demsetz, Harold. “Production, InformationCosts, and Economic Organization.” American Economic Review 62(December 1972): 777–95.
Blasi, Joseph; Conte, Michael; and Kruse, Douglas. “Employee StockOwnership and Corporate Performance among Public Companies.”Industrial and Labor Relations Review 50 (October 1996): 60–79.
Brenneman, Gregory. “Right Away and All at Once: How We SavedContinental.” Harvard Business School 76 (September–October 1998):162–79.
Burt, Ron, and Knez, Marc. “Kinds of Third-Party Effects on Trust.”Rationality and Society 7 (1995): 255–92.
Coleman, James S. Foundations of Social Theory. Cambridge, MA:Harvard University Press, 1990.
Conte, Michael A., and Kruse, Douglas. “ESOPS and Profit-SharingPlans: Do They Link Employee Pay to Company Performance?”Financial Management 20 (Winter 1991): 91–100.
Cooke, William H. “Employee Participation Programs, Group-BasedIncentives, and Company Performance: A Union-Nonunion
772 Knez and Simester
Comparison.” Industrial and Labor Relations Review 47 (July 1994):594–609.
Gittell, Jody H. “Coordination, Control and Performance ofInterdependent Work Processes.” Working Paper no. 96-042.Cambridge, MA: Harvard Business School, 1996.
Heckathorn, Douglas D. “Collective Sanctions and the Creation ofPrisoner’s Dilemma Norms.” American Journal of Sociology 94(November 1988): 535–62.
Holmstrom, Bengt. “Moral Hazard in Teams.” Bell Journal of Economics13 (Autumn 1982): 324–40.
Kalai, Ehud, and Lehrer, Ehud. “Subjective Equilibrium in RepeatedGames.” Econometrica 61 (1993): 1231–40.
Kandel, Eugene, and Lazear, Edward P. “Peer Pressure in Partnerships.”Journal of Political Economy 100 (1992): 801–17.
Kruse, Douglas L. “Does Profit Sharing Affect Productivity?” Workingpaper. Piscataway, NJ: Rutgers University, June 1993.
Merry, S. E. “Rethinking Gossip and Scandal.” In Toward a GeneralTheory of Social Control, edited by D. Black, pp. 271–302. New York:Academic Press, 1984.
Welbourne, Theresa; Balkin, David; and Gomez-Mejia, Luis.“Gainsharing and Mutual Monitoring.” Center for Advanced HumanResource Studies Working Paper no. 93-12. Ithaca, NY: CornellUniversity, 1993.