43
FIRST HALF YEAR REPORT JANUARY–JUNE

F I R S T H A L F Y E A RR E P O R T
J A N U A R Y – J U N E

To enhance readability, registered trademarks as well as references to rounding differences are omitted in this publication.
BUSINESS PERFORMANCE 05Economic and Sector Development 05Income Statement 05Statement of Financial Position and Statement of Cash Flows 06
BUSINESS PERFORMANCE BY SEGMENT 08Western Europe 08North America 08Asia-Pacific 09Russia/CIS 09Latin America 09Emerging Markets 10
SUBSEQUENT EVENTS AND OUTLOOK 11Subsequent Events 11Outlook 11
FINANCIAL HIGHLIGHTS (IFRS) 03
OUR SHARE 04
CONSOLIDATED STATEMENT OF FINANCIAL POSITION 13
CONSOLIDATED INCOME STATEMENT 15
CONSOLIDATED STATEMENT OF COMPREHENSIVE INCOME 16
CONSOLIDATED STATEMENT OF CHANGES IN EQUITY 17
CONSOLIDATED STATEMENT OF CASH FLOWS 18
EXPLANATORY NOTES TO THE CONDENSED INTERIM CONSOLIDATED FINANCIAL STATEMENTS (IFRS) AS AT JUNE 30, 2018 20
RESPONSIBILITY STATEMENT 41
FINANCIAL CALENDAR 42
AT‐A GLANCE INTERIM GROUP MANAGEMENT REPORT
INTERIM CONSOLIDATED FINANCIAL STATEMENTS (IFRS)
FIRST HALF YEAR REPORT 2018
ADID
AS
FIRS
T HA
LF Y
EAR
REPO
RT 2
018
02

Financial Highlights (IFRS)
01First half year 2018 First half year 2017 Change
Operating Highlights (€ in millions)Net sales1 10,809 10,485 3%Gross profit1 5,586 5,227 7%Other operating expenses1 4,433 4,194 6%EBITDA1 1,562 1,362 15%Operating profit1 1,338 1,142 17%Net income from continuing operations1 960 809 19%Net income attributable to shareholders2 936 613 53%
Key RatiosGross margin1 51.7% 49.9% 1.8ppOther operating expenses in % of net sales1 41.0% 40.0% 1.0ppOperating margin1 12.4% 10.9% 1.5ppEffective tax rate1 28.2% 28.5% (0.3pp)Net income attributable to shareholders in % of net sales2 8.7% 5.8% 2.8ppAverage operating working capital in % of net sales1, 3 20.1% 20.4% (0.3pp)Equity ratio4 42.2% 40.3% 2.0ppNet borrowings/EBITDA1, 5 (0.0) 0.3 n. a.Financial leverage4 (1.5%) 12.9% (14.4pp)Return on equity2, 4 15.5% 10.8% 4.7pp
Balance Sheet and Cash Flow Data (€ in millions)Total assets4 14,305 14,164 1%Inventories 3,425 3,644 (6%)Receivables and other current assets 3,987 3,530 13%Operating working capital 4,318 4,258 1%Net cash/(net borrowings) 89 (735) n. a.Shareholders’ equity4 6,040 5,702 6%Capital expenditure1 258 261 (1%)Net cash generated from operating activities2 841 167 403%
Per Share of Common Stock (€)Basic earnings1 4.71 4.00 18%Diluted earnings1 4.70 3.96 19%Net cash generated from operating activities2 4.13 0.83 399%Dividend 2.60 2.00 30%Share price at end of period 186.95 167.75 11%
Other (at end of period)Number of employees1 56,270 56,044 0%Number of shares outstanding 201,120,299 202,657,342 (1%)Average number of shares 203,391,785 201,783,166 1%
1 Figures reflect continuing operations as a result of the divestiture of the Rockport, TaylorMade, Adams Golf, Ashworth and CCM Hockey businesses. 2 Includes continuing and discontinued operations.3 Twelve-month trailing average.4 2017 restated according to IAS 8, see Note 03.5 EBITDA of last twelve months.
FINANCIAL HIGHLIGHTS (IFRS)
03AD
IDAS
FI
RST
HAL
F YE
AR R
EPOR
T 20
181 AT A GLANCE 2 INTERIM GROUP MANAGEMENT REPORT 3 INTERIM CONSOLIDATED FINANCIAL STATEMENTS (IFRS)
FINANCIAL HIGHLIGHTS (IFRS)

OUR SHAREADIDAS AG SHARE INCREASES IN THE FIRST HALF OF 2018During the first half of 2018, international equity markets came under pressure as a result of global trade fears following discussions around the implementation of US import tariffs, weak economic data and political uncertainties in the Eurozone as well as interest rate increases by the Federal Reserve. Robust economic data in the US, the European Central Bank’s commitment to stable interest rates as well as the increase in the oil price to a four-year high only temporarily supported equity markets. As a consequence, the DAX-30 declined 5% as at June 30, 2018 compared to the year-end 2017 level. SEE TABLE 1 The adidas AG share closed the first half of 2018 on a positive note, as the share price was supported by the release of strong full year 2017 results including a well received full year 2018 outlook and an increase of the company’s 2020 profitability targets. Positive newsflow around the US sporting goods industry outlook also supported the adidas AG share price. On the other hand, developments such as the oil price increase and uncertainties regarding trade tariffs on product made in China put pressure on the share, especially during the second quarter of 2018. However, the adidas AG share closed 12% above the year-end 2017 level at € 186.95 on June 30, 2018. SEE TABLE 1
DIVIDEND OF € 2.60 PER SHARE PAIDAt the Annual General Meeting (AGM) on May 9, 2018, shareholders approved the adidas AG Executive and Supervisory Boards’ recommendation to pay a dividend of € 2.60 per share for the 2017 financial year. SEE FINANCIAL
HIGHLIGHTS, P. 03 The dividend was paid on May 15, 2018. This represents a dividend payout of € 528 million and a payout ratio of 37.0% of net income from continuing operations excluding the negative one-time tax impact as a result of the US tax reform in 2017. This is in line with the company’s targeted payout ratio of between 30% and 50%.
94% OF CONVERTIBLE BOND CONVERTEDIn March 2012, adidas AG issued a convertible bond, due on June 14, 2019, for an aggregate nominal amount of € 500 million. The bonds were priced with a 0.25% annual coupon and a conversion premium of 40% above the reference price of € 59.61, resulting in an initial conversion price of € 83.46 per share which, as a consequence of contractual provisions relating to dividend protection, was adjusted to € 80.48 per share in May 2018. As a result of conversion rights exercised, a total of 34,692 shares of adidas AG were delivered to the bondholders of adidas AG’s convertible bond in the first half of 2018. In total, 5,796,289 shares were transferred following the exercise of conversion rights, all of which were serviced from treasury shares of the company. As at June 30, 2018, the remaining bonds were convertible into up to 345,430 new or existing adidas AG shares. Consequently, at the end of the first half of 2018, 94% of the convertible bond was converted. On June 30, 2018, the convertible bond closed at € 231.97, 13% above the prior year end level of € 205.91.
MULTI-YEAR SHARE BUYBACK PROGRAM INITIATEDOn March 13, 2018, adidas AG announced the launch of a multi-year share buyback program of up to € 3.0 billion in total until May 11, 2021. While the company may use the
repurchased shares for all purposes in accordance with the authorization granted on May 12, 2016 except for allocating shares to Executive Board members as a compensation component, adidas intends to cancel the vast majority of the repurchased shares.
On March 21, 2018, adidas AG announced the commence-ment of the first tranche of the share buyback program with an aggregate acquisition cost of up to € 1 billion (excluding incidental purchasing costs). Since March 22, 2018, shares are being repurchased exclusively via the stock exchange in electronic trading through the Frankfurt Stock Exchange (Xetra) over a period of time not to extend beyond December 31, 2018. Within the first tranche up to and including June 30, 2018, adidas AG bought back 2,797,987 shares for a total purchase price of € 543,744,578 million. This translates into an average purchase price per share of € 194.33.
Share price development in 2018 1 2
| Dec. 31, 2017 June 30, 2018 |
130
120
110
100
90
1 Index: December 31, 2017 = 100. adidas AG DAX EURO STOXX 50 MSCI World Textiles, Apparel & Luxury Goods Index
Performance of the adidas AG share and important indices at June 30, 2018 (in %)
1
YTD 1 year 3 years 5 years 10 years
adidas AG 12 11 172 125 366DAX-30 (5) (0) 12 55 92EURO STOXX 50 (3) (1) (1) 30 1MSCI World Textiles, Apparel & Luxury Goods 13 27 42 58 203
Source: Bloomberg.
04AD
IDAS
FI
RST
HAL
F YE
AR R
EPOR
T 20
181 AT A GLANCE 2 INTERIM GROUP MANAGEMENT REPORT 3 INTERIM CONSOLIDATED FINANCIAL STATEMENTS (IFRS)
OUR SHARE

BUSINESS PERFORMANCE
ECONOMIC AND SECTOR DEVELOPMENT
GLOBAL ECONOMY‐GROWS IN THE FIRST HALF OF 20181
Global growth remained robust in the first half of 2018 but has eased in recent months, as manufacturing activity and trade have shown signs of moderation. The ongoing withdrawal of monetary policy accommodation in developed economies has led to some tightening of global financing conditions, while oil prices are substantially higher than previously expected. Among developing economies, the recovery in commodity exporters has continued while growth in commodity importers remained robust. Across the globe, risks of escalating trade protectionism and geopolitical tensions have increased.
SPORTING GOODS INDUSTRY EXPANSION CONTINUES IN THE FIRST HALF OF 20182
In the first half of 2018, the global sporting goods industry continued to grow. Against an overall favorable macroeconomic backdrop, rising sports participation and health awareness continued to drive global demand for athletic performance products while increasing sportswear penetration rates continued to fuel global demand for athletic casual and activewear products. In addition, the 2018 FIFA World Cup provided a modest tailwind to the overall sector. For the sporting goods industry, too, risks related to trade protectionism and geopolitical tensions have increased.
1 Source: World Bank, Global Economic Prospects.2 Source: NPD Market Research.
INCOME STATEMENT
ADIDAS WITH STRONG FINANCIAL PERFORMANCE IN THE FIRST HALF OF 2018In the first half of 2018, revenues increased 10% on a currency-neutral basis. In euro terms, revenues grew 3% to € 10.809 billion. SEE TABLE 3 From a brand perspective, currency-neutral revenues for brand adidas grew 12%, driven by double-digit sales increases in the football, running and training categories as well as in Sport Inspired. Currency-neutral Reebok sales declined 3% versus the prior year, as a result of declines in the training and running categories, which more than offset growth in Classics. From a regional perspective, on a currency-neutral basis, the combined sales of the adidas and Reebok brands were driven by double-digit increases in North America, Asia-Pacific and Latin America. While revenues increased at a low-single-digit rate in Western Europe, currency-neutral sales in Russia/CIS remained stable and revenues in Emerging Markets declined.
The gross margin improved 1.8 percentage points to 51.7%, reflecting the positive effects from an improved pricing mix, which more than offset negative currency effects as well as a less favorable channel mix and higher input costs. SEE TABLE 3
Royalty and commission income increased 2% to € 58 million. On a currency-neutral basis, royalty and commission income grew 10%. Other operating income increased 141% to € 126 million, due to the release of prior year operational provisions and litigation gains.
Other operating expenses were up 6% to € 4.433 billion, as a result of higher marketing expenditure as well as higher operating overhead costs. As a percentage of sales, other operating expenses increased 1.0 percentage points to 41.0%.
SEE TABLE 3 Marketing expenditure amounted to € 1.416 billion, which represents an increase of 13% versus the prior year level. As a percentage of sales, marketing expenditure increased 1.2 percentage points to 13.1%, reflecting activities related to the 2018 FIFA World Cup as well as overproportionate investments in brands and products. Operating overhead costs grew 2% to € 3.016 billion. As a percentage of sales, operating overhead costs decreased 0.2 percentage points to 27.9%. Operating profit grew 17% to € 1.338 billion, representing an operating margin of 12.4%, an increase of 1.5 percentage points compared to the prior year. SEE TABLE 3
This development was due to the gross margin increase as well as higher other operating income, which more than offset the negative effect of higher other operating expenses as a percentage of sales. Financial income was down 31% to € 22 million, mainly as a result of a decrease in positive exchange rate effects. Financial expenses declined 46% to € 23 million, due to a decrease in interest expenses. As a result, net financial expenses amounted to € 1 million compared to net financial expenses of € 11 million in the prior year. The company’s tax rate was down 0.3 percentage points to 28.2%. SEE FINANCIAL HIGHLIGHTS, P. 03 Consequently, net income from continuing operations grew 19% to € 960 million, resulting in basic earnings per share of € 4.71, up 18% versus the prior year, and diluted earnings per share of € 4.70, an increase of 19% compared to the prior year. 05
ADID
AS
FIRS
T H
ALF
YEAR
REP
ORT
2018
1 AT A GLANCE 2 INTERIM GROUP MANAGEMENT REPORT 3 INTERIM CONSOLIDATED FINANCIAL STATEMENTS (IFRS)
BUSINESS PERFORMANCE

In the first half of 2018, adidas incurred losses from discontinued operations of € 23 million (2017: losses of € 195 million), net of tax, mainly related to an adjustment in connection with the sale of the Rockport business in 2015. As a result, net income attributable to shareholders, which in addition to net income from continuing operations includes the losses from discontinued operations, increased 53% to € 936 million. SEE TABLE 3 Consequently, basic earnings per share (EPS) from continuing and discontinued operations were up 51% to € 4.60 and diluted EPS from continuing and discontinued operations increased 53% to € 4.59. SEE TABLE 3
The total number of shares outstanding decreased by 2,740,935 shares in the first half of 2018 to 201,120,299. This was a result of shares repurchased as part of the company’s share buyback program, which was partly offset by share conversions in relation to the company’s outstanding convertible bond. SEE FINANCIAL HIGHLIGHTS, P. 03 Consequently, the average number of shares used in the calculation of EPS was 203,391,785.
STATEMENT OF FINANCIAL POSITION AND STATEMENT OF CASH FLOWS
ASSETSAt the end of June 2018, total assets were up 1% to € 14.305 billion compared to the prior year, as a result of an increase in non-current assets which more than offset a decline in current assets.
Total current assets decreased 2% to € 8.730 billion at the end of June 2018. Cash and cash equivalents were up 7% to € 1.313 billion, as net cash generated from operating activities was partly offset by net cash used in investing and financing activities. Currency effects had a negative impact on cash and cash equivalents in an amount of € 19 million. Inventories declined 6% to € 3.425 billion. On a currency-neutral basis, inventories decreased 2%, reflecting the company’s focus on tight inventory management. The company’s accounts receivable increased 11% to € 2.751 billion. On a currency-neutral basis, receivables were up 15%, mainly reflecting the company’s top-line development in the first half of 2018. Other current assets increased 36% to € 758 million. This development was mainly due to the change in the accounting treatment regarding IFRS 15, which led to the recognition of return assets. SEE NOTE 02, P. 21
Total non-current assets increased 6% to € 5.575 billion at the end of June 2018. Fixed assets were up 5% to € 4.526 billion, mainly related to the company’s own-retail activities, investments into logistics and IT infrastructure as well as the further development of the company’s headquarters in Herzogenaurach. This was partly offset by negative currency translation effects of € 68 million. Other non-current financial assets more than doubled to € 260 million. This development mainly reflects the recognition of seller and contingent notes related to the divestiture of the TaylorMade and CCM Hockey businesses.
SEE DIAGRAM 4
Structure of statement of financial position 1,2 in % of total assets
4
June 30, 2018
June 30, 2017
Assets (€ in millions) 14,305 14,164
Cash and cash equivalents 9.2 8.7Accounts receivable 19.2 17.5Inventories 23.9 25.7Fixed assets 31.6 30.4Other assets 16.0 17.7
2018 2017
1 For absolute figures see adidas AG Consolidated Statement of Financial Position, p. 13.2 2017 restated according to IAS 8, see Note 03.
Key Financial Highlights 3
First half year 2018
First half year 2017 Change
Operating Highlights (€ in millions)Net sales1 10,809 10,485 3%Operating profit1 1,338 1,142 17%Net income from continuing operations1 960 809 19%Net income attributable to shareholders2 936 613 53%
Key RatiosGross margin1 51.7% 49.9% 1.8ppOther operating expenses in % of net sales1 41.0% 40.0% 1.0ppOperating margin1 12.4% 10.9% 1.5pp
Per Share of Common Stock (€)Diluted earnings2 4.59 3.01 53%
1 Figures reflect continuing operations as a result of the divestiture of the Rockport, TaylorMade and CCM Hockey businesses.
2 Includes continuing and discontinued operations.
06AD
IDAS
FI
RST
HAL
F YE
AR R
EPOR
T 20
181 AT A GLANCE 2 INTERIM GROUP MANAGEMENT REPORT 3 INTERIM CONSOLIDATED FINANCIAL STATEMENTS (IFRS)
BUSINESS PERFORMANCE

LIABILITIES AND EQUITYTotal current liabilities decreased 4% to € 6.455 billion at the end of June 2018. Accounts payable remained virtually unchanged at € 1.858 billion. On a currency-neutral basis, accounts payable grew 1%. Short-term borrowings declined 90% to € 95 million at the end of June 2018, reflecting a decrease in bank loans as well as conversions of the company’s convertible bond into adidas AG shares. Other current provisions were up 91% to € 1.086 billion, due to the change in the accounting treatment regarding IFRS 15, which led to an increase in the provision for returns. SEE NOTE 02, P. 21 Current accrued liabilities grew 11% to € 2.129 billion, mainly as a result of invoices not yet received as well as accruals for customer discounts.
Total non-current liabilities increased 2% to € 1.823 billion at the end of June 2018. Long-term borrowings rose 15% to € 1.134 billion compared to the prior year, reflecting an increase in bank loans. Other non-current provisions almost doubled to € 106 million while non-current accrued liabilities decreased 87% to € 13 million. This mainly reflects changes in provisions for personnel. SEE DIAGRAM 5
Shareholders’ equity increased 6% to € 6.040 billion at the end of June 2018. The net income generated during the last twelve months and the reissuance of treasury shares in an amount of € 124 million were partly offset by the dividend of € 528 million paid to shareholders for the 2017 financial year, the repurchase of treasury shares in an amount of € 565 million, including incidental purchasing costs, as well as negative currency effects of € 491 million. The company’s equity ratio increased 2.0 percentage points to 42.2%.
OPERATING WORKING CAPITALOperating working capital increased 1% to € 4.318 billion at the end of June 2018. On a currency-neutral basis, operating working capital grew 6%. Average operating working capital as a percentage of sales decreased 0.3 percentage points to 20.1%, reflecting the strong top-line development during the last twelve months as well as the company’s continued focus on tight working capital management. SEE FINANCIAL
HIGHLIGHTS, P. 03
LIQUIDITY‐ANALYSISIn the first half of 2018, net cash generated from operating activities increased to € 841 million. SEE FINANCIAL HIGHLIGHTS,
P. 03 Net cash generated from continuing operating activities rose to € 840 million, driven by an increase in income before taxes and lower operating working capital requirements, partly offset by an increase in income taxes paid. Net cash used in investing activities rose to € 207 million. The majority of investing activities in the first half of 2018 related to spending for property, plant and equipment, such as investments in the furnishing and fitting of our own-retail stores and investments in IT systems as well as the further development of the company’s headquarters in Herzogenaurach. Net cash used in financing activities totaled € 900 million, mainly due to the dividend paid to shareholders as well as the repurchase of treasury shares, partly offset by an increase in proceeds from long-term borrowings. Exchange
rate effects negatively impacted the company’s cash position by € 19 million. As a result of all these developments, cash and cash equivalents increased € 81 million to € 1.313 billion.
Net cash at June 30, 2018 amounted to € 89 million, representing an improvement of € 824 million compared to net borrowings of € 735 million in the prior year. SEE FINANCIAL
HIGHLIGHTS, P. 03 This development was mainly related to a decrease in short-term borrowings. The company’s ratio of net borrowings over EBITDA amounted to -0.0.
Structure of statement of financial position 1,2 in % of total liabilities and equity
5
June 30, 2018
June 30, 2017
Liabilities and equity (€ in millions) 14,305 14,164
Short-term borrowings 0.7 7.0Accounts payable 13.0 13.1Long-term borrowings 7.9 6.9Other liabilities 36.3 32.8Total equity 42.1 40.1
2018 2017
1 For absolute figures see adidas AG Consolidated Statement of Financial Position, p. 13. 2 2017 restated according to IAS 8, see Note 03.
07AD
IDAS
FI
RST
HAL
F YE
AR R
EPOR
T 20
181 AT A GLANCE 2 INTERIM GROUP MANAGEMENT REPORT 3 INTERIM CONSOLIDATED FINANCIAL STATEMENTS (IFRS)
BUSINESS PERFORMANCE

BUSINESS PERFORMANCE BY SEGMENT
WESTERN EUROPESales in Western Europe increased 2% on a currency-neutral as well as a reported basis to € 3.023 billion. adidas brand revenues grew 3% on a currency-neutral basis, driven by double-digit sales growth in the football category. In addition, mid-single-digit increases in Sport Inspired also supported the development. Reebok brand revenues decreased 4% on a currency-neutral basis, mainly due to declines in the training and running categories, which more than offset high-single-digit growth in Classics. SEE TABLE 6
Gross margin in Western Europe increased 2.1 percentage points to 46.9%, driven by an improved pricing, channel and product mix, which more than offset the negative impact from unfavorable currency developments as well as higher input costs. Operating expenses increased 9% to € 774 million, mainly reflecting higher marketing expenditure.
As a percentage of sales, operating expenses were up 1.7 percentage points to 25.6%. The operating margin improved 0.4 percentage points to 21.3%, as a result of the increase in gross margin which more than offset the negative effect of higher operating expenses as a percentage of sales.
SEE TABLE 6
NORTH AMERICASales in North America increased 18% on a currency-neutral basis. In euro terms, sales grew 6% to € 2.122 billion. adidas brand revenues increased 20% on a currency-neutral basis, driven by double-digit sales growth in the training, running and football categories as well as in Sport Inspired. Reebok brand revenues increased 4% on a currency-neutral basis, driven by double-digit growth in Classics. In addition, growth in the running category also supported this development.
SEE TABLE 7
Gross margin in North America decreased 0.4 percentage points to 39.3%, as a more favorable pricing mix was more than offset by a negative channel and product mix as well as higher input costs. Operating expenses declined 2% to € 589 million, reflecting a decline in operating overhead costs. Operating expenses as a percentage of sales decreased 2.1 percentage points to 27.7%. The operating margin improved 1.7 percentage points to 13.1% as a result of lower operating expenses as a percentage of sales, which more than offset the decline in gross margin. SEE TABLE 7
Western Europe at a glance € in millions 6
First half year 2018
First half year 2017 Change
Change (currency-
neutral)
Net sales 3,023 2,969 2% 2% adidas brand 2,776 2,712 2% 3% Reebok brand 247 257 (4%) (4%)
Gross profit 1,417 1,331 7% –Gross margin 46.9% 44.8% 2.1pp –Segmental operating profit 644 620 4% –Segmental operating margin 21.3% 20.9% 0.4pp –
North America at a glance € in millions 7
First half year 2018
First half year 2017 Change
Change (currency-
neutral)
Net sales 2,122 2,001 6% 18% adidas brand 1,929 1,794 7% 20% Reebok brand 194 207 (6%) 4%
Gross profit 835 796 5% –Gross margin 39.3% 39.7% (0.4pp) –Segmental operating profit 279 228 22% –Segmental operating margin 13.1% 11.4% 1.7pp –
08AD
IDAS
FI
RST
HAL
F YE
AR R
EPOR
T 20
181 AT A GLANCE 2 INTERIM GROUP MANAGEMENT REPORT 3 INTERIM CONSOLIDATED FINANCIAL STATEMENTS (IFRS)
BUSINESS PERFORMANCE BY SEGMENT

ASIA-PACIFICSales in Asia-Pacific increased 17% on a currency-neutral basis. In euro terms, sales were up 11% to € 3.582 billion. adidas brand revenues grew 18% on a currency-neutral basis. This development was due to double-digit growth in all key categories. Reebok brand revenues declined 2% on a currency-neutral basis, driven by a high-single-digit decline in Classics, which more than offset growth in the running and training categories. SEE TABLE 8
Gross margin in Asia-Pacific increased 0.3 percentage points to 56.7%, reflecting an improved pricing, channel and product mix, partly offset by negative currency effects and higher input costs. Operating expenses were up 10% to € 786 million, driven by higher marketing expenditure as well as an increase in operating overhead costs. As a percentage of sales, operating expenses decreased 0.1 percentage points to 21.9%. As a result of the positive effect of lower operating expenses as a percentage of sales, as well as the gross margin increase, the operating margin increased 0.4 percentage points to 35.0%. SEE TABLE 8
RUSSIA/CISSales in Russia/CIS remained stable on a currency-neutral basis. In euro terms, sales declined 13% to € 297 million. adidas brand revenues were up 2% on a currency-neutral basis, due to exceptional growth in the football category, reflecting revenues generated through leveraging the 2018 FIFA World Cup. Reebok brand revenues decreased 7% on a currency-neutral basis, driven by declines in all major categories. SEE TABLE 9
Gross margin in Russia/CIS increased 2.9 percentage points to 67.4%, driven by positive currency effects, partly offset by an unfavorable pricing and channel mix. Operating expenses were down 18% to € 133 million and, as a percentage of sales, declined 2.6 percentage points to 44.8%. This development reflects a decline in operating overhead expenses. The operating margin increased 5.6 percentage points to 22.6% as a result of the gross margin increase as well as the positive effect of lower operating expenses as a percentage of sales.
SEE TABLE 9
LATIN AMERICASales in Latin America grew 12% on a currency-neutral basis. In euro terms, sales declined 5% to € 847 million. adidas brand revenues increased 16% on a currency-neutral basis driven by exceptional growth in the football category as well as by double-digit growth in Sport Inspired. In addition, high-single-digit growth in the running category also contributed to this development. Reebok brand revenues declined 10% on a currency-neutral basis, as a result of declines in all major categories. SEE TABLE 10
Gross margin in Latin America increased 4.6 percentage points to 44.1%, driven by an improved pricing and channel mix, which more than offset negative currency effects as well as higher input costs. Operating expenses were down 11% to € 230 million, mainly reflecting a decrease in operating overhead costs. Operating expenses as a percentage of sales were down 1.6 percentage points to 27.2%. The operating margin increased 6.2 percentage points to 16.9%, reflecting the gross margin increase as well as the positive effect of lower operating expenses as a percentage of sales. SEE TABLE 10
Russia/CIS at a glance € in millions 9
First half year 2018
First half year 2017 Change
Change (currency-
neutral)
Net sales 297 341 (13%) (0%) adidas brand 223 250 (11%) 2% Reebok brand 74 90 (18%) (7%)
Gross profit 200 220 (9%) –Gross margin 67.4% 64.5% 2.9pp –Segmental operating profit 67 58 16% –Segmental operating margin 22.6% 17.0% 5.6pp –
Latin America at a glance € in millions 10
First half year 2018
First half year 2017 Change
Change (currency-
neutral)
Net sales 847 895 (5%) 12% adidas brand 762 785 (3%) 16% Reebok brand 85 111 (23%) (10%)
Gross profit 374 354 6% –Gross margin 44.1% 39.6% 4.6pp –Segmental operating profit 143 96 49% –Segmental operating margin 16.9% 10.7% 6.2pp –
Asia-Pacific at a glance € in millions 8
First half year 2018
First half year 2017 Change
Change (currency-
neutral)
Net sales 3,582 3,240 11% 17% adidas brand 3,419 3,061 12% 18% Reebok brand 163 179 (9%) (2%)
Gross profit 2,032 1,829 11% –Gross margin 56.7% 56.4% 0.3pp –Segmental operating profit 1,253 1,122 12% –Segmental operating margin 35.0% 34.6% 0.4pp –
09AD
IDAS
FI
RST
HAL
F YE
AR R
EPOR
T 20
181 AT A GLANCE 2 INTERIM GROUP MANAGEMENT REPORT 3 INTERIM CONSOLIDATED FINANCIAL STATEMENTS (IFRS)
BUSINESS PERFORMANCE BY SEGMENT

EMERGING MARKETSSales in Emerging Markets declined 2% on a currency-neutral basis. In euro terms, revenues decreased 13% to € 560 million. adidas brand revenues were down 2% on a currency-neutral basis, as mid-single-digit increases in the football and running categories were more than offset by declines in Sport Inspired and in the training category. Reebok brand revenues declined 5% on a currency-neutral basis, as double-digit increases in Classics were more than offset by double-digit decreases in the training and running categories. SEE TABLE 11
Gross margin in Emerging Markets increased 2.3 percentage points to 50.9%, driven by an improved pricing, channel and product mix, partly offset by negative currency effects and higher input costs. Operating expenses were down 12% to € 137 million, reflecting a decrease in marketing expenditure as well as operating overhead costs. Operating expenses as a percentage of sales increased 0.4 percentage points to 24.6%. As a result of the gross margin increase, which more than offset the negative effect from higher operating expenses as a percentage of sales, the operating margin grew 1.9 percentage points to 26.4%. SEE TABLE 11
Emerging Markets at a glance € in millions 11
First half year 2018
First half year 2017 Change
Change (currency-
neutral)
Net sales 560 644 (13%) (2%) adidas brand 498 570 (13%) (2%) Reebok brand 62 74 (16%) (5%)
Gross profit 285 313 (9%) –Gross margin 50.9% 48.6% 2.3pp –Segmental operating profit 148 158 (6%) –Segmental operating margin 26.4% 24.5% 1.9pp –
10AD
IDAS
FI
RST
HAL
F YE
AR R
EPOR
T 20
181 AT A GLANCE 2 INTERIM GROUP MANAGEMENT REPORT 3 INTERIM CONSOLIDATED FINANCIAL STATEMENTS (IFRS)
BUSINESS PERFORMANCE BY SEGMENT

SUBSEQUENT EVENTS AND OUTLOOK
SUBSEQUENT EVENTS
NO SUBSEQUENT EVENTSBetween the end of the first half of 2018 and the finalization of the interim consolidated financial statements on July 25, 2018, there were no significant organizational, management, economic, socio-political, legal or financial changes which we expect to influence our business materially going forward.
OUTLOOK1
GLOBAL ECONOMY TO GROW IN 20182
Global GDP is projected to grow 3.1% in 2018 as the ongoing cyclical recovery is expected to continue. However, escalating trade protectionism and heightened geopolitical tensions continue to cloud the outlook. In addition, the headline growth forecast conceals differences between the pace of growth in developed and developing economies. Developing economies are forecast to see an acceleration of growth to 4.5% as commodity-exporting economies benefit from a stabilization of oil and other commodity prices. In contrast, growth in developed economies is projected to slow to 2.2%, as further monetary tightening appears likely and the effects of U.S. fiscal stimulus wane. With macroeconomic indicators generally at elevated levels already and potential economic growth set to decrease due to a slowdown in productivity growth as well as less favorable demographic trends, risks to the global outlook are tilted to the downside. Instances of trade protectionism or geopolitical conflicts could materially dampen consumer confidence, trade and growth. In addition, a rise in borrowing costs or disorderly movements in financial markets might cause turbulence and potentially derail the expansion.
SPORTING GOODS INDUSTRY EXPANSION TO CONTINUE IN 20183
In the absence of any major macroeconomic shocks, we expect the global sporting goods industry to grow at a mid-single-digit rate in 2018. Consumer spending on sporting goods in the developing economies is expected to grow faster than in the more developed markets. Progressing urbanization and a growing middle-class in many developing economies are predicted to further propel industry growth. In developed economies, the sporting goods industry is forecast to expand, as wage increases on the back of generally strong labor market conditions will support consumer spending on sporting goods. Around the world, rising sports participation and health awareness is projected to continue to boost demand for athletic performance products. In addition, sportswear penetration rates are forecast to edge up further as sports-inspired apparel and footwear (‘athleisure’) has become a structural component of the broader fashion landscape, fueling the demand for athletic casual and activewear products. Within the supply chain, innovation such as the application of new manufacturing techniques is projected to enhance speed-to-market capabilities of sports brands, which will favorably impact sales growth as consumers’ demands can be met faster and more precisely. On the distribution side, the e-commerce channel, which is already a significant growth driver for the industry, is anticipated to broaden out further as investments into the digital transformation continue across the sporting goods industry.
ADIDAS CONFIRMS TOP- AND BOTTOM-LINE OUTLOOK FOR THE 2018 FINANCIAL‐YEARAgainst the background of the financial performance in the first half of 2018, adidas has confirmed its 2018 financial outlook. The company continues to expect sales to increase at a rate of around 10% on a currency-neutral basis, driven by double-digit growth in North America and Asia-Pacific.
Gross margin is forecast to increase up to 0.3 percentage points to a level of up to 50.7%, benefiting from the positive effects of a more favorable pricing, channel and regional mix. These improvements will be partly offset by the negative impact from unfavorable currency movements as well as higher input costs. The operating margin is expected to improve between 0.5 and 0.7 percentage points to a level between 10.3% and 10.5%. Operating profit is projected to increase between 9% and 13%. Net income from continuing operations is expected to rise to a level between € 1.615 billion and € 1.675 billion. This development reflects an increase of between 13% and 17% compared to the prior year level of € 1.430 billion, excluding the negative one-time tax impact recorded in 2017. Basic earnings per share from continuing operations are expected to increase at a rate
1 This Management Report contains forward-looking statements that reflect Management’s current view with respect to the future development of adidas. The outlook is based on estimates that we have made on the basis of all the information available to us at the time of completion of this First Half Year Report. In addition, such forward-looking statements are subject to uncertainties as described in the Risk and Opportunity Report of the adidas 2017 Annual Report (pp. 131 – 145), which are beyond the control of the company. In case the underlying assumptions turn out to be incorrect or described risks or opportunities materialize, actual results and developments may materially deviate (negatively or positively) from those expressed by such statements. adidas does not assume any obligation to update any forward-looking statements made in this Management Report beyond statutory disclosure obligations.
2 Source: World Bank, Global Economic Prospects.3 Source: NPD Market Research.
11AD
IDAS
FI
RST
HAL
F YE
AR R
EPOR
T 20
181 AT A GLANCE 2 INTERIM GROUP MANAGEMENT REPORT 3 INTERIM CONSOLIDATED FINANCIAL STATEMENTS (IFRS)
SUBSEQUENT EVENTS AND OUTLOOK

between 12% and 16% compared to the prior-year level of € 7.05, excluding the negative one-time tax impact in 2017, not taking into account any decrease in the number of shares outstanding due to the company’s share buyback program. Net financial expenses are forecast to decrease in 2018. The tax rate is projected to be below the prior year level of 29.3%, excluding the negative one-time tax impact recorded in 2017.
RISKS AND OPPORTUNITIESTaking into account the occurrence likelihood and the potential financial impact of the risks explained in the 2017 Annual Report, as well as the current business outlook, Management does not foresee any material jeopardy to the viability of the company as a going concern. Management remains confident that the earnings strength forms a solid basis for our future business development and provides the necessary resource to pursue the opportunities available to the company. Compared to the assessment in the 2017 Annual Report, overall the company’s risk profile remains unchanged.
12AD
IDAS
FI
RST
HAL
F YE
AR R
EPOR
T 20
181 AT A GLANCE 2 INTERIM GROUP MANAGEMENT REPORT 3 INTERIM CONSOLIDATED FINANCIAL STATEMENTS (IFRS)
SUBSEQUENT EVENTS AND OUTLOOK
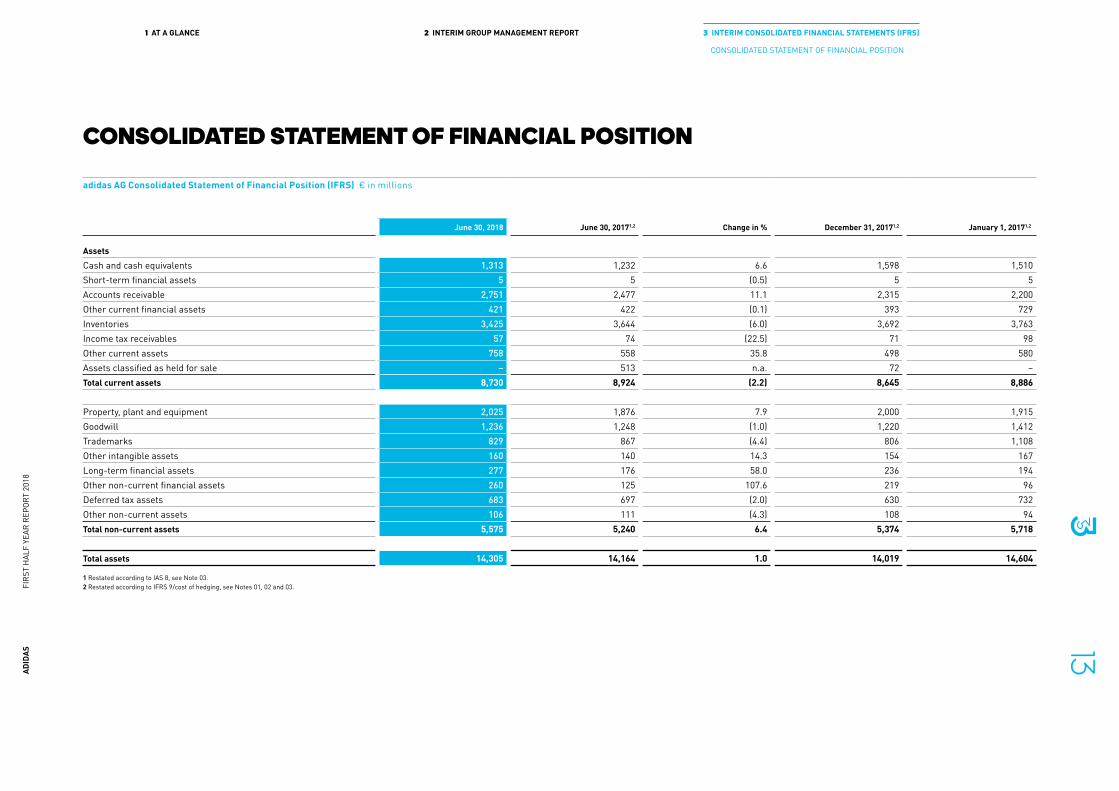
CONSOLIDATED STATEMENT OF FINANCIAL POSITION
adidas AG Consolidated Statement of Financial Position (IFRS) € in millions
June 30, 2018 June 30, 20171,2 Change in % December 31, 20171,2 January 1, 20171,2
AssetsCash and cash equivalents 1,313 1,232 6.6 1,598 1,510Short-term financial assets 5 5 (0.5) 5 5Accounts receivable 2,751 2,477 11.1 2,315 2,200Other current financial assets 421 422 (0.1) 393 729Inventories 3,425 3,644 (6.0) 3,692 3,763Income tax receivables 57 74 (22.5) 71 98Other current assets 758 558 35.8 498 580Assets classified as held for sale – 513 n.a. 72 –Total current assets 8,730 8,924 (2.2) 8,645 8,886
Property, plant and equipment 2,025 1,876 7.9 2,000 1,915Goodwill 1,236 1,248 (1.0) 1,220 1,412Trademarks 829 867 (4.4) 806 1,108Other intangible assets 160 140 14.3 154 167Long-term financial assets 277 176 58.0 236 194Other non-current financial assets 260 125 107.6 219 96Deferred tax assets 683 697 (2.0) 630 732Other non-current assets 106 111 (4.3) 108 94Total non-current assets 5,575 5,240 6.4 5,374 5,718
Total assets 14,305 14,164 1.0 14,019 14,604
1 Restated according to IAS 8, see Note 03.2 Restated according to IFRS 9/cost of hedging, see Notes 01, 02 and 03.
13AD
IDAS
FI
RST
HAL
F YE
AR R
EPOR
T 20
181 AT A GLANCE 2 INTERIM GROUP MANAGEMENT REPORT 3 INTERIM CONSOLIDATED FINANCIAL STATEMENTS (IFRS)
CONSOLIDATED STATEMENT OF FINANCIAL POSITION

adidas AG Consolidated Statement of Financial Position (IFRS) € in millions
June 30, 2018 June 30, 20171,2 Change in % December 31, 20171,2 January 1, 20171,2
Liabilities and equityShort-term borrowings 95 990 (90.4) 137 636Accounts payable 1,858 1,862 (0.2) 1,975 2,496Other current financial liabilities 275 286 (3.8) 362 201Income taxes 532 425 25.0 424 402Other current provisions 1,086 568 91.2 741 573Current accrued liabilities 2,129 1,915 11.2 2,180 2,023Other current liabilities 480 439 9.2 473 434Liabilities classified as held for sale – 210 n.a. – –Total current liabilities 6,455 6,696 (3.6) 6,291 6,765
Long-term borrowings 1,134 983 15.4 983 982Other non-current financial liabilities 9 27 (65.9) 22 22Pensions and similar obligations 298 342 (12.8) 298 355Deferred tax liabilities 203 229 (11.4) 190 289Other non-current provisions 106 53 99.5 80 44Non-current accrued liabilities 13 102 (87.5) 85 120Other non-current liabilities 61 47 29.3 53 46Total non-current liabilities 1,823 1,782 2.3 1,711 1,859
Share capital 201 203 (0.8) 204 201Reserves 133 202 (34.0) (29) 743Retained earnings 5,705 5,297 7.7 5,858 5,053Shareholders’ equity 6,040 5,702 5.9 6,032 5,997
Non-controlling interests (12) (16) 21.5 (15) (17)Total equity 6,027 5,686 6.0 6,017 5,980
Total liabilities and equity 14,305 14,164 1.0 14,019 14,604
1 Restated according to IAS 8, see Note 03.2 Restated according to IFRS 9/cost of hedging, see Notes 01, 02 and 03. 14
ADID
AS
FIRS
T H
ALF
YEAR
REP
ORT
2018
1 AT A GLANCE 2 INTERIM GROUP MANAGEMENT REPORT 3 INTERIM CONSOLIDATED FINANCIAL STATEMENTS (IFRS)
CONSOLIDATED STATEMENT OF FINANCIAL POSITION

CONSOLIDATED INCOME STATEMENT
adidas AG Consolidated Income Statement (IFRS) € in millions
First half year 2018 First half year 2017 Change Second quarter 2018 Second quarter 2017 Change
Net sales 10,809 10,485 3.1% 5,261 5,038 4.4%Cost of sales 5,222 5,258 (0.7%) 2,509 2,513 (0.2%)Gross profit 5,586 5,227 6.9% 2,751 2,525 9.0%
(% of net sales) 51.7% 49.9% 1.8pp 52.3% 50.1% 2.2ppRoyalty and commission income 58 57 1.6% 32 29 9.9%Other operating income 126 52 141.1% 70 24 192.7%Other operating expenses 4,433 4,194 5.7% 2,261 2,072 9.1%
(% of net sales) 41.0% 40.0% 1.0pp 43.0% 41.1% 1.8ppOperating profit 1,338 1,142 17.1% 592 505 17.2%
(% of net sales) 12.4% 10.9% 1.5pp 11.3% 10.0% 1.2ppFinancial income 22 32 (30.6%) 14 7 98.7%Financial expenses 23 43 (45.7%) 18 26 (29.7%)Income before taxes 1,337 1,131 18.2% 588 486 20.9%
(% of net sales) 12.4% 10.8% 1.6pp 11.2% 9.7% 1.5ppIncome taxes 377 322 16.9% 169 139 21.9%
(% of income before taxes) 28.2% 28.5% (0.3pp) 28.8% 28.6% 0.2ppNet income from continuing operations 960 809 18.7% 418 347 20.5% (% of net sales) 8.9% 7.7% 1.2pp 8.0% 6.9% 1.1ppLosses from discontinued operations, net of tax 23 195 (88.4%) 21 189 (88.8%)Net income 938 614 52.7% 397 159 150.6%
(% of net sales) 8.7% 5.9% 2.8pp 7.6% 3.1% 4.4ppNet income attributable to shareholders 936 613 52.7% 396 158 150.4%
(% of net sales) 8.7% 5.8% 2.8pp 7.5% 3.1% 4.4ppNet income attributable to non-controlling interests 2 1 42.1% 1 0 344.5%
Basic earnings per share from continuing operations (in €) 4.71 4.00 17.7% 2.06 1.72 19.9%Diluted earnings per share from continuing operations (in €) 4.70 3.96 18.7% 2.05 1.70 20.6%
Basic earnings per share from continuing and discontinued operations (in €) 4.60 3.04 51.5% 1.95 0.78 149.7%Diluted earnings per share from continuing and discontinued operations (in €) 4.59 3.01 52.6% 1.95 0.78 150.5%
15AD
IDAS
FI
RST
HAL
F YE
AR R
EPOR
T 20
181 AT A GLANCE 2 INTERIM GROUP MANAGEMENT REPORT 3 INTERIM CONSOLIDATED FINANCIAL STATEMENTS (IFRS)
CONSOLIDATED INCOME STATEMENT

CONSOLIDATED STATEMENT OF COMPREHENSIVE INCOME
adidas AG Consolidated Statement of Comprehensive Income (IFRS) € in millions
First half year 2018 First half year 2017 Second quarter 2018 Second quarter 2017
Net income after taxes 938 614 397 159Items of other comprehensive income that will not be reclassified subsequently to profit or lossRemeasurements of defined benefit plans (IAS 19), net of tax1 (0) 1 0 2Net (loss)/gain of other equity investments (IFRS 9), net of tax (5) – (5) –Subtotal of items of other comprehensive income that will not be reclassified subsequently to profit or loss (5) 1 (5) 2Items of other comprehensive income that will be reclassified to profit or loss when specific conditions are metNet gain/(loss) on cash flow hedges, net of tax 207 (251) 227 (68)Net (loss)/gain on cost of hedging reserve, net of tax (15) – 10 –Reclassification of foreign currency differences on loss of significant influence (4) – (4) –Currency translation differences (19) (314) 47 (325)Subtotal of items of other comprehensive income that will be reclassified to profit or loss when specific conditions are met 169 (565) 280 (393)
Other comprehensive income 163 (564) 275 (391)
Total comprehensive income 1,101 51 672 (233)
Attributable to shareholders of adidas AG 1,098 49 671 (234)Attributable to non-controlling interests 3 1 1 1
1 Includes actuarial gains or losses relating to defined benefit obligations, return on plan assets (excluding interest income) and the asset ceiling effect.
16AD
IDAS
FI
RST
HAL
F YE
AR R
EPOR
T 20
181 AT A GLANCE 2 INTERIM GROUP MANAGEMENT REPORT 3 INTERIM CONSOLIDATED FINANCIAL STATEMENTS (IFRS)
CONSOLIDATED STATEMENT OF COMPREHENSIVE INCOME

CONSOLIDATED STATEMENT OF CHANGES IN EQUITY
adidas AG Consolidated Statement of Changes in Equity (IFRS) € in millions1
Share capital
Capital reserve
Cumulative currency
translation differences
Hedging reserve
Cost of hedging reserve
Other reserves2
Retained earnings
Share-holders’
equity
Non- controlling
interests Total equity
Balance at December 31, 2016 201 838 (52) 146 – (182) 5,521 6,472 (17) 6,455IFRS 9 transition effect, net of tax (6) 6 – – –Adjustment according to IAS 8, net of tax (475) (475) – (475)Balance at January 1, 2017 201 838 (52) 146 (6) (182) 5,053 5,997 (17) 5,980Net income recognized directly in equity (315) (250) (10) 1 10 (564) 0 (564)Net income 613 613 1 614Total comprehensive income (315) (250) (10) 1 623 49 1 51Reissuance of treasury shares due to the conversion of convertible bonds 2 33 99 134 134Repurchase of treasury shares (0) (73) (73) (73)Repurchase of treasury shares due to equity-settled share-based payment (0) (7) (7) (7)Reissuance of treasury shares due to equity-settled share-based payment 0 7 7 7Dividend payment (405) (405) (405)Equity-settled share-based payment 0 0 0Balance at June 30, 2017 203 871 (367) (105) (16) (181) 5,297 5,702 (16) 5,686
Balance at December 31, 2017 204 884 (520) (229) (5) (159) 5,858 6,032 (15) 6,017IFRS 9 transition effect, net of tax (6) 6 3 3 (0) 3IFRS 15 transition effect, net of tax (25) (25) (0) (25)Balance at January 1, 2018 204 884 (520) (234) 0 (159) 5,836 6,011 (15) 5,996Net income recognized directly in equity (23) 206 (15) (5) 162 1 163Net income 936 936 2 938Total comprehensive income (23) 206 (15) (5) 936 1,098 3 1,101Reissuance of treasury shares due to the conversion of convertible bonds 0 0 2 3 3Repurchase of treasury shares (3) (543) (546) (546)Repurchase of treasury shares due to equity-settled share-based payment (0) (10) (10) (10)Reissuance of treasury shares due to equity-settled share-based payment 0 14 14 14Dividend payment (528) (528) (528)Equity-settled share-based payment (1) (1) (1)Balance at June 30, 2018 201 884 (543) (28) (15) (165) 5,705 6,040 (12) 6,027
1 IFRS 15 and IFRS 9 are initially applied at January 1, 2018. Under the transition methods chosen, comparative information is not restated except for certain hedging requirements.2 Reserves for remeasurements of defined benefit plans (IAS 19), option plans and acquisition of shares from non-controlling interest shareholders.
17AD
IDAS
FI
RST
HAL
F YE
AR R
EPOR
T 20
181 AT A GLANCE 2 INTERIM GROUP MANAGEMENT REPORT 3 INTERIM CONSOLIDATED FINANCIAL STATEMENTS (IFRS)
CONSOLIDATED STATEMENT OF CHANGES IN EQUITY

CONSOLIDATED STATEMENT OF CASH FLOWS
adidas AG Consolidated Statement of Cash Flows (IFRS) € in millions
First half year 2018 First half year 2017
Operating activities:Income before taxes 1,337 1,131
Adjustments for:Depreciation, amortization and impairment losses 220 208Reversals of impairment losses (2) (1)Unrealized foreign exchange losses, net 14 4Interest income (12) (14)Interest expense 20 40Losses on sale of property, plant and equipment and intangible assets, net 1 4Other non-cash expenses 4 1Payment for external funding of pension obligations (CTA) (11) (4)Operating profit before working capital changes 1,570 1,370Increase in receivables and other assets (505) (402)Decrease/(increase) in inventories 221 (132)Decrease in accounts payable and other liabilities (114) (305)Cash generated from operations before interest and taxes 1,172 531Interest paid (13) (34)Income taxes paid (319) (276)Net cash generated from operating activities – continuing operations 840 221Net cash generated from/(used in) in operating activities – discontinued operations 0 (54)Net cash generated from operating activities 841 167
18AD
IDAS
FI
RST
HAL
F YE
AR R
EPOR
T 20
181 AT A GLANCE 2 INTERIM GROUP MANAGEMENT REPORT 3 INTERIM CONSOLIDATED FINANCIAL STATEMENTS (IFRS)
CONSOLIDATED STATEMENT OF CASH FLOWS

adidas AG Consolidated Statement of Cash Flows (IFRS) € in millions
First half year 2018 First half year 2017
Investing activities:Purchase of trademarks and other intangible assets (32) (20)Proceeds from sale of trademarks and other intangible assets 0 0Purchase of property, plant and equipment (226) (242)Proceeds from sale of property, plant and equipment 8 5Proceeds from sale of assets held for sale 71 –Proceeds from sale of a disposal group 14 6Proceeds from sale of short-term financial assets 0 0Purchase of investments and other long-term assets (56) (73)Interest received 12 14Net cash used in investing activities – continuing operations (207) (310)Net cash used in investing activities – discontinued operations – (4)Net cash used in investing activities (207) (314)
Financing activities:Proceeds from long-term borrowings 150 –Repayments of finance lease obligations (0) (1)Dividend paid to shareholders of adidas AG (528) (405)Repurchase of treasury shares (482) (85)Repurchase of treasury shares due to share-based payments (10) (7)Proceeds from reissuance of treasury shares due to share-based payments 9 6Proceeds from short-term borrowings – 485Repayments of short-term borrowings (38) –Net cash used in continuing financing activities – continuing operations (900) (7)Net cash used in financing activities – discontinued operations – (0)Net cash used in financing activities (900) (8)
Effect of exchange rates on cash (19) (123)Decrease of cash and cash equivalents (285) (278)Cash and cash equivalents at beginning of year 1,598 1,510Cash and cash equivalents at end of period 1,313 1,232 19
ADID
AS
FIRS
T H
ALF
YEAR
REP
ORT
2018
1 AT A GLANCE 2 INTERIM GROUP MANAGEMENT REPORT 3 INTERIM CONSOLIDATED FINANCIAL STATEMENTS (IFRS)
CONSOLIDATED STATEMENT OF CASH FLOWS

EXPLANATORY NOTES TO THE CONDENSED INTERIM CONSOLIDATED FINANCIAL STATEMENTS (IFRS) AS AT JUNE 30, 2018
01 — GENERALThe interim consolidated financial statements of adidas AG and its subsidiaries (collectively ‘adidas’, the ‘Group’ or ‘the company’) for the first half year ending June 30, 2018 are prepared in compliance with International Financial Reporting Standards (IFRS), as adopted by the European Union (EU). The company applied all International Financial Reporting Standards issued by the International Accounting Standards Board (IASB) and Interpretations of the IFRS Interpretations Committee effective as at June 30, 2018.
These interim consolidated financial statements were prepared in compliance with International Accounting Standard IAS 34 ‘Interim Financial Reporting’. Accordingly, these interim consolidated financial statements do not include all of the information and notes required for consolidated financial statements at financial year-ends. Therefore, these interim consolidated financial statements should be read in conjunction with the 2017 annual consolidated financial statements. The accounting policies as well as principles and practices applied in the consolidated financial statements for the year ending December 31, 2017 also apply to the interim consolidated financial statements for the first half year ending June 30, 2018, with the following exceptions.
The following new standards and amendments to existing standards and interpretations, which were issued by the IASB and are effective in the EU for financial years beginning on January 1, 2018, have been applied for the first time with an impact on the consolidated financial statements as expected:
— IFRS 9 ‘Financial Instruments’ (EU effective date: January 1, 2018): The new standard prescribes rules for the accounting of financial instruments, replacing the current guidelines in IAS 39 ‘Financial Instruments:
Recognition and Measurement’. In particular, IFRS 9 prescribes new classification methods for financial assets, which has an effect on the company’s classification and subsequent presentation of certain financial assets. The standard eliminates the previous IAS 39 categories for financial assets, which include held to maturity, loans and receivables and available for sale. Instead, upon initial recognition under IFRS 9, a financial asset is classified and measured as follows: amortized cost, fair value through other comprehensive income (equity), fair value through other comprehensive income (debt) or fair value through profit or loss. In contrast, IFRS 9 largely retains the existing requirements in IAS 39 for classification and measurement of financial liabilities. The standard introduces new requirements for the impairment of financial instruments, contract assets, lease receivables, loan commitments, financial guarantees and revised requirements regarding hedge accounting.
The respective classification is generally based on the business model for managing financial assets or a group of financial assets and its contractual cash flow characteristics. On initial recognition of an equity investment that is not held for trading, it is possible to irrevocably elect to present subsequent changes of the investment’s fair value in other comprehensive income. This election is made on an investment-by-investment basis. When these equity investments are sold or written off, any unrealized gains and losses are reclassified to retained earnings and not presented under profit or loss.
For transition purposes, adidas has taken advantage of the exemption of IFRS 9 from restating prior periods. Therefore, comparative information has only been restated
for the retrospective application of certain hedging requirements.
For more details on the company’s categories according to IFRS 9 SEE NOTE 07. For further information about the changes and effects from the first-time application of IFRS 9 on January 1, 2018 SEE NOTES 02 AND 07.
— IFRS 15 ‘Revenue from Contracts with Customers’ (EU effective date: January 1, 2018): This new standard replaces IAS 18 ‘Revenue’, IAS 11 ‘Construction contracts’ and IFRIC 13 ‘Customer Loyalty Programmes’ and provides a holistic framework for all aspects of revenue recognition. IFRS 15 creates a centralized, single five-step model for recognizing revenue arising from contracts with customers.
adidas has applied the modified retrospective method (also called ‘cumulative effect method’) for transition to IFRS 15, whereby the cumulative effect of initially applying IFRS 15 is shown in the opening balance as at January 1, 2018. Accordingly, the comparative information presented for 2017 has not been restated. Instead it is accounted for according to the rules valid for revenue recognition during the 2017 financial year.
Additionally, adidas has applied the practical expedient for transition offered in the IFRS 15 Amendment ‘Clarifications to IFRS 15’ which is only applicable for the modified retrospective method. With the application of this amendment, the company has reflected the aggregate effect of all contract modifications that occurred before the beginning of the earliest period presented or before the date of initial application for the first-time application of IFRS 15.
Under IFRS 15, revenue is recognized at the transfer of control of the goods to the customer whereas under IAS 18 revenue recognition was dependent on the transfer of risks
20AD
IDAS
FI
RST
HAL
F YE
AR R
EPOR
T 20
181 AT A GLANCE 2 INTERIM GROUP MANAGEMENT REPORT 3 INTERIM CONSOLIDATED FINANCIAL STATEMENTS (IFRS)
EXPLANATORY NOTES TO THE CONDENSED INTERIM CONSOLIDATED FINANCIAL STATEMENTS (IFRS) AS AT JUNE 30, 2018

and rewards. For more information about the impacts from the application of IFRS 15 SEE NOTE 04.
The following provides an update to adidas’ implementation status of new standards and interpretations which are expected to have a significant impact on the consolidated financial statements and will be effective for financial years beginning after January 1, 2018, and which have not been applied in preparing these interim consolidated financial statements:
— IFRS 16 ‘Leases’ (EU effective date: January 1, 2019): The new standard replaces the guidance in IAS 17 ‘Leases’ and the respective interpretations IFRIC 4 ‘Determining Whether an Arrangement Contains a Lease’, SIC-15 ‘Operating Leases – Incentives’ and SIC-27 ‘Evaluating the Substance of Transactions Involving the Legal Form of a Lease’. IFRS 16 eliminates the required classification of leases into operating and finance leases in accordance with IAS 17, replacing it with a single accounting model requiring lessees to recognize a right-of-use asset and a corresponding lease liability for leases with a lease term of more than twelve months.
adidas has identified the main categories for leases where adidas acts as lessee, which thus far include the following: buildings, land, technical equipment and machinery, office equipment, furniture and fixtures, motor vehicles, computer hardware and other equipment. According to the option offered in IFRS 16.4 for lessees, adidas has decided to exclude leases for software from the scope of the new standard.
IFRS 16 offers the lessee the option to combine lease payments with payments for non-lease components in the calculation of the lease liability and right-of-use asset per class of asset. adidas has not finally decided yet for which classes of underlying assets it will exercise this option. The standard also offers the lessee the option to exclude lease contracts for leased assets with low value and/or with a short-term lease period (less than twelve months) from the recognition of the lease liability and right-of-use asset. adidas has decided to exercise this option to exclude these leases.
The company has continued to collect real estate lease contracts in its global lease management system, which captures the relevant information from lease contracts. adidas is in the process of implementing and configuring a technical system to ensure the storage of data from non-real estate lease contracts and to guarantee IFRS 16-compliant accounting valuations and calculations. Additional system analysis with regard to the IFRS 16 requirements is ongoing. Further analysis of the expected impact on the company’s consolidated financial statements is still in progress.
The interim consolidated financial statements and the interim Group management report were not audited in accordance with § 317 German Commercial Code (Handelsgesetzbuch – HGB) nor reviewed by an auditor.
Costs that are incurred unevenly during the financial year are anticipated or deferred in the interim consolidated financial statements only if it would be also appropriate to anticipate or defer such costs at the end of the financial year.
The results of operations for the first half year ending June 30, 2018 are not necessarily indicative of results to be expected for the entire year.
The interim consolidated financial statements are presented in euros (€) and, unless otherwise stated, all values are presented in millions of euros (€ in millions). Due to rounding principles, numbers presented may not sum up exactly to totals provided.
02 — SUMMARY‐OF SIGNIFICANT‐ACCOUNTING POLICIES
The accounting methods and policies mentioned in the below table and text have partly changed as a result of the initial application of IFRS 9 ‘Financial Instruments’ and IFRS 15 ‘Revenue from Contracts with Customers’. Other newly applied standards and interpretations did not materially affect the company’s accounting policies.
21AD
IDAS
FI
RST
HAL
F YE
AR R
EPOR
T 20
181 AT A GLANCE 2 INTERIM GROUP MANAGEMENT REPORT 3 INTERIM CONSOLIDATED FINANCIAL STATEMENTS (IFRS)
EXPLANATORY NOTES TO THE CONDENSED INTERIM CONSOLIDATED FINANCIAL STATEMENTS (IFRS) AS AT JUNE 30, 2018

Derivative financial instruments adidas uses derivative financial instruments, such as currency options, forward exchange contracts, commodity futures as well as interest rate swaps and cross-currency interest rate swaps, to hedge its exposure to foreign exchange, commodity price and interest rate risks. In accordance with its Treasury Policy, adidas does not enter into transactions with derivative financial instruments for trading purposes.
Derivative financial instruments are initially recognized in the statement of financial position at fair value, and subsequently also measured at their fair value. The method of recognizing the resulting gains or losses is dependent on the nature of the hedge. On the date a derivative contract is entered into, adidas designates derivatives as either a hedge of a forecasted transaction (cash flow hedge) or a hedge of a net investment in a foreign operation.
Changes in the fair value of derivatives that are designated and qualify as cash flow hedges, and that are effective, as defined in IFRS 9, are recognized in equity. adidas is applying the ‘cost of hedging’ approach for dedicated cash flow hedges. Changes in the fair value of the time value component of options, as well as the forward element in forward contracts are recognized separately in equity. The first-time application of IFRS 9 had the consequence that the fair value of the time value component of options was reclassed into equity at the beginning of the comparative period (retrospective application). There was no impact for forward exchange contracts (prospective application). When the effectiveness is not 100%, the ineffective portion of the change in the fair value is recognized in the income statement. Accumulated gains and losses in equity are transferred to the income statement in the same periods during which the hedged forecasted transaction affects the income statement.
Certain derivative transactions, while providing effective economic hedges under the company’s risk management policies, may not qualify for hedge accounting under the specific rules of IFRS 9. Changes in the fair value of any
Principles of measurementThe following table includes an overview of selected subsequent measurement principles used in the preparation of the interim consolidated financial statements.
Overview of selected subsequent measurement principles
Item Subsequent measurement principle
AssetsCash and cash equivalents Nominal amountCash equivalents (investments in money market funds) Fair value through profit or lossShort-term financial assets Fair value through profit or lossAccounts receivable Amortized costContract assets Impairment-only approachInventories Lower of cost and net realizable valueAssets classified as held for sale Lower of carrying amount and fair value less costs to sellProperty, plant and equipment Amortized costGoodwill Impairment-only approachIntangible assets (except goodwill): With definite useful life Amortized cost With indefinite useful life Impairment-only approach
Long-term financial assetsAmortized cost, at fair value through profit or loss, or at fair value through comprehensive income depending on the type of the financial asset
Other financial assetsAmortized cost, or at fair value through profit or loss depending on the type of the financial asset
LiabilitiesBorrowings Amortized costAccounts payable Amortized costLiabilities/provisions for cash-settled share-based payment arrangements Fair valueContract liabilities Expected settlement amountOther financial liabilities Amortized costProvisions: Pensions Projected unit credit method Other provisions Expected settlement amountAccrued liabilities Amortized cost
22AD
IDAS
FI
RST
HAL
F YE
AR R
EPOR
T 20
181 AT A GLANCE 2 INTERIM GROUP MANAGEMENT REPORT 3 INTERIM CONSOLIDATED FINANCIAL STATEMENTS (IFRS)
EXPLANATORY NOTES TO THE CONDENSED INTERIM CONSOLIDATED FINANCIAL STATEMENTS (IFRS) AS AT JUNE 30, 2018

derivative instruments that do not meet these rules are recognized immediately in the income statement.
Hedges of net investments in foreign entities are accounted for in a similar way to cash flow hedges. If the hedging instrument is a derivative (e.g. a forward exchange contract) or a foreign currency borrowing, effective currency gains and losses in the derivative and all gains and losses arising on the translation of the borrowing, respectively, are recognized in equity, with the exception of the cross-currency basis spread.
adidas documents the relationship between hedging instruments and hedge objects at transaction inception, as well as the risk management objectives and strategies for undertaking various hedge transactions. This process includes linking all derivatives designated as hedges to specific firm commitments and forecasted transactions. adidas also assesses the effectiveness and possible ineffectiveness of its derivatives by using different methods of effectiveness testing, such as the ‘dollar offset method’ or the ‘hypothetical derivative method’.
The fair values of currency options, forward exchange contracts and commodity futures are determined on the basis of market conditions on the reporting dates. The fair value of a currency option is determined using generally accepted models to calculate option prices. The fair value of an option is influenced not only by the remaining term of the option but also by additional factors, such as the actual foreign exchange rate and the volatility of the underlying foreign currency base. Fair values are determined taking into consideration the counterparty risk. adidas has exercised the option to calculate the amounts on counterparty level according to IFRS 13 ‘Fair Value Measurement’, paragraph 48.
Cash and cash equivalents Cash and cash equivalents represent cash at banks, cash on hand and short-term deposits with maturities of three months or less from the date of acquisition.
Cash equivalents are short-term, highly liquid investments that are readily convertible to known amounts of cash and which are subject to an insignificant risk of changes in value. Part of cash equivalents include investments in money market funds, which contain cash flows other than those of principal and interest on principal. As a result, those investments are measured at fair value through profit or loss.
Accounts receivableAccounts receivable are recognized at the transaction price, which represents the amount of consideration to which an entity expects to be entitled in exchange for transferring promised goods or services to a customer, excluding amounts collected on behalf of third parties. Subsequently, these are measured at amortized cost.
Other financial assetsOther financial assets that give rise to cash flows consisting only of payments of principal and interest are classified in accordance with the respective business model for managing the financial assets. Financial assets that are held in a business model with the objective to hold them until maturity and collect the contractual cash flows are measured at amortized cost. adidas mainly has security deposits and receivables from credit cards/marketplaces which fall under this category.
Other financial assets that contain cash flows other than those of principal and interest on principal are measured at fair value through profit or loss. This mainly includes secured promissory notes and earn-out components.
Long-term financial assetsAll purchases and sales of long-term financial assets are recognized on the trade date and initially measured at fair value.
Long-term financial assets which were previously classified as available-for-sale and measured at fair value through comprehensive income are now distinguished between debt and equity instruments and classified according to IFRS 9 as follows:
Debt instruments are measured dependent on the business model and the contractual cash flows. Only financial assets that are held within the business model with the objective to collect the contractual cash flows which represent solely payments of principal and interest on the principal amount outstanding are measured at amortized cost. All other financial assets which do not fulfill both of these criteria will be measured at fair value – either at fair value through profit or loss or at fair value through other comprehensive income (debt).
Generally, all investments in equity instruments are measured at fair value through profit or loss. An irrevocable election can be made at initial recognition to capture fair value changes in other comprehensive income for instruments that are neither held for trading nor contingent considerations recognized by an acquirer.
adidas has designated certain investments as equity securities at fair value through other comprehensive income (equity) because these investments represent investments that the company intends to hold for the long term for strategic purposes. The designation of certain equity instruments at fair value through other comprehensive income (equity) is based on a strategic management decision.
Impairment losses on financial assetsImpairment losses for debt financial assets measured at amortized cost or at fair value through other comprehensive income (debt) are recognized in accordance with IFRS 9 ‘Financial Instruments.’ The standard requires that not only historical data, but also future expectations and projections are taken into account when accounting for impairment losses (‘expected credit loss’ model).
23AD
IDAS
FI
RST
HAL
F YE
AR R
EPOR
T 20
181 AT A GLANCE 2 INTERIM GROUP MANAGEMENT REPORT 3 INTERIM CONSOLIDATED FINANCIAL STATEMENTS (IFRS)
EXPLANATORY NOTES TO THE CONDENSED INTERIM CONSOLIDATED FINANCIAL STATEMENTS (IFRS) AS AT JUNE 30, 2018

adidas consistently applies the simplified approach and recognizes lifetime expected credit losses for all accounts receivable. In order to calculate a loss allowance, all accounts receivable sharing similar credit risk characteristics are allocated into several portfolios based on geographical regions and macroeconomic indicators. Historical payment and aging patterns are analyzed individually for each of the portfolios to determine the probability of default which is further adjusted by forward-looking factors derived primarily from the Credit Default Swap (CDS) spreads of the countries where adidas runs its operations. The adjusted probability of default is then applied in combination with a loss given default as a loss rate to calculate the expected credit loss for each portfolio and aging bucket. The rates are reviewed on a regular basis to ensure that they reflect latest data on credit risk. In case an objective evidence of credit impairment is observed for accounts receivable of a specific customer, a detailed analysis of the credit risk is performed and an individual loss allowance is recognized for this customer.
Cash and cash equivalents measured at amortized cost are subject to IFRS 9 impairment requirements. The company is monitoring the credit risk associated with those financial instruments taking into consideration the economic environment, observing external credit ratings and/or CDS spreads of counterparty financial institutions and establishing exposure limits. The credit risk of cash and cash equivalents is insignificant due to their relatively short-term maturity, investment grade credit ratings and established exposure limits. Therefore, any credit impairment losses for cash and cash equivalents are not material for the company.
Contract assets and contract liabilitiesContract assets and liabilities are recognized in connection with revenues arising from the licensing-out of the right to use the adidas and Reebok brands as well as various other trademarks to third parties. Contract assets represent the company’s right to consideration in exchange for rights that
adidas has transferred to a third party and contract liabilities represent the company’s obligation to transfer rights to a third party. The subsequent measurement of contract assets follows the impairment-only approach for financial assets within the scope of IFRS 9. Contract liabilities are measured at the expected settlement amount.
RevenueRevenue derived from the sale of goods is recognized when adidas has satisfied the respective performance obligation by transferring the promised goods to the customer. The goods are transferred when the customer obtains control of the respective goods. The timing of the transfer of control depends on the individual terms of the sales agreement (terms of delivery).
Revenue is measured at the fair value of the consideration received or receivable, net of returns, early payment discounts and rebates.
Under certain conditions and in accordance with contractual agreements, customers of adidas have the right to return products and to either exchange them for similar or other products or to return the products against the issuance of a credit note. Amounts for estimated returns related to revenues are accrued based on past experience on average return rates and average actual return periods by means of a refund liability. The return assets are measured at the former carrying amount of the inventory/product, less any handling cost.
Provided that the customers meet certain predefined conditions, adidas grants its customers different types of globally aligned performance-based rebates. Examples are customers’ sales growth and loyalty as well as sell-out support, e.g. through retail space management/franchise stores. When it is assumed that the customer fulfills the requirements for being granted the rebate, this amount is accrued by means of an accrued liability for marketing and sales.
Customer incentives and options as well as any obligation for adidas to pay for the delivery of goods to the customer do not create separate performance obligations under IFRS 15.
In addition, adidas generates revenue from the licensing-out of the right to use the adidas and Reebok brands as well as various other trademarks to third parties. The related sales-based royalty and commission income is recognized based on the contract terms on an accrual basis. Contracts with guaranteed minimum income result in contract assets and contract liabilities depending on the timing of yearly payments received from customers. The performance obligation related to these contract assets and liabilities is satisfied over the life of the contract, whereby payments are received as arranged in the contract with the customer.
03 — ADJUSTMENTS ACCORDING TO IAS 8The German Financial Reporting Enforcement Panel (FREP) performed an examination in accordance with § 342b section 2 sentence 3 No. 3 HGB (unlimited scope examination on a sampling basis) of the consolidated financial statements of adidas AG at December 31, 2016 and the related 2016 Group management report. The responsible panel concluded that the consolidated financial statements at December 31, 2016 are erroneous:
“The recoverability of the Reebok brand with a book value of EUR 1.47 billion could not be proven based on the docu-mentation provided by the company as at December 31, 2016.
Although an operating loss of around EUR 150 million and restructurings indicate an impairment of the cash-generating units Reebok with the Reebok brand as a major asset, no impairment test was conducted on the basis of the relevant cash-generating Reebok business units. This violates IAS 36.12 in conjunction with IAS 36.22, IAS 36.66 et seq. and § 238 German Commercial Code (Handelsgesetzbuch – HGB).
The company conducted a test for impairment of the intangible asset of the brand by determining the fair value of the Reebok brand based on notional royalty savings (relief-
24AD
IDAS
FI
RST
HAL
F YE
AR R
EPOR
T 20
181 AT A GLANCE 2 INTERIM GROUP MANAGEMENT REPORT 3 INTERIM CONSOLIDATED FINANCIAL STATEMENTS (IFRS)
EXPLANATORY NOTES TO THE CONDENSED INTERIM CONSOLIDATED FINANCIAL STATEMENTS (IFRS) AS AT JUNE 30, 2018

from-royalty method). The estimate is based on the assumption of strong sales growth. Moreover, since the acquisition, an unchanged royalty rate of 4.5% has been used although the brand has sustainably failed to meet the sales targets and has regularly not met its profitability targets since the acquisition of the brand in 2006. Thus, in the present case, the use of non-market-driven input factors and the valuation method applied do not lead to the most reliable estimate of the fair value of the Reebok brand. This violates IFRS 13.2, IFRS 13.9, IFRS 13.61 et seqq. and IFRS 13.69 as well as IAS 36.105.”
After detailed examination, the Executive Board accepted the findings. The error finding resulted in a retrospective correction of the 2016 consolidated financial statements according to IAS 8.41 et seqq.
The following table provides an overview of the impact of all corrections:
Whereas the impairment test of the Reebok trademark was performed based on its fair value using the relief-from-royalty method, adidas re-performed the test for the 2016 financial year using the value-in-use concept for the Reebok cash-generating units allocated to the trademark. Insofar, the carrying amount of the Reebok brand was classified as a corporate asset and allocated to the individual Reebok markets based on the planned revenues.
The recoverable amount of the individual Reebok markets was determined on the basis of value in use based on the present value of the expected future cash flows. The individual Reebok markets are defined as the regional markets which are responsible for the distribution of the Reebok brand. The regional markets are: Western Europe, North America, Greater China, Russia/CIS, Latin America, Japan, Middle East, South Korea and Southeast Asia/Pacific. The number of cash-generating Reebok business units amounted to a total of nine at the end of 2016. The respective discount rates applied to the cash flow projections of the respective cash-generating Reebok business units range from 6.6% to 11.2%.
This calculation uses cash flow projections based on the financial planning covering a four-year period in total. The planning is based on long-term expectations of the company and reflects in total for the Reebok markets an average annual mid-single- to low-double-digit sales increase with varying forecasted growth prospects for the different Reebok markets. Furthermore, adidas expects the operating margin to expand, primarily driven by an improvement in the gross margin as well as lower operating expenses as a percentage of sales. The planning of capital expenditure and working capital is primarily based on past experience. The planning for future tax payments is based on current statutory corporate tax rates of the individual Reebok markets. Cash flows beyond the detailed planning period of the respective Reebok markets are extrapolated using steady growth rates of 1.7%. According to the company’s expectations, these growth rates do not
Adjustment of the adidas AG Opening Consolidated Statement of Financial Position (IFRS) as at January 1, 2017 € in millions
Dec 31, 2016 (as reported)
Adjustment IAS 8
Opening balance
Jan. 1, 20171
AssetsTotal current assets 8,886 – 8,886
Trademarks 1,680 572 1,108Total non-current assets 6,290 572 5,718
Total assets 15,176 572 14,604
Liabilities and equityTotal current liabilities 6,765 – 6,765
Deferred tax liabilities 387 97 289Total non-current liabilities 1,957 97 1,859
Share capital 201 – 201Reserves 749 – 749Retained earnings 5,521 475 5,047Shareholders’ equity 6,472 475 5,997
Non-controlling interests (17) – (17)Total equity 6,455 475 5,980
Total liabilities and equity 15,176 475 14,604
1 Excluding transition effect according to IFRS 9. 25AD
IDAS
FI
RST
HAL
F YE
AR R
EPOR
T 20
181 AT A GLANCE 2 INTERIM GROUP MANAGEMENT REPORT 3 INTERIM CONSOLIDATED FINANCIAL STATEMENTS (IFRS)
EXPLANATORY NOTES TO THE CONDENSED INTERIM CONSOLIDATED FINANCIAL STATEMENTS (IFRS) AS AT JUNE 30, 2018

exceed the long-term average growth rate of the business sector in the individual markets in which Reebok operates.
Discount rates are based on a weighted average cost of capital calculation considering a five-year average market-weighted debt/equity structure and financing costs referencing major competitors for each Reebok market. The discount rates used are after-tax rates and reflect the specific equity and country risk of the relevant Reebok markets.
In total, trademark impairment losses of € 572 million were retrospectively recognized in 2016 and the carrying amount of the Reebok trademark at December 31, 2016 (as reported) in the amount of € 1,470 million was adjusted according to IAS 8 to € 898 million at December 31, 2016. Deferred tax liabilities related to the Reebok trademark were reduced by € 97 million, respectively.
A change in the discount rate by 1.0 percentage points or a reduction of planned free cash inflows by 15% would result in an additional impairment requirement of approximately € 90 million and € 100 million, respectively.
Future changes in expected cash flows and discount rates may lead to impairments and reversals of impairment losses of the Reebok trademark.
For the 2017 financial year as well, an impairment test was retrospectively performed based on the respective groups of cash-generating Reebok business units. In this context, there was no need for any additional impairment or reversal of impairment losses of the Reebok trademark in 2017.
The adjustments according to IAS 8 at January 1, 2017 also had an impact at December 31, 2017 and June 30, 2017, respectively:
Compared to the carrying amount as reported at December 31, 2017, the Reebok trademark decreased accordingly by € 503 million, deferred tax liabilities by € 85 million and shareholders’ equity by € 417 million.
Compared to the carrying amount as reported at June 30, 2017, the Reebok trademark decreased accordingly
by € 528 million, deferred tax liabilities by € 90 million and shareholders’ equity by € 439 million.
Any changes in the adjustments compared to January 1, 2017 solely relate to currency translation differences.
04 — REVENUEThe sales of the company in certain product categories are seasonal and therefore revenues and attributable earnings may vary within the financial year. Sales and earnings tend to be strongest in the first and third quarters of the financial year because these coincide with the launch of the spring/summer and fall/winter collections, respectively. However, shifts in the share of sales and attributable earnings of particular product categories or the regional composition may occur throughout the year.
For a disaggregation of revenue into product categories SEE NOTE 10.
No significant changes in the timing or amount of revenue due to the application of IFRS 15 were identified.
Accordingly, there was no material impact on the company’s interim consolidated income statement for the first half year ending June 30, 2018.
A material impact on the presentation of the customer’s right of return resulted from the application of IFRS 15. Under IAS 18, adidas reduced revenue related to estimated returns based on past experience by means of a return provision, which was calculated on a net basis. The net value was determined by the amount of the gross margin (i.e. the difference between gross sales and cost of sales) for the products sold which are expected to be returned.
The accounting for the return provision was adjusted in accordance with IFRS 15. As of January 1, 2018, a liability in the amount of the credit notes for expected returns is presented. Corresponding with this treatment, an asset for the right to recover products from customers upon settling the refund liability is recognized. The new approach resulted
in an increase in other assets as well as in the return provision not affecting the consolidated income statement and a decrease in the equity ratio. The first-time application of IFRS 15 on January 1, 2018 resulted in an increase in the return provision (included in ‘Current accrued liabilities’) of € 237 million, an initially recognized return asset (included in ‘Other current assets’) in an amount of € 196 million and a decrease in retained earnings in an amount of € 41 million in the company’s consolidated statement of financial position. As at June 30, 2018, the return liability and the return asset increased by € 263 million and € 209 million, respectively, due to the application of IFRS 15 compared to IAS 18.
Due to the application of IFRS 15, contract assets and contract liabilities were recognized for the first time in relation to revenues from licensing contracts. The effect of this application resulted in the first-time recognition of contract assets in an amount of € 7 million, contract liabilities in an amount of € 1 million, and an increase in retained earnings in an amount of € 6 million. As at June 30, 2018, contract assets and contract liabilities increased by € 7 million and € 1 million respectively due to the application of IFRS 15 compared to IAS 18.
05 — DISCONTINUED OPERATIONSThe results of the Rockport, TaylorMade and CCM operations that were sold in previous periods are shown as discontinued operations in the consolidated income statement.
The net result of discontinued operations presented in the consolidated income statement as at June 30, 2018 contains an adjustment in connection with the sale of the Rockport operating segment in July 2015.
Losses from discontinued operations for the first six months ending June 30, 2018 in an amount of € 23 million (2017: losses of € 195 million) are entirely attributable to the shareholders of adidas AG.
26AD
IDAS
FI
RST
HAL
F YE
AR R
EPOR
T 20
181 AT A GLANCE 2 INTERIM GROUP MANAGEMENT REPORT 3 INTERIM CONSOLIDATED FINANCIAL STATEMENTS (IFRS)
EXPLANATORY NOTES TO THE CONDENSED INTERIM CONSOLIDATED FINANCIAL STATEMENTS (IFRS) AS AT JUNE 30, 2018

06 — SHAREHOLDERS’ EQUITYDuring the period from January 1, 2018 to June 30, 2018, the nominal capital of adidas AG remained unchanged. Consequently, on June 30, 2018, the nominal capital of adidas AG amounted to € 209,216,186, divided into 209,216,186 registered no-par-value shares.
Based on the authorization to repurchase treasury shares resolved upon by the Annual General Meeting on May 12, 2016, the company started the first tranche of a new share buyback program on March 22, 2018. While the company may use the repurchased shares for all purposes admissible under the granted authorization with the exception of the transfer of shares as a compensation component for the company’s Executive Board members, adidas AG plans to cancel the majority of the repurchased shares.
adidas AG purchased a total of 161,888 shares for a total price of € 31,570,000.06 (excluding incidental purchasing costs), i.e. for an average price of € 195.01 per share, in the period between March 22, 2018 and March 31, 2018 inclusive. This corresponded to a notional amount of € 161,888 in the nominal capital and consequently to 0.08% of the nominal capital.
In April 2018, 479,177 shares were purchased for a total price of € 98,679,133.76 (excluding incidental purchasing costs), i.e. for an average price of € 205.93 per share. This corresponded to a notional amount of € 479,177 in the nominal capital and consequently to 0.23% of the nominal capital.
In May 2018, 617,854 shares were purchased for a total price of € 120,189,123.80 (excluding incidental purchasing costs), i.e. for an average price of € 194.53 per share. This corresponded to a notional amount of € 617,854 in the nominal capital and consequently to 0.3% of the nominal capital.
On May 24, 2018, the company (including the shares purchased since 2014) exceeded the reportable threshold of 3% of the shares in adidas AG as defined by § 40 section 1 sentence 2 German Securities Trading Act (Wertpapier-
handels gesetz - WpHG). The share of voting rights amounted to 3.008% (6,293,433 shares) at that time.
In June 2018, 1,539,068 shares were purchased for a total price of € 293,306,320.11 (excluding incidental purchasing costs), i.e. for an average price of € 190.57 per share. This corresponded to a notional amount of € 1,539,068 in the nominal capital and consequently to 0.74% of the nominal capital.
Due to the fact that conversion rights were exercised, a total of 34,692 treasury shares of adidas AG were delivered to the holders of adidas AG’s convertible bond in the period from January 1, 2018 to June 30, 2018.
Moreover, 22,360 treasury shares were used as consideration, i.a. for the transfer or licensing of industrial property rights and intangible property rights due to contractual obligations.
In the 2016 financial year, adidas AG introduced an employee stock purchase plan in favor of employees of adidas AG and its affiliated companies. Outside the share buyback program initiated in March, the company purchased adidas AG shares in connection with this employee stock purchase plan. For instance, on January 8, 2018, adidas AG purchased 25,672 adidas AG shares at an average price of € 173.27 in connection with the employee stock purchase plan. This corresponded to a total price of € 4,448,258 (excluding incidental purchasing costs) with a pro rata amount or an amount in the nominal capital of € 25,672 or 0.01%. At the same time, adidas AG also purchased a further 3,642 adidas AG shares at an average price of € 173.27, which were used as matching shares. This corresponded to a total price of € 631,059 (excluding incidental purchasing costs) with a pro rata amount or an amount in the nominal capital of € 3,642 or 0.002%. All shares purchased for this purpose on January 8, 2018 were issued to the eligible employees on January 10, 2018. On April 9, 2018, adidas AG purchased a further 24,104 adidas AG shares at an average price of € 201.88 in connection with the employee stock purchase
plan. This corresponded to a total price of € 4,866,054 (excluding incidental purchasing costs) with a pro rata amount or an amount in the nominal capital of € 24,104 or 0.012%. At the same time, adidas AG purchased a further 2,751 adidas AG shares at an average price of € 201.88, which were used as matching shares. This corresponded to a total price of € 555,365 (excluding incidental purchasing costs) with a pro rata amount or an amount in the nominal capital of € 2,751 or 0.0013%. All shares purchased for this purpose on April 9, 2018 were issued to the eligible employees on April 11, 2018. On July 6, 2018, adidas AG purchased a further 30,504 adidas AG shares at an average price of € 182.47 in connection with the employee stock purchase plan. This corresponded to a total price of € 5,566,187 (excluding incidental purchasing costs) with a pro rata amount or an amount in the nominal capital of € 30,504 or 0.015%. At the same time, adidas AG purchased a further 3,040 adidas AG shares at an average price of € 182.47, which were used as matching shares. This corresponded to a total price of € 554,720 (excluding incidental purchasing costs) with a pro rata amount or an amount in the nominal capital of € 3,040 or 0.0014%. All shares purchased for this purpose on July 6, 2018 were issued to the eligible employees on July 10, 2018.
On June 30, 2018, adidas AG held a total of 8,095,887 treasury shares (including the shares purchased since 2014), corresponding to a notional amount of € 8,095,887 in the nominal capital and consequently to 3.87% of the nominal capital. In accordance with § 71b German Stock Corporation Act (Aktiengesetz – AktG), the treasury shares held directly or indirectly do not confer any rights to the company. 27
ADID
AS
FIRS
T H
ALF
YEAR
REP
ORT
2018
1 AT A GLANCE 2 INTERIM GROUP MANAGEMENT REPORT 3 INTERIM CONSOLIDATED FINANCIAL STATEMENTS (IFRS)
EXPLANATORY NOTES TO THE CONDENSED INTERIM CONSOLIDATED FINANCIAL STATEMENTS (IFRS) AS AT JUNE 30, 2018

07 — FINANCIAL INSTRUMENTS
Carrying amounts of financial instruments as at June 30, 2018 and their fair values € in millions
IAS 39 IFRS 9 IAS 39 Transition effect IFRS 9
Retained earningsRevenue reserves Deferred tax
Category Measurement Category
Carrying amount Dec. 31,
2017
New measurement
category
Change of evaluation
measurement
Carrying amount
Jan. 1, 2018
Carrying amount
June 30, 2018
Fair value June 30, 2018
Financial assetsCash and cash equivalents
Cash and cash equivalents n.a.Amortized
cost Amortized cost 1,598 1,598 1,115
Cash equivalents n.a.Amortized
cost
Fair value through profit
or loss – – 198
Short-term financial assets FAHfT
Fair value recognized in
net income
Fair value through profit
or loss 5 5 5
Accounts receivable LaRAmortized
cost Amortized cost 2,315 (2) (1) 2,312 2,751Other current financial assets
Derivatives used in hedge accounting n.a.
Fair value recognized in
equityHedge
Accounting 82 5 (5) 82 136
Derivatives not used in hedge accounting FAHfT
Fair value recognized in
net income
Fair value through profit
or loss 28 28 24
Promissory notes n.a.
Fair value recognized in
net income
Fair value through profit
or loss – 32 30
Other financial assets LaRAmortized
cost Amortized cost 283 (0) (0) 252 232
1 Finance lease obligations are measured according to IAS 17. 28AD
IDAS
FI
RST
HAL
F YE
AR R
EPOR
T 20
181 AT A GLANCE 2 INTERIM GROUP MANAGEMENT REPORT 3 INTERIM CONSOLIDATED FINANCIAL STATEMENTS (IFRS)
EXPLANATORY NOTES TO THE CONDENSED INTERIM CONSOLIDATED FINANCIAL STATEMENTS (IFRS) AS AT JUNE 30, 2018

Carrying amounts of financial instruments as at June 30, 2018 and their fair values € in millions
IAS 39 IFRS 9 IAS 39 Transition effect IFRS 9
Retained earningsRevenue reserves Deferred tax
Category Measurement Category
Carrying amount Dec. 31,
2017
New measurement
category
Change of evaluation
measurement
Carrying amount
Jan. 1, 2018
Carrying amount
June 30, 2018
Fair value June 30, 2018
Long-term financial assets
Other equity investments FAHfT
Fair value recognized in
net income
Fair value through profit
or loss 82 82 82
Other equity investments AfS
At cost less impairment
losses
Fair value through profit
or loss 3 9 4
Other equity investments AfS
At cost less impairment
losses
Fair value through other
comprehensive income 53 5 2 63 58
Other equity investments AfS
Fair value recognized in
equity
Fair value through profit
or loss 26 26 28
Other equity investments AfS
Fair value recognized in
equity Amortized cost 62 62 104
Loans LaRAmortized
cost Amortized cost 9 1 1Other non-current financial assets
Derivatives used in hedge accounting n.a.
Fair value recognized in
equityHedge
Accounting 1 1 20
Derivatives not used in hedge accounting FAHfT
Fair value recognized in
net income
Fair value through profit
or loss 14 14 9
Promissory notes n.a.
Fair value recognized in
net income
Fair value through profit
or loss 118 118 119
Earn-out components FAHfT
Fair value recognized in
net income
Fair value through profit
or loss 19 19 20
Other financial assets LaRAmortized
cost Amortized cost 67 (0) (0) 67 92
1 Finance lease obligations are measured according to IAS 17.
29AD
IDAS
FI
RST
HAL
F YE
AR R
EPOR
T 20
181 AT A GLANCE 2 INTERIM GROUP MANAGEMENT REPORT 3 INTERIM CONSOLIDATED FINANCIAL STATEMENTS (IFRS)
EXPLANATORY NOTES TO THE CONDENSED INTERIM CONSOLIDATED FINANCIAL STATEMENTS (IFRS) AS AT JUNE 30, 2018

Carrying amounts of financial instruments as at June 30, 2018 and their fair values € in millions
IAS 39 IFRS 9 IAS 39 Transition effect IFRS 9
Retained earningsRevenue reserves Deferred tax
Category Measurement Category
Carrying amount Dec. 31,
2017
New measurement
category
Change of evaluation
measurement
Carrying amount
Jan. 1, 2018
Carrying amount
June 30, 2018
Fair value June 30, 2018
Financial liabilitiesShort-term borrowings
Bank borrowings FLACAmortized
cost Amortized cost 106 106 68
Convertible bond FLACAmortized
cost Amortized cost 31 31 28 65
Accounts payable FLACAmortized
cost Amortized cost 1,975 1,975 1,858
Current accrued liabilities FLACAmortized
cost Amortized cost 837 837 806Refund liability - - n.a. – 563 662Other current financial liabilities
Derivatives used in hedge accounting n.a.
Fair value recognized in
equityHedge
Accounting 250 250 89
Derivatives not used in hedge accounting FLHfT
Fair value recognized in
net income
Fair value through profit
or loss 24 24 31
Earn-out components FLHfT
Fair value recognized in
net income
Fair value through profit
or loss 21 21 7
Other financial liabilities FLACAmortized
cost Amortized cost 67 67 148Finance lease obligations1 n.a. n.a. n.a. 0 0 0
1 Finance lease obligations are measured according to IAS 17.
30AD
IDAS
FI
RST
HAL
F YE
AR R
EPOR
T 20
181 AT A GLANCE 2 INTERIM GROUP MANAGEMENT REPORT 3 INTERIM CONSOLIDATED FINANCIAL STATEMENTS (IFRS)
EXPLANATORY NOTES TO THE CONDENSED INTERIM CONSOLIDATED FINANCIAL STATEMENTS (IFRS) AS AT JUNE 30, 2018

Carrying amounts of financial instruments as at June 30, 2018 and their fair values € in millions
IAS 39 IFRS 9 IAS 39 Transition effect IFRS 9
Retained earningsRevenue reserves Deferred tax
Category Measurement Category
Carrying amount Dec. 31,
2017
New measurement
category
Change of evaluation
measurement
Carrying amount
Jan. 1, 2018
Carrying amount
June 30, 2018
Fair value June 30, 2018
Long-term borrowings
Bank borrowings FLACAmortized
cost Amortized cost – – 150
Eurobond FLACAmortized
cost Amortized cost 983 983 984 1,037
Non-current accrued liabilities FLACAmortized
cost Amortized cost 1 1 1Other non-current financial liabilities
Derivatives used in hedge accounting n.a.
Fair value recognized in
equityHedge
Accounting 9 9 0
Derivatives not used in hedge accounting FLHfT
Fair value recognized in
net income
Fair value through profit
or loss 5 5 1
Earn-out components FLHfT
Fair value recognized in
net income
Fair value through profit
or loss 5 5 5
Other financial liabilities FLACAmortized
cost Amortized cost 1 1 0Finance lease obligations1 n.a. n.a. n.a. 3 3 3
1 Finance lease obligations are measured according to IAS 17.
31AD
IDAS
FI
RST
HAL
F YE
AR R
EPOR
T 20
181 AT A GLANCE 2 INTERIM GROUP MANAGEMENT REPORT 3 INTERIM CONSOLIDATED FINANCIAL STATEMENTS (IFRS)
EXPLANATORY NOTES TO THE CONDENSED INTERIM CONSOLIDATED FINANCIAL STATEMENTS (IFRS) AS AT JUNE 30, 2018

Carrying amounts of financial instruments as at June 30, 2018 and their fair values € in millions
IAS 39 IFRS 9 IAS 39 Transition effect IFRS 9
Retained earningsRevenue reserves Deferred tax
Category Measurement Category
Carrying amount Dec. 31,
2017
New measurement
category
Change of evaluation
measurement
Carrying amount
Jan. 1, 2018
Carrying amount
June 30, 2018
Fair value June 30, 2018
Thereof: aggregated by category according to IAS 39Financial assets at fair value through profit or loss 149
Thereof: designated as such upon initial recognition (Fair Value Option - FVO) –Thereof: held for trading (FAHfT) 149
Loans and receivables (LaR) 2,674Available-for-sale financial assets (AfS) 145Financial liabilities at amortized cost (FLAC) 4,001Financial liabilities at fair value through profit or loss held for trading (FLHfT) 54
Thereof: aggregated by category according to IFRS 9Financial assets at fair value through profit or loss (FVTPL) 334 519
Thereof: designated as such upon initial recognition (Fair Value Option - FVO) – –Thereof: held for trading (FAHfT) 82 82
Financial assets at fair value through other comprehensive income (FVOCI) 146 213
Thereof: debt instruments – –Thereof: derivatives used in hedge accounting 83 156Thereof: equity investments (without recycling to profit and loss) 63 58
Financial assets at amortized cost (AC) 4,292 4,295Financial liabilities at fair value through profit or loss (FVTPL) 54 43
Thereof: held for trading (FLHfT) – –Financial liabilities at fair value through other comprehensive income (FVOCI) 259 90
Thereof: derivatives used in hedge accounting 259 90Financial liabilities at amortized cost (AC) 4,001 4,042
1 Finance lease obligations are measured according to IAS 17.
32AD
IDAS
FI
RST
HAL
F YE
AR R
EPOR
T 20
181 AT A GLANCE 2 INTERIM GROUP MANAGEMENT REPORT 3 INTERIM CONSOLIDATED FINANCIAL STATEMENTS (IFRS)
EXPLANATORY NOTES TO THE CONDENSED INTERIM CONSOLIDATED FINANCIAL STATEMENTS (IFRS) AS AT JUNE 30, 2018
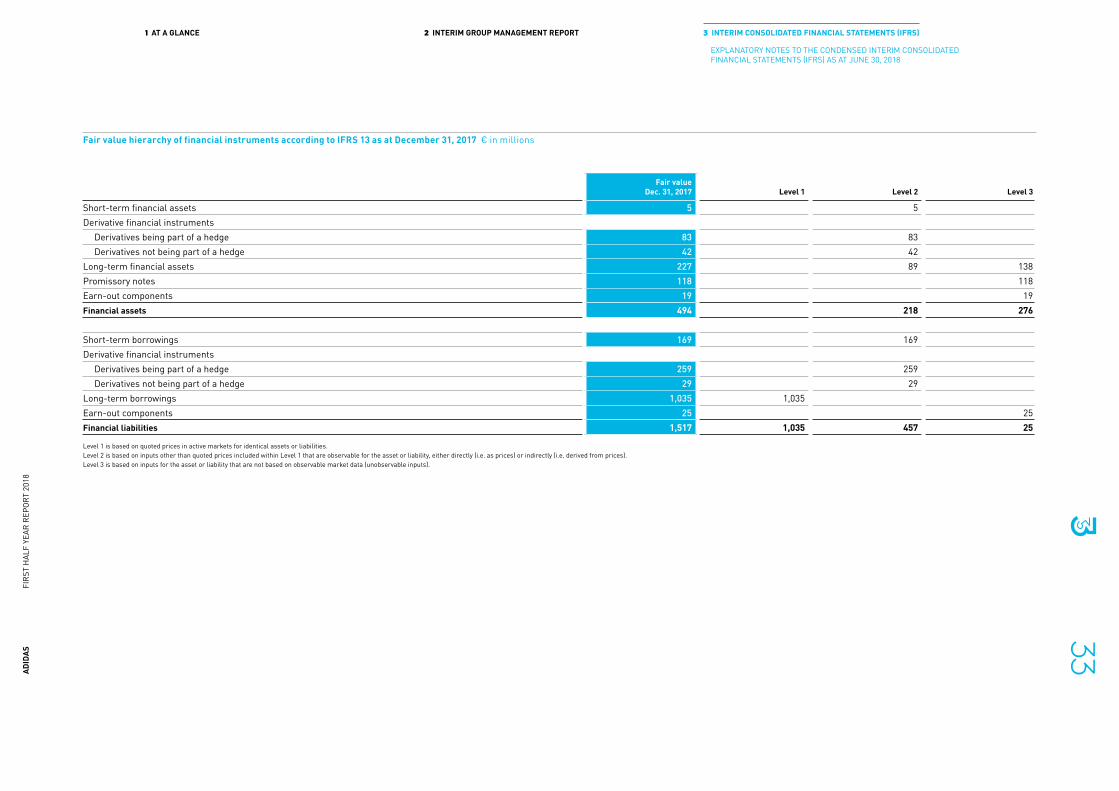
Fair value hierarchy of financial instruments according to IFRS 13 as at December 31, 2017 € in millions
Fair value Dec. 31, 2017 Level 1 Level 2 Level 3
Short-term financial assets 5 5Derivative financial instruments
Derivatives being part of a hedge 83 83Derivatives not being part of a hedge 42 42
Long-term financial assets 227 89 138Promissory notes 118 118Earn-out components 19 19Financial assets 494 218 276
Short-term borrowings 169 169Derivative financial instruments
Derivatives being part of a hedge 259 259Derivatives not being part of a hedge 29 29
Long-term borrowings 1,035 1,035Earn-out components 25 25Financial liabilities 1,517 1,035 457 25
Level 1 is based on quoted prices in active markets for identical assets or liabilities.Level 2 is based on inputs other than quoted prices included within Level 1 that are observable for the asset or liability, either directly (i.e. as prices) or indirectly (i.e. derived from prices).Level 3 is based on inputs for the asset or liability that are not based on observable market data (unobservable inputs).
33AD
IDAS
FI
RST
HAL
F YE
AR R
EPOR
T 20
181 AT A GLANCE 2 INTERIM GROUP MANAGEMENT REPORT 3 INTERIM CONSOLIDATED FINANCIAL STATEMENTS (IFRS)
EXPLANATORY NOTES TO THE CONDENSED INTERIM CONSOLIDATED FINANCIAL STATEMENTS (IFRS) AS AT JUNE 30, 2018

Fair value hierarchy of financial instruments according to IFRS 13 as at June 30, 2018 € in millions
Fair value June 30, 2018 Level 1 Level 2 Level 3
Cash equivalents 198 198Short-term financial assets 5 5Derivative financial instruments
Derivatives used in hedge accounting 156 156Derivatives not used in hedge accounting 33 33
Long-term financial assetsEquity investments (FVTPL) 86 86Equity investments (FVOCI) 58 58Other long-term financial assets 28 28
Promissory notes 149 149Earn-out components 20 20Financial assets 732 420 312
Short-term borrowings 132 132Derivative financial instruments
Derivatives used in hedge accounting 90 90Derivatives not used in hedge accounting 32 32
Long-term borrowings 1,187 1,187Earn-out components 11 11Financial liabilities 1,453 1,187 254 11
Level 1 is based on quoted prices in active markets for identical assets or liabilities.Level 2 is based on inputs other than quoted prices included within Level 1 that are observable for the asset or liability, either directly (i.e. as prices) or indirectly (i.e. derived from prices).Level 3 is based on inputs for the asset or liability that are not based on observable market data (unobservable inputs).
34AD
IDAS
FI
RST
HAL
F YE
AR R
EPOR
T 20
181 AT A GLANCE 2 INTERIM GROUP MANAGEMENT REPORT 3 INTERIM CONSOLIDATED FINANCIAL STATEMENTS (IFRS)
EXPLANATORY NOTES TO THE CONDENSED INTERIM CONSOLIDATED FINANCIAL STATEMENTS (IFRS) AS AT JUNE 30, 2018

Reconciliation of fair value hierarchy level 3 in 2017 € in millions
Fair value Jan. 1, 2017 Additions Disposals Gains Losses
Currency translation
Fair value Dec. 31, 2017
Long-term financial assets
This category relates to an 8.33% investment in FC Bayern München AG of € 82 million. Dividends are distributed by FC Bayern München AG instead of regular interest payments. These dividends are recognized in other financial income. 81 – – 1 – – 82
Promissory note On July 26, 2017, adidas signed a definitive agreement to sell the CCM Hockey operating segment which was divested on September 1, 2017. The transaction included a promissory note. The discounted cash flow method is applied. The fair value adjustment is recognized in discontinued operations. – 36 – – (1) – 35
Promissory note On May 10, 2017, adidas signed a definitive agreement to sell its TaylorMade business including the brands TaylorMade, Adams Golf and Ashworth (together TaylorMade) which was divested on October 2, 2017. The transaction included a promissory note. The discounted cash flow method is applied. The fair value adjustment is recognized in discontinued operations. – 86 – – (0) (3) 83
Promissory notes On January 23, 2015, adidas signed a definitive agreement to sell the Rockport operating segment which was divested on July 31, 2015. The transaction included contingent promissory notes. The discounted cash flow method is applied. The fair value adjustment is recognized in discontinued operations. 45 – – – (40) (5) –
Earn-out components (assets)
On May 10, 2017, adidas signed a definitive agreement to sell its TaylorMade business including the brands TaylorMade, Adams Golf and Ashworth (together TaylorMade) which was divested on October 2, 2017. The transaction included earn-out components which are measured based on the Monte Carlo method. The earn-out components are dependent on the achievement of certain perfor-mance measures over the first five years. The fair value adjustment is recog-nized in discontinued operations. – 19 – – – – 19
Investments in other equity instruments
The change in fair value refers to recognized impairment losses resulting from one or more events where objective evidence of an impairment was identified, considering expectations regarding future business development. The impairment is recognized in other financial result. 64 26 (14) – (20) – 56
Earn-out components (liabilities)
The acquisition of Runtastic includes earn-out components which are measured based on the discounted cash flow method. The earn-out compo-nents are dependent on retention of the Runtastic management as well as on the achievement of certain performance measures over the first three years after the acquisition. The fair value adjustment refers to accretion and is recognized in interest result. 22 – (2) – 5 – 25 35
ADID
AS
FIRS
T H
ALF
YEAR
REP
ORT
2018
1 AT A GLANCE 2 INTERIM GROUP MANAGEMENT REPORT 3 INTERIM CONSOLIDATED FINANCIAL STATEMENTS (IFRS)
EXPLANATORY NOTES TO THE CONDENSED INTERIM CONSOLIDATED FINANCIAL STATEMENTS (IFRS) AS AT JUNE 30, 2018

Reconciliation of fair value hierarchy level 3 in 2018 € in millions
Fair value Jan. 1, 2018 Additions Disposals Gains Losses
Currency translation
Fair value June 30, 2018
Investments in other equity instruments held for trading (FAHfT)
This category relates to an 8.33% investment in FC Bayern München AG of € 82 million. Dividends are distributed by FC Bayern München AG instead of regular interest payments. These dividends are recognized in other financial income. 82 – – – – – 82
Investments in other equity instruments (FVTPL)
The significant inputs (financing rounds) used to measure fair value include one or more events where objective evidence of any changes was identified, consid-ering expectations regarding future business development.The change in fair value mainly relates to recognized impairment losses and is recognized in other financial result. 9 – 5 – – – 4
Investments in other equity instruments (FVOCI)
The option to measure equity instruments at fair value through other compre-hensive income upon implementation of IFRS 9 has been exercised. The significant inputs (financing rounds) used to measure fair value include one or more events where objective evidence of any changes was identified, consid-ering expectations regarding future business development. The change in fair value is recognized in other comprehensive income. 63 – – – 6 1 58
Promissory note On July 26, 2017, adidas signed a definitive agreement to sell the CCM Hockey operating segment which was divested on September 1, 2017. The transaction included a promissory note. The discounted cash flow method is applied. The fair value adjustment is recognized in discontinued operations. 35 – – 1 1 1 36
Promissory note On May 10, 2017, adidas signed a definitive agreement to sell its TaylorMade business including the brands TaylorMade, Adams Golf and Ashworth (together TaylorMade) which was divested on October 2, 2017. The transaction included a promissory note. The discounted cash flow method is applied. The fair value adjustment is recognized in discontinued operations. 83 – – – 2 2 84
Promissory note On June 30, 2016, adidas formally completed the divestiture of the Mitchell & Ness business. The transaction included a promissory note. The discounted cash flow method is applied. The fair value adjustment is recognized in financial result. 32 – 4 1 – 1 29
Earn-out components (assets)
On May 10, 2017, adidas signed a definitive agreement to sell its TaylorMade business including the brands TaylorMade, Adams Golf and Ashworth (together TaylorMade). The transaction included earn-out components which are measured based on the Monte Carlo method. The earn-out components are dependent on the achievement of certain performance measures over the first five years. The fair value adjustment is recognized in discontinued operations. 19 – – 0 – – 20
Earn-out components (liabilities)
The acquisition of Runtastic includes earn-out components which are measured based on the discounted cash flow method. The earn-out compo-nents are dependent on retention of the Runtastic management as well as on the achievement of certain performance measures over the first three years after the acquisition. The fair value adjustment refers to accretion and is recog-nized in interest result. 25 – 20 – 6 – 11
36AD
IDAS
FI
RST
HAL
F YE
AR R
EPOR
T 20
181 AT A GLANCE 2 INTERIM GROUP MANAGEMENT REPORT 3 INTERIM CONSOLIDATED FINANCIAL STATEMENTS (IFRS)
EXPLANATORY NOTES TO THE CONDENSED INTERIM CONSOLIDATED FINANCIAL STATEMENTS (IFRS) AS AT JUNE 30, 2018

The valuation methods used in measuring Level 1, Level 2 and Level 3 fair values remain unchanged and can be found in the Notes to the 2017 consolidated financial statements.
As a consequence of the ‘expected credit loss’ model and the new requirements of IFRS 9, credit losses are normally recognized earlier than in the case of the former IAS 39 ‘incurred credit loss’ approach. The first-time application of IFRS 9 led to an increase in the loss allowance for financial instruments of € 2 million (net of tax) which is mainly attributable to accounts receivable and, to a lesser extent, other financial assets. In the first half year 2018, impairment losses on financial assets measured at amortized cost amounted to € 26 million and gains from reversals of impairment losses amounted to € 1 million.
08 — OTHER OPERATING INCOME AND OTHER OPERATING EXPENSES
Other operating income mainly includes income from the release of accrued liabilities and other provisions as well as sundry income.
Other operating expenses include expenses for marketing, sales and research and development, as well as for logistics and central administration. In addition, they include impairment losses as well as depreciation on tangible assets and amortization on intangible assets (except goodwill impairment losses), with the exception of depreciation and amortization which is included in the cost of sales. In the first half of 2018, depreciation and amortization expense for tangible and intangible assets (excluding goodwill) and impairment losses amounted to € 216 million (2017: € 204 million).
09 — EARNINGS PER SHAREBasic earnings per share are calculated by dividing the net income from continuing operations attributable to shareholders by the weighted average number of shares outstanding during the year, excluding ordinary shares purchased by adidas and held as treasury shares.
It is necessary to include potential dilutive shares arising from the convertible bond issuance in March 2012 in the calculation of diluted earnings per share for the first half year ending June 30, 2018 as the conversion right has a value at the balance sheet date. The average share price reached € 188.84 per share during the first half of 2018 and thus exceeded the conversion price of € 80.48 per share.
Net gains/(losses) on financial instruments recognized in the consolidated income statement € in millions
Year ending Dec. 31,
2017
Year ending Dec. 31,
2016
Financial assets or financial liabilities at fair value through profit or loss 1 1
Thereof: designated as such upon initial recognition – –Thereof: classified as held for trading 1 1
Loans and receivables (60) (35)Available-for-sale financial assets (56) (3)Financial liabilities at amortized cost 22 15
Net gains/(losses) on financial instruments recognized in the consolidated income statement € in millions
Period ending
June 30, 2018
Financial assets classified at amortized cost (AC) (25)Financial assets at fair value through profit or loss (FVTPL) 2
Thereof: designated as such upon initial recognition –Thereof: classified as held for trading –
Equity instruments at fair value through profit or loss (FVTPL) (1)Equity instruments at fair value through other comprehensive income (FVOCI) –Financial liabilities at amortized cost (AC) 14Financial liabilities at fair value through profit or loss (FVTPL) 6
Thereof: designated as such upon initial recognition –Thereof: classified as held for trading –
37AD
IDAS
FI
RST
HAL
F YE
AR R
EPOR
T 20
181 AT A GLANCE 2 INTERIM GROUP MANAGEMENT REPORT 3 INTERIM CONSOLIDATED FINANCIAL STATEMENTS (IFRS)
EXPLANATORY NOTES TO THE CONDENSED INTERIM CONSOLIDATED FINANCIAL STATEMENTS (IFRS) AS AT JUNE 30, 2018

10 — SEGMENTAL INFORMATION adidas operates predominantly in one industry segment – the design, distribution and marketing of athletic and sports lifestyle products.
As already communicated in the 2017 adidas Annual Report, effective January 1, 2018, the four former operating segments Greater China, Japan, South Korea and Southeast Asia/Pacific were consolidated to one operating segment Asia-Pacific. The comparative information presented in this note has been restated accordingly. As at June 30, 2018, following the company’s internal management reporting by markets and in accordance with the definition of IFRS 8 ‘Operating Segments’, ten operating segments were identified: Western Europe, North America adidas, North America Reebok, Asia-Pacific, Latin America, Emerging Markets (formerly called Middle East), Russia/CIS, adidas Golf, Runtastic and Other centrally managed businesses. Due to the completed divestitures, income and expenses of the former TaylorMade and CCM Hockey operating segments were reported as discontinued operations as at June 30, 2018.
SEE NOTE 05 The operating segments North America adidas and North America Reebok were aggregated to North America. According to the criteria of IFRS 8 for reportable segments, the operating segments Western Europe, North America, Asia-Pacific, Latin America, Emerging Markets and Russia/CIS are reported separately. The remaining operating segments are aggregated under Other Businesses due to their only subordinate materiality.
Each market comprises all wholesale, retail and e-commerce business activities relating to the distribution and sale of products of the adidas and Reebok brands to retail customers and end consumers.
adidas Golf comprises the distribution and sale of adidas Golf branded products.
Runtastic operates in the digital health and fitness space. The company provides a comprehensive ecosystem for tracking and managing health and fitness data.
Earnings per share
Continuing operations Discontinued operations Total
First half year 2018 First half year 2017 First half year 2018 First half year 2017 First half year 2018 First half year 2017
Net income from continuing operations (€ in millions) 960 809 – – – –Net income attributable to non-controlling interests (€ in millions) 2 1 – – – –Net income attributable to shareholders (€ in millions) 959 808 (23) (195) 936 613Weighted average number of shares 203,391,785 201,783,166 203,391,785 201,783,166 203,391,785 201,783,166Basic earnings per share (€) 4.71 4.00 (0.11) (0.97) 4.60 3.04
Net income attributable to shareholders (€ in millions) 959 808 (23) (195) 936 613Interest expense on convertible bond, net of taxes (€ in millions) 0 2 – – 0 2Net income used to determine diluted earnings per share (€ in millions) 959 810 (23) (195) 936 615Weighted average number of shares 203,391,785 201,783,166 203,391,785 201,783,166 203,391,785 201,783,166Weighted assumed conversion of the convertible bond 369,846 2,452,688 – – 369,846 2,452,688Weighted average number of shares for diluted earnings per share 203,761,631 204,235,854 203,391,785 201,783,166 203,761,631 204,235,854Diluted earnings per share (€) 4.70 3.96 (0.11) (0.97) 4.59 3.01
38AD
IDAS
FI
RST
HAL
F YE
AR R
EPOR
T 20
181 AT A GLANCE 2 INTERIM GROUP MANAGEMENT REPORT 3 INTERIM CONSOLIDATED FINANCIAL STATEMENTS (IFRS)
EXPLANATORY NOTES TO THE CONDENSED INTERIM CONSOLIDATED FINANCIAL STATEMENTS (IFRS) AS AT JUNE 30, 2018

Other centrally managed businesses primarily includes the business activities of the Y-3 label.
Certain centralized corporate functions do not meet the definition of IFRS 8 for an operating segment. This includes, in particular, functions such as Global Brands and Global Sales (central brand and distribution management for the adidas and Reebok brands), central treasury, global sourcing as well as other headquarter functions. Assets, liabilities, income and expenses relating to these corporate functions are presented in the reconciliations.
There are no intersegment sales between the reportable segments.
The results of the operating segments are reported in the line item ‘Segmental operating profit’. This is defined as gross profit minus other operating expenses plus royalty and commission income and other operating income attributable to the segment or group of segments, however without considering headquarter costs and central expenditure for marketing investments.
Segmental assets include accounts receivable as well as inventories. Only these items are reported to the chief operating decision maker on a regular basis.
Segmental liabilities only contain accounts payable from operating activities as there are no other liability items reported regularly to the chief operating decision maker.
Segments € in millions
Net sales (third parties)1Segmental
operating profit1 Segmental assets2 Segmental liabilities2
2018 2017 2018 2017 2018 2017 2018 2017
Western Europe 3,023 2,969 644 620 1,912 1,956 98 78North America 2,122 2,001 279 228 1,536 1,392 64 64Asia-Pacific 3,582 3,240 1,253 1,122 1,181 989 244 162Latin America 847 895 143 96 666 788 73 50Emerging Markets 560 644 148 158 402 448 30 36Russia/CIS 297 341 67 58 176 247 8 6Reportable segments 10,430 10,090 2,533 2,282 5,872 5,818 516 394
Other Businesses (continuing operations) 378 395 56 51 291 287 19 23Other Businesses (discontinued operations) 30 478 (2) 35 – 343 – 71
Other Businesses (total) 408 873 54 85 291 630 19 95Total 10,838 10,963 2,587 2,367 6,163 6,449 535 489
1 First half year.2 At June 30.
39AD
IDAS
FI
RST
HAL
F YE
AR R
EPOR
T 20
181 AT A GLANCE 2 INTERIM GROUP MANAGEMENT REPORT 3 INTERIM CONSOLIDATED FINANCIAL STATEMENTS (IFRS)
EXPLANATORY NOTES TO THE CONDENSED INTERIM CONSOLIDATED FINANCIAL STATEMENTS (IFRS) AS AT JUNE 30, 2018

11 — EVENTS AFTER THE BALANCE SHEET DATEBetween the end of the first half of 2018 and the finalization of these interim consolidated financial statements on July 25, 2018, there were no major company-specific matters which we expect to influence our business materially going forward.
Herzogenaurach, July 25, 2018
The Executive Board of adidas AG
Operating profit € in millions
First half year 2018
First half year 2017
Operating profit for reportable segments 2,533 2,282Operating profit for Other Businesses 54 85Segmental operating profit 2,587 2,367Reclassification to discontinued operations 2 (35)HQ (756) (694)Central expenditure for marketing investments (443) (379)Consolidation (52) (117)Operating profit 1,338 1,142Financial income 22 32Financial expenses (23) (43)Income before taxes 1,337 1,131
Net sales (third parties) € in millions
First half year 2018
First half year 2017
Footwear 6,404 6,329Apparel 3,914 3,664Hardware 521 970Reclassification to discontinued operations (30) (478)Total 10,809 10,485
40AD
IDAS
FI
RST
HAL
F YE
AR R
EPOR
T 20
181 AT A GLANCE 2 INTERIM GROUP MANAGEMENT REPORT 3 INTERIM CONSOLIDATED FINANCIAL STATEMENTS (IFRS)
EXPLANATORY NOTES TO THE CONDENSED INTERIM CONSOLIDATED FINANCIAL STATEMENTS (IFRS) AS AT JUNE 30, 2018

RESPONSIBILITY STATEMENT
To the best of our knowledge, and in accordance with the applicable reporting principles for interim financial reporting, the interim consolidated financial statements give a true and fair view of the assets, liabilities, financial position and profit or loss of the Group, and the interim Group management report includes a fair review of the development and performance of the business and the position of the Group, together with a description of the material opportunities and risks associated with the expected development of the Group for the remaining months of the financial year.
Herzogenaurach, July 25, 2018
KASPER RORSTED CHIEF EXECUTIVE OFFICER
ROLAND AUSCHEL GLOBAL SALES
ERIC LIEDTKE GLOBAL BRANDS
HARM OHLMEYER CHIEF FINANCIAL OFFICER
KAREN PARKIN GLOBAL HUMAN RESOURCES
GIL STEYAERT GLOBAL OPERATIONS
41AD
IDAS
FI
RST
HAL
F YE
AR R
EPOR
T 20
181 AT A GLANCE 2 INTERIM GROUP MANAGEMENT REPORT 3 INTERIM CONSOLIDATED FINANCIAL STATEMENTS (IFRS)
RESPONSIBILITY STATEMENT

F I N A N C I A LC A L E N D A R2 0 1 8 / 2 0 1 9
FIRST HALF 2019 RESULTS
FULL‐YEAR 2018 RESULTSNINE MONTHS 2018 RESULTS
ANNUAL GENERAL MEETING
FIRST QUARTER 2019 RESULTS
NINE MONTHS 2019 RESULTS
42AD
IDAS
FI
RST
HAL
F YE
AR R
EPOR
T 20
18

ADI-DASSLER-STR. 1
91074 HERZOGENAURACH
GERMANY
TEL + 49 (0) 91 32 84 – 0
FAX + 49 (0) 91 32 84 – 22 41
ADIDAS-GROUP . COM
INVESTOR RELATIONS
TEL + 49 (0) 91 32 84 – 29 20
FAX + 49 (0) 91 32 84 – 31 27
↗ INVESTOR.RELATIONS@ADIDAS–GROUP.COM
↗ ADIDAS–GROUP.COM ⁄ INVESTORS
ADIDAS IS A MEMBER OF DIRK
(GERMAN INVESTOR RELATIONS ASSOCIATION)
CONCEPT, DESIGN AND REALIZATION
MPM CORPORATE COMMUNICATION SOLUTIONS, MAINZ, GERMANY
MPM.DE
A D I D A S A G
© 2018 adidas AG
43AD
IDAS
FI
RST
HAL
F YE
AR R
EPOR
T 20
18


