94

First Publication. 2018. JPA/BP/01/2018

PREFACE
i
Agriculture and Agrifood Sector continues to experience
positive growth, with the transition from traditional or
conventional methods of farming to technology-based
system which has moved the sector forward. Agricultural
development in this country has achieved great progress
with the increase in commodity production for the past 5
years from $291.67 million in the year 2013 to $379.65
million in the year 2017.
'Agriculture & Agrifood Statistics In Brief' is published as
an easy to read booklet which contains information on
agriculture and agrifood statistics and facts in Brunei
Darussalam and the development of agribusiness
activities for the year 2017, which would be beneficial to
all public and private sector, entrepreneurs, students and
researchers.
Publication and distribution of this book is an effort by the
Department to assist and facilitate, especially staff of the
Department of Agriculture and Agrifood in assisting the
public who wish to obtain the required information.
It is our hope that this will contribute to a more well-informed
society in the agricultural and agrifood sector in Brunei
Darussalam.
HAJAH AIDAH BINTI HAJI MOHD HANIFAH
Acting Director of Agriculture and Agrifood
Ministry of Primary Resources and Tourism
Negara Brunei Darussalam

ii
AGRICULTURE AT A GLANCE
In ensuring the security of food supply and enhance
economic contribution to GDP, Brunei Darussalam places
much importance in agriculture and agrifood development.
In this respect, the Department of Agriculture and Agrifood
actively promotes development of various agricultural
commodities as well as facilitates the outsourcing of raw
materials and food supply.
It is a fact that agriculture & agrifood development is the
main factor in sustaining national food supply and agrifood
production. Agriculture & agrifood activities are mainly
centered on the production of food commodities.
In 2017, the livestock sector continued to dominate the
agriculture & agrifood sector development with the retail
value at $199.81 million compared to crop sector with an
output value of $59.65 million and agrifood processing with
output value $120.19 million, which contributed about 53%,
16% and 31% to the total agriculture output, respectively.
Poultry, eggs and tropical leafy vegetables are the
commodities which have attained self-sufficiency level.
All this was achieved through the active involvement and
increasing interest in commercial production by agricultural
entrepreneurs as well as small and medium enterprises
(SMEs) which have become a driving force for agricultural
development in the country.
iii
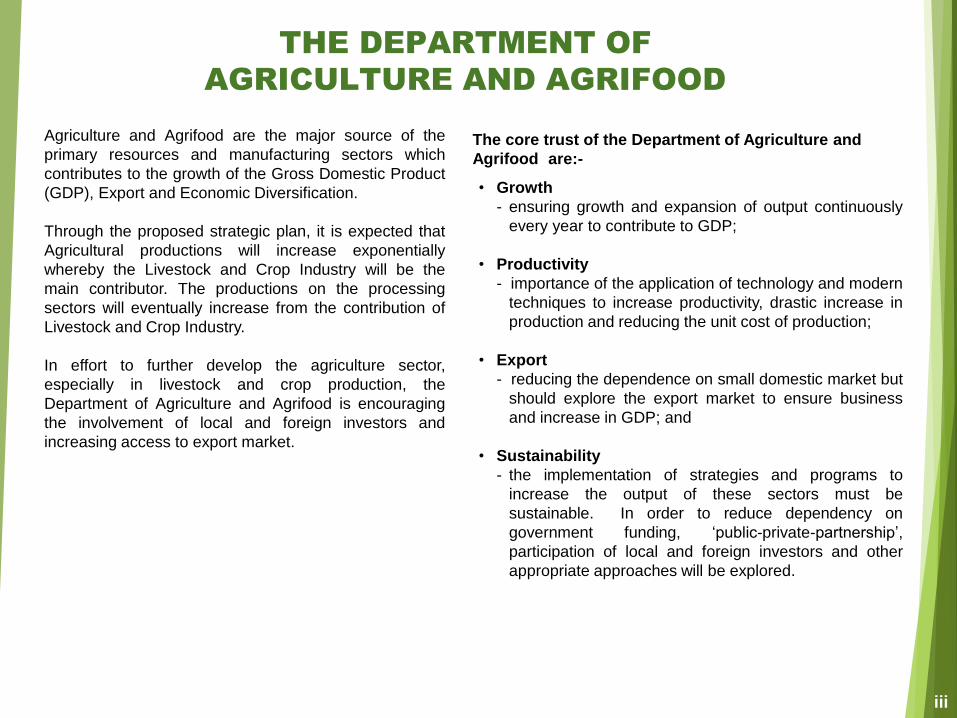
THE DEPARTMENT OF
AGRICULTURE AND AGRIFOOD
The core trust of the Department of Agriculture and
Agrifood are:-
• Growth
- ensuring growth and expansion of output continuously
every year to contribute to GDP;
• Productivity
- importance of the application of technology and modern
techniques to increase productivity, drastic increase in
production and reducing the unit cost of production;
• Export
- reducing the dependence on small domestic market but
should explore the export market to ensure business
and increase in GDP; and
• Sustainability
- the implementation of strategies and programs to
increase the output of these sectors must be
sustainable. In order to reduce dependency on
government funding, ‘public-private-partnership’,
participation of local and foreign investors and other
appropriate approaches will be explored.
Agriculture and Agrifood are the major source of the
primary resources and manufacturing sectors which
contributes to the growth of the Gross Domestic Product
(GDP), Export and Economic Diversification.
Through the proposed strategic plan, it is expected that
Agricultural productions will increase exponentially
whereby the Livestock and Crop Industry will be the
main contributor. The productions on the processing
sectors will eventually increase from the contribution of
Livestock and Crop Industry.
In effort to further develop the agriculture sector,
especially in livestock and crop production, the
Department of Agriculture and Agrifood is encouraging
the involvement of local and foreign investors and
increasing access to export market.

iv
CONTENT
Preface ……… i
Agriculture At Glance ……… ii
The Department of Agriculture
and Agrifood ……… iii
Vision/Mission/Goals ……… 1
Agriculture & Agrifood in Brief ……… 2
Organizational Structure ……… 3
Human Resources ……… 4
Agriculture Contribution To GDP ……… 5
Agricultural Gross Output ……… 6
Rental Rate For ADA Land ……… 7
Agricultural Development Area ……… 8 - 13
Rural Agriculture
Development Area (KPLB) ……… 14
Summary of The Livestock Industry
Development ……… 16
Livestock Land Areas ……… 17
Livestock Entrepreneurs ……… 18
Broiler Industry ……… 19 - 22
Egg Industry ……… 23 - 25
DOC Hatchery Industry ……… 26 - 28
Fertilized Eggs Industry ……… 29 - 31
Beef Industry ……… 32 - 36
Goat Industry ……… 37 - 38
Miscellaneous Livestock ……… 39 - 42
Summary of Crops Industry
Development ……… 44
Crops Land Areas ……… 45
Crops Entrepreneurs ……… 46
Vegetables Industry ……… 47 - 53
Fruit Industry ……… 54 - 60
Rice Industry ……… 61 - 63
Miscellaneous Crops Industry ……… 64 - 68
Ornamental Industry ……… 69 - 72
Cut Flowers Industry ……… 73 - 76
Agrifood Industry ……… 78 - 80
Export ……… 82 - 83
Target & Trajectory ……… 85

1
VISION
Towards Increase in Productions of Agriculture and Agrifood
Based Industries through Increasing Productivity And High
Technology Oriented For Export
MISSION
To Accelerate The Growth of Agriculture and Agrifood Based Industry
through High-Technology and Export Oriented, Encouraging Progressive
Involvement of Local and Foreign Direct Investment, while focusing on
High-Yield Production inclusive of Primary and Processing Industry
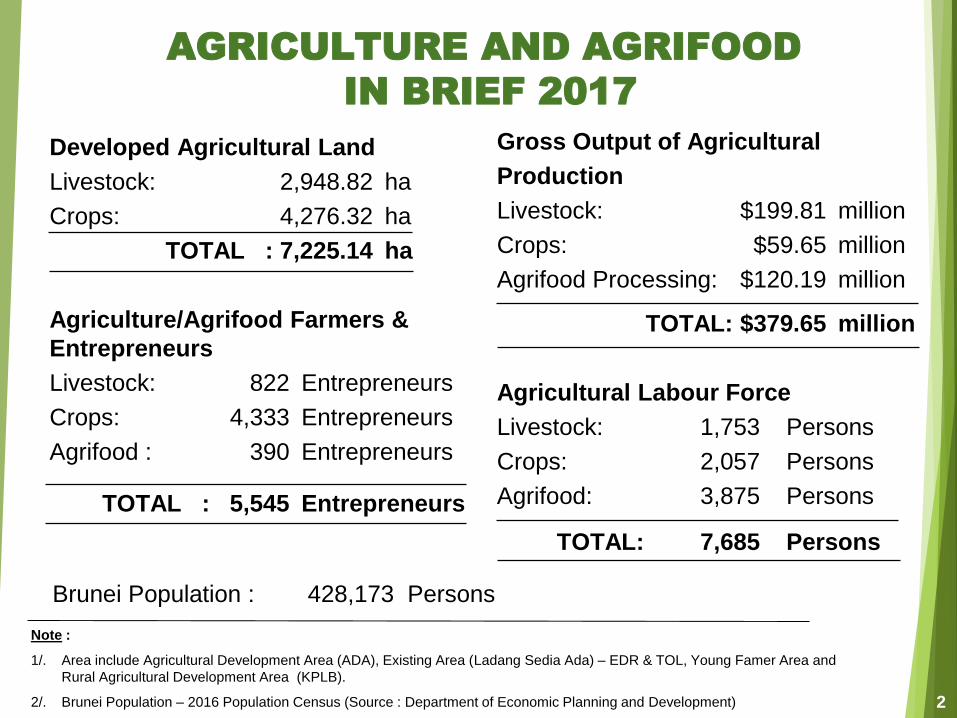
Developed Agricultural Land
Livestock: 2,948.82 ha
Crops: 4,276.32 ha
TOTAL : 7,225.14 ha
Agriculture/Agrifood Farmers &
Entrepreneurs
Livestock: 822 Entrepreneurs
Crops: 4,333 Entrepreneurs
Agrifood : 390 Entrepreneurs
TOTAL : 5,545 Entrepreneurs
Gross Output of Agricultural
Production
Livestock: $199.81 million
Crops: $59.65 million
Agrifood Processing: $120.19 million
TOTAL: $379.65 million
Agricultural Labour Force
Livestock: 1,753 Persons
Crops: 2,057 Persons
Agrifood: 3,875 Persons
TOTAL: 7,685 Persons
2
AGRICULTURE AND AGRIFOOD
IN BRIEF 2017
Brunei Population : 428,173 Persons
Note :
1/. Area include Agricultural Development Area (ADA), Existing Area (Ladang Sedia Ada) – EDR & TOL, Young Famer Area and
Rural Agricultural Development Area (KPLB).
2/. Brunei Population – 2016 Population Census (Source : Department of Economic Planning and Development)
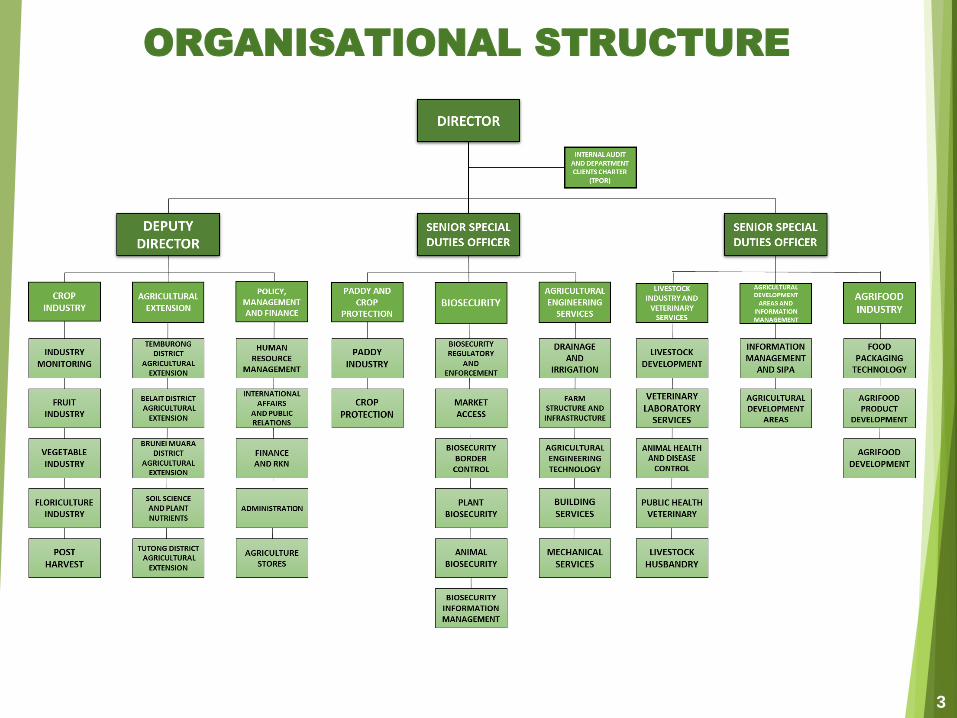
ORGANISATIONAL STRUCTURE
3
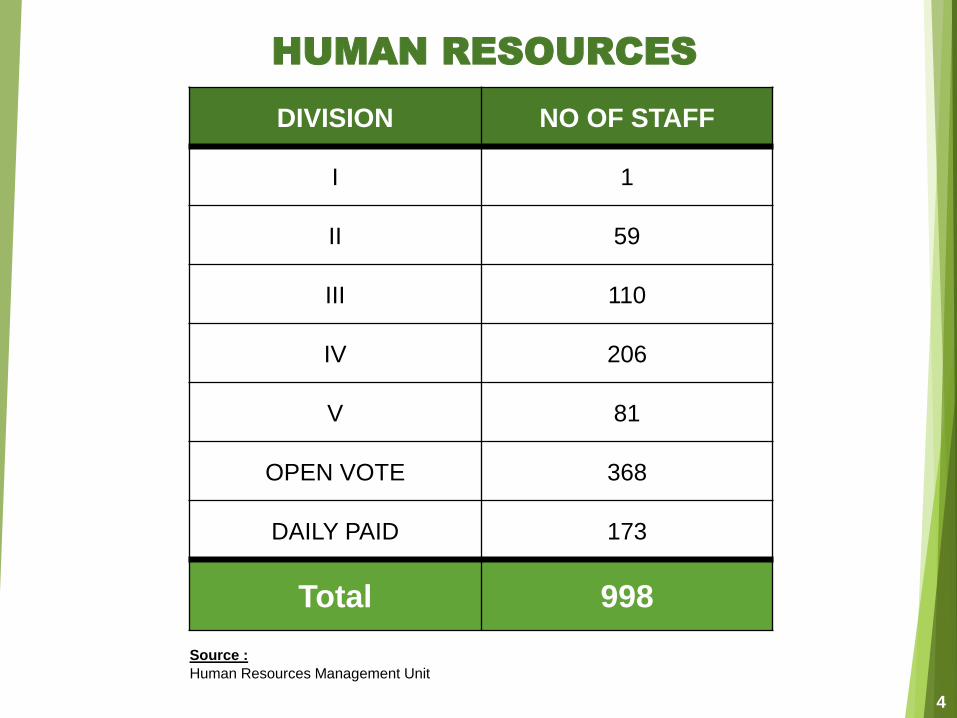
DIVISION NO OF STAFF
I 1
II 59
III 110
IV 206
V 81
OPEN VOTE 368
DAILY PAID 173
Total 998
4
HUMAN RESOURCES
Source :
Human Resources Management Unit

AGRICULTURE GDP
Note:
1. GDP for year 2017 is preliminary estimates and data calculated by using “base year 2010”
2. Source: Department of Economic Planning and Development
2010 2011 2012 2013 2014 2015 2016 2017
Agriculture GDP (B$ Mil) 70.25 76.22 88.36 82.25 88.66 89.07 90.46 90.06
% Contribution 0.38% 0.33% 0.37% 0.36% 0.41% 0.50% 0.57% 0.54%
0.00%
0.10%
0.20%
0.30%
0.40%
0.50%
0.60%
0
20
40
60
80
100
120
140
% C
on
trib
uti
on
B$
Mil
lio
nChart Title
5
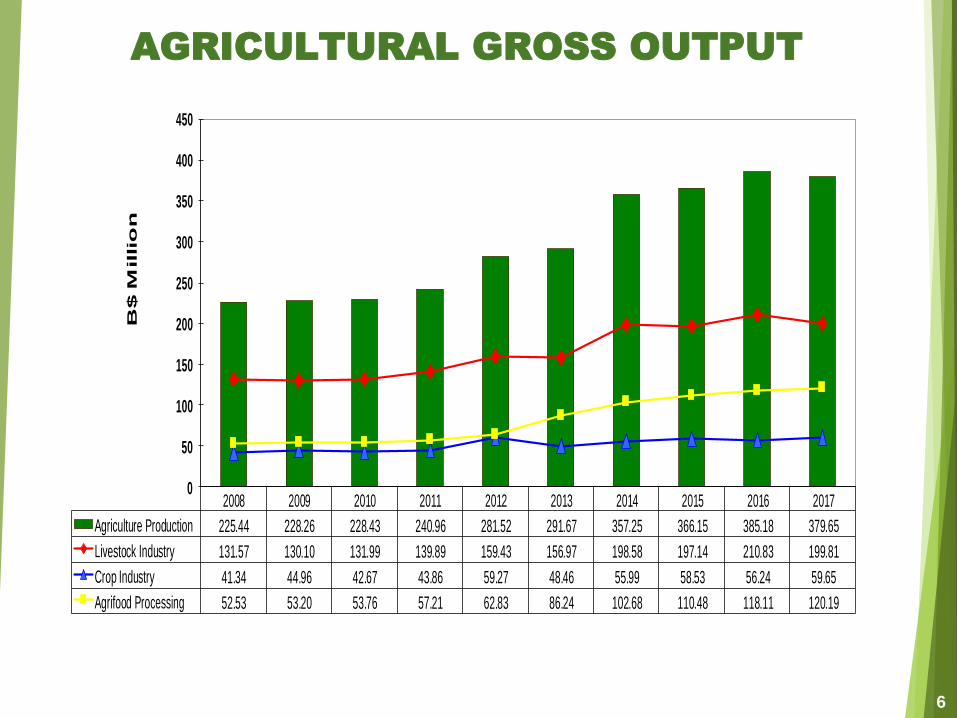
AGRICULTURAL GROSS OUTPUT
2008 2009 2010 2011 2012 2013 2014 2015 2016 2017
Agriculture Production 225.44 228.26 228.43 240.96 281.52 291.67 357.25 366.15 385.18 379.65
Livestock Industry 131.57 130.10 131.99 139.89 159.43 156.97 198.58 197.14 210.83 199.81
Crop Industry 41.34 44.96 42.67 43.86 59.27 48.46 55.99 58.53 56.24 59.65
Agrifood Processing 52.53 53.20 53.76 57.21 62.83 86.24 102.68 110.48 118.11 120.19
0
50
100
150
200
250
300
350
400
450B
$ M
illio
n
6

7
RENTAL RATE FOR
AGRICULTURAL DEVELOPMENT AREAS
NO
COMERCIAL
AGRICULTURAL
ACTIVITIES
DURATION
RENTAL
(Year)
RENTAL RATE
($/Ha/Year)
1 Vegetable 5 $25.00
2 Fruit 25 $25.00
3 Nursery (Floriculture, Grass & etc) 5 $50.00
4 Hatchery 10 $100.00
5 Poultry 5 $100.00
6 Goat 5 $5.00
7 Cow 10 $5.00
8 Deer 5 $5.00
9 Duck 5 $100.00
10 Tissue Culture 5 $50.00
11 Sugar Cane Planting 5 $25.00
12 Abattoir and Feedlot 10 $125.00
13 Agri-Mart 10 $500.00
14 Paddy 3 $12.50
Source :
Agriculture Development Area Unit, Department of Agriculture and Agrifood

NO DISTRICT
GAZETTE
AREA
(Ha)
ALLOCATED
AREA TO
FARMERS
(Ha)
STATIONS /
OTHER
USED
(Ha)
BALANCE
(Ha)
1 Brunei Muara 2,693.51 1,535.51 120.41 1,037.59
2 Tutong 1,886.37 431.43 62.83 1,392.11
3 Belait 804.25 258.84 9.82 535.59
4 Temburong 1,964.84 270.20 69.55 1,625.09
TOTAL 7,348.97 2,495.98 262.61 4,590.38
8
AGRICULTURAL DEVELOPMENT AREAS 2017
BY DISTRICTS
Source :
Agriculture Development Area Unit, Department of Agriculture and Agrifood

9
AGRICULTURAL DEVELOPMENT AREAS
BRUNEI MUARA DISTRICT
NO
AGRICULTURAL
DEVELOPMENT
AREAS
GAZETTE
AREA
(Ha)
AWARDED
AREA TO
FARMERS
(Ha)
STATIONS
OR
OTHERS
(Ha)
AGRICULTURAL
ACTIVITIES
1 KKP Bebuloh 204.36 204.36 0 Fruits and Paddy
2KKP Betumpu,
Kg Masin484.94 355.30 0
Vegetables, Fruits, Poultry, Goats,
Ornamental Nursery, Hydroponics &
etc
3KKP Jerudong
(PP Luahan)73.33 73.33 0 Fruits, Vegetables and Poultry
4 KKP Kilanas (Station) 24.08 11.00 3.8 Hi-Tech Crops -Fertigation farming
5 KKP Limpaki, Kg Mulaut 90.54 30.0 17.0Nursery/Grass, Feedlot, Ornamental
& landscaping and Abattoir
6 KKP Luahan (Station) 20.10 15.5 4.6 Poultry
7 KKP Lumapas 38.86 22.9 0 Vegetables & Sweet Corns
8 KKP Lumapas (Station) 10.78 2.00 2 Agricultural Station
9 KKP Masin 134.66 134.66 0Poultry (Ideal Multifeed Farm Sdn
Bhd Brunei)
10 KKP Mentiri 10.66 1.5 0 Hatchery (DOC) and Nursery
11 KKP Mulaut (Station) 0.74 0.00 0.74 Agricultural Station
12
KKP Mulaut (Tapak
Projek Penempatan
Kerbau Mulaut)
141.30 25.00 39.0 Buffalo Grazing Area, Goats
13 KKP Mulaut, Kg Mulaut 29.656 4.2 7.8 Vegetables, Hatchery & Fodder
14 KKP Panchor Murai 165.00 55 0 Paddy

10
AGRICULTURAL DEVELOPMENT AREAS
BRUNEI MUARA DISTRICT
NO
AGRICULTURAL
DEVELOPMENT
AREAS
GAZETTE
AREA
(Ha)
AWARDED
AREA TO
FARMERS
(Ha)
STATIONS
OR
OTHERS
(Ha)
AGRICULTURAL
ACTIVITIES
15KKP Pengkalan Batu
(Station)3.73 3.73 0 Fruits and downstream activities
16 KKP Putat 0.88 0.88 0 Vegetables
17 KKP Rimba 32.83 10.90 18.97Floriculture Nursery, Hi-Tech Nursery
and Garden Centre
18KKP Si Bongkok, Kg
Batong & Kg Masin141.00 79.50 0
Vegetables & Ornamentals Plants &
Livestock
19 KKP Si Bongkok, Kg Parit 128.00 64.00 0Poultry, Vegetables, Fruits &
Ornamental Plants
20KKP Sungai Tajau, Kg
Wasan116.69 99.00 0
Vegetables, Ornamental Nursery,
Integrated Farming, Goats & Poultry
21 KKP Tanah Jambu (Station) 25.30 5.0 0 Hi-Tech Crops
22KKP Tanah Tuah, Kg
Kulapis71.96 40.59 0 Poultry, Integrated Farming
23 KKP Tanjong Nangka 9.00 9.00 0 Poultry & Fruits
24 KKP Terunjing 25.3 5.00 0 Animal Clinic & Quarantine
25 KKP Tungku 233.81 26.35 3.5 Brunei Agro-Tech Park
26 KKP Wasan 476.00 256.81 23.0 Paddy, Poultry Slaughter House
TOTAL 2,693.51 1,535.51 120.41

11
AGRICULTURAL DEVELOPMENT AREAS
TUTONG DISTRICT
NO
AGRICULTURAL
DEVELOPMENT
AREAS
GAZETTE
AREA
(Ha)
AWARDED
AREA TO
FARMERS
(Ha)
STATIONS
OR
OTHERS
(Ha)
AGRICULTURAL
ACTIVITIES
1KKP Bang Nukat, Lamumin
(GP. 133)0.32 0.00 0
2KKP Bang Nukat, Lamumin
(GP. 400)2.02 0.00 2.02 Agricultural Station
3 KKP Batang Mitus Buah 516.00 29.00 0 Fruits & Agricultural Station
4 KKP Batang Mitus Halaman 588.70 113.19 0Hatchery, Abattoir House
Processing, Goat & Fruits
5 KKP Birau (PP) 100.99 52.00 0 Broiler, Hatchery, Vegetables
6 KKP Birau (Station) 198.70 15.35 60.0
Broiler,Vegetables &
Agricultural Station &
Mushroom
7 KKP Kupang 59.99 59.99 0 Fruits
8 KKP Maraburong 196.84 22.00 0 Vegetables & Poultry
9KKP Padnunok/ Sungai
Burong, Liudang112.80 95.00 0 Broiler & Deer
10 KKP Sinaut 54.90 24.90 0Hi-Tech Crops -Fertigation
farming, Fruits, Nursery & Etc
11 KKP Sungai Paku 30.00 20.00 0 Breeder,Hatchery & Poultry
12 KKP Supon Besar 0.81 0.00 0.81 Agricultural Station
13 KKP Tanjong Maya 24.30 0.00 0 Paddy
TOTAL 1,886.37 431.43 62.83

12
AGRICULTURAL DEVELOPMENT AREAS
BELAIT DISTRICT
NO
AGRICULTURAL
DEVELOPMENT
AREAS
GAZETTE
AREA
(Ha)
AWARDED
AREA TO
FARMERS
(Ha)
STATIONS
OR
OTHERS
(Ha)
AGRICULTURAL
ACTIVITIES
1 KKP Buau 1.99 0.00 1.99 Agricultural Station
2KKP Kenapol (Labi
Agricultural Station)3.01 0.00 3.01 Agricultural Station
3KKP Labi lama, Kg
Tarunan, Labi50.00 50.00 0 Fruits
4 KKP Lilas 14.61 7.52 0Goat, Fertigation farming,
Watermelon & Vegetables
5 KKP Lot Sengkuang, Labi 45.00 45.00 0 Paddy
6KKP Merangking, Bukit
Sawat484.00 60.00 0 Fruits
7KKP Mumong, Mukim
Kuala Belait21.19 0.00 0 Agribusiness
8 KKP Rampayoh, Kg Labi 120.82 52.50 0Feedlot, Fruits, Vegetables,
Poultry and Goats
9KKP Singap (Bukit Sawat
Agricultural Station)2.00 0.00 2 Agricultural Station
10 KKP Sungai Liang 9.71 4.62 0.90Hydroponics, Watermelon &
Agricultural Station
11KKP Sungai Petai, Mukim
Labi50.00 39.20 0 Poultry & Vegetables
12 KKP Tanjong Sudai 1.92 0.00 1.92 Agricultural Station
TOTAL 804.25 258.84 9.82
13
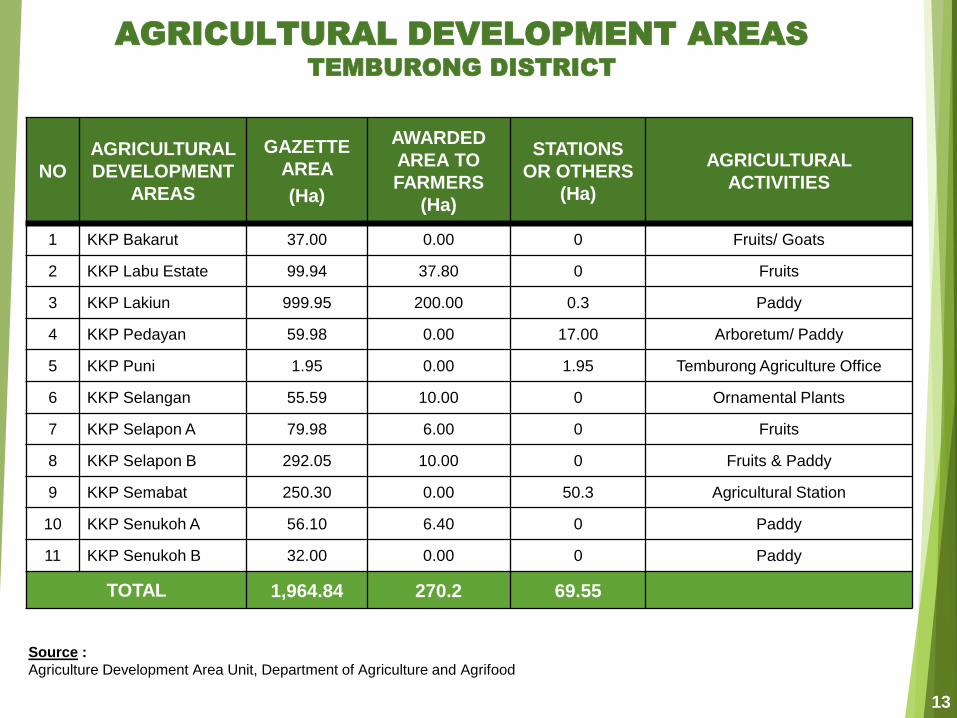
AGRICULTURAL DEVELOPMENT AREAS
TEMBURONG DISTRICT
NO
AGRICULTURAL
DEVELOPMENT
AREAS
GAZETTE
AREA
(Ha)
AWARDED
AREA TO
FARMERS
(Ha)
STATIONS
OR OTHERS
(Ha)
AGRICULTURAL
ACTIVITIES
1 KKP Bakarut 37.00 0.00 0 Fruits/ Goats
2 KKP Labu Estate 99.94 37.80 0 Fruits
3 KKP Lakiun 999.95 200.00 0.3 Paddy
4 KKP Pedayan 59.98 0.00 17.00 Arboretum/ Paddy
5 KKP Puni 1.95 0.00 1.95 Temburong Agriculture Office
6 KKP Selangan 55.59 10.00 0 Ornamental Plants
7 KKP Selapon A 79.98 6.00 0 Fruits
8 KKP Selapon B 292.05 10.00 0 Fruits & Paddy
9 KKP Semabat 250.30 0.00 50.3 Agricultural Station
10 KKP Senukoh A 56.10 6.40 0 Paddy
11 KKP Senukoh B 32.00 0.00 0 Paddy
TOTAL 1,964.84 270.2 69.55
Source :
Agriculture Development Area Unit, Department of Agriculture and Agrifood

14
KPLB LAND AREAS
BRUNEI MUARA DISTRICT
NO
RURAL
AGRICULTURAL
DEVELOPMENT
GAZETTE
AREA
(Ha)
AWARDED /
CULTIVATED
AREA TO
FARMERS (Ha)
STATIONS OR
OTHERS (Ha)
AGRICULTURAL
ACTIVITIES
1.KPLB Bukit Pawas, Kg
Lumapas99.00 40 0 Fruits
2. KPLB Kulapis 32.00 32 0 Fruits
3. KPLB Masin A 42.09 42.09 0 Fruits
4. KPLB Pengkalan Batu 43.97 43.97 0 Fruits
5. KPLB Tempayan Pisang 34.39 34.39 0 Fruits
TOTAL 251.45 192.45 0.00
Source :
Agriculture Development Area Unit, Department of Agriculture and Agrifood


AGRICULTURE
COMMODITY
LOCAL IMPORT TOTALSELF-
SUFFICIENCY
QuantityRetail Value
($mil)Quantity
CIF Value
($mil)Quantity %
Broilers (mt) 23,282.70 106.53 1,6140.02 4.17 24,896.72 93.52%
Eggs (mil eggs) 150.81 25.41 0.45 0.05 151.26 99.70%
Beef – Buffalo & Cattle
(mt)80.18 1.048 4,628.10 27.09 4,708.27 1.70%
Goat Meat (mt) 9.70 0.148 5.18 0.03 14.88 65.18%
Day Old Chicks
(mil heads)15.72 18.86 1.33 1.09 17.05 92.20%
Fertilized Eggs
(mil egg)10.65 8.52 4.22 2.26 14.87 71.63%
Miscellaneous
Livestock (mt)309.86 1.86 n/a n/a n/a n/a
Animal Feed (mt) 48,563 37.43 97,845.93 40.79 146,409.16 33.17%
TOTAL 199.81 75.47
16
SUMMARY OF THE LIVESTOCKS INDUSTRY
DEVELOPMENT 2017

COMMODITIES BRUNEI/
MUARABELAIT TUTONG TEMBURONG
TOTAL
(Ha)
Broiler
(Chicken Meat)154.12 21.80 96.26 1.60 273.78
Layer (Egg) 45.38 14.40 0.00 0.00 59.78
Day Old Chicks 16.00 0.00 57.90 0.00 73.90
Fertilized Eggs 0.00 0.00 40.00 0.00 40.00
Buffalo 1,022.85 16.37 787.45 123.12 1,949.79
Cattle 22.08 27.24 106.72 28.17 180.58
Goats 91.69 64.51 104.32 17.30 277.82
Deer 15.25 0.10 14.10 2.50 31.95
Sheep 10.82 24.06 0.00 21.64 56.52
Animal Feed 4.70 0.00 0.00 0.00 4.70
TOTAL (Ha) 1,382.89 172.48 1,99.12 164.63 2,948.82
17
LIVESTOCK LAND AREAS 2017
Note :
Area include Agricultural Development Area (ADA), Young Farmer Area, Existing Area and Rural Agricultural Development Area.

AGRICULTURE
COMMODITY
BRUNEI
/ MUARABELAIT TUTONG TEMBURONG
TOTAL
(Entrepreneurs)
Broilers 31 6 14 5 56
Eggs 4 4 0 0 8
Day Old Chicks 4 0 3 0 7
Fertilized Eggs 0 0 2 0 2
Buffalo 94 7 117 15 233
Cattle 19 14 29 4 66
Goats 170 37 73 13 293
Deer 9 1 6 2 18
Sheep 8 2 0 11 21
Miscellaneous
Livestock31 13 16 51 111
Animal Feed 7 0 0 0 7
Total
(Entrepreneurs)377 84 260 101 822
18
LIVESTOCK ENTREPRENEURS 2017
19
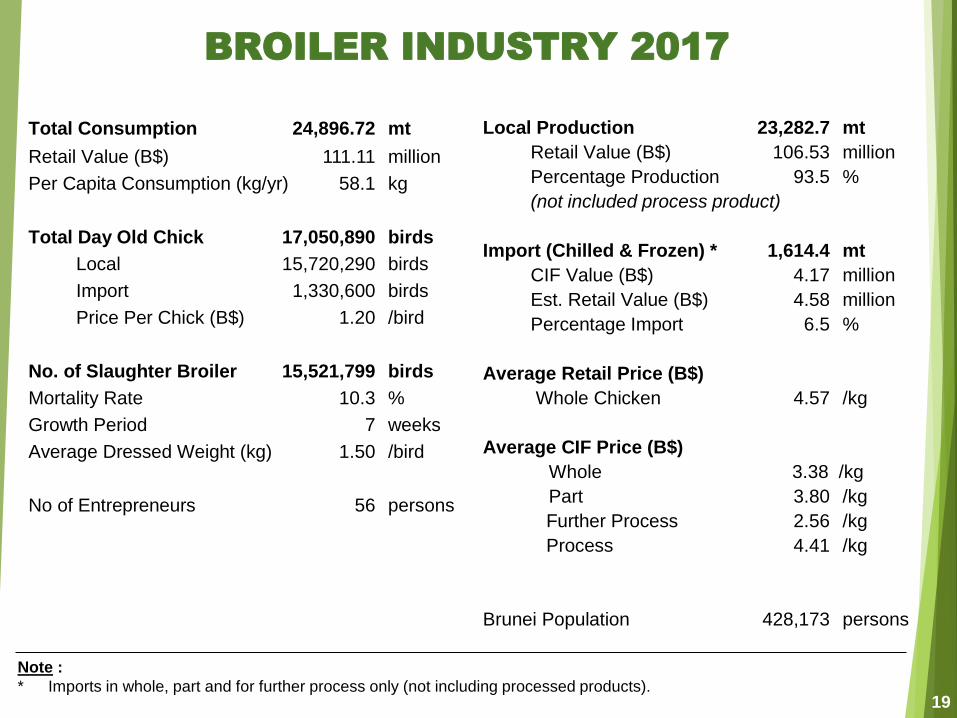
BROILER INDUSTRY 2017
Total Consumption 24,896.72 mt
Retail Value (B$) 111.11 million
Per Capita Consumption (kg/yr) 58.1 kg
Total Day Old Chick 17,050,890 birds
Local 15,720,290 birds
Import 1,330,600 birds
Price Per Chick (B$) 1.20 /bird
No. of Slaughter Broiler 15,521,799 birds
Mortality Rate 10.3 %
Growth Period 7 weeks
Average Dressed Weight (kg) 1.50 /bird
No of Entrepreneurs 56 persons
Local Production 23,282.7 mt
Retail Value (B$) 106.53 million
Percentage Production 93.5 %
(not included process product)
Import (Chilled & Frozen) * 1,614.4 mt
CIF Value (B$) 4.17 million
Est. Retail Value (B$) 4.58 million
Percentage Import 6.5 %
Average Retail Price (B$)
Whole Chicken 4.57 /kg
Average CIF Price (B$)
Whole 3.38 /kg
Part 3.80 /kg
Further Process 2.56 /kg
Process 4.41 /kg
Brunei Population 428,173 persons
Note :
* Imports in whole, part and for further process only (not including processed products).

20
BROILER INDUSTRY 2008 – 2017
0
5,000
10,000
15,000
20,000
25,000
2008 2009 2010 2011 2012 2013 2014 2015 2016 2017
Local 19,485 19,536 20,635 22,962 23,902 23,062 23,932 23,264 24,452 23,283
Import 1,615 1,640 1,887 1,954 2,459 2,399 1,789 3,318 2,826 3,014
Me
tric
To
nn
es
Note :
Import include process product

Small & Medium
4,792 mt
[20.59%]
QAF Farm
3,728 mt
[16.01%]
Soon Lee Farm
5,800 mt
[24.91%]Ideal Multifeed Farm
2,749 mt
[11.81%]
Hua Ho Agriculture Farm
2,793 mt
[12.00%]
Sykt Kumpulan Harapan Baru
1,918 mt
[8.24%]
Tunas Harapan Farm
1,502 mt
[6.45%]
21
PRIVATE SECTOR CONTRIBUTION IN BROILER
PRODUCTION 2017 (CHICKEN MEAT)
Note:
Market Size: 23,283 mt (B$106.53 million)
Large-Scale Company 79.4%
Small & Medium Company 20.6%

Part
23.70 mt
[0.8%]Further Process
1,578.32 mt
[52.4%]
Process
1,399.61 mt
[46.4%]
22
CHICKEN MEAT IMPORT (CHILLED & FROZEN)
BY CATEGORY 2017
Note :
Import from Malaysia
Whole
12.00 mt
[0.4%]

23
EGG INDUSTRY 2017
Total Consumption 151.26 mil eggs
Retail Value (B$) 25.49 million
Per Capita Consumption (egg/yr) 353 eggs
Local Production 150.81 mil eggs
Retail Value (B$) 25.41 million
No. of Layer 1,018,096 birds
Area 59.78 ha
Import 0.45 mil eggs
CIF Value (B$) 0.05 million
Est Retail Value (B$) 0.08 million
Percentage Import 0.3 %
Self-Sufficiency 99.7 %
Average Retail Price (B$) 0.16 /egg
Brunei Population 428,173 persons
DISTRICTQUANTITY
(Mil. Eggs)
RETAIL VALUE
(B$)
QUANTITY
PERCENTAGE
(%)
NO OF FARMS
Brunei/Muara 101.45 17.69 67.3 % 4
Belait 49.36 7.72 32.7 % 4
TOTAL 150.81 25.41 100 % 8
LOCAL PRODUCTION

EGG INDUSTRY 2008 – 2017
0
20
40
60
80
100
120
140
160
2008 2009 2010 2011 2012 2013 2014 2015 2016 2017
Local 123.21 124.48 127.54 128.87 128.51 127.98 131.7 130.5 141.6 150.8
Import 0.45 1.20 0.20 0.93 3.15 4.40 1.98 2.08 0.61 0.45
Millio
n
Eg
gs
24

Hua Ho Agriculture Farm
54.46 mill eggs
[ 36 % ]
Soon Lee Farm & Trading Co.
45.04 mill eggs
[ 29.7 % ]
Import
0.45 mill eggs
[ 0.4% ]
Small & Medium Company
12.31 mill eggs
[ 8.1% ]
Ideal Multifeed Farm
39.01 mill eggs
[ 25.8 % ]
25
PRIVATE SECTOR CONTRIBUTION
IN EGGS PRODUCTION 2017
Note :
Market Size: 150.81 million eggs (B$25.41 million)
Large-Scale Company 92%
Small & Medium Company 8%
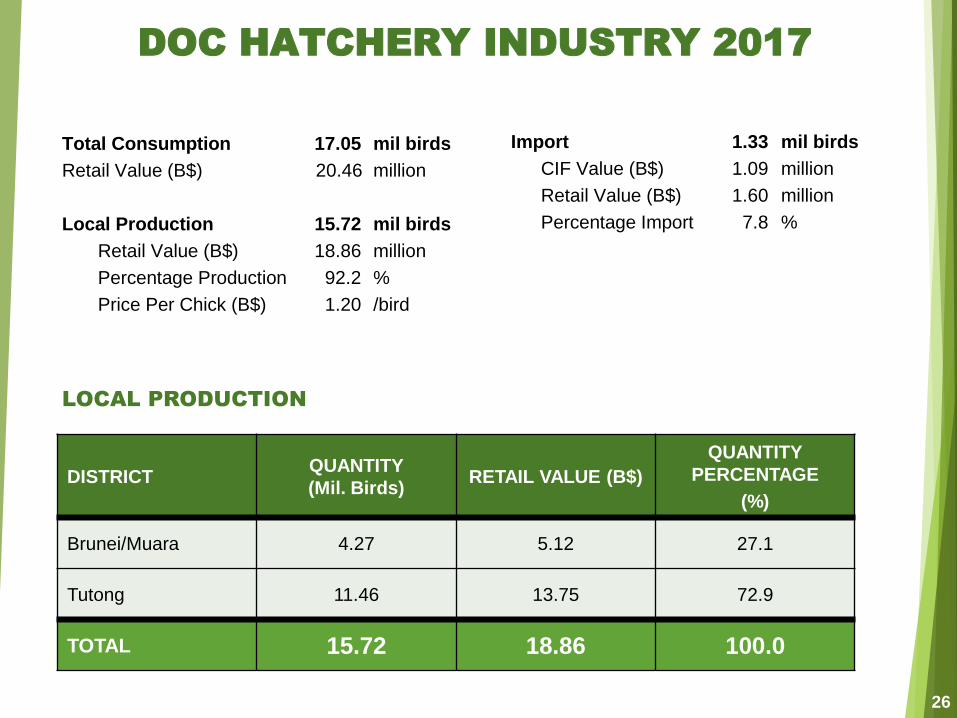
Total Consumption 17.05 mil birds
Retail Value (B$) 20.46 million
Local Production 15.72 mil birds
Retail Value (B$) 18.86 million
Percentage Production 92.2 %
Price Per Chick (B$) 1.20 /bird
DISTRICTQUANTITY
(Mil. Birds)RETAIL VALUE (B$)
QUANTITY
PERCENTAGE
(%)
Brunei/Muara 4.27 5.12 27.1
Tutong 11.46 13.75 72.9
TOTAL 15.72 18.86 100.0
26
DOC HATCHERY INDUSTRY 2017
Import 1.33 mil birds
CIF Value (B$) 1.09 million
Retail Value (B$) 1.60 million
Percentage Import 7.8 %
LOCAL PRODUCTION

0
2
4
6
8
10
12
14
16
18
2008 2009 2010 2011 2012 2013 2014 2015 2016 2017
Local 13.92 14.07 14.57 14.10 16.80 16.20 16.84 16.66 16.68 15.72
Import 0.29 0.26 0.35 0.38 0.29 0.25 0.19 0.38 0.82 1.33
Th
ou
sa
nd
Bir
ds
27
DOC INDUSTRY 2008 – 2017
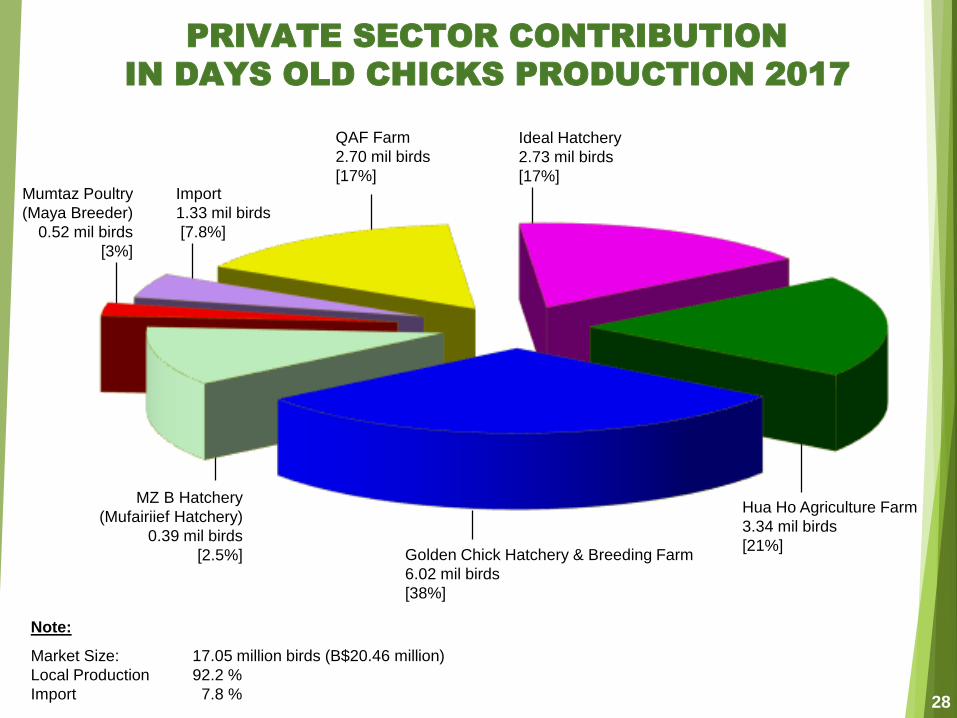
Ideal Hatchery
2.73 mil birds
[17%]
Hua Ho Agriculture Farm
3.34 mil birds
[21%]Golden Chick Hatchery & Breeding Farm
6.02 mil birds
[38%]
MZ B Hatchery
(Mufairiief Hatchery)
0.39 mil birds
[2.5%]
Mumtaz Poultry
(Maya Breeder)
0.52 mil birds
[3%]
QAF Farm
2.70 mil birds
[17%]Import
1.33 mil birds
[7.8%]
28
PRIVATE SECTOR CONTRIBUTION
IN DAYS OLD CHICKS PRODUCTION 2017
Note:
Market Size: 17.05 million birds (B$20.46 million)
Local Production 92.2 %
Import 7.8 %

29
FERTILIZED EGGS INDUSTRY 2017
Total Consumption 14.87 mil eggs
Retail Value (B$) 11.89 million
Local Production 10.65 mil eggs
Retail Value (B$) 8.52 million
Self-Sufficiency 71.6 %
No. of Layer 221,955 birds
Import 4.22 mil eggs
CIF Value (B$) 2.26 million
Retail Value (B$) 3.37 million
Percentage Import 28.4 %
Average Retail Price (B$) 0.80 /egg
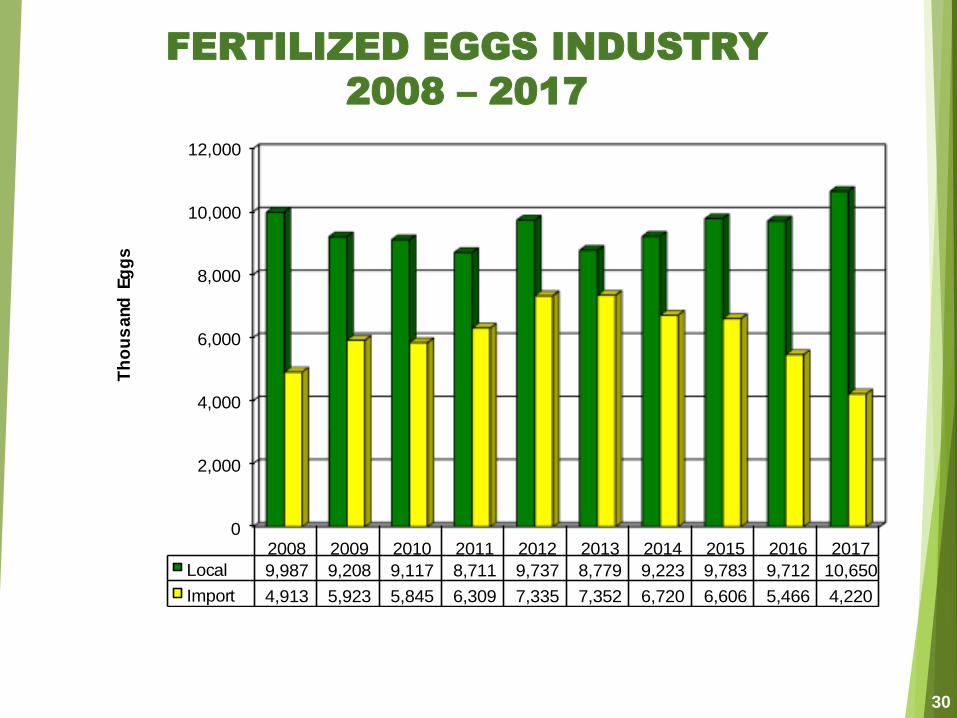
0
2,000
4,000
6,000
8,000
10,000
12,000
2008 2009 2010 2011 2012 2013 2014 2015 2016 2017
Local 9,987 9,208 9,117 8,711 9,737 8,779 9,223 9,783 9,712 10,650
Import 4,913 5,923 5,845 6,309 7,335 7,352 6,720 6,606 5,466 4,220
Th
ou
sand
Eg
gs
30
FERTILIZED EGGS INDUSTRY
2008 – 2017

Ideal Hatchery Sdn Bhd
3.38 mil eggs
[24%]Import
4.22 mil eggs
[24%]
Golden Chick Hatchery
& Breeding Farm
7.27 mil eggs
[52%]
31
PRIVATE SECTOR CONTRIBUTION
IN FERTILIZED EGGS PRODUCTION 2017
Note:
Market Size: 10.65 mil eggs (B$8.52 million)
Local Production 71.6 %
Import 28.4%

32
BEEF INDUSTRY 2017
Total Consumption 4,708.27 mt
Buffalo 2,871.96 mt
Cattle 1,836.32 mt
Retail Value (B$) 69.36 million
Buffalo (B$) 31.38 million
Cattle (B$) 37.96 million
Per Capita Consumption 11.00 kg/yr
Local (Slaughtered) 507 heads
Dressed Weight 80.18 mt
Retail Value (B$) 1.05 million
Percentage Production 1.70 %
Total Import (Live) *** 7,543 heads
CIF Value (B$) 11.54 million
Est. Live Weight 2,746.87 mt
Live Import (Slaughtered) * 7,325 heads
Dressed Weight 1,625.74 mt
Est. CIF Value (B$) 9.69 million
Retail Value (B$) 28.48 million
Percentage Import 34.53 %
Import (Chilled & Frozen) ** 3,002.36 mt
CIF Value (B$) 17.40 million
Retail Value (B$) 39.83 million
Percentage Import 63.77 %
Average Retail Price (B$)
Cattle Meat (B$) 13.85 – 35.24 /kg
Buffalo Meat (B$) 9.01 – 13.33 /kg
Brunei Population 428,173 Persons
Note : * - Alive livestock that slaughtered for year 2017** - Import (Chilled & Frozen) only part & for further process (not included process product)*** - Total overall alive livestock imported to Brunei for the year 2017

TYPE OF
LIVESTOCK
LOCAL (ALIVE)
Quantity
(Head)
Live Weight
(Kg)
Dressing
(%)
Dressed
Weight (Mt)
Retail Value
(B$)
Buffalo 336 117,600 50% 58.80 612,723.65
Cattle 171 42,750 50% 21.38 435,335.00
TOTAL 507 160,350 80.18 1,048,058.65
TYPE OF
LIVESTOCK
IMPORT ALIVE (SLAUGHTERED)
Quantity
(Head)
Live Weight
(Kg)
Dressing
(%)
Dressed
Weight (Mt)
Retail Value
(B$)
Buffalo 2,218 887,200 52% 461.34 4,971,297.76
Cattle 5,107 1,940,660 60% 1,164.40 23,507,613.05
TOTAL 7,325 2,827,860 1,625.74 28,478,910.81
TYPE OF
LIVESTOCK
IMPORT (CHILLED & FROZEN) – PART & FOR FURTHER PROCESS
Quantity
(Mt)
C.I.F Value
(B$)
C.I.F Price
(B$/Kg)
Retail Value
(B$)
Buffalo 2,351.81 13,046,166.79 5.55 25,799,577.18
Cattle 650.55 4,352,869.91 6.69 14,032,237.04
TOTAL 3,002.36 17,399,036.70 5.80 39,831,814.22
33
SUMMARY OF BEEF INDUSTRY 2017
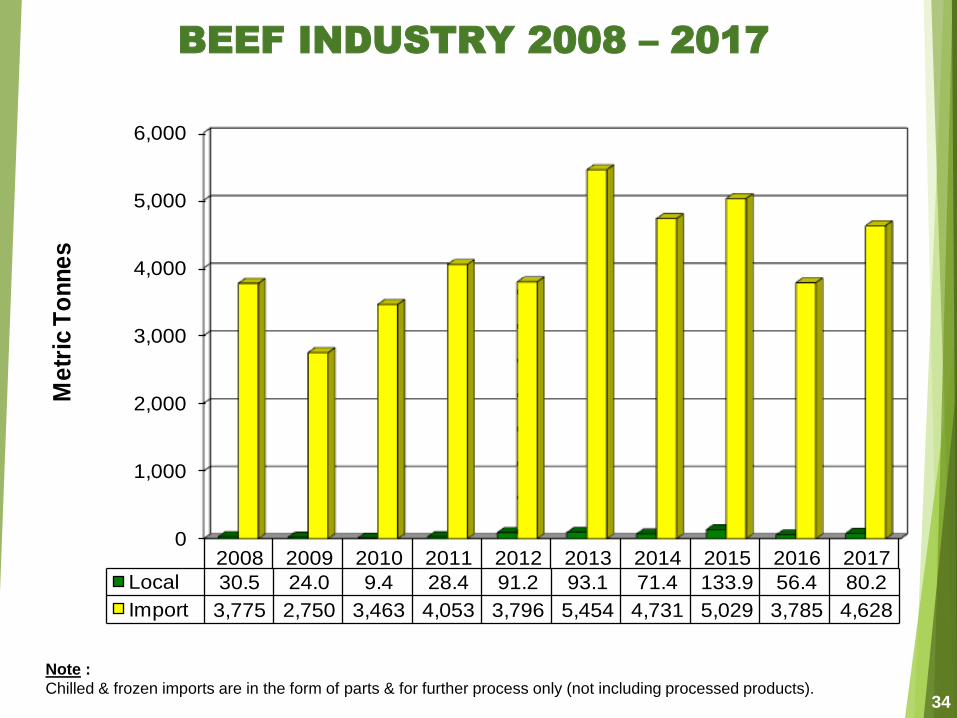
0
1,000
2,000
3,000
4,000
5,000
6,000
2008 2009 2010 2011 2012 2013 2014 2015 2016 2017
Local 30.5 24.0 9.4 28.4 91.2 93.1 71.4 133.9 56.4 80.2
Import 3,775 2,750 3,463 4,053 3,796 5,454 4,731 5,029 3,785 4,628
Me
tric
To
nn
es
34
BEEF INDUSTRY 2008 – 2017
Note :
Chilled & frozen imports are in the form of parts & for further process only (not including processed products).

Other Companies
618 heads
[8%]
PDS Abattoir Sdn Bhd
3,837 heads
[49%] Mulaut Abattoir Sdn Bhd
283 heads
[4%]
35
BUFFALO AND CATTLE
SLAUGHTERED IN 2017
Note:
Market Size: 7,832 heads (B$29.53 mil)
Syt Nurfaidzal & Anak-Anak
1,291 heads
[16%]Syt Hussyn Rahman Enterprise
584 heads
[7%]
Syt Assulay
1,219 heads
[16%]

COUNTRY
LIVE ANIMALS
CATTLE BUFFALO TOTAL
HeadCIF Value
(B$)Head
CIF Value
(B$)Head
CIF Value
(B$)
Australia 4,508 8,106,072 188 298,322 4,696 8,404,394
Sarawak, Malaysia 173 150,997 1,816 2,237,732 1,989 2,388,729
Sabah, Malaysia 746 642,528 112 105,292 858 747,820
TOTAL 5,427 8,899,597 2,116 2,641,346 7,543 11,540,943
COUNTRY
BEEF (CHILLED AND FROZEN)
CATTLE BUFFALO TOTAL
Quantity
(Kg)
CIF Value
(B$)
Quantity
(Kg)
CIF Value
(B$)
Quantity
(Kg)
CIF Value
(B$)
Australia 650,546.62 4,352,869.91 - - 650,546.62 4,352,869.91
India - - 2,351,812.00 13,046,166.79 2,351,812.00 13,046,16679
TOTAL 650,546.62 4,352,869.91 2,351,812.00 13,046,166.79 3,002,358.62 17,399,036.70
36
IMPORTED OF CATTLE & BUFFALO BY COUNTRY 2017
Note :
For chilled & frozen import, buffalo meat is part & for further process only and cattle meat include part, for further
process and process product.

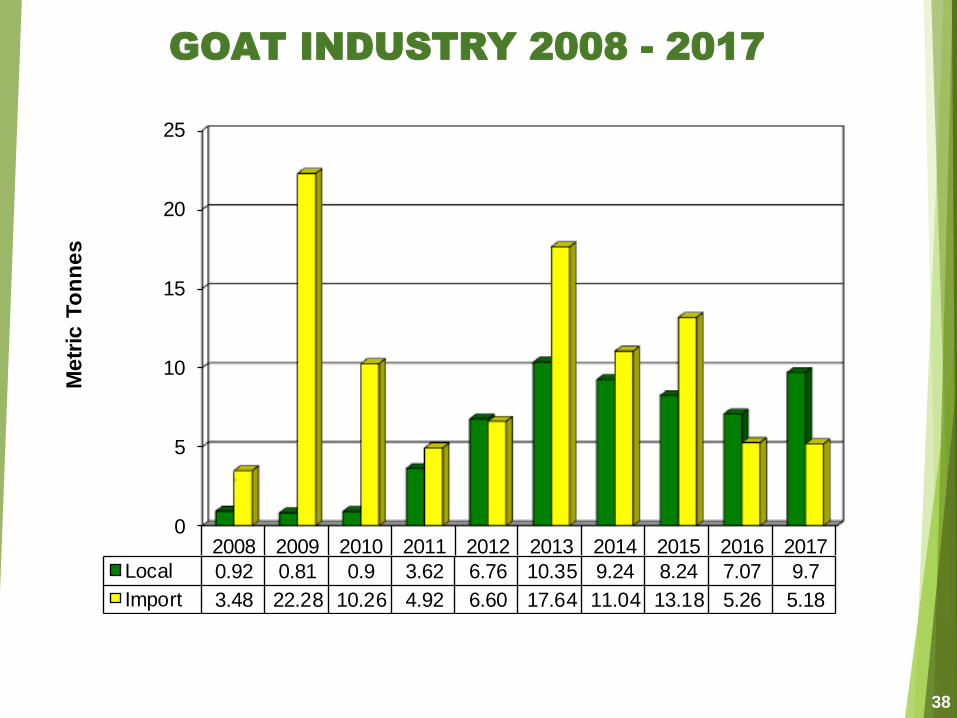
37
GOAT INDUSTRY 2017
Total Consumption 1,121 heads
Total Dressed Weight 14.88 mt
Retail Value (B$) 0.23 million
Per Capita Consumption 0.03 kg/yr
Local (Slaughtered) 862 heads
Dressed Weight 9.70 mt
Retail Value (B$) 0.15 million
Percentage Production 65.2 %
Live Import (Slaughtered) * 259 heads
Dressed Weight 5.18 mt
Est. C.I.F Value 0.03 million
Est. Retail Value (B$) 0.08 million
Percentage Import 34.8 %
Total Import (Live) ** 306 heads
C.I.F Value (B$) 0.03 million
Brunei Population 428,173 Persons
Note :
* - Alive livestock that slaughtered for year 2017.
** - Total overall alive livestock imported to Brunei.
0
5
10
15
20
25
2008 2009 2010 2011 2012 2013 2014 2015 2016 2017
Local 0.92 0.81 0.9 3.62 6.76 10.35 9.24 8.24 7.07 9.7
Import 3.48 22.28 10.26 4.92 6.60 17.64 11.04 13.18 5.26 5.18
Me
tric
To
nn
es
38
GOAT INDUSTRY 2008 - 2017

TYPE OF LIVESTOCKS UNITQUANTITY
(Unit)
QUANTITY
(Kilogram)
RETAIL VALUE
(B$)
RUMINANT :-
1. Sheep Heads 93 1,860.00 $29,760.00
2. Deer Heads 1 38.25 $650.25
NON-RUMINANT :-
1. Ayam Kampong Birds 43,265 51,918.00 $571,098.00
2. Goose Birds 180 360.00 $29,520.00
3. Patu Birds 171 256.50 $1,795.50
4. Duck Birds 1,726 1,726.00 $12,082.00
5. Quail Birds 79,271 10,701.59 $192,628.53
6. Old Layer Chicken Birds 98,249 117,898.80 $465,700.26
7. Chicken Breeder Birds 17,685 59,421.60 $178,264.80
EGGS :-
1. Ayam Kampong Eggs Eggs 78,178 3,908.90 $39,089.00
2. Goose Eggs Eggs 146 49.64 $43.80
3. Patu Eggs Eggs 44,287 2,657.22 13,286.10
4. Duck Eggs Eggs 892,985 53,579.10 $267,895.50
5. Quail Eggs Eggs 548,047 5,480.47 $54,804.70
6. Guinea Fowl Eggs Eggs 31 1.55 $15.50
7. Turkey Eggs Eggs 72 4.32 $36.00
TOTAL 309,861.94 $1,856,669.94
39
MISCELLANEOUS LIVESTOCK INDUSTRY 2017

SUMMARY OF MISCELLANEOUS LIVESTOCK 2017
LIVESTOCK
CATEGORIESRUMINANT NON-RUMINANT EGGS TOTAL
MONTHQuantity
(Kg)
Retail
Value
($)
Quantity
(Kg)
Retail
Value
($)
Quantity
(Kg)
Retail
Value
($)
Quantity
(Kg)
Retail
Value
($)
January 0.00 0.00 24,693.33 139,179.25 5,242.32 31,064.20 29,935.65 $170,243.45
February 740.00 11,840.00 21,246.69 122,612.53 4,998.56 29,747.60 26,985.25 $164,200.13
March 0.00 0.00 12,351.46 93,422.86 6,103.48 34,802.90 18,454.94 $128,225.76
April 0.00 0.00 4,757.15 58,212.50 6,540.07 36,221.00 11,297.22 $94,433.50
May 420.00 6,720.00 6,102.74 73,115.73 5,537.50 31,311.90 12,060.24 $111,147.63
June 0.00 0.00 5,562.95 68,280.81 6,060.44 33,741.50 11,623.39 $102,022.31
July 0.00 0.00 72,483.91 317,798.92 5,961.24 33,309.90 78,445.15 $351,108.82
August 0.00 0.00 4,879.00 62,133.41 6,189.70 34,635.70 11,068.70 $96,769.11
September 700.00 11,200.00 4,934.09 64,725.33 4,995.65 28,719.70 10,629.74 $104,645.03
October 0.00 0.00 25,531.68 140,628.54 4,872.38 28,312.00 30,404.06 $168,940.54
November 0.00 0.00 28,561.41 142,127.59 6,370.86 36,207.70 34,932.27 $178,335.09
December 38.25 650.25 31,178.11 168,851.62 2,809.00 17,096.70 34,025.36 $186,598.57
TOTAL 1,898.25 30,410.25 242,282.49 1,451,089.09 65,681.20 375,170.60 309,861.94 $1,856,669.94
40

MISCELLANEOUS LIVESTOCK PRODUCTION
BY QUANTITY (KG) & DISTRICT - 2017
DISTRICT
B/MUARA TUTONG BELAIT TEMBURONG TOTALTYPE OF LIVESTOCK
RUMINANT :-
1. Sheep 740 0.00 1,120 0.00 1,860.00
2. Deer 0.00 0.00 0.00 38.25 38.25
TOTAL (Kg) 740.00 0.00 1,120.00 38.25 1,898.25
NON-RUMINANT :-
1. Ayam Kampong 35,828.40 13,962.00 1,827.60 300.00 51,918.00
2. Goose 358.00 2.00 0.00 0.00 360.00
3. Patu 112.50 61.50 0.00 82.50 256.50
4. Duck 984.00 197.00 230.00 315.00 1,726.00
5. Quail 9,278.69 1,362.15 60.75 0.00 10,701.59
6. Old Layer Chicken 117,898.80 0.00 0.00 0.00 117,898.80
7. Chicken Breeder 59,421.60 0.00 0.00 0.00 59,421.60
TOTAL (Kg) 223,881.99 15,584.65 2,118.35 697.50 242,282.49
EGGS :-
1. Ayam Kampong Eggs 628.90 2,542.40 0.00 737.60 3,908.90
2. Goose Eggs 17.00 0.00 0.00 32.64 49.64
3. Patu Eggs 3.60 545.22 0.00 2,108.40 2,657.22
4. Duck Eggs 17,432.16 11,522.40 0.00 24,624.54 53.579.10
5. Quail Eggs 4,821.35 659.12 0.00 0.00 5,480.47
6. Guinea Fowl Eggs 0.00 0.00 0.00 1.55 1.55
7. Turkey Eggs 3.12 0.00 0.00 1.2 4.32
TOTAL (Kg) 22,906.13 15,269.14 0.00 27,505.93 65,681.20
TOTAL OVERALL (Kg) 247,528.12 30,853.79 3,238.35 28,241.68 309,861.94
41
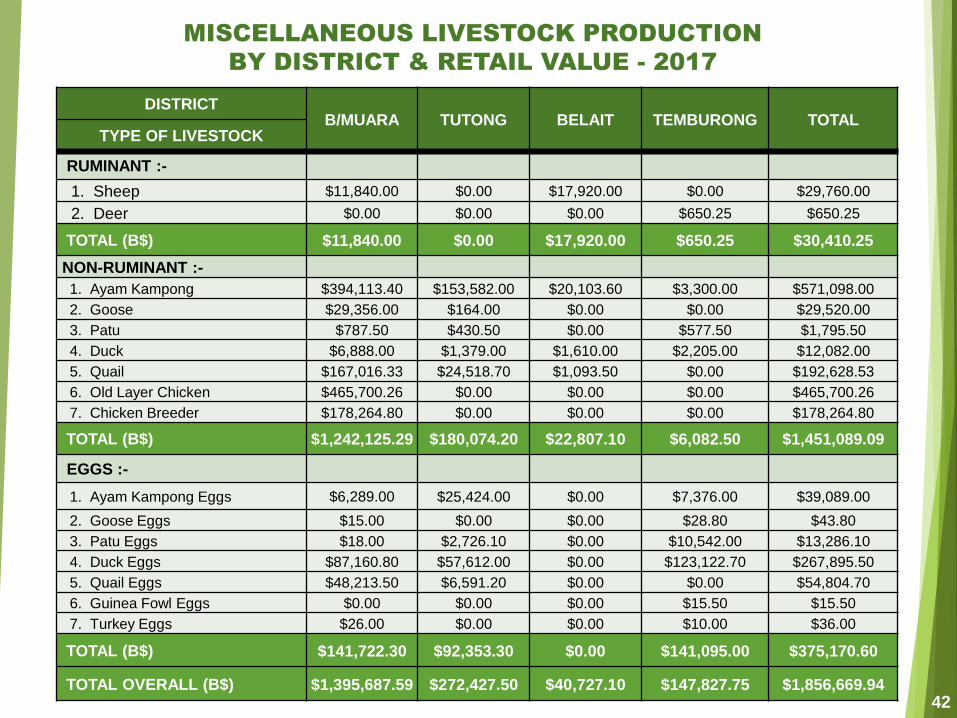
DISTRICTB/MUARA TUTONG BELAIT TEMBURONG TOTAL
TYPE OF LIVESTOCK
RUMINANT :-
1. Sheep $11,840.00 $0.00 $17,920.00 $0.00 $29,760.00
2. Deer $0.00 $0.00 $0.00 $650.25 $650.25
TOTAL (B$) $11,840.00 $0.00 $17,920.00 $650.25 $30,410.25
NON-RUMINANT :-
1. Ayam Kampong $394,113.40 $153,582.00 $20,103.60 $3,300.00 $571,098.00
2. Goose $29,356.00 $164.00 $0.00 $0.00 $29,520.00
3. Patu $787.50 $430.50 $0.00 $577.50 $1,795.50
4. Duck $6,888.00 $1,379.00 $1,610.00 $2,205.00 $12,082.00
5. Quail $167,016.33 $24,518.70 $1,093.50 $0.00 $192,628.53
6. Old Layer Chicken $465,700.26 $0.00 $0.00 $0.00 $465,700.26
7. Chicken Breeder $178,264.80 $0.00 $0.00 $0.00 $178,264.80
TOTAL (B$) $1,242,125.29 $180,074.20 $22,807.10 $6,082.50 $1,451,089.09
EGGS :-
1. Ayam Kampong Eggs $6,289.00 $25,424.00 $0.00 $7,376.00 $39,089.00
2. Goose Eggs $15.00 $0.00 $0.00 $28.80 $43.80
3. Patu Eggs $18.00 $2,726.10 $0.00 $10,542.00 $13,286.10
4. Duck Eggs $87,160.80 $57,612.00 $0.00 $123,122.70 $267,895.50
5. Quail Eggs $48,213.50 $6,591.20 $0.00 $0.00 $54,804.70
6. Guinea Fowl Eggs $0.00 $0.00 $0.00 $15.50 $15.50
7. Turkey Eggs $26.00 $0.00 $0.00 $10.00 $36.00
TOTAL (B$) $141,722.30 $92,353.30 $0.00 $141,095.00 $375,170.60
TOTAL OVERALL (B$) $1,395,687.59 $272,427.50 $40,727.10 $147,827.75 $1,856,669.9442
MISCELLANEOUS LIVESTOCK PRODUCTION
BY DISTRICT & RETAIL VALUE - 2017

AGRICULTURE
COMMODITY
LOCAL IMPORTTOTAL
(Quantity -
Unit)
PERCENTAGE
SELF-
SUFFICIENCYQuantity
(Unit)
Retail
Value ($Mil)
Quantity
(Unit)
CIF Value
($Mil)
Vegetables (mt) 13,265.19 34.68 11,291.01 15.79 24,556.21 54.02%
Fruits (mt) 6,622.49 12.36 16,066.25 27.91 22,688.74 29.19%
Paddy (mt) 2,348.76 3.76 0.00 0.00 n/a n/a
Miscellaneous Crops
(mt)1,323.21 2.84 14,116.17 14.03 15,439.38 8.57%
Ornamental Plants
(plants)774,037 5.95 251,547 0.74 1,025,584 75.47%
Cut Flowers (cut) 104,686 0.07 1,362,204 0.99 1,466,890 7.14%
TOTAL 59.65 59.45
44
SUMMARY OF CROPS INDUSTRY
DEVELOPMENT 2017

DISTRICT /
COMMODITIES
BRUNEI-
MUARABELAIT TUTONG TEMBURONG
TOTAL
(Ha)
Vegetables 426.71 124.50 117.45 5.97 674.63
Fruits 277.75 756.08 1,250.93 282.90 2,567.66
Paddy 464.65 129.20 111.30 214.50 919.65
Miscellaneous Crops 19.99 25.90 15.92 1.99 63.80
Floriculture 36.50 2.56 11.32 0.20 50.58
TOTAL (Ha) 1,225.60 1,038.24 1,506.92 505.56 4,276.32
45
CROP LAND AREAS 2017
Note :
Area include Agricultural Development Area (ADA), Existing Area (Ladang Sedia Ada) – EDR & TOL, Young Famer
Area and Rural Agricultural Development Area
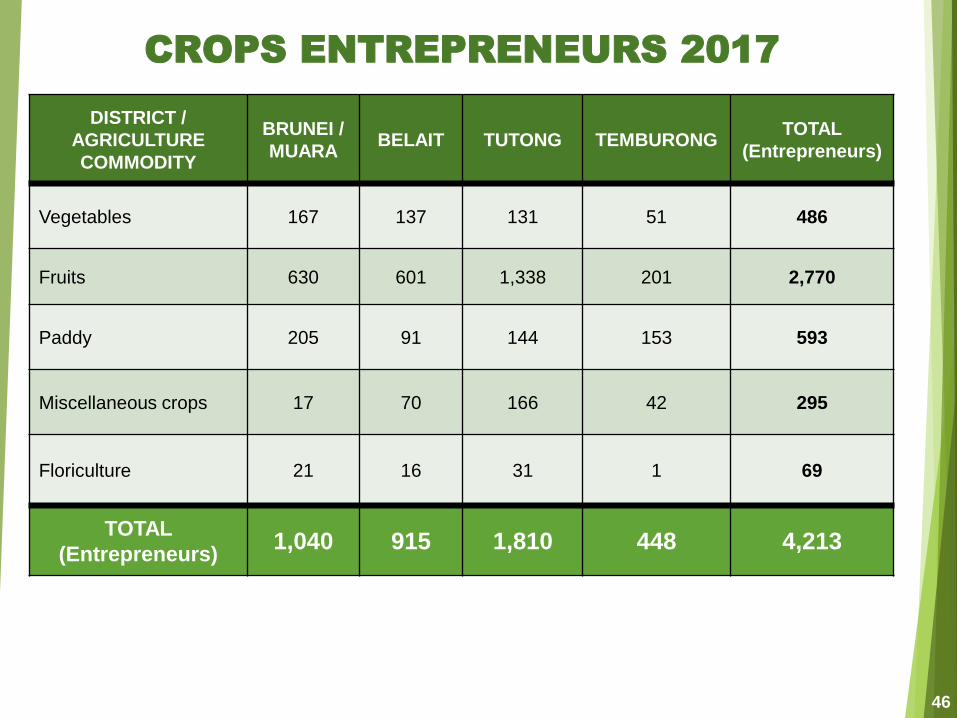
DISTRICT /
AGRICULTURE
COMMODITY
BRUNEI /
MUARABELAIT TUTONG TEMBURONG
TOTAL
(Entrepreneurs)
Vegetables 167 137 131 51 486
Fruits 630 601 1,338 201 2,770
Paddy 205 91 144 153 593
Miscellaneous crops 17 70 166 42 295
Floriculture 21 16 31 1 69
TOTAL
(Entrepreneurs)1,040 915 1,810 448 4,213
46
CROPS ENTREPRENEURS 2017

47
VEGETABLE INDUSTRY 2017
Total Consumption 24,556.2 mt
Tropical 16,709.2 mt
Temperate 7,847.1 mt
Est. Retail Value (B$) 66.49 million
Per Capita Consumption 57.4 kg/yr
Local Production 13,265.2 mt
Retail Value (B$) 34.68 million
Percentage Production 54.0 %
Tropical Vegetable 79.4 %
Area Developed 674.6 ha
No of Entrepreneurs entrepreneurs
Import 11,291.0 mt
CIF Value (B$) 15.79 million
Est. Retail Value (B$) 31.81 million
Percentage Import 46.0 %
Average Retail Price (B$) 1.31 – 11.27 /kg
Average CIF Price (B$)
Tropical 0.45 – 8.72 /kg
Temperate 0.70 – 21.64 /kg
Brunei Population 428,173 persons
0
2,000
4,000
6,000
8,000
10,000
12,000
14,000
2008 2009 2010 2011 2012 2013 2014 2015 2016 2017
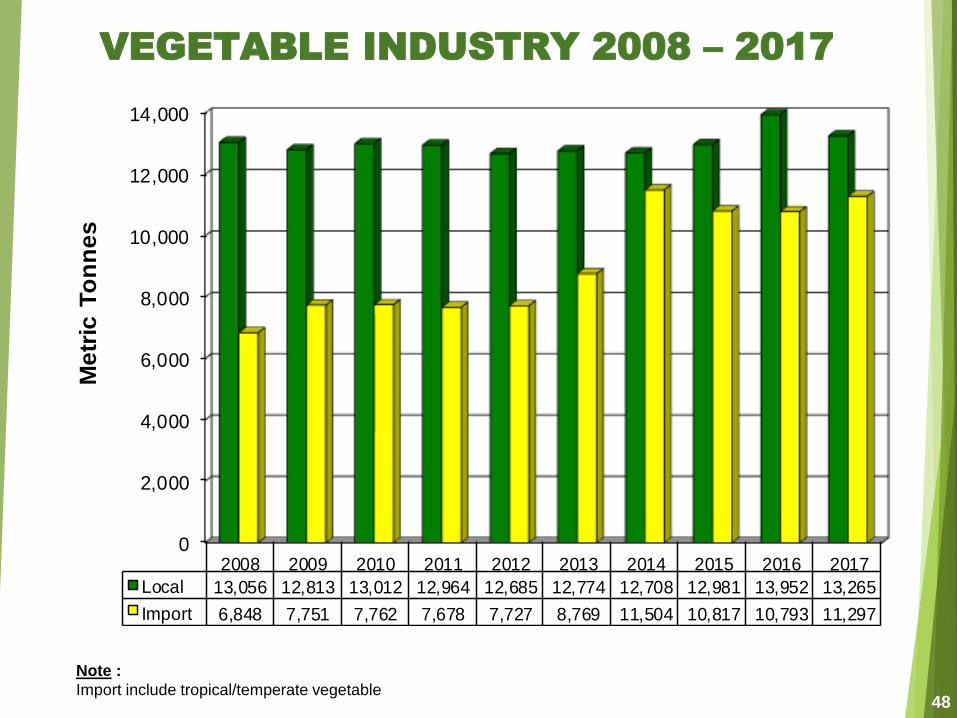
Local 13,056 12,813 13,012 12,964 12,685 12,774 12,708 12,981 13,952 13,265
Import 6,848 7,751 7,762 7,678 7,727 8,769 11,504 10,817 10,793 11,297
Me
tric
To
nn
es
48
VEGETABLE INDUSTRY 2008 – 2017
Note :
Import include tropical/temperate vegetable

DISTRICTQUANTITY
(Mt)
RETAIL VALUE
(B$)
QUANTITY
PERCENTAGE (%)
BRUNEI/MUARA 7,637.97 19,966,100 57.6
BELAIT 2,279.24 6,733,466 19.4
TUTONG 3,68.46 7,341,789 21.2
TEMBURONG 259.53 625,327 1.9
TOTAL 13,265.19 34,684,398 100.0
TYPESQUANTITY
(Mt)
C.I.F. VALUE
(B$)
QUANTITY
PERCENTAGE (%)
TROPICAL 3,443.96 4,846,413.14 30.5
TEMPERATE 7,847.05 10,938,782.47 69.5
TOTAL 11,291.01 15,785,195.6 100.0
DISTRICTAREA
(Ha)
PERCENTAGE
(%)
NO OF FARMERS
(Entrepreneurs)
BRUNEI/MUARA 426.71 63.3% 167
TUTONG 117.45 17.4% 131
BELAIT 124.50 18.5% 137
TEMBURONG 5.97 0.9% 51
TOTAL 692.90 100.0 486
49
LOCAL VEGETABLES PRODUCTION 2017
VEGETABLES IMPORT 2017
VEGETABLES LAND AREA 2017

DISTRICTB/MUARA BELAIT TUTONG TEMBURONG TOTAL
Quantity
% FARM CATEGORY
Existing Area (Commercial) 583,252.00 974,542.00 1,886,659.23 0 3,444,453.23 26.0%
Existing Area (Non-Commercial) 61,953.00 856,494.00 420,579.50 133,776.00 1,472,802.50 11.1%
Existing Area (Unregistered Farmer) 0 12,878.00 56,367.00 118,154.00 187,399.00 1.4%
Agricultural Development Area 6,340,952.01 142,425.30 257,058.00 3,998.00 6,744,433.31 50.8%
Hydroponic Farm 0 55,780.00 0 0 55,739.00 0.4%
Rural Agricultural Development Area 0 237,122.00 18,563.75 3,601.00 259,286.75 2.0%
Young Farmers Area 640,476.00 0 447,230.00 0 1,087,706.00 8.2%
Mushroom Farm 11,332 0 2,000.00 0 13,332.10 0.1%
TOTAL (Kg) 7,637,965.11 2,279,241.30 3,088,457.48 259,529.00 13,265,192.89 100.0%
DISTRICTB/MUARA BELAIT TUTONG TEMBURONG TOTAL
Retail
Value %FARM CATEGORY
Existing Area (Commercial) 1,582,031.11 2,645,219.57 4,437,718.43 0 8,664,969.10 28.4%
Existing Area (Non-Commercial) 216,642.22 2,773,971.91 1,061,653.24 297,815.49 4,350,082.86 12.7%
Existing Area (Unregistered Farmer) 0 51,452.50 135,921.81 325,624.41 512,998.72 1.5%
Agricultural Development Area 16,481,190.41 435,567.99 559,699.95 10,679.78 17,487,138.13 45.4%
Hydroponic Farm 0 156,739.00 0 0 156,739.00 0.4%
Rural Agricultural Development Area 0 670,515.47 44,689.28 8,922.59 724,127.31 2.5%
Young Farmers Area 1,557,517.67 0 1,080,510.50 0 2,638,028.17 8.9%
Mushroom Farm 128,718.53 0 21,596.00 0 150,314.53 0.2%
TOTAL (B$) 19,966,099.94 6,733,466.44 7,341,789.21 643,042.27 34,684,397.86 100.0%
50
STATUS OF VEGETABLES PRODUCTION
BY FARM CATEGORY AND DISTRICT – 2017

RANK TYPEQUANTITY
(Kg)
RETAIL VALUE
(B$)
PRICE
(B$/Kg)
1 Cucumber 2,300,873 3,342,545 1.45
2 Chai Sim (Sawi Hijau/Manis) 1,309,259 3,255,033 2.49
3 Convolvulus/Water Spinach 990,358 1,905,812 1.92
4 Long Bean 989,656 2,654,379 2.68
5 Chinese Spinach/Amaranth (Bayam) 820,300 1,613,221 1.97
6 Pak Choy 700,644 1,815,691 2.59
7 Eggplant 622,515 1,550,829 2.49
8 Sweet Bean (Kacang Manis) 616,837 1,655,531 2.68
9 Lady’s Finger 611,531 1,725,920 2.82
10 Bitter Guord 592,468 1,727,446 2.92
11 Loafah 581,761 1,206,805 2.07
12 Red Chilli 547,594 3,941,658 7.20
13 Water Guord 394,583 624,615 1.58
14 Pumpkin 248,312 450,033 1.81
15 Swatow Mustard (Sawi Pahit) 197,978 518,866 2.62
51
15 MAJOR TYPE OF LOCAL VEGETABLES
PRODUCTION 2017 (BY QUANTITY)

RANK TYPEQUANTITY
(Kg)
C.I.F VALUE
(B$)
AVERAGE
C.I.F PRICE
(B$/Kg)
1 Thailand Chilli 721,851 1,010,884 1.40
2 Baby Kailan 348,764 353,171 1.01
3 French Bean 346,944 331,983 0.96
4 Pumpkin 330,911 264,604 0.80
5 Radish 307,877 210,081 0.68
6 Red Chilli 271,669 719,128 2.65
7 Mushroom 221,327 882,937 3.99
8 Spring Onion/Chives 208,941 268,701 1.29
9 Egg Plant/Brinjal 183,104 137,945 0.75
10 Timun Duri 174,489 111,035 0.64
11 Young Corn 82,685 256,136 3.10
12 Sayur Minyak 38,750 37,077 0.96
13 Chinese Chives 33,162 34,224 1.03
14 Round Eggplant 23,274 12,496 0.54
15 Paddy Pepper (Lada Padi) 21,170 62,325 2.94
52
15 MAJOR TYPE OF IMPORT TROPICAL
VEGETABLES 2017 (BY QUANTITY)

RANK TYPEQUANTITY
(Kg)
C.I.F VALUE
(B$)
AVERAGE
C.I.F PRICE
(B$/Kg)
1 Cabbage 2,310,822 1,625,035 0.70
2 Tomato 1,463,026 1,323,047 0.90
3 Carrot 1,138,641 1,302,149 1.14
4 Chinese Cabbage 478,449 377,548 0.79
5 Cauliflower 472,096 736,358 1.56
6 Brocolli (Bunga Kobis) 455,294 1,246,064 2.74
7 Lettuce 405,363 1,274,152 3.14
8 Capsicum/Sweet Pepper 315,647 941,497 2.98
9 Pak Choy 165,161 301,886 1.83
10 Celery 154,515 274,795 1.78
11 Leek 71,258 113,837 1.60
12 Chinese Kale 62,059 164,383 2.65
13 Beet Root 53,151 79,457 1.49
14 Lotus Root 46,293 121,837 2.63
15 Spinach 37,964 158,265 4.17
53
15 MAJOR TYPE OF IMPORT TEMPERATE
VEGETABLES 2017 (BY QUANTITY)

54
FRUITS INDUSTRY 2017
Total Consumption 22,688.7 mt
Tropical 17,567.8 mt
Temperate 5,121.0 mt
Est. Retail Value (B$) 58.02 million
Per Capita Consumption 53.0 kg/yr
Local Production 6,622.5 mt
Retail Value (B$) 12.36 million
Percentage Production 29.2 %
Percentage Tropical Fruits 37.7 %
Area Developed 2,568 ha
No of Entrepreneurs 2,890 entrepreneurs
Import 16,066.3 mt
CIF Value (B$) 27.91 million
Est. Retail Value (B$) 45.66 million
Percentage Import 70.8 %
Average Retail Price (B$) $0.45 – $11.39 /kg
Average CIF Price (B$)
Tropical $1.33 – $6.83 /kg
Temperate $2.01 – $32.95 /kg
Brunei Population 428,173 Persons

0
2,000
4,000
6,000
8,000
10,000
12,000
14,000
16,000
18,000
2008 2009 2010 2011 2012 2013 2014 2015 2016 2017
Local 3,485 4,372 3,229 2,628 8,779 3,855 5,834 6,262 5,791 6,622
Import 14,359 14,332 14,940 14,413 13,647 14,480 14,803 16,493 15,249 16,066
Metr
ic T
on
nes
55
FRUITS INDUSTRY 2008 – 2017
DISTRICTQUANTITY
(Mt)
RETAIL
VALUE (B$)
PERCENTAGE
(%)
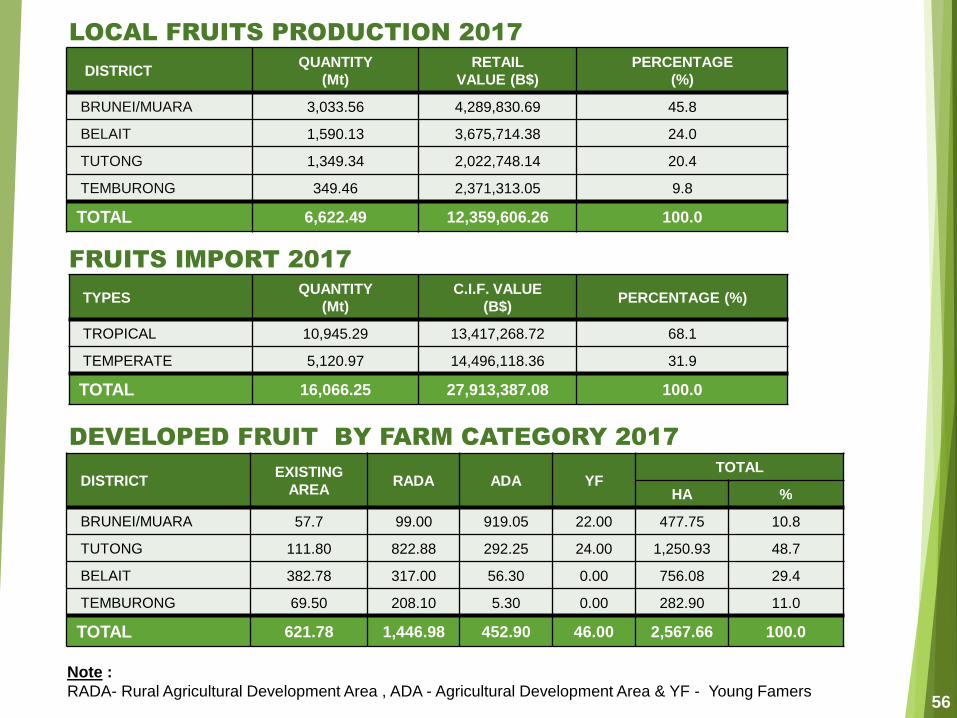
BRUNEI/MUARA 3,033.56 4,289,830.69 45.8
BELAIT 1,590.13 3,675,714.38 24.0
TUTONG 1,349.34 2,022,748.14 20.4
TEMBURONG 349.46 2,371,313.05 9.8
TOTAL 6,622.49 12,359,606.26 100.0
TYPESQUANTITY
(Mt)
C.I.F. VALUE
(B$)PERCENTAGE (%)
TROPICAL 10,945.29 13,417,268.72 68.1
TEMPERATE 5,120.97 14,496,118.36 31.9
TOTAL 16,066.25 27,913,387.08 100.0
DISTRICT EXISTING
AREA RADA ADA YF
TOTAL
HA %
BRUNEI/MUARA 57.7 99.00 919.05 22.00 477.75 10.8
TUTONG 111.80 822.88 292.25 24.00 1,250.93 48.7
BELAIT 382.78 317.00 56.30 0.00 756.08 29.4
TEMBURONG 69.50 208.10 5.30 0.00 282.90 11.0
TOTAL 621.78 1,446.98 452.90 46.00 2,567.66 100.0
56
LOCAL FRUITS PRODUCTION 2017
FRUITS IMPORT 2017
DEVELOPED FRUIT BY FARM CATEGORY 2017
Note :
RADA- Rural Agricultural Development Area , ADA - Agricultural Development Area & YF - Young Famers

DISTRICTB/MUARA TUTONG BELAIT TEMBURONG TOTAL
QUANTITY
%FARM CATEGORY
Existing Area (Commercial) 249,352 50,178 702,262 0 1,001,792 15.13%
Existing Area (Non-Commercial) 48,373 254,826 479,165 264,630 1,046,993 15.81%
Existing Area (Non-Commercial –
unregistered farmer)1,931,469 693,767 35,060 276,711 2,937,007 44.35%
Rural Agricultural Development Area 206,117 140,035 152,209 45,465 543,825 8.21%
Young Farmers Area 34,193 3,278 0 0 37,471 0.57%
Agricultural Development Area (ADA) 564,055 207,254 221,431 62,658 1,055,398 15.94%
TOTAL (Kg) 3,033,559 1,349,337 1,590,126 649,464 6,622,487 100.00%
DISTRICT B/MUAR
ATUTONG BELAIT TEMBURONG TOTAL
VALUE
%FARM CATEGORY
Existing Area (Commercial) 468,741 76,413 1,690,331 0 2,235,486 18.09%
Existing Area (Non-Commercial) 88,226 399,679 1,093,152 1,154,265 2,735,322 22.13%
Existing Area (Non-Commercial –
unregistered farmer)2,223,146 811,125 54,153 891,215 3,979,639 32.20%
Rural Agricultural Development Area 468,112 360,991 362,968 249,294 1,441,365 11.66%
Young Farmers Area 55,236 5,411 0 0 60,648 0.49%
Agricultural Development Area (ADA) 986,370 369,128 475,110 76,539 1,907,147 15.43%
TOTAL (B$) 4,289,831 2,022,748 3,675,714 2,371,313 12,359,606 100.00%
57
STATUS OF FRUIT PRODUCTION
BY FARM CATEGORY AND DISTRICT – 2017
RANK TYPEQUANTITY
(Kg)
RETAIL VALUE
(B$)
PRICE
(B$/Kg)
1 Banana 1,821,874 2,729,287 1.50
2 Young Coconut 1,734,825 777,059 0.45
3 Limau Kasturi 643,710 1,376,763 2.14
4 Old Coconut 427,039 694,345 1.63
5 Papaya 419,287 564,654 1.35
6 Jackfruit 198,992 600,979 3.02
7 Durian 160,202 1,824,447 11.39
8 Watermelon 155,571 266,466 1.71
9 Mango 151,554 402,564 2.66
10 Guava 134,657 395,022 2.93
11 Pineapple 100,133 231,977 2.32
12 Musk Lime 93,880 275,053 2.93
13 Pamelo 73,288 345,888 4.72
14 Cempedak 56,349 185,028 3.28
15 Soursop (Durian Salat) 54,839 226,265 4.13
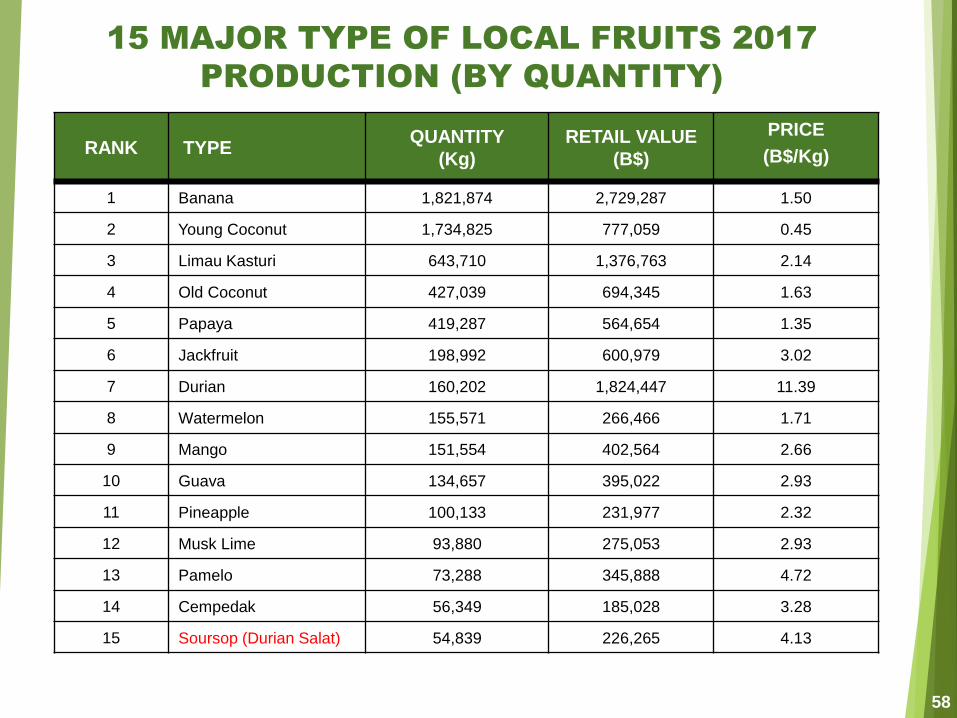
58
15 MAJOR TYPE OF LOCAL FRUITS 2017
PRODUCTION (BY QUANTITY)

RANK TYPEQUANTITY
(Kg)
C.I.F VALUE
(B$)
AVERAGE
C.I.F PRICE
(B$/Kg)
1 Banana 3,178,609 2,157,020 0.68
2 Watermelon 2,149,412 1,137,868 0.53
3 Old Coconut 835,560 285,680 0.34
4 Rock Melon / Honeydew Melon 797,469 1,017,225 1.28
5 Papaya 764,744 410,996 0.54
6 Pineapple 705,613 793,356 1.12
7 Lemon 512,919 1,384,196 2.70
8 Durian 415,902 2,054,044 4.94
9 Mango 277,162 1,209,179 4.36
10 Pamelo 237,456 224,043 0.94
11 Guava 186,522 166,347 0.89
12 Young Coconut 151,685 207,992 1.37
13 Avocado 150,060 839,759 5.60
14 Limau Kapas 78,891 71,746 0.91
15 Jambu Air 54,647 273,356 5.00
59
15 MAJOR TYPE OF IMPORT TROPICAL
FRUITS 2017 (BY QUANTITY)
RANK TYPEQUANTITY
(Kg)
C.I.F VALUE
(B$)
AVERAGE
C.I.F PRICE
(B$/Kg)
1 Apple 1,632,563 3,589,440 2.20
2 Sunkist Orange 1,077,878 2,329,215 2.16
3 Mandarin Orange 668,930 1,500,851 2.24
4 Pear 577,849 1,163,682 2.01
5 Grape 515,495 2,768,735 5.37
6 Dragon Fruit 144,757 317,552 2.19
7 Sweet Orange 129,631 317,174 2.45
8 Kiwi Fruit 92,053 467,214 5.08
9 Longan 87,455 238,322 2.73
10 Strawberry 45,557 624,002 13.70
11 Buah Kesamak 33,783 208,345 6.17
12 Plum 32,443 153,226 4.72
13 Grape Fruit 19,296 68,850 3.57
14 Cherry 12,948 206,461 15.95
15 Blueberries 12,370 240,640 19.45
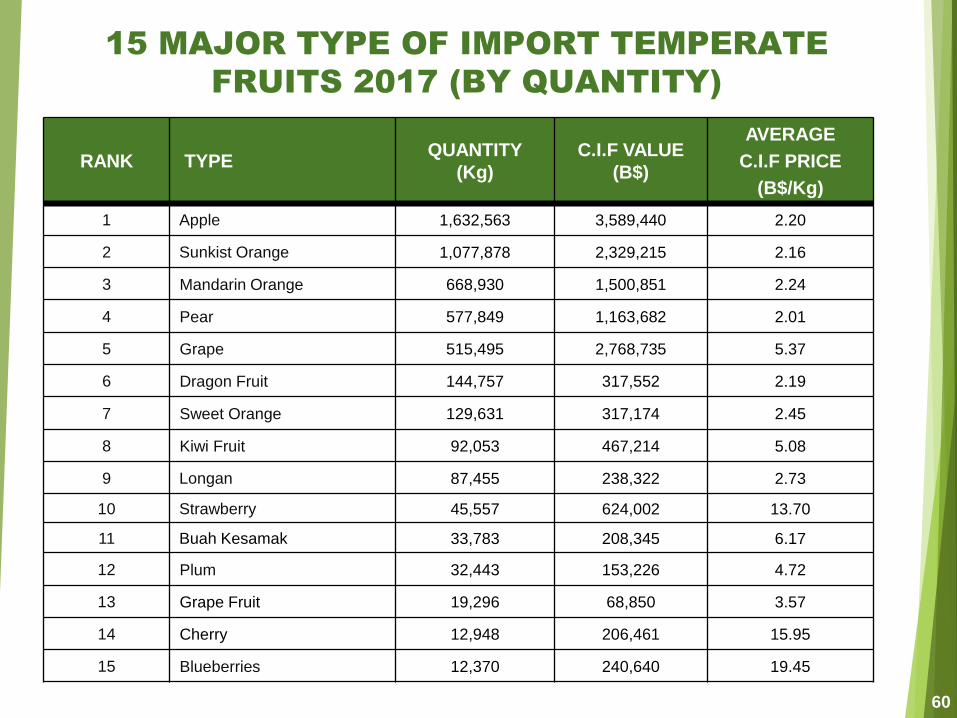
60
15 MAJOR TYPE OF IMPORT TEMPERATE
FRUITS 2017 (BY QUANTITY)

61
RICE INDUSTRY 2017
Note:
1. Area are divided into two data. Harvested area is 1,336.10 ha for two seasons and total developed area is 919.65 ha
2. The average retail price of local rice are taken from the overall average retail price which was collected by Information
Management Unit & SIPA Unit. While import prices was according to the price control by EPU.
Total Consumption 32,158 mt
Est. Retail Value (B$) 40.30 million
Per Capita Consumption 75.11 kg/yr
Local Production 1,526.69 mt
Retail Value (B$) 3.63 million
Percentage Self-Sufficiency 4.75 %
Average Retail Price (B$)
Local Rice 2.38 /kg
Area Developed 919.65 ha
Productivity
Irrigated Area 4.49 mt/ha/yr
Non-Irrigated Area 0.91 mt/ha/yr
Total Import 20,810 mt
Saleable 30,631 mt
Est. Retail Value (B$) 36.66 million
Import (%) 95.25 %
Average Retail Price (B$)
Fragrant Rice (AAA) 1.25 /kg
Ordinary Rice 0.85 /kg
Glutinous Rice 0.76 /kg
Brunei Population 428,173 Persons

2008 2009 2010 2011 2012 2013 2014 2015 2016 2017
Local 911 891 1072 1,480 1,756 1,237 1,382 1,983 1,579 1,527
Import 31,969 30,895 31,293 31,835 32,966 33,074 32,744 31,350 31,061 30,631
29,000
29,500
30,000
30,500
31,000
31,500
32,000
32,500
33,000
33,500
0
500
1,000
1,500
2,000
2,500
Me
tric
To
nn
es
Me
tric
To
nn
es
62
RICE INDUSTRY 2008 - 2017
Note :
Import is saleable rice

DISTRICT
HARVESTED
AREA
(Ha)
NO. OF
FARMERS
YEILD PADDY
(Mt)
RICE 65% milling
Recovery (Mt)%
BRUNEI MUARA 861.10 205 1,932.86 1,256.4 82.3
BELAIT 138.80 91 105.23 68.4 4.5
TUTONG 117.90 144 77.28 50.2 3.3
TEMBURONG 218.30 153 233.39 151.7 9.9
TOTAL 1,336.10 593 2,348.76 1,526.69 100.0
63
LOCAL RICE PRODUCTION 2017
Note : 1). The number of farmers & acreage are using main season only except for Brunei Muara District have to
select high cultivated area for two seasons.
2). Acreage is acreage that yielded only.

64
MISCELLANEOUS CROPS INDUSTRY 2017
Total Consumption 15,439.8 mt
Est. Retail Value (B$) 23.88 million
Per Capita Consumption 36.1 kg/yr
Local Production 1,323.2 mt
Retail Value (B$) 2.84 million
Percentage Self-Sufficiency 8.6 %
Brunei Population 428,173 Persons
Total Import 14,116.6 mt
CIF Value (B$) 14.03 million
Est. Retail Value (B$) 21.04 million
Percentage Import 91.4 %
0
2000
4000
6000
8000
10000
12000
14000
16000
2008 2009 2010 2011 2012 2013 2014 2015 2016 2017
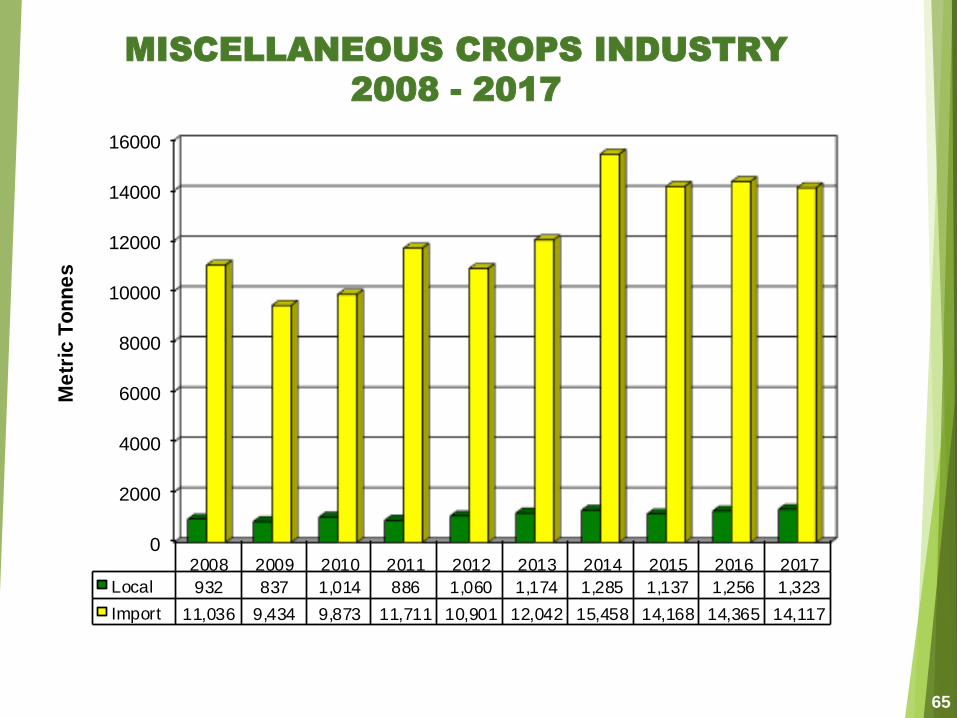
Local 932 837 1,014 886 1,060 1,174 1,285 1,137 1,256 1,323
Import 11,036 9,434 9,873 11,711 10,901 12,042 15,458 14,168 14,365 14,117
Me
tric
To
nn
es
65
MISCELLANEOUS CROPS INDUSTRY
2008 - 2017

DISTRICTQUANTITY
(Kg)
RETAIL
VALUE (B$)
QUANTITY PERCENTAGE
(%)
BRUNEI/MUARA 508,237.00 1,167,731.44 38.41
BELAIT 402,499.00 835,727.22 30.42
TUTONG 302,808.50 639,335.26 22.88
TEMBURONG 109,667.00 196,533.10 8.29
TOTAL 1,323,211.50 2,839,327.02 100.00
TYPES QUANTITY
(Kg)
RETAIL
VALUE (B$)
PRICE
(B$ / Kg)
Beverages
Sugar Cane 113,659 52,682 0.46
Tubers
Tapioca
Sweet potato
Yam
Yam Bean
246,899
95,811
24,020
4,935
326,434
272,953
67,043
13,745
1.32
2.85
2.79
2.79
Spices
Lemon Grass
Galangal
Turmeric
Lime Leaf
Garjil
Curry Leaf
157,414
48,483
13,109
5,219
480
5,570
275,180
117,126
48,618
38,359
19,200
16,709
1.75
2.42
3.71
7.35
40.00
3.00
Sweet Corn 549,53 1,435,655 2.61
Sago 26,277 55,508 2.11
Others 31,802 100,117 3.1566
LOCAL MISCELLANEOUS CROPS PRODUCTION 2017
LOCAL MISCELLANEOUS CROPS 2017 (BY TYPES)

NO TYPEQUANTITY
(Kg)
C.I.F VALUE
(B$)
AVERAGE
C.I.F PRICE
(B$/Kg)
Cereals :
1 Maize 238,740 127,267 0.53
2 Maize Corn Whole 45,700 23,904 0.52
Tubers :
3 Potato 3,935,895 2,641,479 0.67
4 Yam 198,751 380,183 1.91
5 Sweet Potato 201,526 278,494 1.38
6 Yam Bean 113,645 81,790 0.72
Spices :
7 Onion 4,827,029 3,229,026 0.67
8 Garlic 1,124,517 2,230,347 1.98
9 Ginger 989,755 1,319,928 1.33
Shallot 568,716 705,597 1.24
10 Dried Chili 211,102 569,625 2.70
11 Coriander Leaf 126,718 202,369 1.60
12 Parsley 36,053 118,222 3.28
13 Daun Sop 57,409 113,637 1.98
67
TYPE OF IMPORT MISCELLANEOUS
CROPS 2017 (BY QUANTITY)

NO TYPEQUANTITY
(Kg)
C.I.F
VALUE
(B$)
AVERAGE
C.I.F PRICE
(B$/Kg)
14 Turmeric 31,143 59,206 1.90
15 Coriander Seed 18,219 40,563 2.23
16 Mint Leaf 14,622 40,129 2.74
17 Tom Yam Set 7,076 40,069 5.66
Legumes :
18 Soya Bean 661,985 655,466 0.99
19 Ground Nut 186,094 330,093 1.77
20 Mung Bean 212,875 278,451 1.31
21 Ground Nut Kernel 116,192 240,566 2.07
22 Kidney Bean 24,203 37,439 1.55
68
TYPE OF IMPORT MISCELLANEOUS
CROPS 2017 (BY QUANTITY)
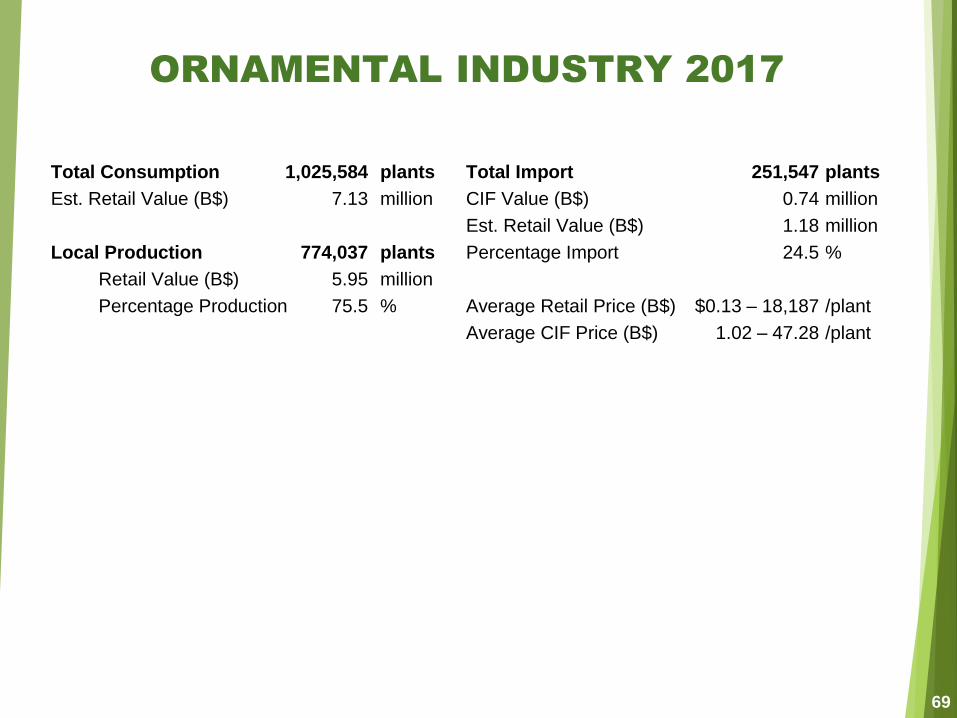
69
ORNAMENTAL INDUSTRY 2017
Total Consumption 1,025,584 plants
Est. Retail Value (B$) 7.13 million
Local Production 774,037 plants
Retail Value (B$) 5.95 million
Percentage Production 75.5 %
Total Import 251,547 plants
CIF Value (B$) 0.74 million
Est. Retail Value (B$) 1.18 million
Percentage Import 24.5 %
Average Retail Price (B$) $0.13 – 18,187 /plant
Average CIF Price (B$) 1.02 – 47.28 /plant

0
100,000
200,000
300,000
400,000
500,000
600,000
700,000
800,000
2008 2009 2010 2011 2012 2013 2014 2015 2016 2017
Local 430,331 338,899 372,482 363,166 427,922 530,138 595,258 687,360 650,490 774,037
Import 291,082 214,504 122,599 138,765 177,223 271,352 336,194 236,562 150,747 251,547
Pla
nts
70
ORNAMENTAL INDUSTRY 2008 - 2017

DISTRICTQUANTITY
(Plants)
RETAIL
VALUE (B$)
QUANTITY
PERCENTAGE
(%)
BRUNEI/MUARA 593,022 3,742,197 76.6
BELAIT 15,480 72,369 2.0
TUTONG 165,535 2,131,576 21.4
TOTAL 774.037 5,946,142 100.0
NO TYPESQUANTITY
(Plants)
RETAIL VALUE
(B$)
PRICE
B$/PLANT
1 Ground Cover 265,054 271,268 1.02
2 Outdoor Shrubs 229,174 845,532 3.69
3 Indoor Shrubs 114,949 435,255 3.79
4 Palms 37,512 781,393 20.83
5 Trees 63,434 2,999,142 47.28
6 Orchid 51,552 530,117 10.28
7 Cactus 12,362 83,432 6.75
TOTAL 774,037 5,946,142 7.68
71
LOCAL ORNAMENTAL PLANTS 2017 (BY TYPES)
LOCAL ORNAMENTAL PLANTS PRODUCTION 2017

RANK TYPEQUANTITY
(Plants)
C.I.F VALUE
(B$)
AVERAGE
C.I.F PRICE
(B$/Plant)
1 Phalaenopsis 90,274 243,224.32 2.69
2 Dendrobium Hybrids 21,420 20,250.88 0.95
3 Bougainvillea 14,131 13,304.26 0.94
4 Rose 10,319 18,983.54 1.84
5 Ixora Spp. 9,500 1,615.38 0.17
6 Begonia Spp. 8,110 11,022.04 1.36
7 Lantana Spp. 7,870 1,739.42 0.22
8 Heuchera Micrantha 7,756 17,836.00 2.30
9 Hisbiscus 6,505 5,336.83 0.82
10 Adenium Spp. 4,250 5,054.12 1.19
11 Cactus Plant 4,069 7,943.16 1.95
12 Mokara Plant 3,825 10,191.36 2.66
13 Neomarica Spp. 3,500 745.92 0.21
14 Anthurium Spp. 3,241 16,184.09 4.99
15 Orchid Plant 3,068 10,955.92 3.57
72
15 MAJOR TYPE OF IMPORT ORNAMENTAL PLANTS
2017 (BY QUANTITY)

73
CUT FLOWERS INDUSTRY 2017
Total Consumption 1,466,890 cuts
Est. Retail Value (B$) 1.65 million
Local Production 104,686 cuts
Retail Value (B$) 67,204
Percentage Production 7.1 %
Total Import 1,362,204 cuts
CIF Value (B$) 0.99 million
Est. Retail Value (B$) 1.58 million
Import (%) 92.9 %
Average Retail Price (B$) 0.20 – 75.60 /cut
Average CIF Price (B$) 0.10 – 20.85 /cut

0
200
400
600
800
1,000
1,200
1,400
2008 2009 2010 2011 2012 2013 2014 2015 2016 2017
Local 262 145 139 278 184 210 187 174 128 105
Import 932 612 682 729 681 922 864 1,014 885 1,362
Th
ou
san
d C
uts
74
CUT FLOWERS INDUSTRY 2008 - 2017

NO TYPESQUANTITY
(Cuts)
RETAIL VALUE
(B$)
QUANTITY
PERCENTAGE
(%)
1 Orchid 79,160 85,590 75.6
2 Red Ginger 6,370 8,915 6.1
3 Goldern Red 12,520 3,130 12.0
5 Johor Fern 5,480 1,370 5.2
5 Anthurium 905 914 0.9
6 Heliconia 251 285 0.2
TOTAL 104,686 67,204 100.0
Note :
100% produced from Belait District
75
LOCAL CUT FLOWERS 2017 (BY TYPES)

RANK TYPEQUANTITY
(Cuts)
C.I.F VALUE
(B$)
AVERAGE
C.I.F PRICE
(B$/Cut)
1 Chrysanthemum Spp. 492,960 324,605.30 0.66
2 Rose 247,212 149,580.70 0.61
3 Dianthus Spp. 77,530 42,574.96 0.55
4 Dendrobium Hybrids 67,120 45,392.05 0.68
5 Gerbera Spp. 53,892 34,513.11 0.64
6 Carnation 44,974 19,507.21 0.43
7 Phoenix/Peacock 40,450 26,745.20 0.66
8 Eustoma 26,737 19,761.48 0.74
9 Orchids Flowers 23,595 18,559.84 0.79
10 Mokara 21,730 14,682.85 0.68
11 Lilium Spp. 19,027 29,448.74 1.55
12 Limonium Spp. 17,165 8,691.21 0.51
13 Davallia Spp. 16,050 8,127.50 0.51
14 Gypsophila Spp. 14,080 12,358.51 0.88
15 Anthurium Spp. 12,668 15,001.67 1.18
76
15 MAJOR TYPE OF IMPORT CUT FLOWERS
2017 (BY QUANTITY)
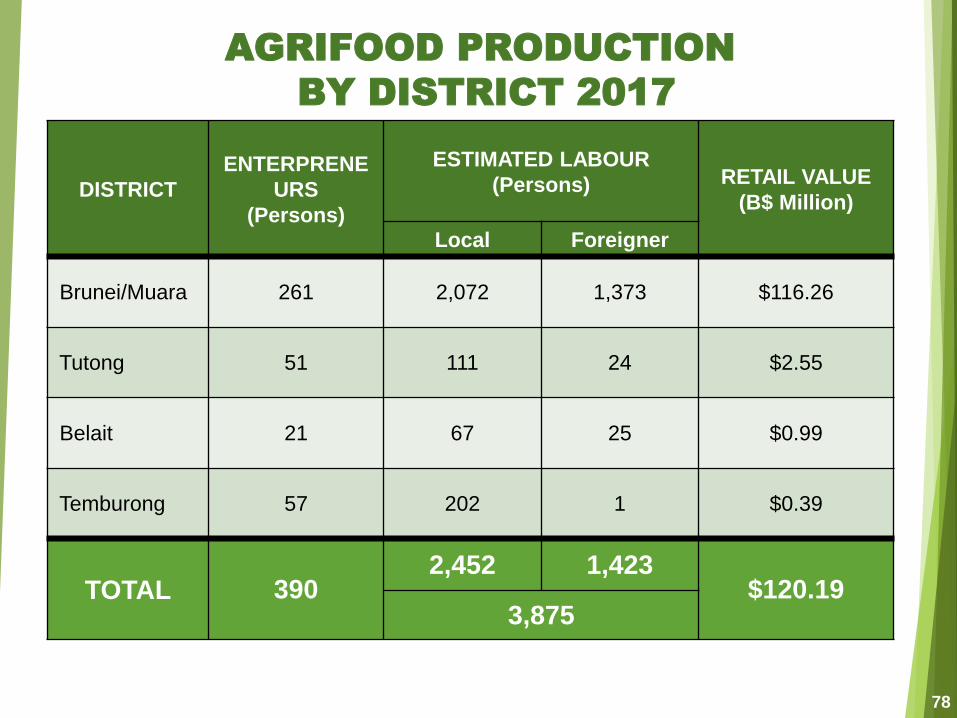
DISTRICT
ENTERPRENE
URS
(Persons)
ESTIMATED LABOUR
(Persons) RETAIL VALUE
(B$ Million)
Local Foreigner
Brunei/Muara 261 2,072 1,373 $116.26
Tutong 51 111 24 $2.55
Belait 21 67 25 $0.99
Temburong 57 202 1 $0.39
TOTAL 3902,452 1,423
$120.193,875
78
AGRIFOOD PRODUCTION
BY DISTRICT 2017

0
10
20
30
40
50
60
70
2008 2009 2010 2011 2012 2013 2014 2015 2016 2017
Livestock Processing 7.85 9.06 9.33 10.25 13.31 44.20 43.87 45.27 62.63 66.66
Crop Processing 44.68 44.15 44.42 46.96 49.52 42.03 58.81 65.21 55.48 53.53
B$ M
illio
n
79
LOCAL AGRIFOOD INDUSTRY
2008 - 2017

Biscuits & Bakery
$22.93 mil
19.1%
Soft Drink & Mineral Water
$18.38 mil
15.3%
Ice Cream
$3.22 mil
2.7%
Snack
$1.92 mil
1.6%
Traditional Foods
$1.67 mil
1.4%
Fish Products
$0.97 mil
0.8%
Spices
$1.00 mil
0.8%
Sauces & Seasonings
$1.03 mil
0.9%
Noodle
$0.92 mil
0.8%Others
$0.90 mil
0.7%
Soybean Products
$0.60 mil
0.5%
Meat Products
$10.35 mil
8.6%
Fast Food
$56.31 mil
46.9%
80
AGRIFOOD INDUSTRY BY CATEGORY 2017
Note:
1. Market Size : B$ 20.19.11 million
2. Others – Pickles, Meals Ready To Eat, Fermentation, Confectionery, Health & Beauty Products, Sago, Oil & Fat
& Flour Products
Other: Pickles & Pickle, sago, Confectionery, fermentation, Meals Ready to Eat, Health & Beauty Products,

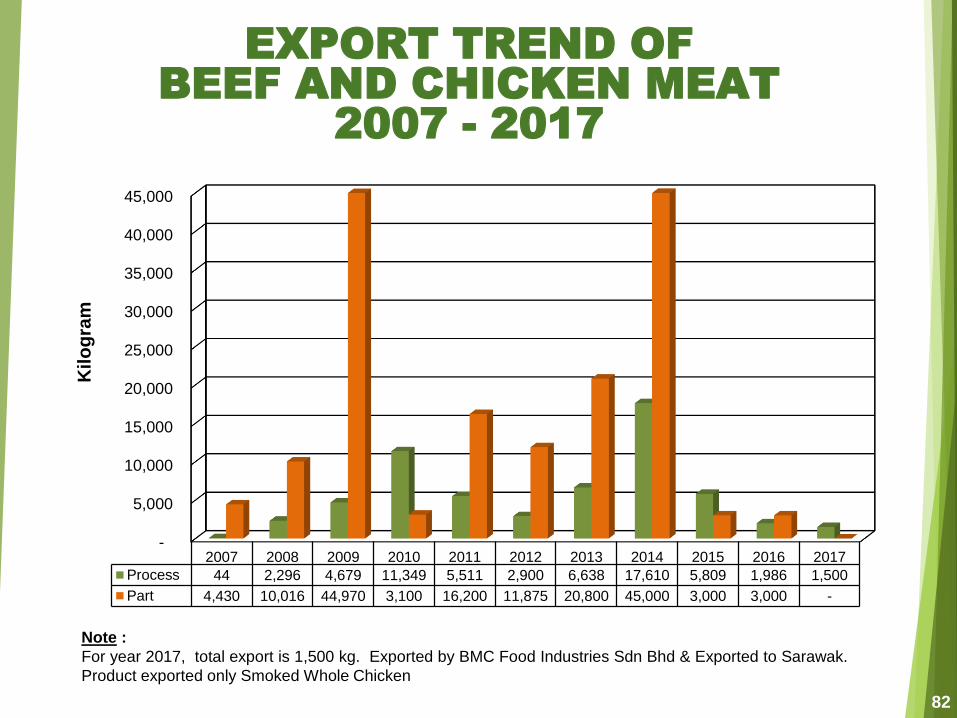
-
5,000
10,000
15,000
20,000
25,000
30,000
35,000
40,000
45,000
2007 2008 2009 2010 2011 2012 2013 2014 2015 2016 2017
Process 44 2,296 4,679 11,349 5,511 2,900 6,638 17,610 5,809 1,986 1,500
Part 4,430 10,016 44,970 3,100 16,200 11,875 20,800 45,000 3,000 3,000 -
Kil
og
ram
Chart Title
82
EXPORT TREND OF
BEEF AND CHICKEN MEAT
2007 - 2017
Note :
For year 2017, total export is 1,500 kg. Exported by BMC Food Industries Sdn Bhd & Exported to Sarawak.
Product exported only Smoked Whole Chicken

SYARIKAT MOHAMMAD NORFAIDZAL
HJ ZAINUDDIN DAN ANAK-ANAK
1,350 Pieces [28%]
MULAUT ABATTOIR SDN BHD
850 Pieces [18%]
EXPORT OF CATTLE HIDE 2017
83
Note :
For year 2017, total export is 4,850 pieces and export to Indonesia, Thailand and India.
PDS ABATTOIR (B) SDN. BHD.
2,650 Pieces [55%]

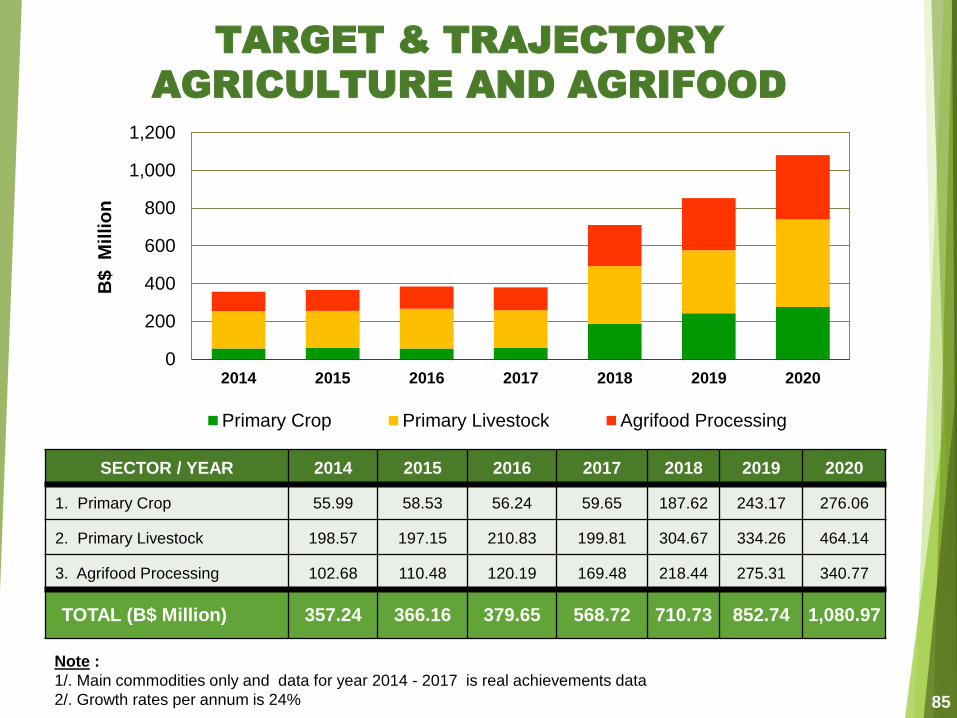
TARGET & TRAJECTORY
AGRICULTURE AND AGRIFOOD
SECTOR / YEAR 2014 2015 2016 2017 2018 2019 2020
1. Primary Crop 55.99 58.53 56.24 59.65 187.62 243.17 276.06
2. Primary Livestock 198.57 197.15 210.83 199.81 304.67 334.26 464.14
3. Agrifood Processing 102.68 110.48 120.19 169.48 218.44 275.31 340.77
TOTAL (B$ Million) 357.24 366.16 379.65 568.72 710.73 852.74 1,080.97
0
200
400
600
800
1,000
1,200
2014 2015 2016 2017 2018 2019 2020
B$
M
illio
n
Primary Crop Primary Livestock Agrifood Processing
85
Note :
1/. Main commodities only and data for year 2014 - 2017 is real achievements data
2/. Growth rates per annum is 24%

NOTE
______________________________________________________________________
______________________________________________________________________
______________________________________________________________________
______________________________________________________________________
______________________________________________________________________
______________________________________________________________________
______________________________________________________________________
______________________________________________________________________
______________________________________________________________________
______________________________________________________________________
______________________________________________________________________
______________________________________________________________________
______________________________________________________________________
86

NOTE
______________________________________________________________________
______________________________________________________________________
______________________________________________________________________
______________________________________________________________________
______________________________________________________________________
______________________________________________________________________
______________________________________________________________________
______________________________________________________________________
______________________________________________________________________
______________________________________________________________________
______________________________________________________________________
______________________________________________________________________
______________________________________________________________________
87

Information Management & SIPA Unit


