72
First Quarter 2011 Report

First Quarter 2011 Report

USD millions, unless otherwise stated 2010 2011 Change in %
GroupNet income / loss attributable to common shareholders 158 –665 –Premiums earned 4 968 4 882 –2Earnings per share in CHF 0.49 –1.84 –Shareholders’ equity (31.12.2010/31.03.2011) 25 342 24 438 –4Return on equity1 in % (annualised) 2.7 –10.7Number of employees2 (31.12.2010/31.03.2011) 10 362 10 417 1
Property & Casualty Operating income / loss 259 –1 233 –Premiums earned 2 851 2 630 –8Combined ratio, traditional business in % 109.4 163.7
Life & HealthOperating income 245 144 –41Premiums earned and fee income 2 337 2 452 5Benefit ratio in % 89.1 89.4
Asset ManagementOperating income 937 1 226 31Return on investments in % (annualised) 2.8 4.0
1 Return on equity is calculated by dividing annualised net income attributable to common shareholders by average common shareholders’ equity.
2 Regular staff
Key information
Financial strength ratingsas of 29 April 2011 S&P Moody’s A.M. Best
Rating A+ A1 AOutlook positive stable positive
Share informationas of 29 April 2011
Share price in CHF 51.55Market capitalisation in CHF millions 19 110
Share performancein % 1 January 2006 – 29 April 2011 (p.a.) Year to 29 April 2011
Swiss Re –11.1 2.5Swiss Market Index –2.7 1.7STOXX Europe 600 Insurance Index –6.3 11.8
Financial highlights (unaudited)For the three months ended 31 March
Share price (CHF)
20
40
60
80
100
120
140
160
0
201120102009200820072006 Swiss Re Swiss Market Index STOXX Europe 600 Insurance Index

Swiss Re First Quarter 2011 Report 1
Contents
Letter to shareholders 2
Key events 5
Group 6 Group results
9 Property & Casualty
10 Life & Health
11 Asset Management
12 Outlook
Financial statements 13 Income statement
14 Balance sheet
16 Statement of equity
17 Statement of comprehensive income
18 Statement of cash flow
Notes to the Group financial statements:
19 Note 1 Organisation and summary of significant accounting policies
21 Note 2 Investments
27 Note 3 Fair value disclosures
40 Note 4 Derivative financial instruments
46 Note 5 Deferred acquisition costs (DAC) and acquired present value
of future profits (PVFP)
47 Note 6 Debt
48 Note 7 Reinsurance information
50 Note 8 Earnings per share
51 Note 9 Benefit plans
53 Note 10 Information on business segments
59 Note 11 Variable interest entities
General information 63 Note on risk factors
68 Cautionary note on forward-looking statements
2 Swiss Re First Quarter 2011 Report
Letter to shareholders
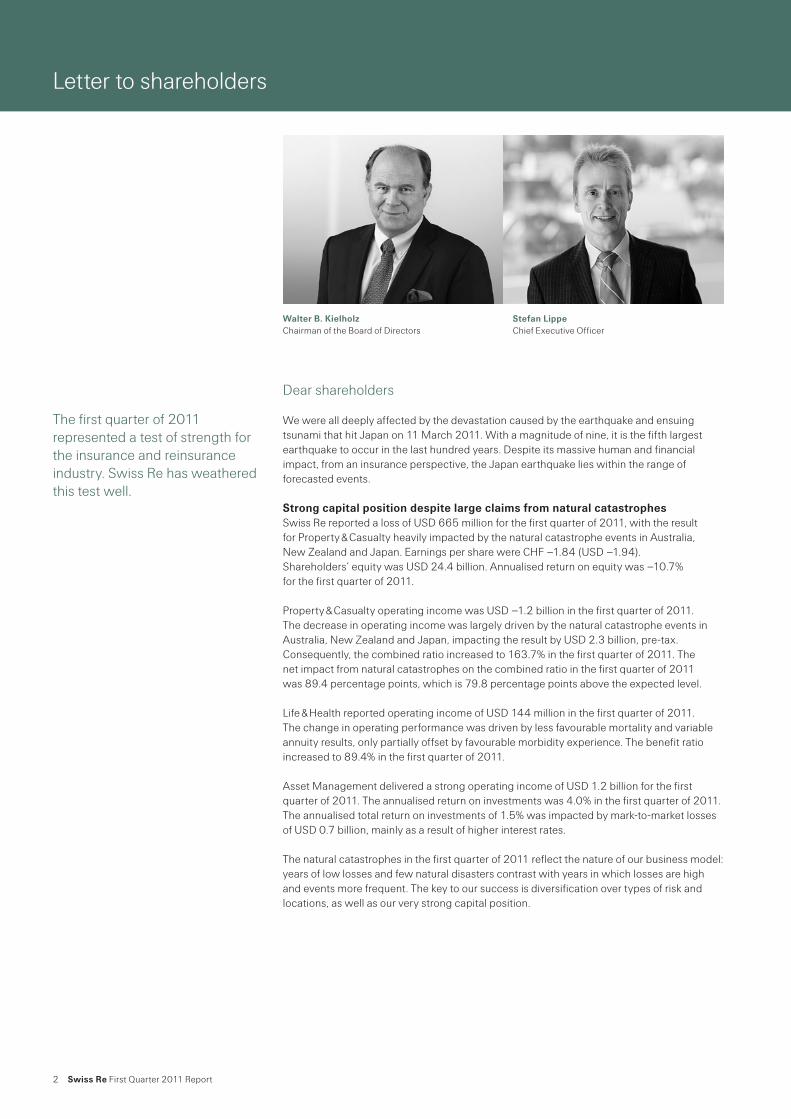
Walter B. Kielholz Chairman of the Board of Directors
Stefan Lippe Chief Executive Officer
Dear shareholders
We were all deeply affected by the devastation caused by the earthquake and ensuing tsunami that hit Japan on 11 March 2011. With a magnitude of nine, it is the fifth largest earthquake to occur in the last hundred years. Despite its massive human and financial impact, from an insurance perspective, the Japan earthquake lies within the range of forecasted events.
Strong capital position despite large claims from natural catastrophes Swiss Re reported a loss of USD 665 million for the first quarter of 2011, with the result for Property & Casualty heavily impacted by the natural catastrophe events in Australia, New Zealand and Japan. Earnings per share were CHF –1.84 (USD –1.94). Shareholders’ equity was USD 24.4 billion. Annualised return on equity was –10.7% for the first quarter of 2011.
Property & Casualty operating income was USD –1.2 billion in the first quarter of 2011. The decrease in operating income was largely driven by the natural catastrophe events in Australia, New Zealand and Japan, impacting the result by USD 2.3 billion, pre-tax. Consequently, the combined ratio increased to 163.7% in the first quarter of 2011. The net impact from natural catastrophes on the combined ratio in the first quarter of 2011 was 89.4 percentage points, which is 79.8 percentage points above the expected level.
Life & Health reported operating income of USD 144 million in the first quarter of 2011. The change in operating performance was driven by less favourable mortality and variable annuity results, only partially offset by favourable morbidity experience. The benefit ratio increased to 89.4% in the first quarter of 2011.
Asset Management delivered a strong operating income of USD 1.2 billion for the first quarter of 2011. The annualised return on investments was 4.0% in the first quarter of 2011. The annualised total return on investments of 1.5% was impacted by mark-to-market losses of USD 0.7 billion, mainly as a result of higher interest rates.
The natural catastrophes in the first quarter of 2011 reflect the nature of our business model: years of low losses and few natural disasters contrast with years in which losses are high and events more frequent. The key to our success is diversification over types of risk and locations, as well as our very strong capital position.
The first quarter of 2011 represented a test of strength for the insurance and reinsurance industry. Swiss Re has weathered this test well.
Swiss Re First Quarter 2011 Report 3
Letter to shareholders
Successful 2011 April renewals, P&C outlook improvedAfter very successful 2011 January renewals, Swiss Re renewed approximately 10% of its Property & Casualty treaty book in April (approximately 64% is renewed in January and 26% in the remainder of the year). April is the main renewal period in Japan, Korea and India, and represents a smaller share of renewals in Europe, the Americas and elsewhere in Asia.
Swiss Re continued its focused and disciplined underwriting approach. The following price changes were observed: ̤ Strong price increases in Japan (typically in the 20-50% range for earthquake-exposed
non-proportional catastrophe cover); ̤ A flattening of price moves elsewhere, including small increases in the Americas and
decreases in Europe, reversing the broad trend of falling price adequacy that was seen in January.
Swiss Re’s Property & Casualty treaty business premiums written grew 5% in the April renewals. Including both the January and April renewals, Property & Casualty treaty 2011 premiums written are estimated to have increased 13%, compared to 2010.
Historically, large catastrophe events have been followed by market hardening, such as following storms Lothar and Martin in 1999, the attack on the World Trade Centre in 2001, and hurricanes Katrina, Rita and Wilma in 2005. Swiss Re believes the combination of the recent natural catastrophe events, very low interest rates, and years of price cutting are likely to bring forward the turn in the cycle.
Well on track towards the creation of a new holding companySwiss Re is well on track with the transition to the new holding company, Swiss Re Ltd. You, our shareholders, have been invited to exchange your shares in Swiss Re for new shares in the holding company, on a one-for-one basis and subject to applicable securities laws. The initial offer period started on 15 April 2011 and will end on 17 May 2011. If, by 18 May 2011, the exchange offer is declared unconditional by the Board of Directors, Swiss Re Ltd shares will be traded for the first time on 23 May 2011.
New member of and re-elections to the Board of DirectorsWe are pleased that you, our shareholders, approved the appointment of Renato Fassbind as a new member of the Board of Directors at the recent 147th Annual General Meeting. Having served as Chief Financial Officer for major international companies such as Credit Suisse Group and ABB Ltd, Renato Fassbind will reinforce and broaden the Board’s accounting and finance expertise. At the same time, you re-elected Raymund Breu, Mathis Cabiallavetta, Raymond K. F. Ch’ien, Rajna Gibson Brandon and Hans Ulrich Maerki to the Board.

4 Swiss Re First Quarter 2011 Report
Letter to shareholders
Swiss Re is well positioned to take advantage of market opportunitiesThe first quarter of 2011 represented a test of strength for the insurance and reinsurance industry. The accumulation of natural catastrophe events – floods in Australia and earthquakes in New Zealand and Japan – is expected to turn 2011 into a year with one of the highest historical natural catastrophe claims burdens. Swiss Re has weathered this test well thanks to: ̤ Our exceptional capital strength: Swiss Re is in a strong position to underwrite large and
complex risks; ̤ Our global diversification over types of risk and regions: a key factor in our resilience; and ̤ Our outstanding re/insurance expertise and innovation power: core to our ability to help
clients and societies deal with such challenges. We remain committed to our five-year targets and are confident that we can deliver. The impact of natural catastrophe losses in the first quarter creates an additional challenge but it will also accelerate the market turn we had previously expected in 2012 / 2013.
Zurich, 5 May 2011
Walter B. Kielholz Stefan LippeChairman of the Chief Executive Officer Board of Directors
Swiss Re First Quarter 2011 Report 5
Key events
17 February 2011Swiss Re announces full-year net income of USD 863 million Strong net income of USD 863 million for 2010 and return on equity of 3.6%. Swiss Re plans to establish a new corporate structure under a newly-formed holding company, increasing its client focus, improving the transparency and accountability of its businesses, and creating greater flexibility.
2 March 2011Provisional estimate of Swiss Re’s claims cost from earthquake in New ZealandSwiss Re announced that it provisionally estimates its claims cost from the earthquake in Christchurch, New Zealand on 22 February 2011 to be approximately USD 800 million, net of retrocession and before tax. Total insured claims for the insurance sector are estimated to be between USD 6 billion and USD 12 billion.
21 March 2011Swiss Re provides estimate of its claims costs from Japan earthquake and tsunamiEstimated claims costs of USD 1.2 billion, net of retrocession and before tax, are subject to a high degree of uncertainty, making loss assessment particularly challenging.
24 March 2011Proposals for shareholder approval for Annual General Meeting announced; 2010 EVM profit of USD 1.3 billionApproval sought at AGM for dividend of CHF 2.75 per share and election of Renato Fassbind to the Board of Directors. EVM profit in 2010 was USD 1.3 billion, reflecting strong underwriting performance in Property & Casualty and positive contributions from Life & Health and Asset Management.
7 April 2011Swiss Re and the IFC complete capitalisation of UBF SegurosIn the first quarter of 2011, Swiss Re completed the acquisition of UBF Seguros, S.A. (UBF Seguros), a Brazilian commercial insurer. On 7 April 2011, Swiss Re announced completion of its capitalisation of UBF Seguros. In this capitalisation transaction, the International Finance Corporation (IFC), a member of the World Bank Group, acquired a minority stake in UBF Seguros.
15 April 2011Shareholders approve all proposed resolutions put forward by the Board of Directors at the 147th Annual General MeetingShareholders approved all proposed resolutions put forward by the Board with a strong majority.
6 Swiss Re First Quarter 2011 Report
Group
Group results
Swiss Re reported a net loss attributable to common shareholders of USD 665 million in the first quarter of 2011, compared to net income of USD 158 million in the first quarter of 2010. Earnings per share were CHF –1.84 (USD –1.94), compared to CHF 0.49 (USD 0.46) in the same period of the previous year.
During the quarter, the US dollar appreciated 2% against the British pound and depreciated 2% against the euro, compared to average rates in the first quarter of 2010.
Premiums earned decreased 8% to USD 2.6 billion for Property & Casualty, compared to the prior-year period. The reduction mainly reflects lower premium earnings from prior underwriting years, driven by the Group’s active cycle management and selective underwriting, partly offset by the successful January 2011 renewals. Life & Health premiums and fees increased 5%, largely due to growth in the Asian health business.
The Group’s investment income and net realised gains include the investment result from assets backing unit-linked and unitised with-profit policies. These returns are credited to policyholders’ accounts and are therefore excluded from the following comments on the investment performance of the Group.
Proprietary net investment income was USD 1.2 billion, a 10% decrease compared to the prior-year period, primarily driven by the effects of de-risking the securitised portfolio in 2010. The fixed income running yield was 4.0%.
The Group reported proprietary net realised investment gains of USD 0.2 billion in the first quarter of 2011, compared to a small gain of USD 22 million in the same period of the prior year, mainly due to sales of securitised bonds.
Other revenues were USD 11 million in the first quarter of 2011, compared to USD 18 million in the first quarter of 2010.
Property & Casualty claims and claim adjustment expenses increased 50% to USD 3.5 billion, reflecting the natural catastrophe events in Australia, New Zealand and Japan. As a result, the combined ratio increased to 163.7% in the first quarter of 2011 from 109.4% in the comparative period of the previous year.
Life & Health benefits remained stable at USD 2.0 billion compared to the prior-year quarter. At constant foreign exchange rates, Life & Health benefits increased 2%, reflecting less favourable mortality experience in the first quarter of 2011. The Admin Re® benefit expense declined, reflecting the impact of financial markets on with-profits products. The benefit ratio increased to 89.4% in the first quarter of 2011, compared to 89.1% in the same period of 2010.
Return credited to policyholders reflects the investment performance on the underlying assets, mainly backing unit-linked and unitised with-profit policies, which is passed through to policyholders. In the first quarter of 2011, an investment gain of USD 0.4 billion was passed through to policyholders compared to a gain of USD 1.6 billion in the prior-year period.
Acquisition costs decreased 1% to USD 0.9 billion, driven by Property & Casualty.
Administrative expenses increased 3% to USD 521 million, reflecting higher social security expenses and various growth initiatives. Other expenses decreased 13% to USD 54 million.
Swiss Re reported a loss of USD 665 million for the first quarter of 2011. The result for Property & Casualty was largely impacted by the natural catastrophe events in Australia, New Zealand and Japan. The Life & Health result was USD 144 million. Asset Management delivered a strong performance with a return on investments of 4.0%. Shareholders’ equity, excluding non-controlling interests, was USD 24.4 billion.
Group
Swiss Re First Quarter 2011 Report 7
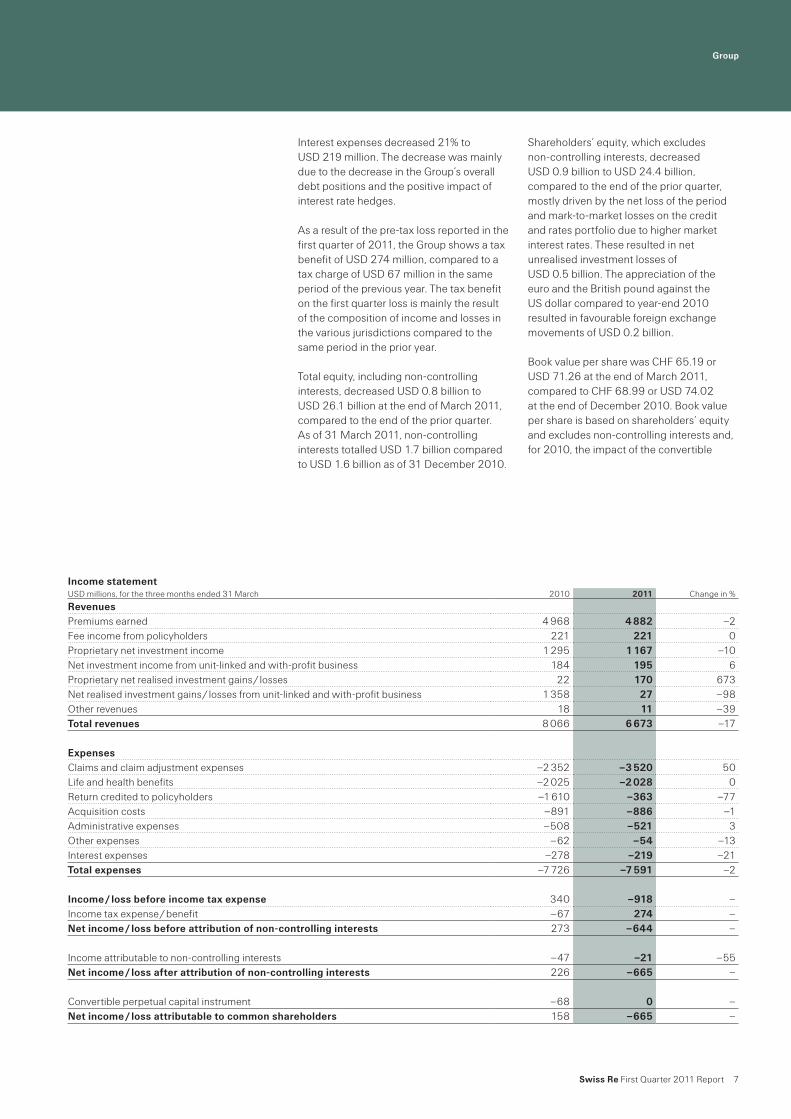
Interest expenses decreased 21% to USD 219 million. The decrease was mainly due to the decrease in the Group’s overall debt positions and the positive impact of interest rate hedges.
As a result of the pre-tax loss reported in the first quarter of 2011, the Group shows a tax benefit of USD 274 million, compared to a tax charge of USD 67 million in the same period of the previous year. The tax benefit on the first quarter loss is mainly the result of the composition of income and losses in the various jurisdictions compared to the same period in the prior year.
Total equity, including non-controlling interests, decreased USD 0.8 billion to USD 26.1 billion at the end of March 2011, compared to the end of the prior quarter. As of 31 March 2011, non-controlling interests totalled USD 1.7 billion compared to USD 1.6 billion as of 31 December 2010.
Shareholders’ equity, which excludes non-controlling interests, decreased USD 0.9 billion to USD 24.4 billion, compared to the end of the prior quarter, mostly driven by the net loss of the period and mark-to-market losses on the credit and rates portfolio due to higher market interest rates. These resulted in net unrealised investment losses of USD 0.5 billion. The appreciation of the euro and the British pound against the US dollar compared to year-end 2010 resulted in favourable foreign exchange movements of USD 0.2 billion.
Book value per share was CHF 65.19 or USD 71.26 at the end of March 2011, compared to CHF 68.99 or USD 74.02 at the end of December 2010. Book value per share is based on shareholders’ equity and excludes non-controlling interests and, for 2010, the impact of the convertible
Income statementUSD millions, for the three months ended 31 March 2010 2011 Change in %
RevenuesPremiums earned 4 968 4 882 –2Fee income from policyholders 221 221 0Proprietary net investment income 1 295 1 167 –10Net investment income from unit-linked and with-profit business 184 195 6Proprietary net realised investment gains / losses 22 170 673Net realised investment gains / losses from unit-linked and with-profit business 1 358 27 –98Other revenues 18 11 –39Total revenues 8 066 6 673 –17
ExpensesClaims and claim adjustment expenses –2 352 –3 520 50Life and health benefits –2 025 –2 028 0Return credited to policyholders –1 610 –363 –77Acquisition costs –891 –886 –1Administrative expenses –508 –521 3Other expenses –62 –54 –13Interest expenses –278 –219 –21Total expenses –7 726 –7 591 –2
Income / loss before income tax expense 340 –918 –Income tax expense / benefit –67 274 –Net income / loss before attribution of non-controlling interests 273 –644 –
Income attributable to non-controlling interests –47 –21 –55Net income / loss after attribution of non-controlling interests 226 –665 –
Convertible perpetual capital instrument –68 0 –Net income / loss attributable to common shareholders 158 –665 –
Group
8 Swiss Re First Quarter 2011 Report
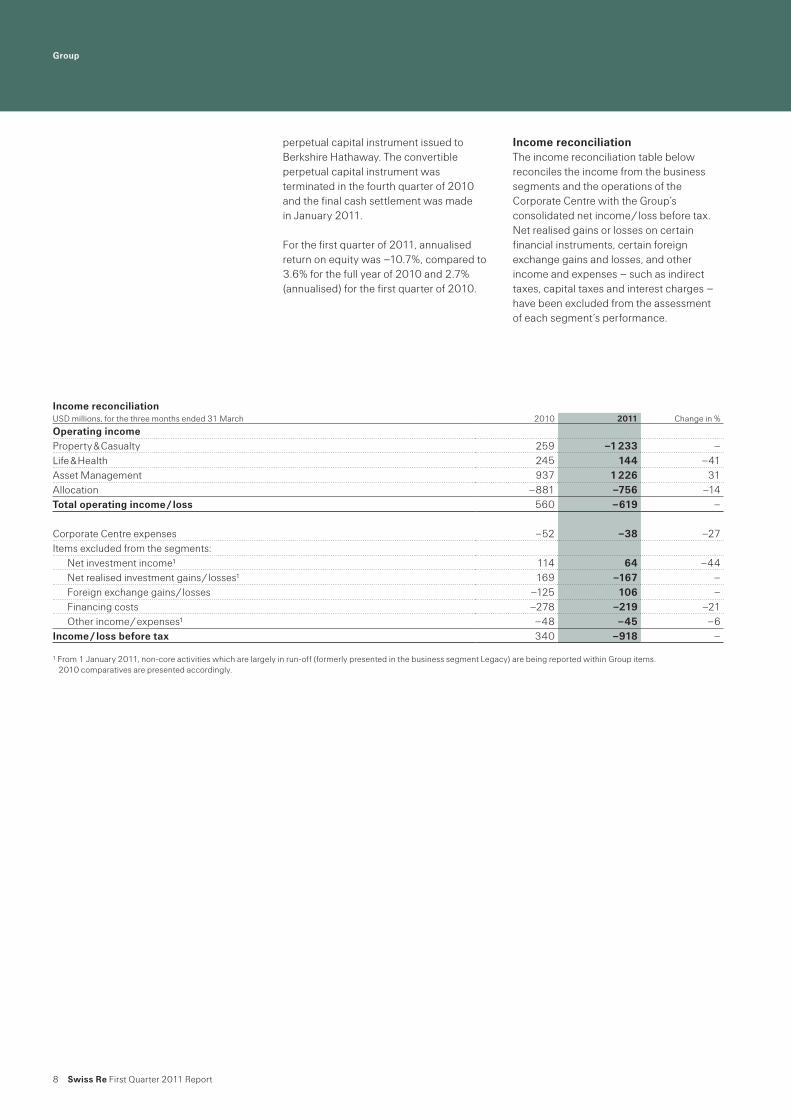
Income reconciliationUSD millions, for the three months ended 31 March 2010 2011 Change in %
Operating incomeProperty & Casualty 259 –1 233 –Life & Health 245 144 –41Asset Management 937 1 226 31Allocation –881 –756 –14Total operating income / loss 560 –619 –
Corporate Centre expenses –52 –38 –27Items excluded from the segments:
Net investment income1 114 64 –44Net realised investment gains / losses1 169 –167 –Foreign exchange gains / losses –125 106 –Financing costs –278 –219 –21Other income / expenses1 –48 –45 –6
Income / loss before tax 340 –918 –
1 From 1 January 2011, non-core activities which are largely in run-off (formerly presented in the business segment Legacy) are being reported within Group items. 2010 comparatives are presented accordingly.
perpetual capital instrument issued to Berkshire Hathaway. The convertible perpetual capital instrument was terminated in the fourth quarter of 2010 and the final cash settlement was made in January 2011.
For the first quarter of 2011, annualised return on equity was –10.7%, compared to 3.6% for the full year of 2010 and 2.7% (annualised) for the first quarter of 2010.
Income reconciliationThe income reconciliation table below reconciles the income from the business segments and the operations of the Corporate Centre with the Group’s consolidated net income / loss before tax. Net realised gains or losses on certain financial instruments, certain foreign exchange gains and losses, and other income and expenses – such as indirect taxes, capital taxes and interest charges – have been excluded from the assessment of each segment’s performance.

Group
Swiss Re First Quarter 2011 Report 9
Property & Casualty
Property & Casualty operating income decreased USD 1.5 billion to a loss of USD 1.2 billion in the first quarter of 2011, compared to a gain of USD 0.3 billion in the first quarter of 2010.
The decrease in operating income was largely driven by the natural catastrophe events that occurred during the first quarter of 2011, impacting the result by USD 2.3 billion, pre-tax. The impact included USD 100 million from cyclone Yasi and USD 225 million from floods in Australia, USD 800 million from the earthquake in Christchurch, New Zealand, and USD 1.2 billion from the earthquake and tsunami in Japan. This was partially offset by favourable developments in the technical result in prior accident years of approximately USD 160 million.
Compared to the prior-year period, investment income declined USD 112 million in the first quarter of 2011, due to the low interest rate environment and a reduction in the level of reserves.
Net premiums earned decreased 7.8% to USD 2.6 billion in the first quarter of 2011, compared to USD 2.9 billion in the same period of 2010. At constant foreign exchange rates, net premiums earned decreased 8.5% quarter on quarter. The growth of premiums earned from the successful January 2011 renewals was offset by lower premium earnings from prior underwriting years, mainly as a result of Swiss Re’s active cycle management and disciplined underwriting.
The combined ratio increased to 163.7% in the first quarter of 2011 from 109.4% in the same period in 2010. Excluding the unwind of discount, the combined ratio was 162.2% in the first quarter of 2011. The increase in the combined ratio was mainly due to the higher natural catastrophe experience in the reporting period, partly compensated by favourable net claims experience from prior accident years.
The net impact from natural catastrophes on the combined ratio in the first quarter of 2011 was 89.4 percentage points, which is 79.8 percentage points above the expected level.
The property combined ratio deteriorated 136.9 percentage points to 259.3% in the first quarter of 2011, reflecting the higher natural catastrophe experience in the first quarter of 2011.
Favourable net claims experience in prior accident years improved the casualty combined ratio to 91.5% in the first quarter of 2011, compared to 113.3% in the first quarter of 2010.
The specialty combined ratio increased to 97.4% in the first quarter of 2011, compared to 88.5% in the same period of 2010, mainly due to the higher impact from natural catastrophes.
The credit combined ratio was 30.6% in the first quarter of 2011, compared to 74.4% in the first quarter of 2010. This improvement was largely driven by better than expected claims experience, as well as by improved technical margins following the restructuring of the portfolio during 2010.
The expense ratio increased to 10.8% in the first quarter of 2011, compared to 9.4% in the same period of 2010. The increase was mainly due to lower premiums earned year on year, as well as the investment in developing new business opportunities.

10 Swiss Re First Quarter 2011 Report
Group
Life & Health
Life & Health reported operating income of USD 144 million in the first quarter of 2011, compared to USD 245 million in the prior-year period. The change in operating performance was driven by less favourable mortality and variable annuity results, partially offset by favourable morbidity experience.
Premiums and fee income increased to USD 2.5 billion in the first quarter of 2011 from USD 2.3 billion in the same quarter of 2010. The increase was largely due to the health business, driven by growth in Asia. At constant foreign exchange rates, premiums and fee income rose 2.8%.
The benefit ratio increased to 89.4% in the first quarter of 2011, compared to 89.1% in the same quarter of 2010. The benefit ratio now excludes variable annuities and guaranteed minimum death benefit (GMDB). Mortality, which was slightly lower than expectations in the first quarter of 2011, was much lower than the very positive experience in the same quarter of 2010.
The management expense ratio was stable at 6.2% in the first quarter of 2011, compared to 6.4% in the prior-year period.
The traditional life business reported operating income of USD 68 million in the first quarter of 2011. Mortality results were lower than expectations, and were significantly lower than the favourable experience reported in the prior-year period. Slightly adverse variable annuity and pre-2000 GMDB results were offset by gains from the B36 embedded derivatives during the reporting period.
The health business operating income was USD 100 million in the first quarter of 2011, compared to USD 48 million in the same quarter of 2010. Morbidity results exceeded expectations, primarily in Europe, compared to unfavourable morbidity experience in the prior-year period.
Admin Re® reported an operating loss of USD 24 million in the first quarter of 2011. This was primarily driven by higher amortisation of the present value of future profits (PVFP) due to a declining interest rate environment in the US together with a decrease in equity market returns compared to the same period in 2010, which has driven higher amortisation of acquisition costs for the quarter.
Group
Swiss Re First Quarter 2011 Report 11
Asset Management
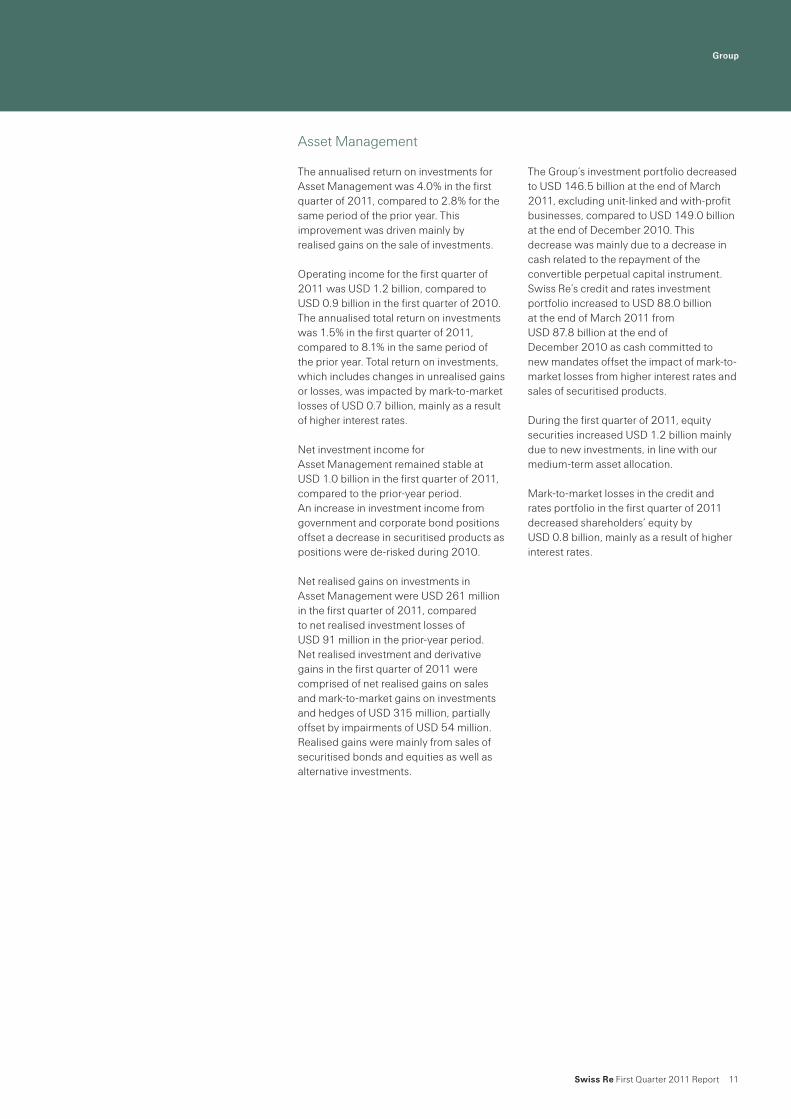
The annualised return on investments for Asset Management was 4.0% in the first quarter of 2011, compared to 2.8% for the same period of the prior year. This improvement was driven mainly by realised gains on the sale of investments.
Operating income for the first quarter of 2011 was USD 1.2 billion, compared to USD 0.9 billion in the first quarter of 2010. The annualised total return on investments was 1.5% in the first quarter of 2011, compared to 8.1% in the same period of the prior year. Total return on investments, which includes changes in unrealised gains or losses, was impacted by mark-to-market losses of USD 0.7 billion, mainly as a result of higher interest rates.
Net investment income for Asset Management remained stable at USD 1.0 billion in the first quarter of 2011, compared to the prior-year period. An increase in investment income from government and corporate bond positions offset a decrease in securitised products as positions were de-risked during 2010.
Net realised gains on investments in Asset Management were USD 261 million in the first quarter of 2011, compared to net realised investment losses of USD 91 million in the prior-year period. Net realised investment and derivative gains in the first quarter of 2011 were comprised of net realised gains on sales and mark-to-market gains on investments and hedges of USD 315 million, partially offset by impairments of USD 54 million. Realised gains were mainly from sales of securitised bonds and equities as well as alternative investments.
The Group’s investment portfolio decreased to USD 146.5 billion at the end of March 2011, excluding unit-linked and with-profit businesses, compared to USD 149.0 billion at the end of December 2010. This decrease was mainly due to a decrease in cash related to the repayment of the convertible perpetual capital instrument. Swiss Re’s credit and rates investment portfolio increased to USD 88.0 billion at the end of March 2011 from USD 87.8 billion at the end of December 2010 as cash committed to new mandates offset the impact of mark-to-market losses from higher interest rates and sales of securitised products.
During the first quarter of 2011, equity securities increased USD 1.2 billion mainly due to new investments, in line with our medium-term asset allocation.
Mark-to-market losses in the credit and rates portfolio in the first quarter of 2011 decreased shareholders’ equity by USD 0.8 billion, mainly as a result of higher interest rates.

Group
12 Swiss Re First Quarter 2011 Report
Outlook
The accumulation of natural catastrophe events – floods in Australia and earthquakes in New Zealand and Japan – is expected to turn 2011 into a year with one of the highest historical natural catastrophe claims burdens. For the first quarter of 2011, Swiss Re weathered this test of strength well thanks to the following factors: ̤ Swiss Re’s exceptional capital strength:
Swiss Re is in a strong position to underwrite large and complex risks;
̤ Swiss Re’s global diversification over types of risk and regions: a key factor in the company’s resilience; and
̤ Swiss Re’s outstanding re/insurance expertise and innovation power: core to the company’s ability to help clients and societies deal with such challenges.
We remain committed to our five-year targets and are confident that we can deliver. The impact of natural catastrophe losses in the first quarter creates an additional challenge but it will also accelerate the market turn that we had previously expected in 2012 / 2013.

Swiss Re First Quarter 2011 Report 13
For the three months ended 31 March
The accompanying notes are an integral part of the Group financial statements.
Income statement (unaudited)
USD millions Note 2010 2011
RevenuesPremiums earned 7, 10 4 968 4 882Fee income from policyholders 7, 10 221 221Net investment income 2, 10 1 479 1 362Net realised investment gains / losses (total impairments were 263 in 2010 and 144 in 2011, of which 126 and 103, respectively, were recognised in earnings) 2, 10 1 380 197Other revenues 10 18 11Total revenues 8 066 6 673
ExpensesClaims and claim adjustment expenses 7, 10 –2 352 –3 520Life and health benefits 7, 10 –2 025 –2 028Return credited to policyholders 10 –1 610 –363Acquisition costs 7, 10 –891 –886Other expenses 10 –570 –575Interest expenses 10 –278 –219Total expenses –7 726 –7 591
Income / loss before income tax expense 340 –918Income tax expense / benefit –67 274Net income / loss before attribution of non-controlling interests 273 –644
Income attributable to non-controlling interests –47 –21Net income / loss after attribution of non-controlling interests 226 –665
Convertible perpetual capital instrument –68 0Net income / loss attributable to common shareholders 158 –665
Earnings per share in USDBasic 8 0.46 –1.94Diluted 8 0.45 –1.94Earnings per share in CHF1Basic 8 0.49 –1.84Diluted 8 0.48 –1.84
1 The translation from USD to CHF is shown for informational purposes only and has been calculated at the Group’s average exchange rates for the three months ended 31 March 2010 and 2011, respectively.

14 Swiss Re First Quarter 2011 Report
Assets
The accompanying notes are an integral part of the Group financial statements.
USD millions Note 31.12.2010 31.03.2011
Investments 2, 3, 4Fixed income securities:
Available-for-sale, at fair value (including 5 157 in 2010 and 4 709 in 2011 subject to securities lending and repurchase agreements) (amortised cost: 2010: 79 443; 2011: 79 741) 80 950 80 475Trading (including 2 187 in 2010 and 3 436 in 2011 subject to securities lending and repurchase agreements) 11 252 11 982
Equity securities: Available-for-sale, at fair value (cost: 2010: 1 241; 2011: 2 321) 1 474 2 620Trading 19 513 19 619
Policy loans, mortgages and other loans 5 630 5 693Investment real estate 2 040 2 065Short-term investments, at amortised cost which approximates fair value (including 1 319 in 2010 and 596 in 2011 subject to securities lending and repurchase agreements) 21 446 16 734Other invested assets 14 642 14 965Total investments 156 947 154 153
Cash and cash equivalents (including 4 139 in 2010 and 1 806 in 2011 subject to securities lending) 16 928 17 796Accrued investment income 1 085 1 191Premiums and other receivables 11 095 13 651Reinsurance recoverable on unpaid claims and policy benefits 7 12 637 13 541Funds held by ceding companies 9 346 10 104Deferred acquisition costs 5, 7 3 571 3 882Acquired present value of future profits 5 4 565 4 521Goodwill 4 083 4 153Income taxes recoverable 426 467Other assets 7 720 8 331
Total assets 228 403 231 790
Balance sheet (unaudited)
Balance sheet (unaudited)
Swiss Re First Quarter 2011 Report 15
Liabilities and equity
The accompanying notes are an integral part of the Group financial statements.
USD millions Note 31.12.2010 31.03.2011
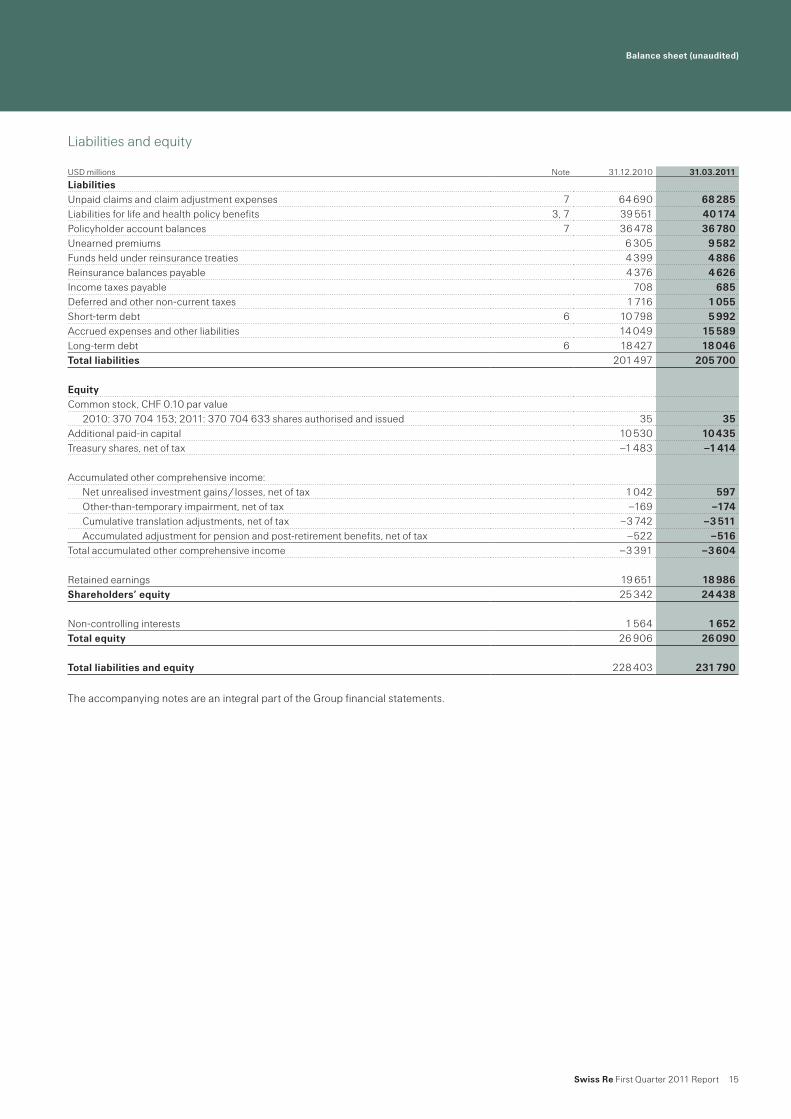
LiabilitiesUnpaid claims and claim adjustment expenses 7 64 690 68 285Liabilities for life and health policy benefits 3, 7 39 551 40 174Policyholder account balances 7 36 478 36 780Unearned premiums 6 305 9 582Funds held under reinsurance treaties 4 399 4 886Reinsurance balances payable 4 376 4 626Income taxes payable 708 685Deferred and other non-current taxes 1 716 1 055Short-term debt 6 10 798 5 992Accrued expenses and other liabilities 14 049 15 589Long-term debt 6 18 427 18 046Total liabilities 201 497 205 700
EquityCommon stock, CHF 0.10 par value
2010: 370 704 153; 2011: 370 704 633 shares authorised and issued 35 35Additional paid-in capital 10 530 10 435Treasury shares, net of tax –1 483 –1 414
Accumulated other comprehensive income:Net unrealised investment gains / losses, net of tax 1 042 597Other-than-temporary impairment, net of tax –169 –174Cumulative translation adjustments, net of tax –3 742 –3 511Accumulated adjustment for pension and post-retirement benefits, net of tax –522 –516
Total accumulated other comprehensive income –3 391 –3 604
Retained earnings 19 651 18 986Shareholders’ equity 25 342 24 438
Non-controlling interests 1 564 1 652Total equity 26 906 26 090
Total liabilities and equity 228 403 231 790

16 Swiss Re First Quarter 2011 Report
For the twelve months ended 31 December 2010 and the three months ended 31 March 2011
The accompanying notes are an integral part of the Group financial statements.
Statement of equity (unaudited)
USD millions 2010 2011
Convertible perpetual capital instrumentBalance as of 1 January 2 670 0Reclassification of convertible perpetual capital instrument1 –2 670Balance as of period end 0 0
Common sharesBalance as of 1 January 35 35Issue of common sharesBalance as of period end 35 35
Additional paid-in capitalBalance as of 1 January 10 472 10 530Share-based compensation 48 –90Realised gains / losses on treasury shares 10 –5Balance as of period end 10 530 10 435
Treasury shares, net of taxBalance as of 1 January –1 477 –1 483Purchase of treasury shares –49 –10Issuance of treasury shares, including share-based compensation to employees 43 79Balance as of period end –1 483 –1 414
Net unrealised gains / losses, net of taxBalance as of 1 January –993 1 042Other changes during the period 2 070 –445Cumulative effect of adoption of ASU No. 2009-172 –35Balance as of period end 1 042 597
Other-than-temporary impairment, net of taxBalance as of 1 January –397 –169Other changes during the period 228 –5Balance as of period end –169 –174
Foreign currency translation, net of taxBalance as of 1 January –3 560 –3 742Other changes during the period –182 231Balance as of period end –3 742 –3 511
Adjustment for pension and other post-retirement benefits, net of taxBalance as of 1 January –453 –522Change during the period –69 6Balance as of period end –522 –516
Retained earningsBalance as of 1 January 19 047 19 651Net income / loss after non-controlling interests 1 980 –665Convertible perpetual capital instrument (net income)1 –1 117Dividends on common shares –319Cumulative effect of adoption of ASU No. 2009-172 60Balance as of period end 19 651 18 986
Shareholders’ equity 25 342 24 438Non-controlling interests
Balance as of 1 January 0 1 564Change during the period 1 410 67Income attributable to non-controlling interests 154 21Balance as of period end 1 564 1 652
Total equity 26 906 26 090
1 The CPCI was reclassified from equity to short-term debt upon termination on 4 November 2010. The final cash settlement was made in January 2011.2 The Group adopted a new accounting pronouncement, ASU No. 2009-17 (FAS167), an update to Topic 810 – Consolidation, as of 1 January 2010, which resulted in the full
consolidation of certain VIEs. This resulted in a transition impact to retained earnings of USD 60 million and to net unrealised gains / losses of USD –35 million.
Swiss Re First Quarter 2011 Report 17
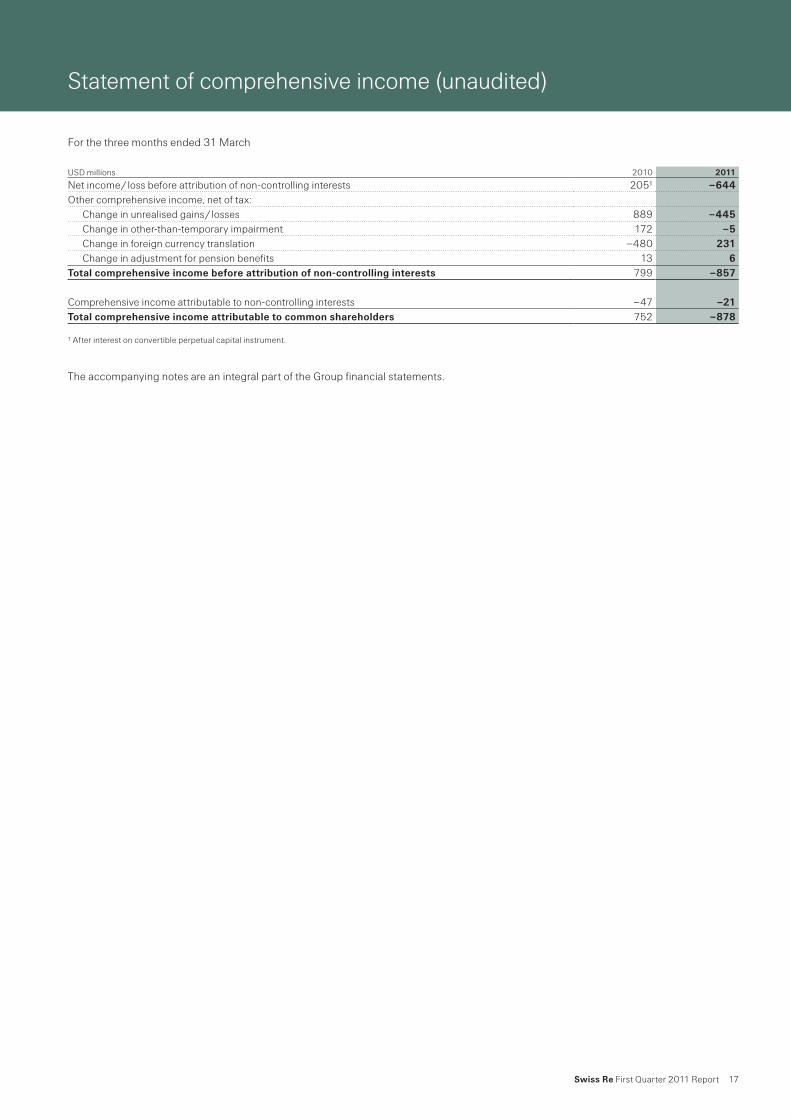
Statement of comprehensive income (unaudited)
For the three months ended 31 March
The accompanying notes are an integral part of the Group financial statements.
USD millions 2010 2011
Net income / loss before attribution of non-controlling interests 2051 –644Other comprehensive income, net of tax:
Change in unrealised gains / losses 889 –445Change in other-than-temporary impairment 172 –5Change in foreign currency translation –480 231Change in adjustment for pension benefits 13 6
Total comprehensive income before attribution of non-controlling interests 799 –857
Comprehensive income attributable to non-controlling interests –47 –21Total comprehensive income attributable to common shareholders 752 –878
1 After interest on convertible perpetual capital instrument.

18 Swiss Re First Quarter 2011 Report
Statement of cash flow (unaudited)
For three months ended 31 March
Interest paid was USD 123 million and USD 436 million for the three months ended 31 March 2010 and 2011, respectively. Tax paid was USD 67 million and USD 211 million for the three months ended 31 March 2010 and 2011, respectively.
The accompanying notes are an integral part of the Group financial statements.
USD millions 2010 2011
Cash flows from operating activitiesNet income / loss attributable to common shareholders 158 –665Add net income attributable to non-controlling interests 47 21
Adjustments to reconcile net income to net cash provided / used by operating activities:Depreciation, amortisation and other non-cash items1 671 603Net realised investment gains / losses –1 380 –197Change in:
Technical provisions, net1 3 855 4 003Funds held by ceding companies and other reinsurance balances –1 718 –2 012Reinsurance recoverable on unpaid claims and policy benefits –1 918 –706Other assets and liabilities, net –1 945 706Income taxes payable / recoverable –8 –574Income from equity-accounted investees, net of dividends received –97 –59Trading positions, net –31 2 152Securities purchased / sold under agreement to resell / repurchase, net –337 –1 737
Net cash provided / used by operating activities –2 703 1 535
Cash flows from investing activitiesFixed income securities:
Sales and maturities 39 306 28 343Purchases –28 266 –28 132Net purchase / sale / maturities of short-term investments –6 611 5 362
Equity securities:Sales 7 237Purchases –1 271
Cash paid / received for acquisitions / disposal of reinsurance transactions, net –62Net purchases / sales / maturities of other investments 352 8Net cash provided / used by investing activities 4 788 4 541
Cash flows from financing activitiesIssuance / repayment of long-term debt –10 –353Issuance / repayment of short-term debt
Issuance 743Repayment –1 192 –5 202
Purchase / sale of treasury shares –4 69Net cash provided / used by financing activities –463 –5 486
Total net cash provided / used 1 622 590Effect of foreign currency translation –423 278Change in cash and cash equivalents 1 199 868Cash and cash equivalents as of 1 January 27 810 16 928Impact of adoption of ASU No. 2009-173 793Cash and cash equivalents as of 31 March 29 802 17 796
1 From 1 January 2011, the Group presents the amortisation of deferred acquisition cost in “Depreciation, amortisation and other non-cash items”. Comparatives for 2010 are presented accordingly.
2 Cash used for acquisition of UBF Seguros. 3 As of 1 January 2010, the Group adopted ASU No. 2009-17 (FAS167), an update to Topic 810 – Consolidation, which resulted in the full consolidation of certain VIEs.
Swiss Re First Quarter 2011 Report 19
Notes to the Group financial statements (unaudited)
1 Organisation and summary of significant accounting policies
Nature of operationsThe Swiss Re Group, which is headquartered in Zurich, Switzerland, comprises Swiss Reinsurance Company Ltd (the parent company, referred to as “Swiss Re Zurich”) and its subsidiaries (collectively, the “Swiss Re Group” or the “Group”). The Group provides reinsurance and other related products and services to insurance companies, direct clients and others worldwide through reinsurance brokers and a network of offices in over 20 countries.
Basis of presentationThe accompanying consolidated financial statements have been prepared in accordance with accounting principles generally accepted in the United States of America (US GAAP) and comply with Swiss law. All significant inter-company transactions and balances have been eliminated on consolidation. The year-end balance sheet data was derived from audited financial statements, but does not include all disclosures required by US GAAP. Therefore these interim financial statements should be read in conjunction with the Swiss Re Group’s audited financial statements for the year ended 31 December 2010.
Use of estimates in the preparation of financial statementsThe preparation of financial statements requires management to make significant estimates and assumptions that affect the reported amounts of assets, liabilities, revenues and expenses as well as the related disclosure including contingent assets and liabilities. The Swiss Re Group’s liabilities for unpaid claims and claim adjustment expenses and policy benefits for life and health include estimates for premium, claim and benefit data not received from ceding companies at the date of the financial statements. In addition, the Group uses certain financial instruments and invests in securities of certain entities for which exchange trading does not exist. The Group determines these estimates based on historical information, actuarial analyses, financial modelling, and other analytical techniques. Actual results could differ significantly from the estimates described above.
Valuation of financial assetsThe fair value of the majority of the Group’s financial instruments is based on quoted prices in active markets or observable inputs. These instruments include government and agency securities, commercial paper, most investment-grade corporate debt, most high-yield debt securities, exchange traded derivative instruments, most mortgage-backed and asset-backed securities and listed equity securities. In markets with reduced or no liquidity, spreads between bid and offer prices are normally wider compared to spreads in highly liquid markets. Such market conditions affect the valuation of certain asset classes of the Group, such as some asset-backed securities as well as certain derivative structures referencing such asset classes.
The Group considers both the credit risk of its counterparties, and own risk of non-performance in the valuation of derivative instruments and other over-the-counter financial assets. In determining the fair value of these financial instruments, the assessment of the Group’s exposure to the credit risk of its counterparties incorporates consideration of existing collateral and netting arrangements entered into with each counterparty. The measure of the counterparty credit risk is estimated with incorporation of the observable credit spreads, where available, or credit spread estimates derived based on the benchmarking techniques where market data is not available. The impact of the Group’s own risk of non-performance is analysed in the manner consistent with the aforementioned approach; with consideration of the Group’s observable credit spreads. The value representing such risk is incorporated into the fair value of the financial instruments (primarily derivatives), in a liability position as of the measurement date. The change in this adjustment from period to period is reflected in realised gains and losses in the income statement.
For assets or derivative structures at fair value, the Group uses market prices or inputs derived from market prices. A separate internal price verification process, independent of the trading function, provides an additional control over the market prices or market input used to determine the fair values of such assets. Whilst management considers that appropriate values have been ascribed to such assets, there is always a level of uncertainty and judgment over these valuations. Subsequent valuations could differ significantly from the results of the process described above. The Group may become aware of counterparty valuations, either directly through the exchange of information or indirectly, for example, through collateral demands. Any implied differences are considered in the independent price verification process and may result in adjustments to initially indicated valuations. As of 31 March 2011, the Group had not provided any collateral on financial instruments in excess of its own market value estimates.
Notes to the Group financial statements (unaudited)
20 Swiss Re First Quarter 2011 Report
Subsequent eventsSubsequent events for the current reporting period have been evaluated up to 4 May 2011. This is the date on which the financial statements are available to be issued.
Recent accounting guidanceIn January 2010, the FASB issued “Improving Disclosures about Fair Value Measurements” (ASU No. 2010-06), an update to Topic 820 – Fair Value Measurements and Disclosures. This new standard implements additional disclosure requirements for the three fair value levels. As required by the update, the Group adopted some of the requirements as of 1 January 2010. The remaining requirements were adopted as of 1 January 2011 and can be found in Note 3.
In December 2010, the FASB issued “When to Perform Step 2 of the Goodwill Impairment Test for Reporting Units with Zero or Negative Carrying Amounts” (ASU No. 2010-28), an update to Topic 350 – Intangibles – Goodwill and Other. This update provides guidance under what circumstances a company is required to perform step 2 of the goodwill impairment test for reporting units with zero or negative carrying amounts. The Group adopted this guidance as of 1 January 2011. The adoption did not have an impact on the Group’s financial statements.
Also in December 2010, the FASB issued “Disclosure of Supplementary Pro Forma Information for Business Combinations” (ASU 2010-29), an update to Topic 805 – Business Combinations. This update specifies that an entity should disclose revenue and earnings of the combined entity as though the business combinations that occurred during the current year had occurred as of the beginning of the comparable prior annual reporting period only. The Group adopted this update as of 1 January 2011. The adoption did not have an impact on the Group’s financial statements.
Notes to the Group financial statements (unaudited)
Swiss Re First Quarter 2011 Report 21
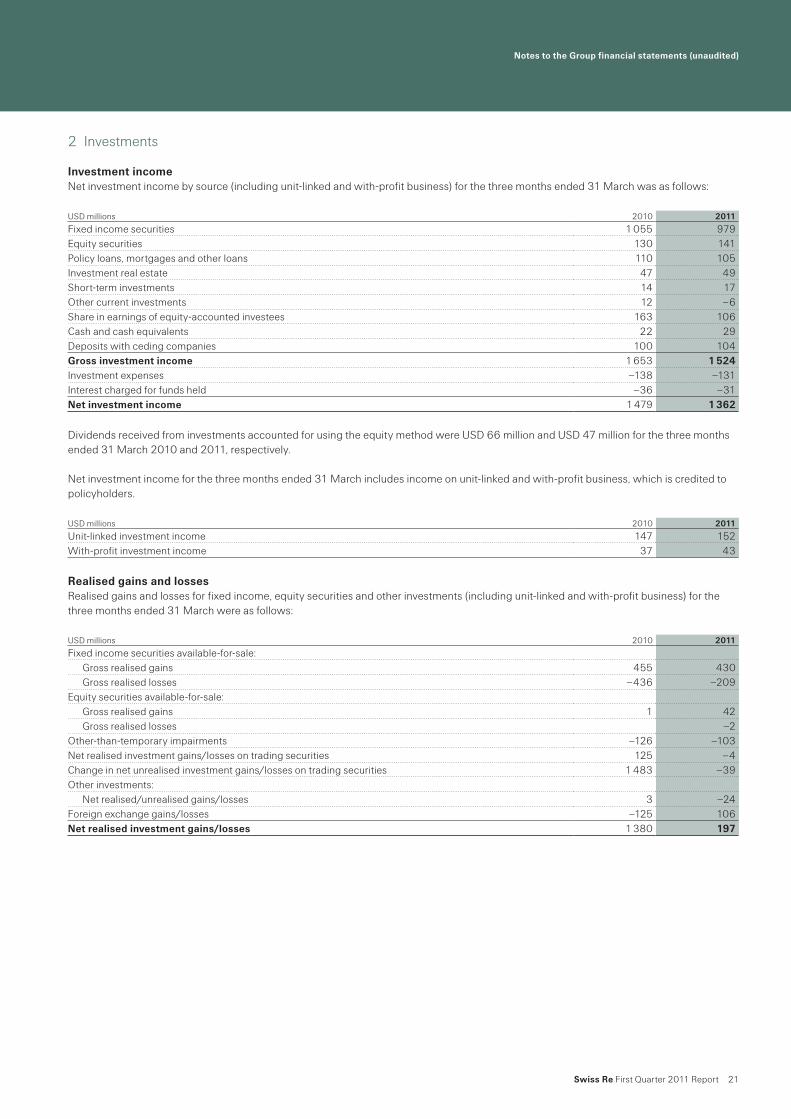
2 Investments
Investment incomeNet investment income by source (including unit-linked and with-profit business) for the three months ended 31 March was as follows:
Dividends received from investments accounted for using the equity method were USD 66 million and USD 47 million for the three months ended 31 March 2010 and 2011, respectively.
Net investment income for the three months ended 31 March includes income on unit-linked and with-profit business, which is credited to policyholders.
Realised gains and lossesRealised gains and losses for fixed income, equity securities and other investments (including unit-linked and with-profit business) for the three months ended 31 March were as follows:
USD millions 2010 2011
Fixed income securities 1 055 979Equity securities 130 141Policy loans, mortgages and other loans 110 105Investment real estate 47 49Short-term investments 14 17Other current investments 12 –6Share in earnings of equity-accounted investees 163 106Cash and cash equivalents 22 29Deposits with ceding companies 100 104Gross investment income 1 653 1 524Investment expenses –138 –131Interest charged for funds held –36 –31Net investment income 1 479 1 362
USD millions 2010 2011
Unit-linked investment income 147 152With-profit investment income 37 43
USD millions 2010 2011
Fixed income securities available-for-sale:Gross realised gains 455 430Gross realised losses –436 –209
Equity securities available-for-sale:Gross realised gains 1 42Gross realised losses –2
Other-than-temporary impairments –126 –103Net realised investment gains/losses on trading securities 125 –4Change in net unrealised investment gains/losses on trading securities 1 483 –39Other investments:
Net realised/unrealised gains/losses 3 –24Foreign exchange gains/losses –125 106Net realised investment gains/losses 1 380 197
Notes to the Group financial statements (unaudited)
22 Swiss Re First Quarter 2011 Report
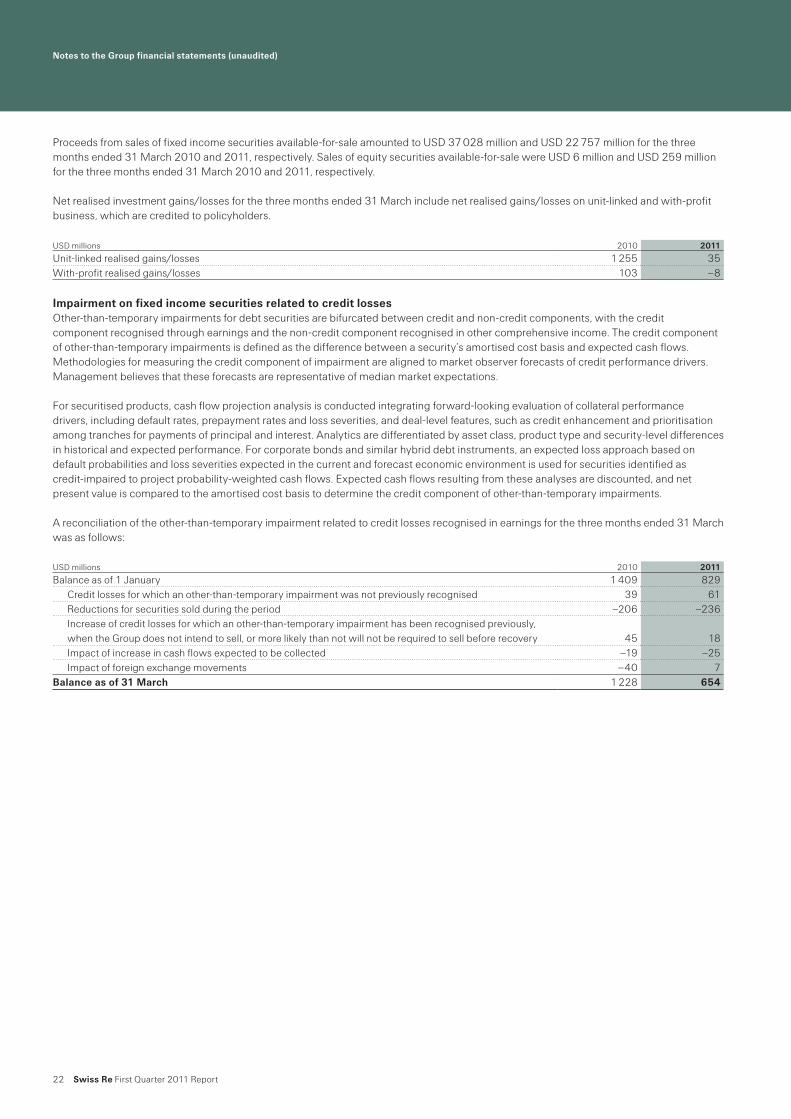
Proceeds from sales of fixed income securities available-for-sale amounted to USD 37 028 million and USD 22 757 million for the three months ended 31 March 2010 and 2011, respectively. Sales of equity securities available-for-sale were USD 6 million and USD 259 million for the three months ended 31 March 2010 and 2011, respectively.
Net realised investment gains/losses for the three months ended 31 March include net realised gains/losses on unit-linked and with-profit business, which are credited to policyholders.
Impairment on fixed income securities related to credit lossesOther-than-temporary impairments for debt securities are bifurcated between credit and non-credit components, with the credit component recognised through earnings and the non-credit component recognised in other comprehensive income. The credit component of other-than-temporary impairments is defined as the difference between a security’s amortised cost basis and expected cash flows. Methodologies for measuring the credit component of impairment are aligned to market observer forecasts of credit performance drivers. Management believes that these forecasts are representative of median market expectations.
For securitised products, cash flow projection analysis is conducted integrating forward-looking evaluation of collateral performance drivers, including default rates, prepayment rates and loss severities, and deal-level features, such as credit enhancement and prioritisation among tranches for payments of principal and interest. Analytics are differentiated by asset class, product type and security-level differences in historical and expected performance. For corporate bonds and similar hybrid debt instruments, an expected loss approach based on default probabilities and loss severities expected in the current and forecast economic environment is used for securities identified as credit-impaired to project probability-weighted cash flows. Expected cash flows resulting from these analyses are discounted, and net present value is compared to the amortised cost basis to determine the credit component of other-than-temporary impairments.
A reconciliation of the other-than-temporary impairment related to credit losses recognised in earnings for the three months ended 31 March was as follows:
USD millions 2010 2011
Unit-linked realised gains/losses 1 255 35With-profit realised gains/losses 103 –8
USD millions 2010 2011
Balance as of 1 January 1 409 829Credit losses for which an other-than-temporary impairment was not previously recognised 39 61Reductions for securities sold during the period –206 –236Increase of credit losses for which an other-than-temporary impairment has been recognised previously, when the Group does not intend to sell, or more likely than not will not be required to sell before recovery 45 18Impact of increase in cash flows expected to be collected –19 –25Impact of foreign exchange movements –40 7
Balance as of 31 March 1 228 654
Notes to the Group financial statements (unaudited)
Swiss Re First Quarter 2011 Report 23
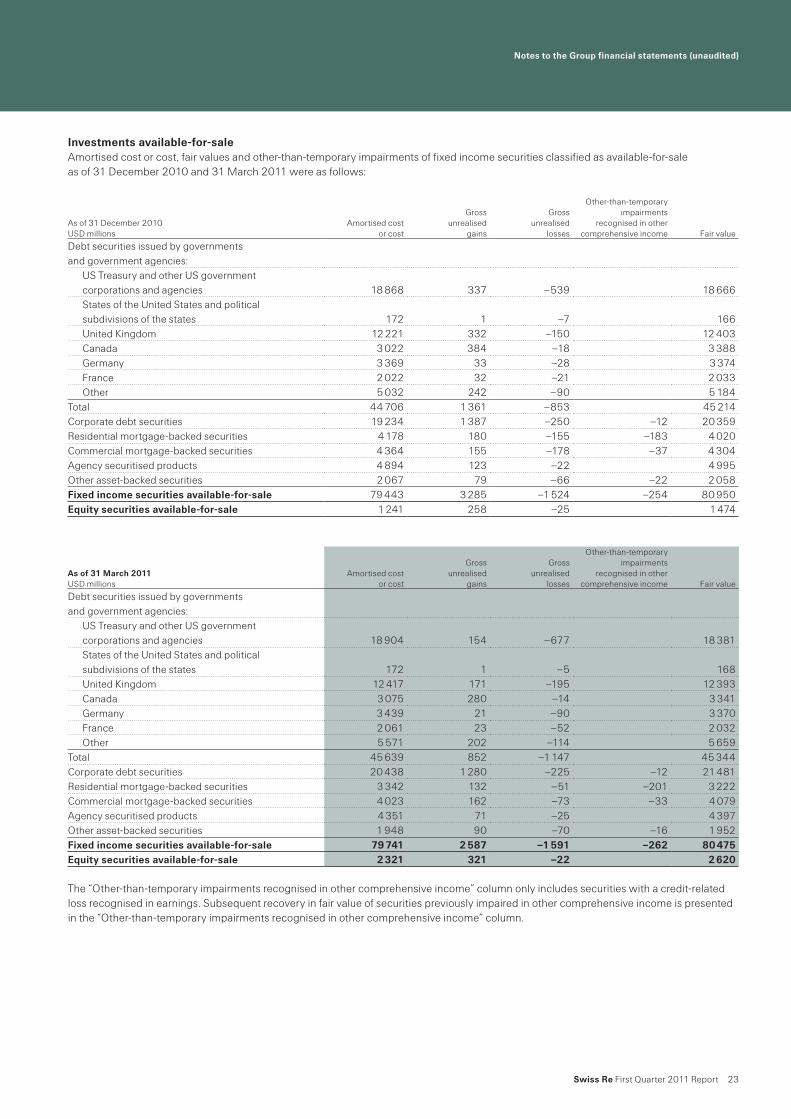
Investments available-for-saleAmortised cost or cost, fair values and other-than-temporary impairments of fixed income securities classified as available-for-sale as of 31 December 2010 and 31 March 2011 were as follows:
The “Other-than-temporary impairments recognised in other comprehensive income” column only includes securities with a credit-related loss recognised in earnings. Subsequent recovery in fair value of securities previously impaired in other comprehensive income is presented in the “Other-than-temporary impairments recognised in other comprehensive income” column.
As of 31 December 2010 USD millions
Amortised cost or cost
Gross unrealised
gains
Gross unrealised
losses
Other-than-temporary impairments
recognised in other comprehensive income
Fair value
Debt securities issued by governments and government agencies:
US Treasury and other US government corporations and agencies 18 868 337 –539 18 666States of the United States and political subdivisions of the states 172 1 –7 166United Kingdom 12 221 332 –150 12 403Canada 3 022 384 –18 3 388Germany 3 369 33 –28 3 374France 2 022 32 –21 2 033Other 5 032 242 –90 5 184
Total 44 706 1 361 –853 45 214Corporate debt securities 19 234 1 387 –250 –12 20 359Residential mortgage-backed securities 4 178 180 –155 –183 4 020Commercial mortgage-backed securities 4 364 155 –178 –37 4 304Agency securitised products 4 894 123 –22 4 995Other asset-backed securities 2 067 79 –66 –22 2 058Fixed income securities available-for-sale 79 443 3 285 –1 524 –254 80 950Equity securities available-for-sale 1 241 258 –25 1 474
As of 31 March 2011USD millions
Amortised cost or cost
Gross unrealised
gains
Gross unrealised
losses
Other-than-temporary impairments
recognised in other comprehensive income
Fair value
Debt securities issued by governments and government agencies:
US Treasury and other US government corporations and agencies 18 904 154 –677 18 381States of the United States and political subdivisions of the states 172 1 –5 168United Kingdom 12 417 171 –195 12 393Canada 3 075 280 –14 3 341Germany 3 439 21 –90 3 370France 2 061 23 –52 2 032Other 5 571 202 –114 5 659
Total 45 639 852 –1 147 45 344Corporate debt securities 20 438 1 280 –225 –12 21 481Residential mortgage-backed securities 3 342 132 –51 –201 3 222Commercial mortgage-backed securities 4 023 162 –73 –33 4 079Agency securitised products 4 351 71 –25 4 397Other asset-backed securities 1 948 90 –70 –16 1 952Fixed income securities available-for-sale 79 741 2 587 –1 591 –262 80 475Equity securities available-for-sale 2 321 321 –22 2 620

Notes to the Group financial statements (unaudited)
24 Swiss Re First Quarter 2011 Report
Investments tradingFixed income securities and equity securities classified as trading as of 31 December 2010 and 31 March 2011 were as follows:
Fixed income securities and equity securities classified as trading as of 31 December 2010 and 31 March 2011 include securities held for unit-linked and with-profit business:
Maturity of fixed income securities available-for-saleThe amortised cost or cost and fair values of investments in fixed income securities available-for-sale by remaining maturity as of 31 December 2010 and 31 March 2011 are shown below. Fixed maturity investments are assumed not to be called for redemption prior to the stated maturity date. As of 31 December 2010 and 31 March 2011, USD 13 107 million and USD 11 660 million, respectively, of fixed income securities available-for-sale were callable.
Assets pledgedAs of 31 December 2010 and 31 March 2011, investments with the carrying value of USD 1 769 million and USD 1 775 million, respectively, were on deposit with regulatory agencies in accordance with local requirements.
As of 31 December 2010 and 31 March 2011, investments (including cash and cash equivalents) with a carrying value of approximately USD 8 573 million and USD 7 592 million, respectively, were placed on deposit or pledged to secure certain reinsurance liabilities.
As of 31 December 2010 and 31 March 2011, securities of USD 12 802 million and USD 10 547 million, respectively, were pledged as collateral in securities lending transactions and repurchase agreements. The associated liabilities of USD 1 750 million and USD 1 707 million, respectively, were recognised in accrued expenses and other liabilities.
A real estate portfolio with a carrying amount of USD 272 million serves as collateral for short-term senior operational debt of USD 710 million.
Collateral acceptedAs of 31 December 2010 and 31 March 2011, the fair value of the government bond, corporate bond and equity securities received as collateral was USD 6 539 million and USD 5 072 million, respectively. Of this, the amount that was sold or repledged as of 31 December 2010 and 31 March 2011 was USD nil million and USD nil million, respectively. The sources of the collateral are typically highly rated banking market counterparties.
USD millions 2010 2011
Debt securities issued by governments and government agencies 8 308 8 814Corporate debt securities 2 497 2 795Mortgage- and asset-backed securities 447 373Fixed income securities trading 11 252 11 982Equity securities trading 19 513 19 619
USD millions 2010 2011
Fixed income securities trading held for unit-linked business 2 302 2 312Fixed income securities trading held for with-profit business 1 648 1 686Fixed income securities trading 3 950 3 998Equity securities trading held for unit-linked business 17 405 17 602Equity securities trading held for with-profit business 1 135 1 118Equity securities trading 18 540 18 720
2010 2011 USD millions
Amortised cost or cost
Fair value
Amortised cost or cost
Fair value
Due in one year or less 2 342 2 379 5 401 5 464Due after one year through five years 16 601 16 891 15 535 15 767Due after five years through ten years 14 628 15 189 16 195 16 593Due after ten years 30 604 31 360 29 187 29 242Mortgage- and asset-backed securities with no fixed maturity 15 268 15 131 13 423 13 409Total fixed income securities available-for-sale 79 443 80 950 79 741 80 475
Notes to the Group financial statements (unaudited)
Swiss Re First Quarter 2011 Report 25
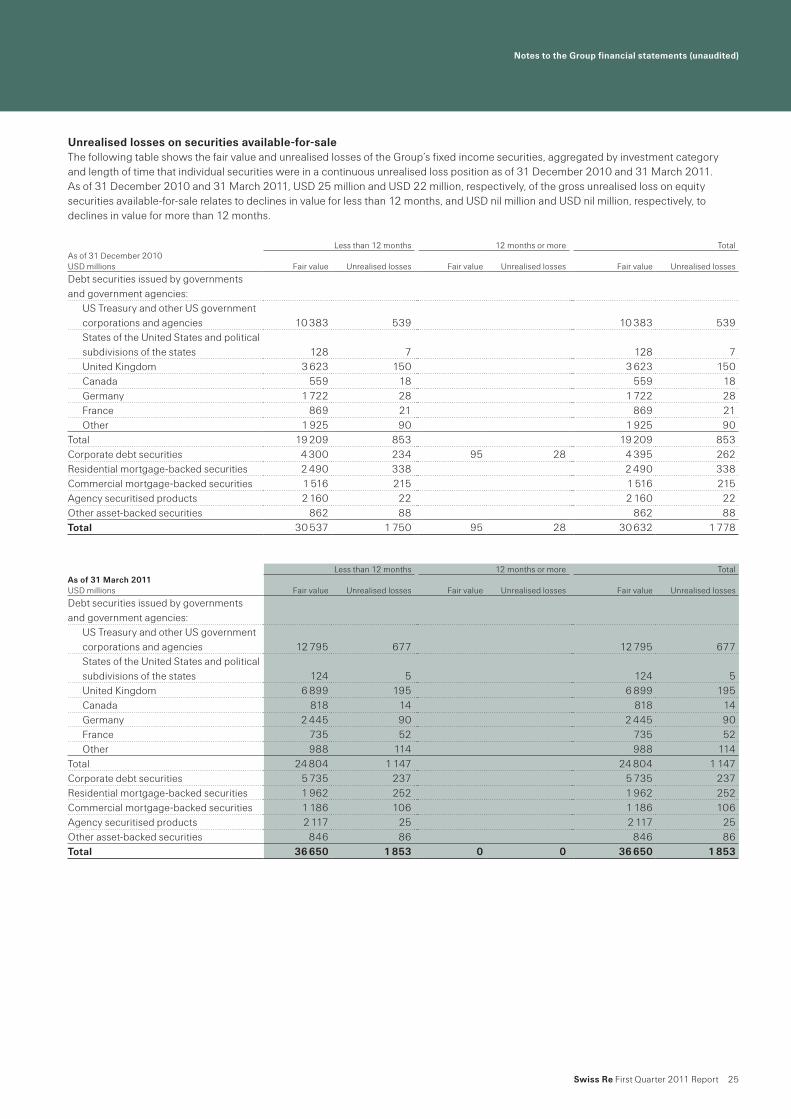
Unrealised losses on securities available-for-saleThe following table shows the fair value and unrealised losses of the Group’s fixed income securities, aggregated by investment category and length of time that individual securities were in a continuous unrealised loss position as of 31 December 2010 and 31 March 2011. As of 31 December 2010 and 31 March 2011, USD 25 million and USD 22 million, respectively, of the gross unrealised loss on equity securities available-for-sale relates to declines in value for less than 12 months, and USD nil million and USD nil million, respectively, to declines in value for more than 12 months.
Less than 12 months 12 months or more TotalAs of 31 December 2010 USD millions Fair value Unrealised losses Fair value Unrealised losses Fair value Unrealised losses
Debt securities issued by governments and government agencies:
US Treasury and other US government corporations and agencies 10 383 539 10 383 539States of the United States and political subdivisions of the states 128 7 128 7United Kingdom 3 623 150 3 623 150Canada 559 18 559 18Germany 1 722 28 1 722 28France 869 21 869 21Other 1 925 90 1 925 90
Total 19 209 853 19 209 853Corporate debt securities 4 300 234 95 28 4 395 262Residential mortgage-backed securities 2 490 338 2 490 338Commercial mortgage-backed securities 1 516 215 1 516 215Agency securitised products 2 160 22 2 160 22Other asset-backed securities 862 88 862 88Total 30 537 1 750 95 28 30 632 1 778
Less than 12 months 12 months or more TotalAs of 31 March 2011USD millions Fair value Unrealised losses Fair value Unrealised losses Fair value Unrealised losses
Debt securities issued by governments and government agencies:
US Treasury and other US government corporations and agencies 12 795 677 12 795 677States of the United States and political subdivisions of the states 124 5 124 5United Kingdom 6 899 195 6 899 195Canada 818 14 818 14Germany 2 445 90 2 445 90France 735 52 735 52Other 988 114 988 114
Total 24 804 1 147 24 804 1 147Corporate debt securities 5 735 237 5 735 237Residential mortgage-backed securities 1 962 252 1 962 252Commercial mortgage-backed securities 1 186 106 1 186 106Agency securitised products 2 117 25 2 117 25Other asset-backed securities 846 86 846 86Total 36 650 1 853 0 0 36 650 1 853

Notes to the Group financial statements (unaudited)
26 Swiss Re First Quarter 2011 Report
Mortgages, loans and real estateAs of 31 December 2010 and 31 March 2011, the carrying values of investments in mortgages, policy and other loans, and real estate were as follows:
The fair value of the real estate as of 31 December 2010 and 31 March 2011 was USD 3 306 million and USD 3 397 million, respectively. The carrying value of policy loans, mortgages and other loans approximates fair value.
As of 31 December 2010 and 31 March 2011, the Group’s investment in mortgages and other loans included USD 270 million and USD 277 million, respectively, of loans due from employees and USD 356 million and USD 360 million, respectively, due from officers. These loans generally consist of mortgages offered at variable and fixed interest rates.
As of 31 December 2010 and 31 March 2011, investments in real estate included USD 6 million and USD 6 million, respectively, of real estate held for sale.
Depreciation expense related to income producing properties was USD 10 million and USD 9 million for the three months ended 2010 and 2011, respectively. Accumulated depreciation on investment real estate totalled USD 528 million and USD 545 million as of 31 December 2010 and 31 March 2011, respectively.
Substantially all mortgages, policy loans and other loan receivables are secured by buildings, land or the underlying policies.
USD millions 2010 2011
Policy loans 3 658 3 623Mortgage loans 1 337 1 393Other loans 635 677Investment real estate 2 040 2 065
Notes to the Group financial statements (unaudited)
Swiss Re First Quarter 2011 Report 27
3 Fair value disclosures
Fair value, as defined by the Fair Value Measurements and Disclosures Topic, is the price that would be received to sell an asset or paid to transfer a liability in an orderly transaction between market participants at the measurement date.
The Fair Value Measurements and Disclosures Topic requires all assets and liabilities that are measured at fair value to be categorised within the fair value hierarchy. This three-level hierarchy is based on the observability of the inputs used in the fair value measurement. The levels of the fair value hierarchy are defined as follows:
Level 1 inputs are quoted prices in active markets for identical assets or liabilities that the Group has the ability to access. Level 1 inputs are the most persuasive evidence of fair value and are to be used whenever possible.
Level 2 inputs are market based inputs that are directly or indirectly observable but not considered level 1 quoted prices. Level 2 inputs consist of (i) quoted prices for similar assets or liabilities in active markets; (ii) quoted prices for identical assets or liabilities in non-active markets (eg markets which have few transactions and where prices are not current or price quotations vary substantially); (iii) inputs other than quoted prices that are observable (eg interest rates, yield curves, volatilities, prepayment speeds, credit risks and default rates); and (iv) inputs derived from, or corroborated by, observable market data.
Level 3 inputs are unobservable inputs. These inputs reflect the Group’s own assumptions about market pricing using the best internal and external information available.
The types of instruments valued, based on quoted market prices in active markets, include most US government and sovereign obligations, active listed equities and most money market securities. Such instruments are generally classified within level 1 of the fair value hierarchy. The Group does not adjust the quoted price for such instruments, even in situations where it holds a large position and a sale could reasonably impact the quoted price.
The types of instruments that trade in markets that are not considered to be active, but are valued based on quoted market prices, broker or dealer quotations, or alternative pricing sources with reasonable levels of price transparency include most government agency securities, investment-grade corporate bonds, certain mortgage- and asset-backed products, less liquid listed equities, and state, municipal and provincial obligations. Such instruments are generally classified within level 2 of the fair value hierarchy.
Exchange-traded derivative instruments typically fall within level 1 or level 2 of the fair value hierarchy depending on whether they are considered to be actively traded or not.
Certain financial instruments are classified within level 3 of the fair value hierarchy, because they trade infrequently and therefore have little or no price transparency. Such instruments include private equity, less liquid corporate debt securities and certain asset-backed securities. Certain over-the-counter derivatives trade in less liquid markets with limited pricing information, and the determination of fair value for these derivatives is inherently more difficult. Such instruments are classified within level 3 of the fair value hierarchy. Pursuant to the election of the fair value option, the Group classifies certain Life & Health policy reserves to level 3 of the fair value hierarchy. When appropriate, valuations are adjusted for various factors such as liquidity, bid/offer spreads and credit considerations. Such adjustments are generally based on available market evidence. In the absence of such evidence, management’s best estimate is used.

Notes to the Group financial statements (unaudited)
28 Swiss Re First Quarter 2011 Report
The fair values of assets are adjusted to incorporate the counterparty risk of non-performance. Similarly, the fair values of liabilities reflect the risk of non-performance of the Group, captured by the Group’s credit spread. These valuation adjustments from assets and liabilities measured at fair value using significant unobservable inputs are recognised in net realised gains and losses. In the first quarter of 2011, these adjustments were non-material. Whenever the underlying assets or liabilities are reported in a specific business segment, the valuation adjustment is allocated accordingly. Valuation adjustments not attributable to any business segment are reported in Group items.
In certain situations, the Group uses inputs to measure the fair value of asset or liability positions that fall into different levels of the fair value hierarchy. In these situations, the Group will determine the level in which the fair value falls based upon the lowest level input that is significant to the determination of the fair value.
Valuation techniquesUS government securities typically have quoted market prices in active markets and are categorised as level 1 instruments in the fair value hierarchy. Non-US government holdings are generally classified as level 2 instruments and are valued on the basis of the quotes provided by pricing services, which are subject to the Group’s pricing validation reviews and pricing vendor challenge process. Valuations provided by pricing vendors are generally based on the actual trade information as substantially all of the Group’s non-US government holdings are traded in a transparent and liquid market.
Corporate debt securities mainly include US and European investment-grade positions, which are priced on the basis of quotes provided by third-party pricing vendors and first utilise valuation inputs from actively traded securities, such as bid prices, bid spreads to Treasury securities, Treasury curves, and same or comparable issuer curves and spreads. Issuer spreads are determined from actual quotes and traded prices and incorporate considerations of credit/default, sector composition, and liquidity and call features. Where market data is not available, valuations are developed based on the modelling techniques that utilise observable inputs and option adjusted spreads and incorporate considerations of the security’s seniority, maturity and the issuer’s corporate structure.
Values of residential mortgage-backed securities (RMBS), commercial mortgage-backed securities (CMBS) and other asset-backed securities (Other ABS) are obtained both from third-party pricing vendors and through quoted prices, some of which may be based on the prices of comparable securities with similar structural and collateral features. Values of certain ABS for which there are no significant observable inputs are developed using benchmarks to similar transactions or indices. For both RMBS and CMBS, cash flows are derived based on the transaction-specific information which incorporates priority in the capital structure and are generally adjusted to reflect benchmark yields, market prepayment data, collateral performance (default rates and loss severity) for specific vintage and geography, credit enhancements, and ratings. For certain RMBS and CMBS with low levels of market liquidity, judgments may be required to determine comparable securities based on the loan type and deal-specific performance. CMBS terms may also incorporate lock-out periods that restrict borrowers from prepaying the loans or provide disincentives to prepay and therefore reduce prepayment risk of these securities, as compared to RMBS. The factors specifically considered in valuation of CMBS include borrower-specific statistics in a specific region, such as debt service coverage and loan-to-value ratios, as well as the type of commercial property.
Notes to the Group financial statements (unaudited)
Swiss Re First Quarter 2011 Report 29
The category Other ABS primarily includes debt securitised by credit card, student loan and auto loan receivables. Pricing inputs for these securities also focus on capturing, where relevant, collateral quality and performance, payment patterns, and delinquencies.
The Group uses third-party pricing vendor data to value agency securitised products, which mainly include collateralised mortgage obligations (CMO) and MBS government agency securities. The valuations generally utilise observable inputs consistent with those noted above for RMBS and CMBS.
Equity securities held by the Group for proprietary investment purposes are mainly classified in levels 1 and 2. Securities classified in level 1 are traded on public stock exchanges for which quoted prices are readily available. Level 2 equities include equity investments fair valued pursuant to the fair value option election and certain hedge fund positions; all valued based on primarily observable inputs.
The category Other assets mainly includes the Group’s private equity and hedge fund investments which are made directly or via ownership of funds. Substantially all these investments are classified as level 3 due to the lack of observable prices and significant judgment required in valuation. Valuation of direct private equity investments requires significant management judgment due to the absence of quoted market prices and the lack of liquidity. Initial valuation is based on the acquisition cost, and is further refined based on the available market information for the public companies that are considered comparable to the Group’s holdings in the private companies being valued, and the private company-specific performance indicators; both historic and projected. Subsequent valuations also reflect business or asset appraisals, as well as market transaction data for private and public benchmark companies and the actual companies being valued, such as financing rounds and mergers and acquisitions activity. The Group’s holdings in the private equity and hedge funds are generally valued utilising net asset values (NAV), subject to adjustments, as deemed necessary, for restrictions on redemption (lock-up periods and amount limitations on redemptions).
The Group holds both exchange-traded and over-the-counter (OTC) interest rate, foreign exchange, credit and equity derivative contracts for hedging and trading purposes. The fair values of exchange-traded derivatives measured using observable exchange prices are classified in level 1. Long-dated contracts may require adjustments to the exchange-traded prices which would trigger reclassification to level 2 in the fair value hierarchy. OTC derivatives are generally valued by the Group based on the internal models, which are consistent with industry standards and practices, and use both observable (dealer, broker or market consensus prices, spot and forward rates, interest rate and credit curves and volatility indices) and unobservable inputs (adjustments for liquidity, inputs derived from the observable data based on the Group’s judgments and assumptions).

Notes to the Group financial statements (unaudited)
30 Swiss Re First Quarter 2011 Report
The Group’s OTC interest rate derivatives primarily include interest rate swaps, futures, options, caps and floors, and are valued based on the cash flow discounting models which generally utilise as inputs observable market yield curves and volatility assumptions.
The Group’s OTC foreign exchange derivatives primarily include forward, spot and option contracts and are generally valued based on the cash flow discounting models utilising as main inputs observable foreign exchange forward curves.
The Group’s investments in equity derivatives primarily include OTC equity option contracts on single or baskets of market indices and equity options on individual or baskets of equity securities, which are valued using internally developed models (such as Black-Scholes option pricing model, various simulation models) calibrated with the inputs, which include underlying spot prices, dividend curves, volatility surfaces, yield curves, and correlations between underlying assets.
The Group’s OTC credit derivatives include index and single name credit default swaps, as well as more complex structured credit derivatives. Plain vanilla credit derivatives, such as index and single-name credit default swaps, are valued by the Group based on the models consistent with the industry valuation standards for these credit contracts, and primarily utilising observable inputs published by market data sources, such as credit spreads and recovery rates. These valuation techniques warrant classification of plain vanilla OTC derivatives as level 2 financial instruments in the fair value hierarchy.
The Group also holds complex structured credit contracts, such as collateralised debt securities (CDS) referencing MBS, certain types of collateralised debt obligation (CDO) transactions, and the products sensitive to correlation between two or more underlying parameters (CDO-squared); all of which are classified within level 3 of the fair value hierarchy. A CDO is a debt instrument collateralised by various debt obligations, including bonds, loans and CDS of differing credit profiles. In a CDO-squared transaction both the primary instrument and the underlying instruments are represented by CDOs. Generally, for CDO and CDO-squared transactions, the observable inputs such as CDS spreads and recovery rates are modified to adjust for correlation between the underlying debt instruments. The correlation levels are modelled at the portfolio level and calibrated at a transaction level to liquid benchmark rates.

Notes to the Group financial statements (unaudited)
Swiss Re First Quarter 2011 Report 31
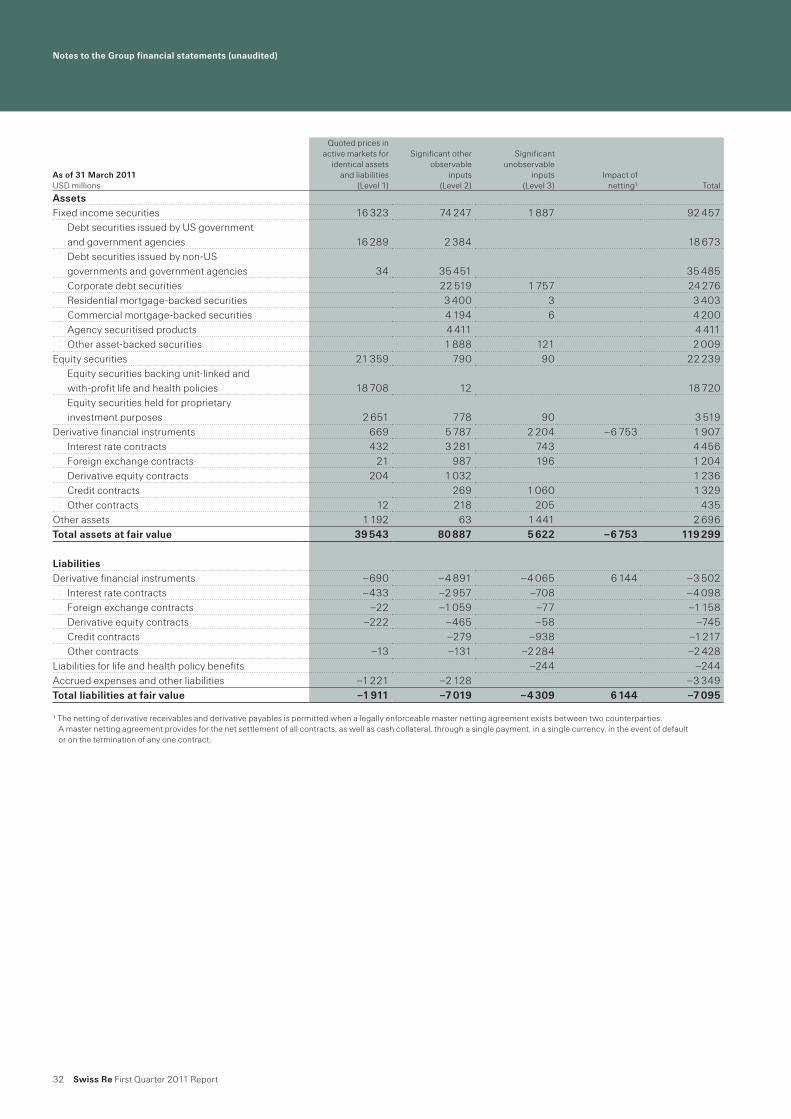
Assets and liabilities measured at fair value on a recurring basisAs of 31 December 2010 and 31 March 2011, the fair values of assets and liabilities measured on a recurring basis by level of input were as follows:
As of 31 December 2010 USD millions
Quoted prices in active markets for
identical assets and liabilities
(Level 1)
Significant other observable
inputs (Level 2)
Significant unobservable
inputs (Level 3)
Impact of netting1 Total
AssetsFixed income securities 16 043 74 278 1 881 92 202
Debt securities issued by US government and government agencies 16 043 3 041 19 084Debt securities issued by non-US governments and government agencies 34 438 34 438Corporate debt securities 21 108 1 748 22 856Residential mortgage-backed securities 4 210 7 4 217Commercial mortgage-backed securities 4 427 3 4 430Agency securitised products 5 011 5 011Other asset-backed securities 2 043 123 2 166
Equity securities 19 972 812 203 20 987Equity securities backing unit-linked and with-profit life and health policies 18 495 45 18 540Equity securities held for proprietary investment purposes 1 477 767 203 2 447
Derivative financial instruments 579 6 850 2 417 –6 560 3 286Interest rate contracts 389 4 000 839 5 228Foreign exchange contracts 40 1 098 162 1 300Derivative equity contracts 142 1 170 1 312Credit contracts 369 1 214 1 583Other contracts 8 213 202 423
Other assets 20 –12 1 411 1 419Total assets at fair value 36 614 81 928 5 912 –6 560 117 894
LiabilitiesDerivative financial instruments –577 –5 649 –4 532 5 772 –4 986
Interest rate contracts –402 –3 579 –825 –4 806Foreign exchange contracts –41 –1 103 –72 –1 216Derivative equity contracts –123 –531 –56 –710Credit contracts –317 –1 007 –1 324Other contracts –11 –119 –2 572 –2 702
Liabilities for life and health policy benefits –271 –271Accrued expenses and other liabilities –398 –1 290 –1 688Total liabilities at fair value –975 –6 939 –4 803 5 772 –6 945
1 The netting of derivative receivables and derivative payables is permitted when a legally enforceable master netting agreement exists between two counterparties. A master netting agreement provides for the net settlement of all contracts, as well as cash collateral, through a single payment, in a single currency, in the event of default or on the termination of any one contract.
Notes to the Group financial statements (unaudited)
32 Swiss Re First Quarter 2011 Report
As of 31 March 2011 USD millions
Quoted prices in active markets for
identical assets and liabilities
(Level 1)
Significant other observable
inputs (Level 2)
Significant unobservable
inputs (Level 3)
Impact of netting1 Total
AssetsFixed income securities 16 323 74 247 1 887 92 457
Debt securities issued by US government and government agencies 16 289 2 384 18 673Debt securities issued by non-US governments and government agencies 34 35 451 35 485Corporate debt securities 22 519 1 757 24 276Residential mortgage-backed securities 3 400 3 3 403Commercial mortgage-backed securities 4 194 6 4 200Agency securitised products 4 411 4 411Other asset-backed securities 1 888 121 2 009
Equity securities 21 359 790 90 22 239Equity securities backing unit-linked and with-profit life and health policies 18 708 12 18 720Equity securities held for proprietary investment purposes 2 651 778 90 3 519
Derivative financial instruments 669 5 787 2 204 –6 753 1 907Interest rate contracts 432 3 281 743 4 456Foreign exchange contracts 21 987 196 1 204Derivative equity contracts 204 1 032 1 236Credit contracts 269 1 060 1 329Other contracts 12 218 205 435
Other assets 1 192 63 1 441 2 696Total assets at fair value 39 543 80 887 5 622 –6 753 119 299
LiabilitiesDerivative financial instruments –690 –4 891 –4 065 6 144 –3 502
Interest rate contracts –433 –2 957 –708 –4 098Foreign exchange contracts –22 –1 059 –77 –1 158Derivative equity contracts –222 –465 –58 –745Credit contracts –279 –938 –1 217Other contracts –13 –131 –2 284 –2 428
Liabilities for life and health policy benefits –244 –244Accrued expenses and other liabilities –1 221 –2 128 –3 349Total liabilities at fair value –1 911 –7 019 –4 309 6 144 –7 095
1 The netting of derivative receivables and derivative payables is permitted when a legally enforceable master netting agreement exists between two counterparties. A master netting agreement provides for the net settlement of all contracts, as well as cash collateral, through a single payment, in a single currency, in the event of default or on the termination of any one contract.

Notes to the Group financial statements (unaudited)
Swiss Re First Quarter 2011 Report 33
This page intentionally left blank

Notes to the Group financial statements (unaudited)
34 Swiss Re First Quarter 2011 Report
Assets and liabilities measured at fair value on a recurring basis using significant unobservable inputs (level 3)As of 31 December 2010 and 31 March 2011, the reconciliation of the fair values of assets and liabilities measured on a recurring basis using significant unobservable inputs were as follows:
As of 31 December 2010 USD millions
Debt securities issued by non-US governments and
government agenciesCorporate debt
securities
Residential mortgage-backed
securities
Commercial mortgage-backed
securities Other asset-backed
securities
Equity securities held for proprietary
investment purposesDerivative interest
rate contractsDerivative foreign
exchange contractsDerivative equity
contractsDerivative credit
contractsOther derivative
contracts Other assets Total
AssetsBalance as of 1 January 2010 82 2 085 1 302 199 2 047 170 1 162 3 57 2 316 283 1 321 11 027Cumulative effect of adoption of ASU No. 2009-17 –84 –84
Realised/unrealised gains/losses:Included in net income 19 115 –4 –36 –27 –58 54 21 –788 –45 –35 –784Included in other comprehensive income –5 7 29 1 55 –2 129 214
Purchases, issuances, and settlements –115 –77 –73 –4 –1 430 65 –206 48 –88 –314 19 64 –2 111Transfers into level 31 106 87 90 44 176 91 56 10 2 31 693Transfers out of level 31 –85 –440 –1 3332 –238 –600 –148 –48 –97 –2 989Impact of foreign exchange movements –2 –29 –4 1 –5 –3 –2 1 –9 –2 –54
Closing balance as of 31 December 2010 0 1 748 7 3 123 203 839 162 0 1 214 202 1 411 5 912
Liabilities for life and health policy benefits
Derivative interest rate contracts
Derivative foreign exchange contracts
Derivative equity contracts
Derivative credit contracts
Other derivative contracts Total
LiabilitiesBalance as of 1 January 2010 –293 –948 –41 –54 –1 738 –2 257 –5 331
Realised/unrealised gains/losses:Included in net income 22 123 –31 –2 731 –95 748Included in other comprehensive income
Purchases, issuances, and settlements –220 –220Transfers into level 31Transfers out of level 31Impact of foreign exchange movements
Closing balance as of 31 December 2010 –271 –825 –72 –56 –1 007 –2 572 –4 803
1 Transfers are recognised at the date of the event or change in circumstances that caused the transfer.2 The Group has mainly transferred residential mortgage-backed securities with a maturity longer than 20 years from level 3 to level 2 as the valuation of those products is based on
observable inputs.

Notes to the Group financial statements (unaudited)
Swiss Re First Quarter 2011 Report 35
As of 31 December 2010 USD millions
Debt securities issued by non-US governments and
government agenciesCorporate debt
securities
Residential mortgage-backed
securities
Commercial mortgage-backed
securities Other asset-backed
securities
Equity securities held for proprietary
investment purposesDerivative interest
rate contractsDerivative foreign
exchange contractsDerivative equity
contractsDerivative credit
contractsOther derivative
contracts Other assets Total
AssetsBalance as of 1 January 2010 82 2 085 1 302 199 2 047 170 1 162 3 57 2 316 283 1 321 11 027Cumulative effect of adoption of ASU No. 2009-17 –84 –84
Realised/unrealised gains/losses:Included in net income 19 115 –4 –36 –27 –58 54 21 –788 –45 –35 –784Included in other comprehensive income –5 7 29 1 55 –2 129 214
Purchases, issuances, and settlements –115 –77 –73 –4 –1 430 65 –206 48 –88 –314 19 64 –2 111Transfers into level 31 106 87 90 44 176 91 56 10 2 31 693Transfers out of level 31 –85 –440 –1 3332 –238 –600 –148 –48 –97 –2 989Impact of foreign exchange movements –2 –29 –4 1 –5 –3 –2 1 –9 –2 –54
Closing balance as of 31 December 2010 0 1 748 7 3 123 203 839 162 0 1 214 202 1 411 5 912
Liabilities for life and health policy benefits
Derivative interest rate contracts
Derivative foreign exchange contracts
Derivative equity contracts
Derivative credit contracts
Other derivative contracts Total
LiabilitiesBalance as of 1 January 2010 –293 –948 –41 –54 –1 738 –2 257 –5 331
Realised/unrealised gains/losses:Included in net income 22 123 –31 –2 731 –95 748Included in other comprehensive income
Purchases, issuances, and settlements –220 –220Transfers into level 31Transfers out of level 31Impact of foreign exchange movements
Closing balance as of 31 December 2010 –271 –825 –72 –56 –1 007 –2 572 –4 803
1 Transfers are recognised at the date of the event or change in circumstances that caused the transfer.2 The Group has mainly transferred residential mortgage-backed securities with a maturity longer than 20 years from level 3 to level 2 as the valuation of those products is based on
observable inputs.
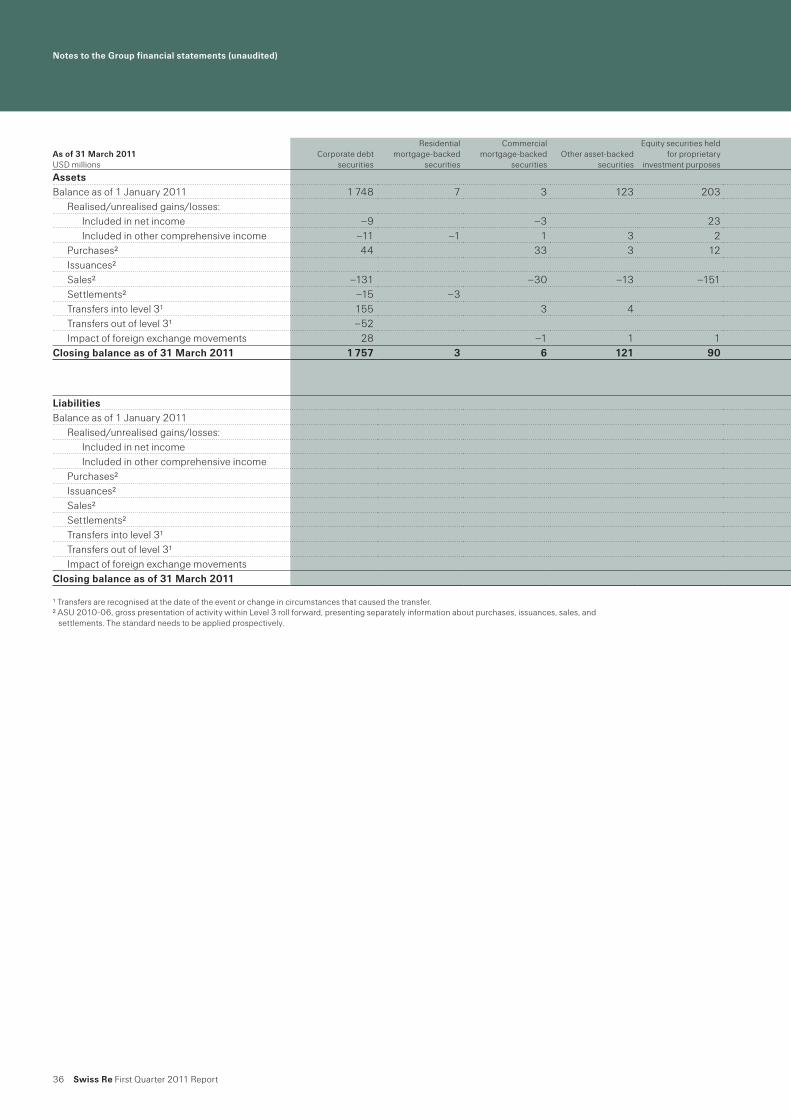
Notes to the Group financial statements (unaudited)
36 Swiss Re First Quarter 2011 Report
As of 31 March 2011USD millions
Corporate debt securities
Residential mortgage-backed
securities
Commercial mortgage-backed
securities Other asset-backed
securities
Equity securities held for proprietary
investment purposesDerivative interest
rate contractsDerivative foreign
exchange contractsDerivative equity
contractsDerivative credit
contractsOther derivative
contracts Other assets Total
AssetsBalance as of 1 January 2011 1 748 7 3 123 203 839 162 1 214 202 1 411 5 912
Realised/unrealised gains/losses:Included in net income –9 –3 23 –115 –59 1 –109 –27 25 –273Included in other comprehensive income –11 –1 1 3 2 33 27
Purchases2 44 33 3 12 98 95 26 94 405Issuances2Sales2 –131 –30 –13 –151 –79 –2 –1 –34 –124 –565Settlements2 –15 –3 –11 –29Transfers into level 31 155 3 4 162Transfers out of level 31 –52 –4 –56Impact of foreign exchange movements 28 –1 1 1 8 2 39
Closing balance as of 31 March 2011 1 757 3 6 121 90 743 196 0 1 060 205 1 441 5 622
Liabilities for life and health policy benefits
Derivative interest rate contracts
Derivative foreign exchange contracts
Derivative equity contracts
Derivative credit contracts
Other derivative contracts Total
LiabilitiesBalance as of 1 January 2011 –271 –825 –72 –56 –1 007 –2 572 –4 803
Realised/unrealised gains/losses:Included in net income 27 117 –5 –2 70 334 541Included in other comprehensive income
Purchases2Issuances2 –55 –55Sales2 5 5Settlements2Transfers into level 31 4 4Transfers out of level 31Impact of foreign exchange movements –1 –1
Closing balance as of 31 March 2011 –244 –708 –77 –58 –938 –2 284 –4 309
1 Transfers are recognised at the date of the event or change in circumstances that caused the transfer.2 ASU 2010-06, gross presentation of activity within Level 3 roll forward, presenting separately information about purchases, issuances, sales, and
settlements. The standard needs to be applied prospectively.

Notes to the Group financial statements (unaudited)
Swiss Re First Quarter 2011 Report 37
As of 31 March 2011USD millions
Corporate debt securities
Residential mortgage-backed
securities
Commercial mortgage-backed
securities Other asset-backed
securities
Equity securities held for proprietary
investment purposesDerivative interest
rate contractsDerivative foreign
exchange contractsDerivative equity
contractsDerivative credit
contractsOther derivative
contracts Other assets Total
AssetsBalance as of 1 January 2011 1 748 7 3 123 203 839 162 1 214 202 1 411 5 912
Realised/unrealised gains/losses:Included in net income –9 –3 23 –115 –59 1 –109 –27 25 –273Included in other comprehensive income –11 –1 1 3 2 33 27
Purchases2 44 33 3 12 98 95 26 94 405Issuances2Sales2 –131 –30 –13 –151 –79 –2 –1 –34 –124 –565Settlements2 –15 –3 –11 –29Transfers into level 31 155 3 4 162Transfers out of level 31 –52 –4 –56Impact of foreign exchange movements 28 –1 1 1 8 2 39
Closing balance as of 31 March 2011 1 757 3 6 121 90 743 196 0 1 060 205 1 441 5 622
Liabilities for life and health policy benefits
Derivative interest rate contracts
Derivative foreign exchange contracts
Derivative equity contracts
Derivative credit contracts
Other derivative contracts Total
LiabilitiesBalance as of 1 January 2011 –271 –825 –72 –56 –1 007 –2 572 –4 803
Realised/unrealised gains/losses:Included in net income 27 117 –5 –2 70 334 541Included in other comprehensive income
Purchases2Issuances2 –55 –55Sales2 5 5Settlements2Transfers into level 31 4 4Transfers out of level 31Impact of foreign exchange movements –1 –1
Closing balance as of 31 March 2011 –244 –708 –77 –58 –938 –2 284 –4 309
1 Transfers are recognised at the date of the event or change in circumstances that caused the transfer.2 ASU 2010-06, gross presentation of activity within Level 3 roll forward, presenting separately information about purchases, issuances, sales, and
settlements. The standard needs to be applied prospectively.
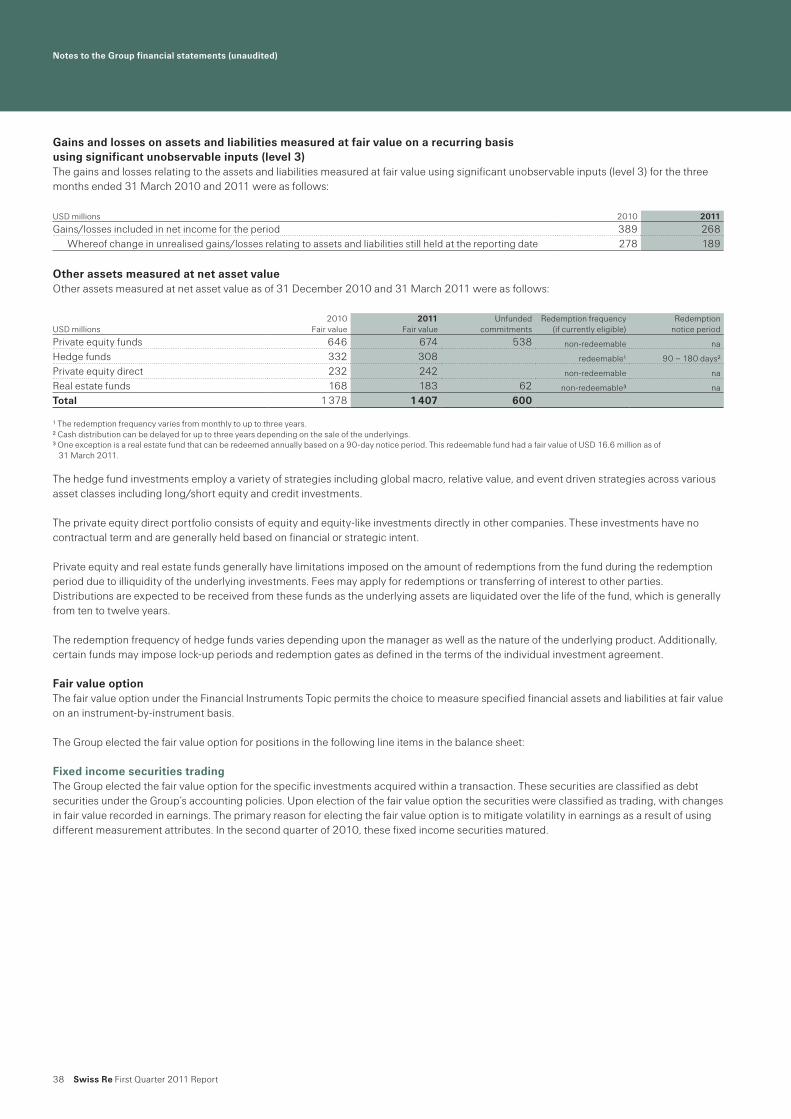
Notes to the Group financial statements (unaudited)
38 Swiss Re First Quarter 2011 Report
Gains and losses on assets and liabilities measured at fair value on a recurring basis using significant unobservable inputs (level 3)The gains and losses relating to the assets and liabilities measured at fair value using significant unobservable inputs (level 3) for the three months ended 31 March 2010 and 2011 were as follows:
Other assets measured at net asset valueOther assets measured at net asset value as of 31 December 2010 and 31 March 2011 were as follows:
The hedge fund investments employ a variety of strategies including global macro, relative value, and event driven strategies across various asset classes including long/short equity and credit investments.
The private equity direct portfolio consists of equity and equity-like investments directly in other companies. These investments have no contractual term and are generally held based on financial or strategic intent.
Private equity and real estate funds generally have limitations imposed on the amount of redemptions from the fund during the redemption period due to illiquidity of the underlying investments. Fees may apply for redemptions or transferring of interest to other parties. Distributions are expected to be received from these funds as the underlying assets are liquidated over the life of the fund, which is generally from ten to twelve years.
The redemption frequency of hedge funds varies depending upon the manager as well as the nature of the underlying product. Additionally, certain funds may impose lock-up periods and redemption gates as defined in the terms of the individual investment agreement.
Fair value optionThe fair value option under the Financial Instruments Topic permits the choice to measure specified financial assets and liabilities at fair value on an instrument-by-instrument basis.
The Group elected the fair value option for positions in the following line items in the balance sheet:
Fixed income securities tradingThe Group elected the fair value option for the specific investments acquired within a transaction. These securities are classified as debt securities under the Group’s accounting policies. Upon election of the fair value option the securities were classified as trading, with changes in fair value recorded in earnings. The primary reason for electing the fair value option is to mitigate volatility in earnings as a result of using different measurement attributes. In the second quarter of 2010, these fixed income securities matured.
USD millions2010
Fair value2011
Fair valueUnfunded
commitmentsRedemption frequency
(if currently eligible)Redemption
notice period
Private equity funds 646 674 538 non-redeemable na
Hedge funds 332 308 redeemable1 90 – 180 days2
Private equity direct 232 242 non-redeemable na
Real estate funds 168 183 62 non-redeemable3 na
Total 1 378 1 407 600
1 The redemption frequency varies from monthly to up to three years.2 Cash distribution can be delayed for up to three years depending on the sale of the underlyings.3 One exception is a real estate fund that can be redeemed annually based on a 90-day notice period. This redeemable fund had a fair value of USD 16.6 million as of
31 March 2011.
USD millions 2010 2011
Gains/losses included in net income for the period 389 268Whereof change in unrealised gains/losses relating to assets and liabilities still held at the reporting date 278 189

Notes to the Group financial statements (unaudited)
Swiss Re First Quarter 2011 Report 39
Equity securities tradingThe Group elected the fair value option for an investment previously classified as available-for-sale within other invested assets in the balance sheet. The Group economically hedges the investment with derivative instruments that offset this exposure. The changes in fair value of the derivatives are recorded in earnings. Electing the fair value option eliminates the mismatch previously caused by the economic hedging of the investment and reduces the volatility in the income statement.
Liabilities for life and health policy benefitsThe Group elected the fair value option for existing guaranteed minimum death benefit (GMDB) reserves related to certain variable annuity contracts which are classified as universal life-type contracts. The Group has applied the fair value option as the equity risk associated with those contracts is managed on a fair value basis, and it is economically hedged with derivative options in the market.
Assets and liabilities measured at fair value pursuant to election of the fair value optionPursuant to the election of the fair value option for the items described, the balances as of 31 December 2010 and 31 March 2011 were as follows:
Changes in fair values for items measured at fair value pursuant to election of the fair value optionGains/losses included in earnings for items measured at fair value pursuant to election of the fair value option including foreign exchange impact for the three months ended 31 March 2010 and 2011 were as follows:
Fair value changes from fixed income securities trading and equity securities trading are reported in net realised investment gains/losses. Fair value changes from liabilities for life and health policy benefits are shown in life and health benefits.
USD millions 2010 2011
AssetsFixed income securities trading 11 252 11 982
of which at fair value pursuant to the fair value option 01 0Equity securities trading 19 513 19 619
of which at fair value pursuant to the fair value option 475 515LiabilitiesLiabilities for life and health policy benefits –39 551 –40 174
of which at fair value pursuant to the fair value option –271 –244
1 These fixed income securities matured in the second quarter of 2010. Related changes in fair values are presented in the table below.
USD millions 2010 2011
Fixed income securities trading –27Equity securities trading –14 40Liabilities for life and health policy benefits 40 27Total –1 67

Notes to the Group financial statements (unaudited)
40 Swiss Re First Quarter 2011 Report
4 Derivative financial instruments
The Group uses a variety of derivative financial instruments including swaps, options, forwards, credit derivatives and exchange-traded financial futures in its trading and hedging strategies, in line with the Group’s overall risk management strategy. The objectives include managing exposure to price, foreign currency and/or interest rate risk on planned or anticipated investment purchases, existing assets or liabilities, as well as locking in attractive investment conditions for future available funds.
The fair values represent the gross carrying value amounts at the reporting date for each class of derivative contract held or issued by the Group. The gross fair values are not an indication of credit risk, as many over-the-counter transactions are contracted and documented under ISDA master agreements or their equivalent. Management believes that such agreements provide for legally enforceable setoff in the event of default, which substantially reduces credit exposure.
Fair values and notional amounts of derivative financial instrumentsAs of 31 December 2010 and 31 March 2011, the fair values and notional amounts of the derivatives outstanding were as follows:
As of 31 December 2010 USD millions
Notional amount assets/liabilities
Fair value assets
Fair value liabilities
Carrying value assets/liabilities
Derivatives not designated as hedging instrumentsInterest rate contracts 452 349 4 646 –4 796 –150Foreign exchange contracts 41 372 1 270 –1 201 69Equity contracts 13 450 1 312 –710 602Credit contracts 53 087 1 583 –1 324 259Other contracts 28 949 423 –2 702 –2 279Total 589 207 9 234 –10 733 –1 499
Derivatives designated as hedging instrumentsInterest rate contracts 4582 582 –10 572Foreign exchange contracts 3 012 30 –15 15Total 7 594 612 –25 587
Total derivative financial instruments 596 801 9 846 –10 758 –912
Amount offsetWhere a right of setoff exists –5 437 5 437Due to cash collateral –1 123 335
Total net amount of derivative financial instruments 3 286 –4 986 –1 700
As of 31 March 2011USD millions
Notional amount assets/liabilities
Fair value assets
Fair value liabilities
Carrying value assets/liabilities
Derivatives not designated as hedging instrumentsInterest rate contracts 472 486 3 971 –4 094 –123Foreign exchange contracts 34 322 1 098 –1 142 –44Equity contracts 14 792 1 236 –745 491Credit contracts 46 875 1 329 –1 217 112Other contracts 28 375 435 –2 428 –1 993Total 596 850 8 069 –9 626 –1 557
Derivatives designated as hedging instrumentsInterest rate contracts 3 259 485 –4 481Foreign exchange contracts 2 270 106 –16 90Total 5 529 591 –20 571
Total derivative financial instruments 602 379 8 660 –9 646 –986
Amount offsetWhere a right of setoff exists –5 749 5 749Due to cash collateral –1 004 395
Total net amount of derivative financial instruments 1 907 –3 502 –1 595
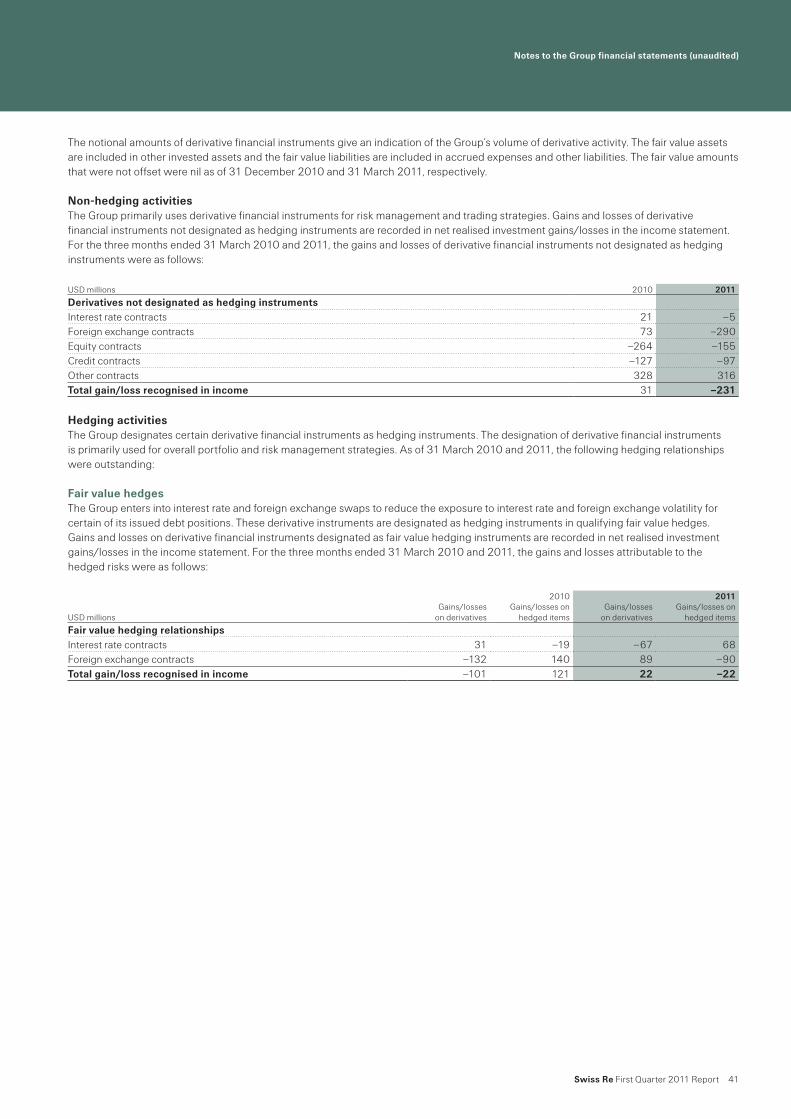
Notes to the Group financial statements (unaudited)
Swiss Re First Quarter 2011 Report 41
The notional amounts of derivative financial instruments give an indication of the Group’s volume of derivative activity. The fair value assets are included in other invested assets and the fair value liabilities are included in accrued expenses and other liabilities. The fair value amounts that were not offset were nil as of 31 December 2010 and 31 March 2011, respectively.
Non-hedging activitiesThe Group primarily uses derivative financial instruments for risk management and trading strategies. Gains and losses of derivative financial instruments not designated as hedging instruments are recorded in net realised investment gains/losses in the income statement. For the three months ended 31 March 2010 and 2011, the gains and losses of derivative financial instruments not designated as hedging instruments were as follows:
Hedging activitiesThe Group designates certain derivative financial instruments as hedging instruments. The designation of derivative financial instruments is primarily used for overall portfolio and risk management strategies. As of 31 March 2010 and 2011, the following hedging relationships were outstanding:
Fair value hedgesThe Group enters into interest rate and foreign exchange swaps to reduce the exposure to interest rate and foreign exchange volatility for certain of its issued debt positions. These derivative instruments are designated as hedging instruments in qualifying fair value hedges. Gains and losses on derivative financial instruments designated as fair value hedging instruments are recorded in net realised investment gains/losses in the income statement. For the three months ended 31 March 2010 and 2011, the gains and losses attributable to the hedged risks were as follows:
USD millions 2010 2011
Derivatives not designated as hedging instrumentsInterest rate contracts 21 –5Foreign exchange contracts 73 –290Equity contracts –264 –155Credit contracts –127 –97Other contracts 328 316Total gain/loss recognised in income 31 –231
2010 2011 USD millions
Gains/losses on derivatives
Gains/losses on hedged items
Gains/losses on derivatives
Gains/losses on hedged items
Fair value hedging relationshipsInterest rate contracts 31 –19 –67 68Foreign exchange contracts –132 140 89 –90Total gain/loss recognised in income –101 121 22 –22

Notes to the Group financial statements (unaudited)
42 Swiss Re First Quarter 2011 Report
Hedges of the net investment in foreign operationsThe Group designates non-derivative monetary financial instruments as hedging the foreign currency exposure of its net investment in certain foreign operations.
For the year ended 31 December 2010 and the three months ended 31 March 2011, the Group recorded an accumulated net unrealised foreign currency remeasurement gain of USD 171 million and a loss of USD 87 million, respectively, in shareholders’ equity. These offset translation gains and losses on the hedged net investment.
Maximum potential lossIn consideration of the rights of setoff and the qualifying master netting arrangements with various counterparties, the maximum potential loss as of 31 December 2010 and 31 March 2011 was approximately USD 4 409 million and USD 2 911 million, respectively. The maximum potential loss is based on the positive market replacement cost assuming non-performance of all counterparties, net of cash collateral.
Credit risk-related contingent featuresCertain derivative instruments held by the Group contain provisions that require its debt to maintain an investment-grade credit rating. If the Group’s credit rating were downgraded or no longer rated, the counterparties could request immediate payment, guarantee or an ongoing full overnight collateralisation on derivative instruments in net liability positions.
The total fair value of derivative financial instruments containing credit risk-related contingent features amounted to USD 1 975 million and USD 1 843 million as of 31 December 2010 and 31 March 2011, respectively. For derivative financial instruments containing credit risk-related contingent features the Group posted collateral of USD 335 million and USD 396 million as of 31 December 2010 and 31 March 2011, respectively. In the event of a reduction of the Group’s credit rating to below investment grade, a fair value of USD 1 447 million additional collateral would have had to be posted as of 31 March 2011. The total equals the amount needed to settle the instruments immediately as of 31 December 2010 and 31 March 2011.

Notes to the Group financial statements (unaudited)
Swiss Re First Quarter 2011 Report 43
Credit derivatives written/soldThe Group writes/sells credit derivatives, including credit default swaps, credit spread options and credit index products, and total return swaps. The total return swaps, for which the Group assumes asset risk mainly of variable interest entities, qualify as guarantees under FASB ASC Topic 460. These activities are part of the Group’s overall portfolio and risk management strategies. The events that could require the Group to perform include bankruptcy, default, obligation acceleration or moratorium of the credit derivative’s underlying.
The following tables show the fair values and the maximum potential payout of the credit derivatives written/sold as of 31 December 2010 and 31 March 2011, categorised by the type of credit derivative and credit spreads, which were based on external market data. The fair values represent the gross carrying values, excluding the effects of netting under ISDA master agreements and cash collateral netting. The maximum potential payout is based on the notional values of the derivatives and represents the gross undiscounted future payments the Group would be required to make, assuming the default of all credit derivatives’ underlyings.
The fair values of the credit derivatives written/sold do not represent the Group’s effective net exposure as the ISDA master agreement and the cash collateral netting are excluded.
The Group has purchased protection to manage the performance/payment risks related to credit derivatives. As of 31 December 2010 and 31 March 2011, the total purchased credit protection based on notional values was USD 30 304 million and USD 26 320 million, respectively. Thereof USD 12 025 million and USD 11 260 million, respectively, were related to identical underlyings for which the Group sold credit protection. For tranched indexes and baskets, only matching tranches of the respective index were determined as identical. In addition to the purchased credit protection, the Group manages the performance/payment risks through a correlation hedge, which is established with non-identical offsetting positions.
The maximum potential payout is based on notional values of the credit derivatives. The Group enters into total return swaps mainly with variable interest entities which issue insurance-linked and credit-linked securities.
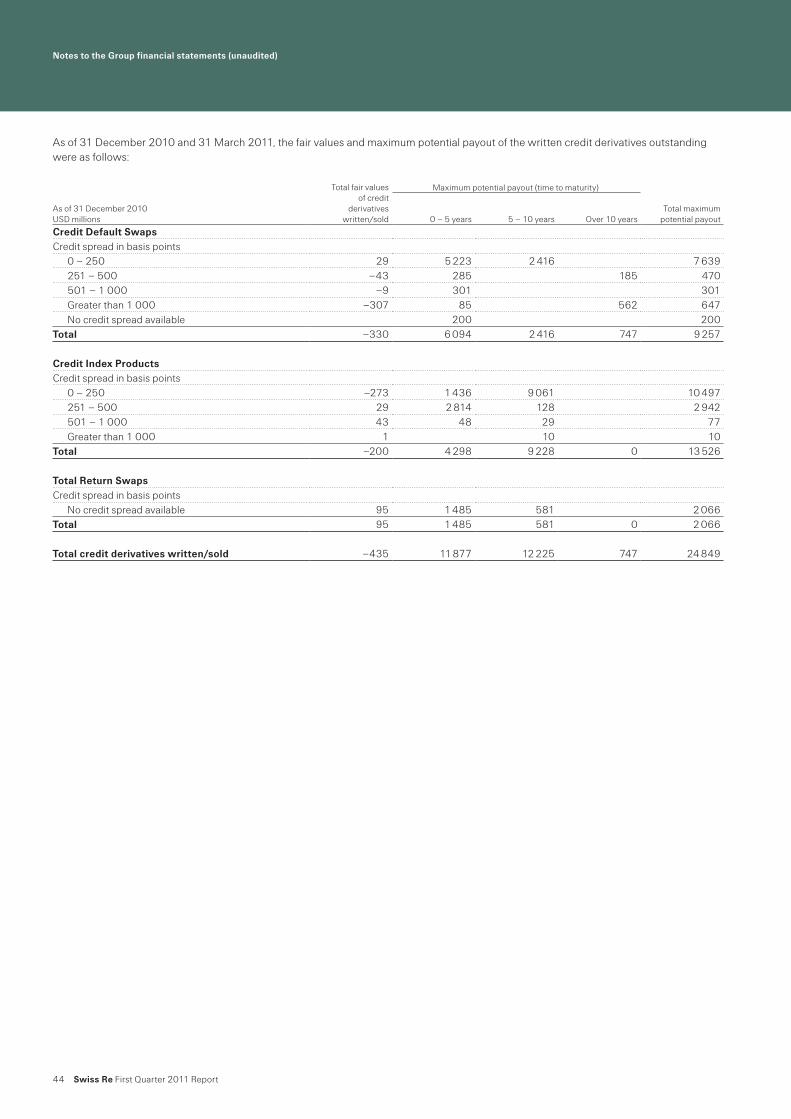
Notes to the Group financial statements (unaudited)
44 Swiss Re First Quarter 2011 Report
As of 31 December 2010 and 31 March 2011, the fair values and maximum potential payout of the written credit derivatives outstanding were as follows:
Total fair values of credit
derivatives written/sold
Maximum potential payout (time to maturity)
Total maximum potential payout
As of 31 December 2010 USD millions 0 – 5 years 5 – 10 years Over 10 years
Credit Default SwapsCredit spread in basis points
0 – 250 29 5 223 2 416 7 639251 – 500 –43 285 185 470501 – 1 000 –9 301 301Greater than 1 000 –307 85 562 647No credit spread available 200 200
Total –330 6 094 2 416 747 9 257
Credit Index ProductsCredit spread in basis points
0 – 250 –273 1 436 9 061 10 497251 – 500 29 2 814 128 2 942501 – 1 000 43 48 29 77Greater than 1 000 1 10 10
Total –200 4 298 9 228 0 13 526
Total Return SwapsCredit spread in basis points
No credit spread available 95 1 485 581 2 066Total 95 1 485 581 0 2 066
Total credit derivatives written/sold –435 11 877 12 225 747 24 849

Notes to the Group financial statements (unaudited)
Swiss Re First Quarter 2011 Report 45
Total fair values of credit
derivatives written/sold
Maximum potential payout (time to maturity)
Total maximum potential payout
As of 31 March 2011USD millions 0 – 5 years 5 – 10 years Over 10 years
Credit Default SwapsCredit spread in basis points
0 – 250 –23 4 971 2 893 7 864251 – 500 –42 141 187 328501 – 1 000 –3 20 20Greater than 1 000 –277 2 557 559No credit spread available 200 200
Total –345 5 334 2 893 744 8 971
Credit Index ProductsCredit spread in basis points
0 – 250 –174 766 7 560 8 326251 – 500 –42 2 786 24 2 810501 – 1 000 0Greater than 1 000 75 202 246 448
Total –141 3 754 7 830 0 11 584
Total Return SwapsCredit spread in basis points
No credit spread available 130 1 416 581 1 997Total 130 1 416 581 0 1 997
Total credit derivatives written/sold –356 10 504 11 304 744 22 552
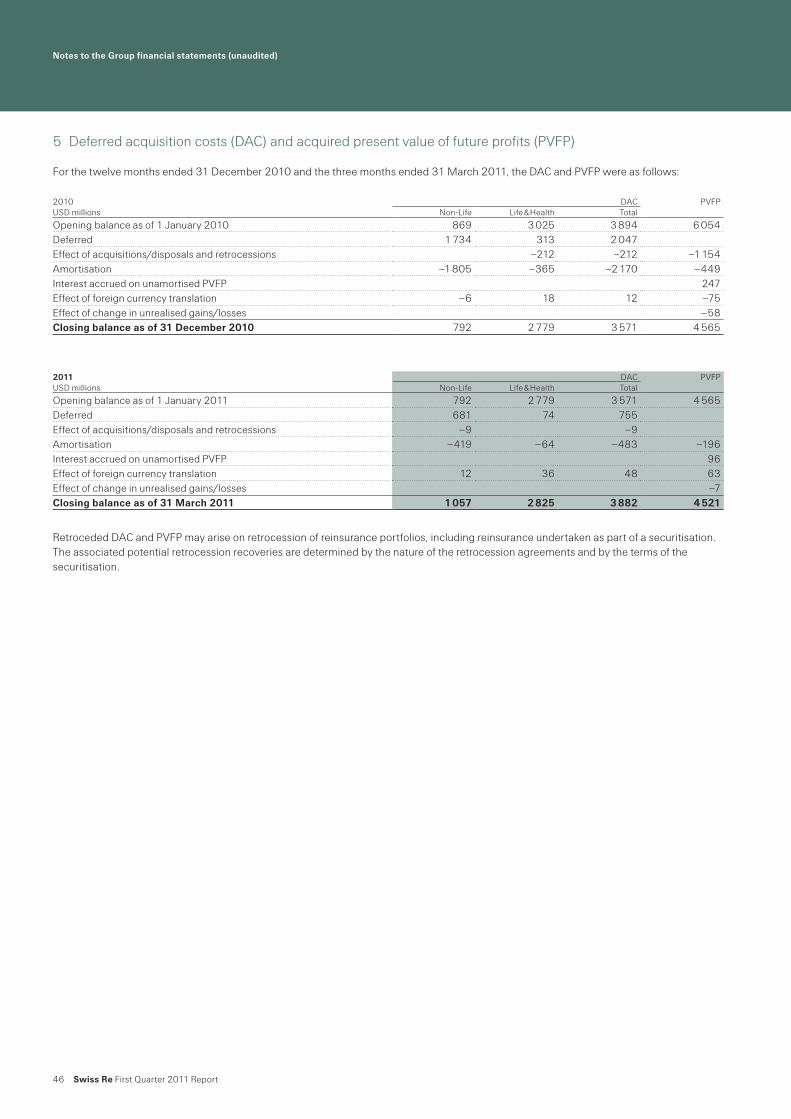
Notes to the Group financial statements (unaudited)
46 Swiss Re First Quarter 2011 Report
5 Deferred acquisition costs (DAC) and acquired present value of future profits (PVFP)
For the twelve months ended 31 December 2010 and the three months ended 31 March 2011, the DAC and PVFP were as follows:
Retroceded DAC and PVFP may arise on retrocession of reinsurance portfolios, including reinsurance undertaken as part of a securitisation. The associated potential retrocession recoveries are determined by the nature of the retrocession agreements and by the terms of the securitisation.
2010 DAC PVFPUSD millions Non-Life Life & Health Total
Opening balance as of 1 January 2010 869 3 025 3 894 6 054Deferred 1 734 313 2 047Effect of acquisitions/disposals and retrocessions –212 –212 –1 154Amortisation –1 805 –365 –2 170 –449Interest accrued on unamortised PVFP 247Effect of foreign currency translation –6 18 12 –75Effect of change in unrealised gains/losses –58Closing balance as of 31 December 2010 792 2 779 3 571 4 565
2011 DAC PVFPUSD millions Non-Life Life & Health Total
Opening balance as of 1 January 2011 792 2 779 3 571 4 565Deferred 681 74 755Effect of acquisitions/disposals and retrocessions –9 –9Amortisation –419 –64 –483 –196Interest accrued on unamortised PVFP 96Effect of foreign currency translation 12 36 48 63Effect of change in unrealised gains/losses –7Closing balance as of 31 March 2011 1 057 2 825 3 882 4 521

Notes to the Group financial statements (unaudited)
Swiss Re First Quarter 2011 Report 47
6 Debt
The Group enters into long and short-term debt arrangements to obtain funds for general corporate use and specific transaction financing. The Group defines short-term debt as debt having a maturity at the balance sheet date of less than one year and long-term debt as having a maturity of greater than one year. Interest expense is classified accordingly.
The Group’s debt as of 31 December 2010 and 31 March 2011 was as follows:
The Group uses debt for general corporate purposes and to fund discrete pools of operational leverage and financial intermediation assets. Operational leverage and financial intermediation are subject to asset and liability matching resulting in little to no risk that the assets will be insufficient to service and settle the liabilities. Debt used for operational leverage and financial intermediation is treated as operational debt and excluded by the rating agencies from financial leverage calculations. Certain debt positions are limited recourse, meaning the debtors’ claims are limited to assets underlying the financing. As of 31 December 2010 and 31 March 2011, debt related to operational leverage and financial intermediation amounted to USD 17.2 billion (thereof USD 7.5 billion limited recourse) and USD 15.8 billion (thereof USD 6.9 billion limited recourse), respectively.
Interest expense on long-term debtInterest expense on long-term debt for the periods ended 31 March 2010 and 2011 was as follows:
Long-term debt issued in 2011The Group did not issue any long-term debt in the three months ended 31 March 2011.
USD millions 2010 2011
Senior financial debt 33 35Senior financial debt – convertible perpetual capital instrument 3 966Senior operational debt 5 018 4 163Subordinated financial debt 1 781 1 794Short-term debt – financial and operational debt 10 798 5 992
Senior financial debt 2 590 2 628Senior operational debt 6 976 6 351Subordinated financial debt 3 634 3 737Subordinated operational debt 5 227 5 330Long-term debt – financial and operational debt 18 427 18 046
Total carrying value 29 225 24 038Total fair value 28 017 22 934
USD millions 2010 2011
Senior financial debt 20 20Senior operational debt 86 81Subordinated financial debt 70 56Subordinated operational debt 62 63Total 238 220

Notes to the Group financial statements (unaudited)
48 Swiss Re First Quarter 2011 Report
7 Reinsurance information
For the three months ended 31 March
Premiums written, premiums earned and fees assessed against policyholders
Claims and claim adjustment expenses
Acquisition costs
2010 2011USD millions Non-Life Life & Health Total Non-Life Life & Health Total
Premiums writtenDirect 305 244 549 283 282 565Assumed 5 303 2 494 7 797 5 915 2 604 8 519Ceded –1 184 –503 –1 687 –1 258 –510 –1 768Total premiums written 4 424 2 235 6 659 4 940 2 376 7 316
Premiums earnedDirect 429 242 671 421 281 702Assumed 3 184 2 375 5 559 2 922 2 460 5 382Ceded –761 –501 –1 262 –692 –510 –1 202Total premiums earned 2 852 2 116 4 968 2 651 2 231 4 882
Fee income from policyholdersDirect 165 165 166 166Assumed 60 60 59 59Ceded –4 –4 –4 –4Total fee income from policyholders 221 221 221 221
2010 2011USD millions Non-Life Life & Health Total Non-Life Life & Health Total
Claims paidGross –2 538 –2 608 –5 146 –2 572 –2 723 –5 295Retro 356 142 498 467 588 1 055Net –2 182 –2 466 –4 648 –2 105 –2 135 –4 240
Change in unpaid claims and claim adjustment expenses; life and health benefits
Gross –80 56 –24 –2 164 131 –2 033Retro –90 385 295 749 –24 725Net –170 441 271 –1 415 107 –1 308
Claims and claim adjustment expenses; life and health benefits –2 352 –2 025 –4 377 –3 520 –2 028 –5 548
2010 2011USD millions Non-Life Life & Health Total Non-Life Life & Health Total
Acquisition costsAcquisition costs, gross –721 –498 –1 219 –648 –533 –1 181Acquisition costs, retro 229 99 328 217 78 295
Acquisition costs, net –492 –399 –891 –431 –455 –886
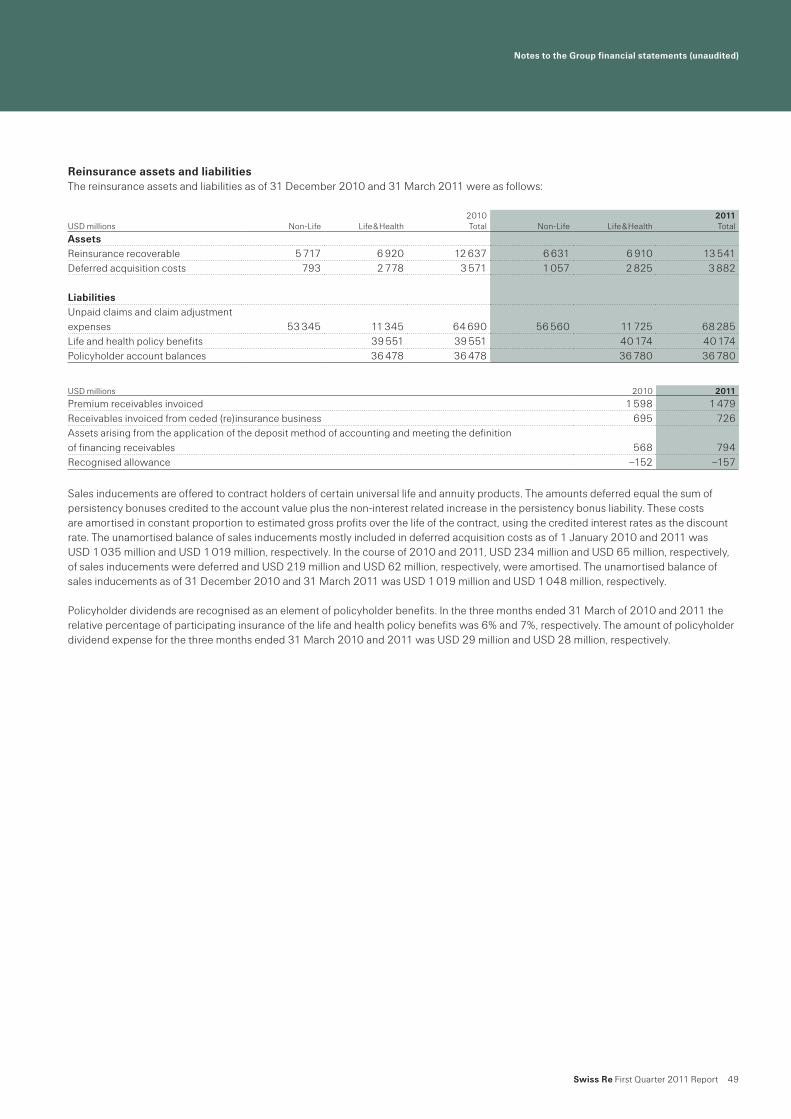
Notes to the Group financial statements (unaudited)
Swiss Re First Quarter 2011 Report 49
Reinsurance assets and liabilitiesThe reinsurance assets and liabilities as of 31 December 2010 and 31 March 2011 were as follows:
Sales inducements are offered to contract holders of certain universal life and annuity products. The amounts deferred equal the sum of persistency bonuses credited to the account value plus the non-interest related increase in the persistency bonus liability. These costs are amortised in constant proportion to estimated gross profits over the life of the contract, using the credited interest rates as the discount rate. The unamortised balance of sales inducements mostly included in deferred acquisition costs as of 1 January 2010 and 2011 was USD 1 035 million and USD 1 019 million, respectively. In the course of 2010 and 2011, USD 234 million and USD 65 million, respectively, of sales inducements were deferred and USD 219 million and USD 62 million, respectively, were amortised. The unamortised balance of sales inducements as of 31 December 2010 and 31 March 2011 was USD 1 019 million and USD 1 048 million, respectively.
Policyholder dividends are recognised as an element of policyholder benefits. In the three months ended 31 March of 2010 and 2011 the relative percentage of participating insurance of the life and health policy benefits was 6% and 7%, respectively. The amount of policyholder dividend expense for the three months ended 31 March 2010 and 2011 was USD 29 million and USD 28 million, respectively.
2010 2011USD millions Non-Life Life & Health Total Non-Life Life & Health Total
AssetsReinsurance recoverable 5 717 6 920 12 637 6 631 6 910 13 541Deferred acquisition costs 793 2 778 3 571 1 057 2 825 3 882
LiabilitiesUnpaid claims and claim adjustment expenses 53 345 11 345 64 690 56 560 11 725 68 285Life and health policy benefits 39 551 39 551 40 174 40 174Policyholder account balances 36 478 36 478 36 780 36 780
USD millions 2010 2011
Premium receivables invoiced 1 598 1 479Receivables invoiced from ceded (re)insurance business 695 726Assets arising from the application of the deposit method of accounting and meeting the definition of financing receivables 568 794Recognised allowance –152 –157

Notes to the Group financial statements (unaudited)
50 Swiss Re First Quarter 2011 Report
8 Earnings per share
Earnings per share for the three months ended 31 March 2010 and 2011 were as follows:
The effects of debt conversion and the issuance of employee options, which totalled 13 105 370 shares for the three months ended 31 March 2011, have not been included in the diluted earnings / losses per share calculation because the impact of including these shares was antidilutive.
USD millions (except share data) 2010 2011
Basic earnings per shareNet income / loss 273 –644Non-controlling interests –47 –21Interest on convertible perpetual capital instrument –68Net income / loss attributable to common shareholders 158 –665Weighted average common shares outstanding 342 597 212 342 546 385Net income / loss per share in USD 0.46 –1.94Net income / loss per share in CHF1 0.49 –1.84
Effect of dilutive securitiesChange in income available to common shares due to convertible bondsChange in average number of shares due to convertible bonds and employee options 5 456 291
Diluted earnings per shareNet income assuming debt conversion and exercise of options 158Weighted average common shares outstanding 348 053 503Net income / loss per share in USD 0.45 –1.94Net income / loss per share in CHF1 0.48 –1.84
1 The translation from USD to CHF is shown for informational purposes only and has been calculated at the Group’s average exchange rates for the three months ended 31 March 2010 and 2011, respectively.

Notes to the Group financial statements (unaudited)
Swiss Re First Quarter 2011 Report 51
9 Benefit plans
Defined benefit pension plans and post-retirement benefitsThe Group sponsors various funded defined benefit pension plans. Employer contributions to the plans are charged to income on a basis which recognises the costs of pensions over the expected service lives of employees covered by the plans. The Group’s funding policy for these plans is to contribute annually at a rate that is intended to maintain a level percentage of compensation for the employees covered. A full actuarial valuation is prepared at least every three years.
The Group also provides certain healthcare and life insurance benefits for retired employees and their dependants. Employees become eligible for these benefits when they become eligible for pension benefits.
Components of net periodic benefit costThe components of pension and post-retirement cost for the three months ended 31 March 2010 and 2011 were as follows:
Employer’s contributions for 2011As of 31 March 2011, the Group contributed USD 55 million to its defined benefit pension plans and USD 4 million to other post-retirement plans, compared to USD 46 million and USD 4 million, respectively, in the same period of 2010.
The expected 2011 contributions to the defined benefit pension plans and to the post-retirement benefit plans, revised as of 31 March 2011 for latest information, amount to USD 142 million (31 March 2010: USD 124 million) and USD 15 million (31 March 2010: USD 14 million), respectively.
2010 USD millions Swiss plans Foreign plans Other benefits Total
Service cost (net of participant contributions) 24 3 1 28Interest cost 21 26 3 50Expected return on assets –31 –27 –58Amortisation of: Net gain / loss 2 4 –3 3 Prior service cost 2 –3 –1Net periodic benefit cost 18 6 –2 22
2011USD millions Swiss plans Foreign plans Other benefits Total
Service cost (net of participant contributions) 26 2 1 29Interest cost 21 26 3 50Expected return on assets –30 –26 –56Amortisation of: Net gain / loss 9 4 –3 10 Prior service cost 2 –3 –1Net periodic benefit cost 28 6 –2 32

Notes to the Group financial statements (unaudited)
52 Swiss Re First Quarter 2011 Report
This page intentionally left blank
Notes to the Group financial statements (unaudited)
Swiss Re First Quarter 2011 Report 53
10 Information on business segments
The Group provides reinsurance, insurance and capital market solutions for clients that complement its (re)insurance offering throughout the world through its business segments. The business segments are determined by the organisational structure and by the way in which management reviews the operating result of the Group.
The Group presents three operating business segments: Property & Casualty, Life & Health and Asset Management. Items not allocated to these three business segments are included in the “Group items“ column.
The Property & Casualty segment consists of the following sub-segments: Property traditional, Casualty traditional, Specialty traditional and Non-traditional business. The Property & Casualty business segment includes Property & Casualty insurance-linked securities, Environmental & Commodity Markets business and, in the Specialty traditional sub-segment, Credit Reinsurance, Bank Trade Finance, and Credit securitisations.
The Life & Health segment continues to consist of the following sub-segments: Life traditional, Health traditional and Admin Re®. The Life & Health business segment includes variable annuity business and Life & Health insurance-linked securities.
The Asset Management business segment includes two separate sub-segments Credit & Rates and Equity & Alternative Investments resulting from the aggregation of Asset Management Risk Stripes. The Asset Management business segment includes proprietary returns on the Group’s invested fixed income securities, equity securities and alternative investments.
Group items include certain costs of Corporate Centre functions not allocated to the business segments, certain foreign exchange items, interest expenses on operating and financial debt and other items not considered for the performance of the operating segments. From 1 January 2011 non-core activities which are largely in run-off (formerly presented in the business segment Legacy) are being reported within Group items. 2010 comparatives are presented accordingly.
Certain investment results, including investment income and realised gains on unit-linked business, with-profit business and reinsurance derivatives, are excluded from the performance of the Asset Management business segment and directly allocated to the Property & Casualty and Life & Health business segments.
The allocation of investment result to Property & Casualty and Life & Health is determined based on US GAAP (re)insurance liabilities. The allocation methodology applies a risk-free return to the nominal net reserves at the end of the prior quarter. The risk-free interest rate applied to the reserves is determined by currency and duration of the underlying Property & Casualty and Life & Health reserves. The “Allocation” column eliminates the calculated investment result allocated to either the Property & Casualty or the Life & Health business segments.
The accounting policies of the business segments are in line with those described in the summary of significant accounting policies (see Note 1 to the Group’s annual consolidated financial statements).

Notes to the Group financial statements (unaudited)
54 Swiss Re First Quarter 2011 Report
a) Business segment resultsFor the three months ended 31 March
The allocation is based on technical reserves and other information, including duration of the underlying liabilities, and was allocated in the three months ended 31 March of 2010 and 2011 as follows:
2010 USD millions
Property & Casualty Life & Health
Asset Management Group items Allocation Total
RevenuesPremiums earned 2 851 2 116 1 4 968Fee income from policyholders 221 221Net investment income / loss 472 752 1 022 114 –881 1 479Net realised investment gains / losses 52 1 375 –91 44 1 380Other revenues 6 12 18Total revenues 3 375 4 464 937 171 –881 8 066
ExpensesClaims and claim adjustment expenses; life and health benefits –2 352 –2 025 –4 377Return credited to policyholders –1 610 –1 610Acquisition costs –494 –399 2 –891Other expenses –270 –185 –115 –570Interest expenses –278 –278Total expenses –3 116 –4 219 0 –391 0 –7 726
Operating income / loss 259 245 937 –220 –881 340
2011 USD millions
Property & Casualty Life & Health
Asset Management Group items Allocation Total
RevenuesPremiums earned 2 630 2 231 21 4 882Fee income from policyholders 221 221Net investment income / loss 360 735 959 64 –756 1 362Net realised investment gains / losses 8 –11 261 –61 197Other revenues 6 5 11Total revenues 2 998 3 176 1 226 29 –756 6 673
ExpensesClaims and claim adjustment expenses; life and health benefits –3 520 –2 028 –5 548Return credited to policyholders –363 –363Acquisition costs –426 –455 –5 –886Other expenses –285 –186 –104 –575Interest expenses –219 –219Total expenses –4 231 –3 032 0 –328 0 –7 591
Operating income / loss –1 233 144 1 226 –299 –756 –918
USD millions, for the three months ended 31 March 2010 Property & Casualty Life & Health Asset Management Allocation
Net investment income / loss 427 454 0 –881
USD millions, for the three months ended 31 March 2011 Property & Casualty Life & Health Asset Management Allocation
Net investment income / loss 330 426 0 –756

Notes to the Group financial statements (unaudited)
Swiss Re First Quarter 2011 Report 55
b) Property & Casualty business segment – by line of businessFor the three months ended 31 March
2010 USD millions
Property traditional
Casualty traditional
Specialty traditional Total traditional Non-traditional Total
RevenuesPremiums earned 1 145 863 732 2 740 111 2 851Net investment income 39 308 75 422 50 472Net realised investment gains / losses –3 –2 –5 57 52Other revenues 0Total revenues 1 181 1 171 805 3 157 218 3 375
ExpensesClaims and claim adjustment expenses –1 149 –710 –436 –2 295 –57 –2 352Acquisition costs –143 –166 –135 –444 –50 –494Other expenses –109 –102 –47 –258 –12 –270Total expenses –1 401 –978 –618 –2 997 –119 –3 116
Operating income / loss –220 193 187 160 99 259
Claims ratio in % 100.4 82.2 59.5 83.8Expense ratio in % 22.0 31.1 24.9 25.6Combined ratio in % 122.4 113.3 84.4 109.4
2011 USD millions
Property traditional
Casualty traditional
Specialty traditional Total traditional Non-traditional Total
RevenuesPremiums earned 1 117 797 621 2 535 95 2 630Net investment income 10 268 48 326 34 360Net realised investment gains / losses –4 –4 12 8Other revenues 0Total revenues 1 127 1 065 665 2 857 141 2 998
ExpensesClaims and claim adjustment expenses –2 645 –488 –329 –3 462 –58 –3 520Acquisition costs –130 –145 –138 –413 –13 –426Other expenses –121 –96 –57 –274 –11 –285Total expenses –2 896 –729 –524 –4 149 –82 –4 231
Operating income / loss –1 769 336 141 –1 292 59 –1 233
Claims ratio in % 236.8 61.3 53.0 136.6Expense ratio in % 22.5 30.2 31.4 27.1Combined ratio in % 259.3 91.5 84.4 163.7
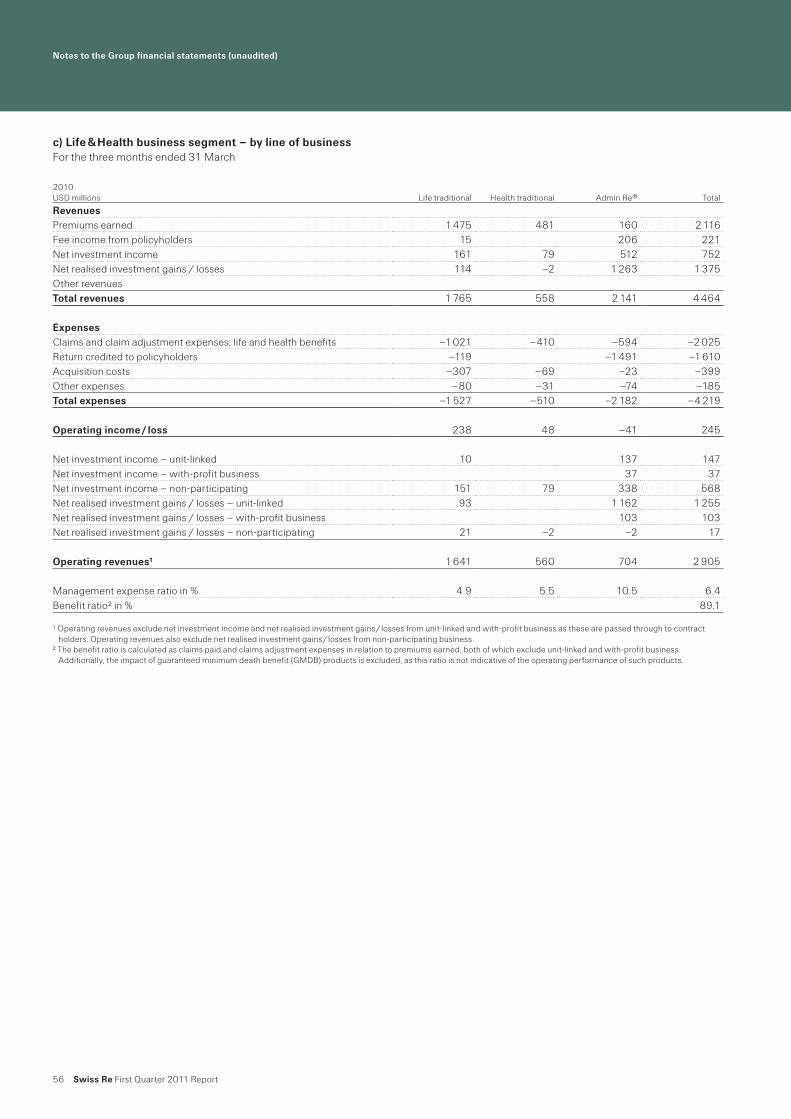
Notes to the Group financial statements (unaudited)
56 Swiss Re First Quarter 2011 Report
c) Life & Health business segment – by line of business For the three months ended 31 March
2010USD millions Life traditional Health traditional Admin Re® Total
RevenuesPremiums earned 1 475 481 160 2 116Fee income from policyholders 15 206 221Net investment income 161 79 512 752Net realised investment gains / losses 114 –2 1 263 1 375Other revenuesTotal revenues 1 765 558 2 141 4 464
ExpensesClaims and claim adjustment expenses; life and health benefits –1 021 –410 –594 –2 025Return credited to policyholders –119 –1 491 –1 610Acquisition costs –307 –69 –23 –399Other expenses –80 –31 –74 –185Total expenses –1 527 –510 –2 182 –4 219
Operating income / loss 238 48 –41 245
Net investment income – unit-linked 10 137 147Net investment income – with-profit business 37 37Net investment income – non-participating 151 79 338 568Net realised investment gains / losses – unit-linked 93 1 162 1 255Net realised investment gains / losses – with-profit business 103 103Net realised investment gains / losses – non-participating 21 –2 –2 17
Operating revenues1 1 641 560 704 2 905
Management expense ratio in % 4.9 5.5 10.5 6.4Benefit ratio2 in % 89.1
1 Operating revenues exclude net investment income and net realised investment gains / losses from unit-linked and with-profit business as these are passed through to contract holders. Operating revenues also exclude net realised investment gains / losses from non-participating business.
2 The benefit ratio is calculated as claims paid and claims adjustment expenses in relation to premiums earned, both of which exclude unit-linked and with-profit business. Additionally, the impact of guaranteed minimum death benefit (GMDB) products is excluded, as this ratio is not indicative of the operating performance of such products.
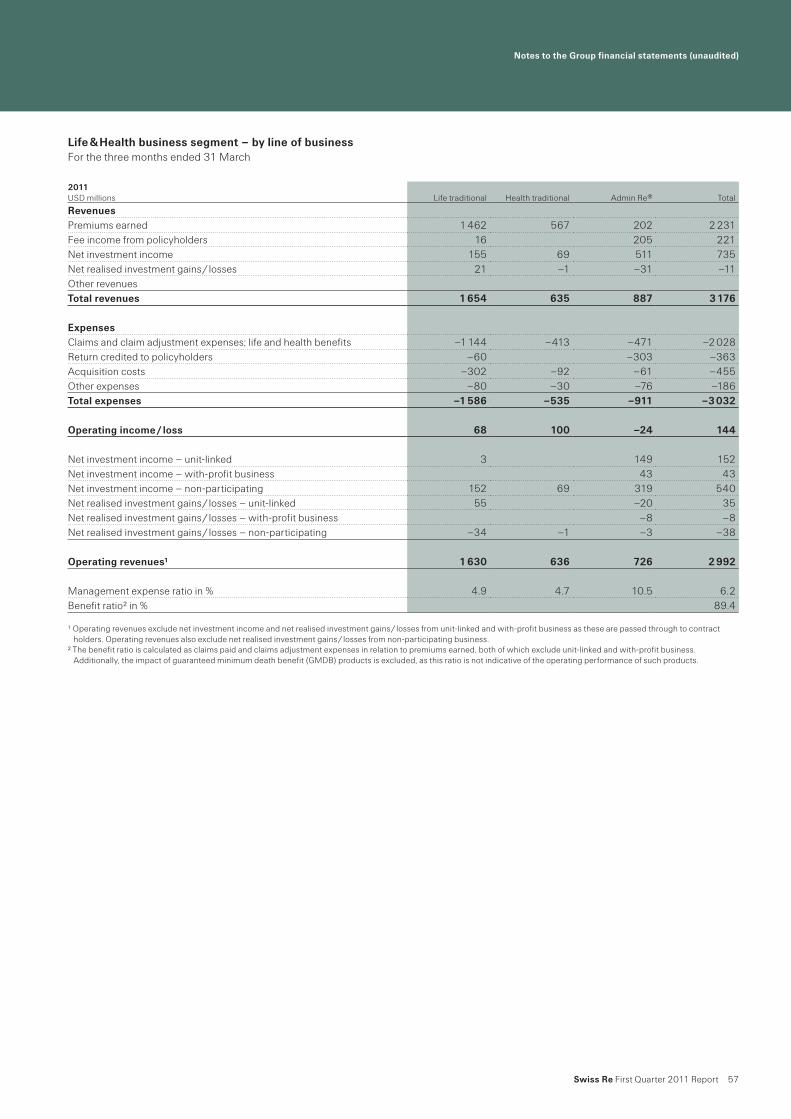
Notes to the Group financial statements (unaudited)
Swiss Re First Quarter 2011 Report 57
Life & Health business segment – by line of business For the three months ended 31 March
2011USD millions Life traditional Health traditional Admin Re® Total
RevenuesPremiums earned 1 462 567 202 2 231Fee income from policyholders 16 205 221Net investment income 155 69 511 735Net realised investment gains / losses 21 –1 –31 –11Other revenuesTotal revenues 1 654 635 887 3 176
ExpensesClaims and claim adjustment expenses; life and health benefits –1 144 –413 –471 –2 028Return credited to policyholders –60 –303 –363Acquisition costs –302 –92 –61 –455Other expenses –80 –30 –76 –186Total expenses –1 586 –535 –911 –3 032
Operating income / loss 68 100 –24 144
Net investment income – unit-linked 3 149 152Net investment income – with-profit business 43 43Net investment income – non-participating 152 69 319 540Net realised investment gains / losses – unit-linked 55 –20 35Net realised investment gains / losses – with-profit business –8 –8Net realised investment gains / losses – non-participating –34 –1 –3 –38
Operating revenues1 1 630 636 726 2 992
Management expense ratio in % 4.9 4.7 10.5 6.2Benefit ratio2 in % 89.4
1 Operating revenues exclude net investment income and net realised investment gains / losses from unit-linked and with-profit business as these are passed through to contract holders. Operating revenues also exclude net realised investment gains / losses from non-participating business.
2 The benefit ratio is calculated as claims paid and claims adjustment expenses in relation to premiums earned, both of which exclude unit-linked and with-profit business. Additionally, the impact of guaranteed minimum death benefit (GMDB) products is excluded, as this ratio is not indicative of the operating performance of such products.
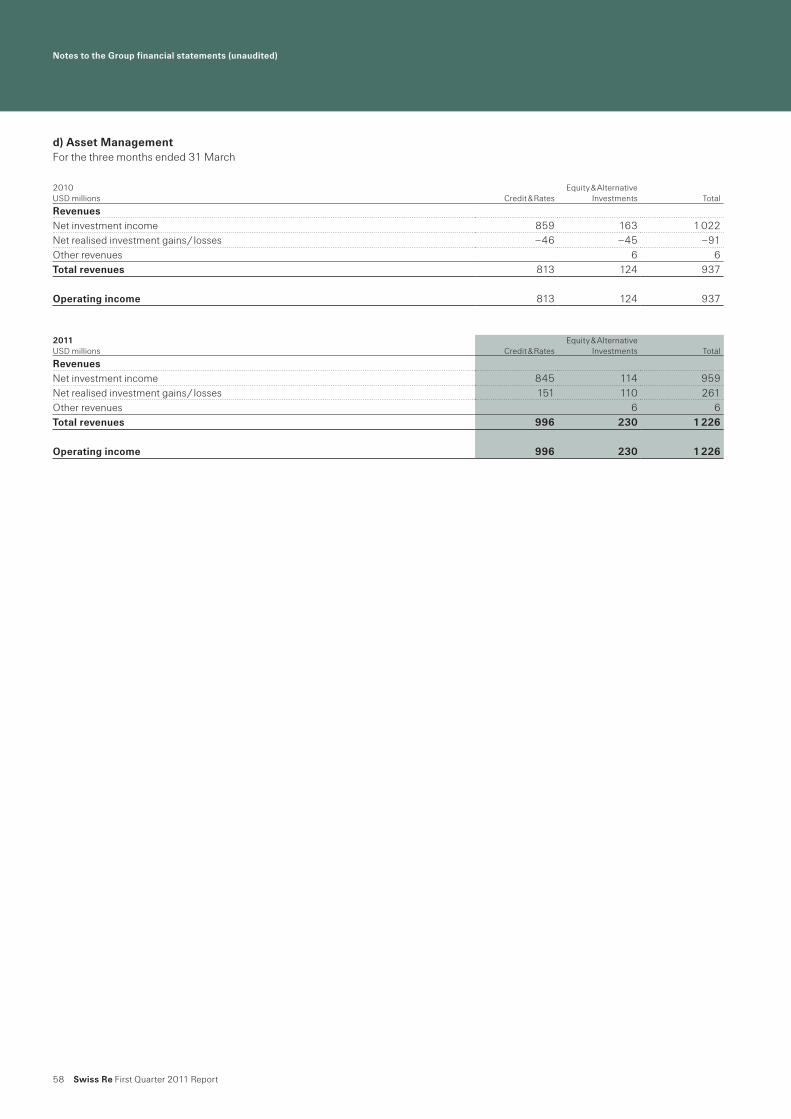
Notes to the Group financial statements (unaudited)
58 Swiss Re First Quarter 2011 Report
d) Asset ManagementFor the three months ended 31 March
2010 USD millions Credit & Rates
Equity & Alternative Investments Total
RevenuesNet investment income 859 163 1 022Net realised investment gains / losses –46 –45 –91Other revenues 6 6Total revenues 813 124 937
Operating income 813 124 937
2011 USD millions Credit & Rates
Equity & Alternative Investments Total
RevenuesNet investment income 845 114 959Net realised investment gains / losses 151 110 261Other revenues 6 6Total revenues 996 230 1 226
Operating income 996 230 1 226

Notes to the Group financial statements (unaudited)
Swiss Re First Quarter 2011 Report 59
11 Variable interest entities
Swiss Re Group enters into arrangements with variable interest entities (VIEs) in the normal course of business. The involvement ranges from being a passive investor to designing, structuring, and managing the VIEs. The variable interests held by the Group arise as a result of the Group’s involvement in a modified coinsurance agreement, certain insurance-linked and credit-linked securitisations, swaps in trusts, debt financing and other entities, which meet the definition of a VIE.
When analysing the status of an entity, the Group mainly assesses if (1) the equity is sufficient to finance the entity’s activities without additional subordinated financial support, (2) the equity holders have the right to make significant decisions affecting the entity’s operations, and (3) the holders of the voting rights substantively participate in the gains and losses of the entity. When one of these criteria is not met, the entity is considered a VIE and needs to be assessed for consolidation under the VIE section of the Consolidation Topic.
The party that has a controlling financial interest is called the primary beneficiary and consolidates the VIE. An enterprise is deemed to have a controlling financial interest if it has both of the following: ̤ the power to direct the activities of the VIE that most significantly impact the entity’s economic performance; and ̤ the obligation to absorb losses of the entity that could potentially be significant to the VIE or the right to receive benefits from the entity
that could potentially be significant to the VIE.
The Group assesses for all its variable interests in VIEs whether it has a controlling financial interest in these entities and, thus, is the primary beneficiary. For this, the Group identifies the activities that most significantly impact the entity’s performance and determines whether the Group has the power to direct those activities. In conducting the analysis, the Group considers the purpose, the design, and the risks that the entity was designed to create and pass through to its variable interest holders. In a second step, the Group assesses if it has the obligation to absorb losses or if it has the right to receive benefits of the VIE that could potentially be significant to the entity. If both criteria are met, the Group has a controlling financial interest in the VIE and consolidates the entity.
Whenever facts and circumstances change, a review is undertaken of the impact these changes could have on the consolidation assessment previously performed. When the assessment might be impacted, a reassessment to determine the primary beneficiary is performed.
Notes to the Group financial statements (unaudited)
60 Swiss Re First Quarter 2011 Report
Modified coinsurance agreementThe Group assumes insurance risk via a modified coinsurance agreement from a direct insurer, which qualifies as a VIE. The Group assumes the majority of the mortality and investment risk in the VIE. In addition, the Group has the power over the investment management and policyholder administration. As these are the activities that most significantly impact the entity’s economic performance, the Group qualifies as the primary beneficiary and consolidates the entity. The Group will incur losses if mortality risk or the investment returns of the entity develop unfavourably.
The total assets of the modified coinsurance vehicles in which the Group is the primary beneficiary were USD 3 177 million as of 31 March 2011.
Insurance-linked and credit-linked securitisationsThe insurance-linked and credit-linked securitisations transfer pre-existing insurance or credit risk to the capital markets through the issuance of insurance-linked or credit-linked securities. In insurance-linked securitisations, the securitisation vehicle assumes the insurance risk through insurance or derivative contracts. In credit-linked securitisations, the securitisation vehicle assumes the credit risk through credit default swaps. The securitisation vehicle generally retains the issuance proceeds as collateral. The collateral held predominantly consists of investment-grade securities.
Typically, the variable interests held by the Group arise through ownership of insurance-linked and credit-linked securities, or through protection provided under a total return swap for the principle of the collateral held by the securitisation vehicle.
Generally, the activities of a securitisation vehicle are pre-determined at formation. There are substantially no ongoing activities during the life of the VIE that could significantly impact the economic performance of the vehicle. Consequently, the main focus to identify the primary beneficiary is on the activities performed and decisions made when the VIE was designed. Typically, the Group is considered the primary beneficiary of a securitisation vehicle when the Group acts as a sponsor of risk passed to the VIE and enters at the same time in a total return swap with the VIE to protect the VIE’s assets from market risk. Under the total return swap, the Group would incur losses when some or all of the securities held as collateral in the securitisation vehicle decline in value or default. Therefore, the Group’s maximum exposure to loss equals the principal amount of the collateral protected under the total return swap.
As of 31 March 2011, the total assets of the insurance-linked and credit-linked securitisation vehicles in which the Group holds variable interests but is not the primary beneficiary were USD 5 243 million. The total assets of the vehicles in which the Group is the primary beneficiary were USD 1 070 million.
Swaps in trustsThe Group provides risk management services to certain asset securitisation trusts which qualify as VIEs. As the involvement of the Group is limited to interest rate and foreign exchange derivatives, Swiss Re does not have power to direct any activities of the trusts and therefore does not qualify as primary beneficiary of any of these trusts. These activities are in run-off.
Debt financing vehiclesDebt financing vehicles issue preference shares or loan notes to provide the Group with funding. The Group is partially exposed to the asset risk by holding equity rights or by protecting some of the assets held by the VIEs via guarantees or derivative contracts. The assets held by the VIEs consist of investment-grade securities, structured products, hedge fund units, derivatives and others.
Certain debt financing vehicles are consolidated as the Group has power over the investment management, considered to be the activity that most significantly impacts the entity’s economic performance. In addition, the Group absorbs the variability of the investment return so that both criteria for a controlling financial interest are met.
As of 31 March 2011, the total assets of the debt financing vehicles in which the Group holds variable interests but is not the primary beneficiary were USD 5 092 million. The total assets of the vehicles in which the Group is the primary beneficiary were USD 8 183 million.
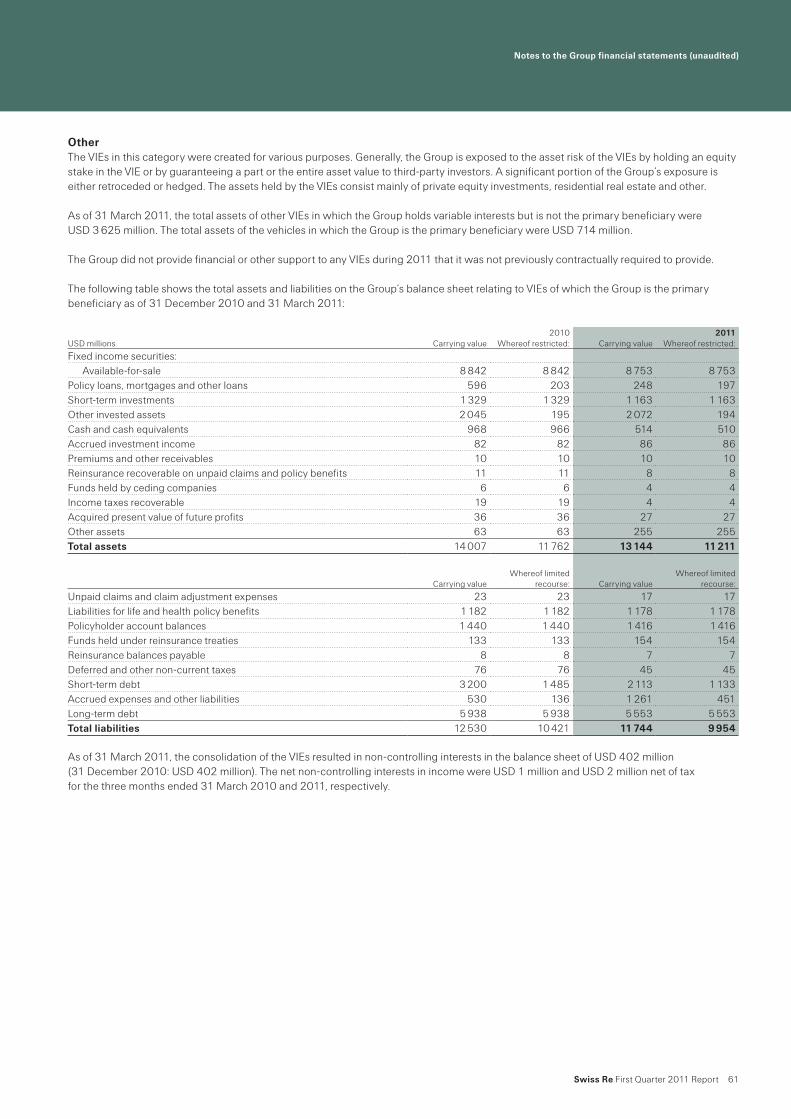
Notes to the Group financial statements (unaudited)
Swiss Re First Quarter 2011 Report 61
OtherThe VIEs in this category were created for various purposes. Generally, the Group is exposed to the asset risk of the VIEs by holding an equity stake in the VIE or by guaranteeing a part or the entire asset value to third-party investors. A significant portion of the Group’s exposure is either retroceded or hedged. The assets held by the VIEs consist mainly of private equity investments, residential real estate and other.
As of 31 March 2011, the total assets of other VIEs in which the Group holds variable interests but is not the primary beneficiary were USD 3 625 million. The total assets of the vehicles in which the Group is the primary beneficiary were USD 714 million.
The Group did not provide financial or other support to any VIEs during 2011 that it was not previously contractually required to provide.
The following table shows the total assets and liabilities on the Group’s balance sheet relating to VIEs of which the Group is the primary beneficiary as of 31 December 2010 and 31 March 2011:
As of 31 March 2011, the consolidation of the VIEs resulted in non-controlling interests in the balance sheet of USD 402 million (31 December 2010: USD 402 million). The net non-controlling interests in income were USD 1 million and USD 2 million net of tax for the three months ended 31 March 2010 and 2011, respectively.
2010 2011USD millions Carrying value Whereof restricted: Carrying value Whereof restricted:
Fixed income securities:Available-for-sale 8 842 8 842 8 753 8 753
Policy loans, mortgages and other loans 596 203 248 197Short-term investments 1 329 1 329 1 163 1 163Other invested assets 2 045 195 2 072 194Cash and cash equivalents 968 966 514 510Accrued investment income 82 82 86 86Premiums and other receivables 10 10 10 10Reinsurance recoverable on unpaid claims and policy benefits 11 11 8 8Funds held by ceding companies 6 6 4 4Income taxes recoverable 19 19 4 4Acquired present value of future profits 36 36 27 27Other assets 63 63 255 255Total assets 14 007 11 762 13 144 11 211
Carrying valueWhereof limited
recourse: Carrying valueWhereof limited
recourse:
Unpaid claims and claim adjustment expenses 23 23 17 17Liabilities for life and health policy benefits 1 182 1 182 1 178 1 178Policyholder account balances 1 440 1 440 1 416 1 416Funds held under reinsurance treaties 133 133 154 154Reinsurance balances payable 8 8 7 7Deferred and other non-current taxes 76 76 45 45Short-term debt 3 200 1 485 2 113 1 133Accrued expenses and other liabilities 530 136 1 261 451Long-term debt 5 938 5 938 5 553 5 553Total liabilities 12 530 10 421 11 744 9 954

Notes to the Group financial statements (unaudited)
62 Swiss Re First Quarter 2011 Report
The following table shows the total assets and liabilities in the Group’s balance sheet related to VIEs in which the Group holds a variable interest but is not the primary beneficiary as of 31 December 2010 and 31 March 2011:
The following table shows the Group’s assets, liabilities and maximum exposure to loss as of 31 December 2010 and 31 March 2011 which are related to VIEs in which the Group holds a variable interest but is not the primary beneficiary:
The liabilities of USD 1 626 million as of 31 March 2011 for insurance-linked and credit-linked securitisations represent funds held under reinsurance treaties.
The assets and liabilities for the swaps in trusts category represent the positive and negative fair values of the derivatives the Group has entered into with the trusts.
Liabilities are recognised for certain debt financing VIEs when losses occur. To date the respective debt financing VIEs have not incurred any losses. Liabilities of USD 605 million recognised for the “Other” category relate mainly to collateral received.
2010 2011
USD millions Total assets Total liabilities
Maximum exposure to
loss
Difference between exposure
and liabilities Total assets Total liabilities
Maximum exposure to
loss
Difference between exposure
and liabilities
Insurance-linked / Credit-linked securitisations 1 890 1 665 2 197 532 1 878 1 626 2 147 521Swaps in trusts 423 643 –1 – 358 408 –1 –Debt financing 468 126 126 485 129 129Other 329 597 1 184 587 318 605 1 233 628Total 3 110 2 905 –1 – 3 039 2 639 –1 –
1 The maximum exposure to loss for swaps in trusts cannot be meaningfully quantified due to their derivative character.
USD millions 2010 2011
Fixed income securities:Available-for-sale 60 59Trading 9 16
Other invested assets 1 406 1 351Premiums and other receivables 2 2Reinsurance recoverables 1 631 1 609Deferred acquisition costs 2 2Total assets 3 110 3 039
Funds held under reinsurance treaties 1 614 1 597Short-term debt 406 430Accrued expenses and other liabilities 885 612Total liabilities 2 905 2 639
Swiss Re First Quarter 2011 Report 63
Note on risk factors
General impact of adverse market conditionsSince 2007, the global financial markets have experienced extreme volatility and disruption, due in large part to turmoil affecting the liquidity of the banking system and the market reaction thereto. The impact of the turmoil in the financial markets was exacerbated by adverse macro-economic trends affecting a number of the principal economies. Volatility and disruption reached unprecedented levels in 2008 to 2009. Concerns remain regarding the financial markets and the health of major economies, driven in part by concerns over the sovereign debt of Greece, Ireland, Portugal and Spain and concerns over the pace of economic recovery. It is difficult to predict what the impact of market and economic conditions will be on the Group from a general business perspective or from a capital or liquidity perspective were conditions to again deteriorate or were austerity or stimulus measures adopted by governments in response to budget deficits and adverse economic conditions to be unsuccessful or harmful.
Swiss Re and its subsidiaries are regulated in a number of jurisdictions in which they conduct business. New legislation as well as changes to existing legislation have been proposed and/or recently adopted in a number of jurisdictions that are expected to alter, in a variety of ways, the manner in which the financial services industry is regulated. Although it is difficult to predict which proposals will become law and when and how new legislation ultimately will be implemented by regulators (including in respect of the extra-territorial effect of reforms), it is likely that significant aspects of existing regulatory regimes governing financial services will change. These may include changes as to which governmental bodies regulate financial institutions, changes in the way financial institutions generally are regulated, enhanced governmental authority to take control over operations of financial institutions, restrictions on the conduct of certain lines of business, changes in the way financial institutions account for transactions and securities positions, changes in disclosure obligations and changes in the way rating agencies rate the creditworthiness and financial strength of financial institutions.
While many changes will impact banking institutions, some could have direct applicability to insurance or reinsurance operations and others could have a general impact on the regulatory landscape for financial institutions, which might indirectly impact capital requirements and/or required reserve levels or have other direct or indirect effects on the Group. Changes are particularly likely to impact financial institutions designated as “systemically important”, which designation is expected to result in enhanced regulatory supervision and heightened capital, liquidity and diversification requirements under evolving reforms. Although, to date, the focus of reforms in respect of systemically important financial institutions principally has been on banks, there is an emerging focus on insurance companies as well. In addition, there appears to be a trend towards a more coordinated, centralised and stricter approach to insurance regulation specifically, in both the EU and the US. For example, a pan-European regulator for insurance companies, the European Insurance and Occupational Pension Authority, gained its regulatory powers on 1 January 2011 and will be able to overrule national regulators in certain circumstances. In the US, as a possible step towards federal oversight of insurance, the US Congress created the Federal Insurance Office within the Department of Treasury.
Changes may also occur in areas of broader application, such as competition policy and tax laws. Any number of these changes could apply to the Group and its operations. These changes could increase the costs of doing business, reduce access to liquidity, limit the scope of business or affect the competitive balance, or could make reinsurance less attractive to primary insurers.
Note on risk factors
64 Swiss Re First Quarter 2011 Report
Market riskVolatility and disruption in the global financial markets can expose the Group to significant financial and capital markets risk, including changes in interest rates, credit spreads, equity prices and foreign currency exchange rates, which may adversely impact the Group’s financial condition, results of operations, liquidity and capital position. The Group’s exposure to interest rate risk is primarily related to the market price and cash flow variability associated with changes in interest rates. Exposure to credit spreads primarily relates to market price and cash flow variability associated with changes in credit spreads. When credit spreads widen, the net unrealised loss position of the Group’s investment portfolio can increase, as could other-than-temporary impairments. With respect to equity prices, the Group is exposed to changes in the level and volatility of equity prices, as they affect the value of equity securities themselves as well as the value of securities or instruments that derive their value from a particular equity security, a basket of equity securities or a stock index. The Group is also subject to equity price risk to the extent that the value of life-related benefits under certain life contracts, most notably variable annuity business, are tied to financial market values; to the extent market values fall, the financial exposure on guarantees related to these contracts would increase to the extent this exposure is not hedged. While the Group has discontinued writing new variable annuity business and has an extensive hedging programme covering its existing variable annuity business, certain risks cannot be hedged, including actuarial risks, basis risk and correlation risk. Exposure to foreign exchange risk arises from exposures to changes in spot prices, forward prices and volatile movements in exchange rates.
These risks can have a significant effect on investment returns, which in turn may affect both the Group’s results of operations and financial condition. The Group continues to focus on asset-liability management for its investment portfolio, but pursuing even this strategy has its risks – including possible mismatch – that in turn can lead to reinvestment risk. The Group seeks to manage the risks inherent in its investment portfolio by repositioning the portfolio from time to time, as needed, and to reduce risk and fluctuations through the use of hedges and other risk management tools. The Group has moved to reduce risk to the portfolio by repositioning the components of the portfolio and, as a result, profitability will potentially be impacted, and, unless offset by underwriting returns, will be reduced.
Credit riskLike other financial institutions, the Group was adversely impacted by the deterioration in the credit markets in 2008 – 2009. Although the Group has taken significant steps to de-risk its portfolio and reposition its assets, if the credit markets were again to deteriorate and further asset classes were to be impacted, the Group could experience further losses. Changes in the market value of the underlying securities and other factors impacting their price could give rise to market value losses. If the credit markets were to deteriorate again, the Group could face further write-downs in other areas of its portfolio, including other structured instruments, and the Group and its counterparties could once again face difficulties in valuing credit-related instruments.
Differences in opinion with respect to valuations of credit-related instruments could result in legal disputes among counterparties as to their respective obligations, the outcomes of which are difficult to predict and could be material.
Swiss Re First Quarter 2011 Report 65
Note on risk factors
Liquidity risksThe Group’s business requires, and its clients expect, that it has sufficient capital and sufficient liquidity to meet its reinsurance obligations, and that that would continue to be the case following the occurrence of any event or series of events, including extreme catastrophes, that would trigger insurance or reinsurance coverage obligations. The Group’s uses of funds include obligations arising in its reinsurance business (including claims and other payments as well as insurance provision repayments due to portfolio transfers, securitisations and commutations), which may include large and unpredictable claims (including catastrophe claims), funding of capital requirements and operating costs, payment of principal and interest on outstanding indebtedness and funding of acquisitions. The Group also enters into contracts or trading arrangements that could give rise to significant short-term funding obligations and, in connection with the Group’s trading operations, it could be subject to unexpected calls to deliver collateral or unwind trading positions at a net cost to it. The Group also has unfunded capital commitments in its private equity and hedge fund investments, which could result in funding obligations at a time when it is subject to liquidity constraints.
The Group manages liquidity and funding risks by focusing on the liquidity stress that is likely to result from extreme capital markets scenarios or from extreme insurance events or combinations of the two. Generally, the ability to meet liquidity needs could be adversely impacted by factors that the Group cannot control, such as market dislocations or interruptions, adverse economic conditions, severe disruption in the financial and worldwide credit markets and the related increased constraints on the availability of credit, changes in interest rates, foreign exchange rates and credit spreads, or by perceptions among market participants of the extent of the Group’s liquidity needs.
The Group may not be able to secure new sources of liquidity or funding, should projected or actual liquidity fall below levels it requires. The ability to meet liquidity needs through asset sales may be constrained by market conditions and the related stress on valuations and through third-party funding may be limited by constraints on the general availability of credit and willingness of lenders to lend. In addition, the Group’s ability to meet liquidity needs may also be constrained by regulatory requirements that require regulated entities to maintain regulatory capital, or that restrict intra-group transactions, the timing of dividend payments from subsidiaries or the fact that certain assets may be encumbered or otherwise non-tradable. Finally, any adverse ratings action could trigger a need for further liquidity (for example, by triggering termination provisions or collateral delivery requirements in contracts to which the Group is a party) at a time when the Group’s ability to obtain liquidity from external sources is limited by such ratings action.
Counterparty risksThe Group’s general exposure to counterparty risk was heightened during the credit crisis, and this risk could still be exacerbated to the extent defaults, or concerns about possible defaults, by certain market participants trigger more systemic concerns about liquidity. Losses due to defaults by counterparties, including issuers of investment securities (which include structured securities) or derivative instrument counterparties, could adversely affect the Group. In addition, trading counterparties, counterparties under swaps and other derivative contracts and financial intermediaries may default on their obligations due to bankruptcy, insolvency, lack of liquidity, adverse economic conditions, operational failure, fraud or other reasons, which could also have a material adverse impact on the Group.
The Group could also be adversely affected by the insolvency of, or other credit constraints affecting, counterparties in its reinsurance operations. Moreover, the Group could be adversely affected by liquidity issues at ceding companies or at third parties to whom the Group has retroceded risk, and such risk could be exacerbated to the extent any such exposures are concentrated. The Group’s most significant single counterparty risk is in respect of Berkshire Hathaway Inc., with which it has a quota share arrangement, an adverse development cover and a retrocession arrangement in respect of a closed block of US individual life reinsurance business.
Note on risk factors
66 Swiss Re First Quarter 2011 Report
Risks relating to credit rating downgradesRatings are an important factor in establishing the competitive position of reinsurance companies, and market conditions could increase the risk of downgrade. Third-party rating agencies assess and rate the financial strength of reinsurers and insurers, such as Swiss Re. These ratings are intended to measure a company’s ability to repay its obligations and are based upon criteria established by the rating agencies.
The Group’s ratings reflect the current opinion of the relevant rating agencies. One or more of its ratings could be downgraded or withdrawn in the future. Rating agencies may heighten their scrutiny of rated companies, increase the frequency and scope of ratings reviews, revise their criteria or take other actions that may negatively impact the Group’s ratings, particularly in light of recently proposed or enacted provisions aimed at regulating rating agencies. In addition, changes to the process or methodology of issuing ratings, or the occurrence of events or developments affecting the Group, could make it more difficult for the Group to achieve improved ratings which it would otherwise have expected.
As claims paying and financial strength ratings are key factors in establishing the competitive position of reinsurers, a decline in ratings alone could make reinsurance provided by the Group less attractive to clients relative to reinsurance from competitors with similar or stronger ratings. A decline in ratings could also cause the loss of clients who are required by either policy or regulation to purchase reinsurance only from reinsurers with certain ratings. A decline in ratings could also impact the availability of unsecured financing and obligate the Group to provide collateral or other guarantees in the course of its reinsurance business or trigger early termination of funding arrangements. Any rating downgrades could also have a material adverse impact on the Group’s costs of borrowing and limit its access to the capital markets. Further negative ratings action could also impact reinsurance contracts.
Legal and regulatory risksThe Group has been named, from time to time, as a defendant in various legal actions in connection with its operations. The Group is also involved, from time to time, in investigations and regulatory proceedings, certain of which could result in adverse judgments, settlements, fines and other outcomes. The number of these investigations and proceedings involving the financial services industry has increased in recent years. The Group could also be subject to risk from potential employee misconduct, including non-compliance with internal policies and procedures. Substantial legal liability could materially adversely affect the Group’s business, financial condition or results of operations or could cause significant reputational harm, which could seriously harm its business.
A number of lawsuits have been filed against financial service firms raising claims tied to the unprecedented market turmoil. The Group cannot predict whether it could be subject to further claims arising out of the market turmoil or otherwise.
Swiss Re First Quarter 2011 Report 67
Insurance, operational and other risksAs part of the Group’s ordinary course operations, the Group is subject to a variety of risks, including risks that reserves may not adequately cover future claims and benefits, risks that catastrophic events (including hurricanes, windstorms, floods, earthquakes, industrial accidents, explosions, industrial actions, fires and pandemics) may expose the Group to unexpected large losses, competitive conditions, cyclicality of the industry, risks related to emerging claims and coverage issues, risks arising from the Group’s dependence on policies, procedures and expertise of ceding companies, and risks related to the failure of operational systems and infrastructure. Even natural catastrophe events that occur in relatively sparsely populated areas, such as the volcanic eruption in Iceland in April 2010, can have severe and wide-reaching economic impact. In addition, the occurrence of future risks that the Group’s risk management procedures fail to identify or anticipate could have a material adverse effect on the Group.
Use of models; accounting mattersThe Group is subject to risks relating to the preparation of estimates and assumptions that management uses, for example, as part of its risk models as well as those that affect the reported amounts of assets, liabilities, revenues and expenses in the Group’s financial statements, including assumed and ceded business. For example, the Group estimates premiums pending receipt of actual data from ceding companies, which actual data could deviate from the estimates. In addition, particularly with respect to large natural catastrophes, it may be difficult to estimate losses, and preliminary estimates may be subject to a high degree of uncertainty and change as new information becomes available. To the extent that management’s estimates or assumptions prove to be incorrect, it could have a material impact on underwriting results (in the case of risk models) or on reported financial condition or results of operations, and such impact could be material.
The Group’s results may be impacted by changes in accounting standards, or changes in the interpretation of accounting standards. The Group’s results may also be impacted if regulatory authorities take issue with any conclusions the Group may reach in respect of accounting matters. Changes in accounting standards could impact future reported results or require restatement of past reported results.
The Group uses non-GAAP financial measures in its external reporting, including in this report. These measures are not prepared in accordance with US GAAP or any other comprehensive set of accounting rules or principles, and should not be viewed as a substitute for measures prepared in accordance with US GAAP. Moreover, these may be different from or otherwise inconsistent with non-GAAP financial measures used by other companies. These measures have inherent limitations, are not required to be uniformly applied and are not audited.
Note on risk factors

68 Swiss Re First Quarter 2011 Report
Cautionary note on forward-looking statements
Certain statements and illustrations contained herein are forward-looking. These statements and illustrations provide current expectations of future events based on certain assumptions and include any statement that does not directly relate to a historical fact or current fact.
Forward-looking statements typically are identified by words or phrases such as “anticipate”, “assume”, “believe”, “continue”, “estimate”, “expect”, “foresee”, “intend”, “may increase” and “may fluctuate” and similar expressions or by future or conditional verbs such as “will”, “should”, “would” and “could”. These forward-looking statements involve known and unknown risks, uncertainties and other factors, which may cause Swiss Re’s actual results, performance, achievements or prospects to be materially different from any future results, performance, achievements or prospects expressed or implied by such statements. Such factors include, among others: ̤ further instability affecting the global financial system and developments related thereto; ̤ changes in global economic conditions; ̤ Swiss Re’s ability to maintain sufficient liquidity and access to capital markets, including
sufficient liquidity to cover potential recapture of reinsurance agreements, early calls of debt or debt-like arrangements and collateral calls under derivative contracts due to actual or perceived deterioration of Swiss Re’s financial strength;
̤ the effect of market conditions, including the global equity and credit markets, and the level and volatility of equity prices, interest rates, credit spreads, currency values and other market indices, on Swiss Re’s investment assets;
̤ changes in Swiss Re’s investment result as a result of changes in its investment policy or the changed composition of its investment assets, and the impact of the timing of any such changes relative to changes in market conditions;
̤ uncertainties in valuing credit default swaps and other credit-related instruments; ̤ possible inability to realise amounts on sales of securities on Swiss Re’s balance sheet
equivalent to its mark-to-market values recorded for accounting purposes; ̤ the outcome of tax audits, the ability to realise tax loss carryforwards and the ability to
realise deferred tax assets (including by reason of the mix of earnings in a jurisdiction or deemed change of control), which could negatively impact future earnings;
̤ the possibility that hedging arrangements may not be effective; ̤ the lowering or loss of financial strength or other ratings of one or more of the companies
in the Group or developments adversely affecting the ability to achieve improved ratings; ̤ the cyclicality of the reinsurance industry; ̤ uncertainties in estimating reserves; ̤ uncertainties in estimating future claims for purposes of financial reporting, particularly
with respect to large natural catastrophes, as significant uncertainties may be involved in estimating losses from such events and preliminary estimates may be subject to change as new information becomes available;
̤ the frequency, severity and development of insured claim events; ̤ acts of terrorism and acts of war; ̤ mortality and morbidity experience; ̤ policy renewal and lapse rates; ̤ extraordinary events affecting Swiss Re’s clients and other counterparties, such as
bankruptcies, liquidations and other credit-related events; ̤ current, pending and future legislation and regulation affecting Swiss Re or its ceding
companies, and regulatory or legal actions; ̤ changes in accounting standards; ̤ significant investments, acquisitions or dispositions, and any delays, unexpected costs or
other issues experienced in connection with any such transactions, including, in the case of acquisitions, issues arising in connection with integrating acquired operations;
̤ changing levels of competition; ̤ operational factors, including the efficacy of risk management and other internal
procedures in managing the foregoing risks; and ̤ challenges in implementation, adverse responses of counterparties, regulators or rating
agencies, or other issues arising from, or otherwise relating to, the changes in Swiss Re’s corporate structure.
These factors are not exhaustive. Swiss Re operates in a continually changing environment and new risks emerge continually. Readers are cautioned not to place undue reliance on forward-looking statements. Swiss Re undertakes no obligation to publicly revise or update any forward-looking statements, whether as a result of new information, future events or otherwise.

© 2011 Swiss Re. All rights reserved.
Title:First Quarter 2011 Report
The web version of the First Quarter 2011 Report is available at: www.swissre.com /investors
Order no: 1504017_11_en
CCHCC, 05 /11, 2 000 en
Corporate calendar and contact information
Corporate calendar4 August 2011 Second quarter 2011 results
3 November 2011 Third quarter 2011 results
9 December 2011 Investors’ Day
16 February 2012 2011 annual results
4 May 2012 First quarter 2012 results
Contact informationInvestor RelationsTelephone +41 43 285 4444Fax +41 43 282 [email protected]
Media RelationsTelephone +41 43 285 7171Fax +41 43 282 [email protected]
Share RegisterTelephone +41 43 285 3294Fax +41 43 282 [email protected]

Swiss Reinsurance Company Ltd Mythenquai 50/60 P.O. Box 8022 Zurich Switzerland
Telephone +41 43 285 2121 Fax +41 43 285 2999 www.swissre.com


