40
First Quarter FY 2012 Quarterly Update Infineon Technologies AG Investor Relations
First Quarter FY 2012 Quarterly Update Infineon Technologies AG Investor Relations
Copyright © Infineon Technologies 2010. All rights reserved. 2011
Infineon at a Glance
01 Feb 2012
Results and Outlook
Growth Outlook and Margin Resilience
Page 2
Copyright © Infineon Technologies 2010. All rights reserved. 2011 01 Feb 2012
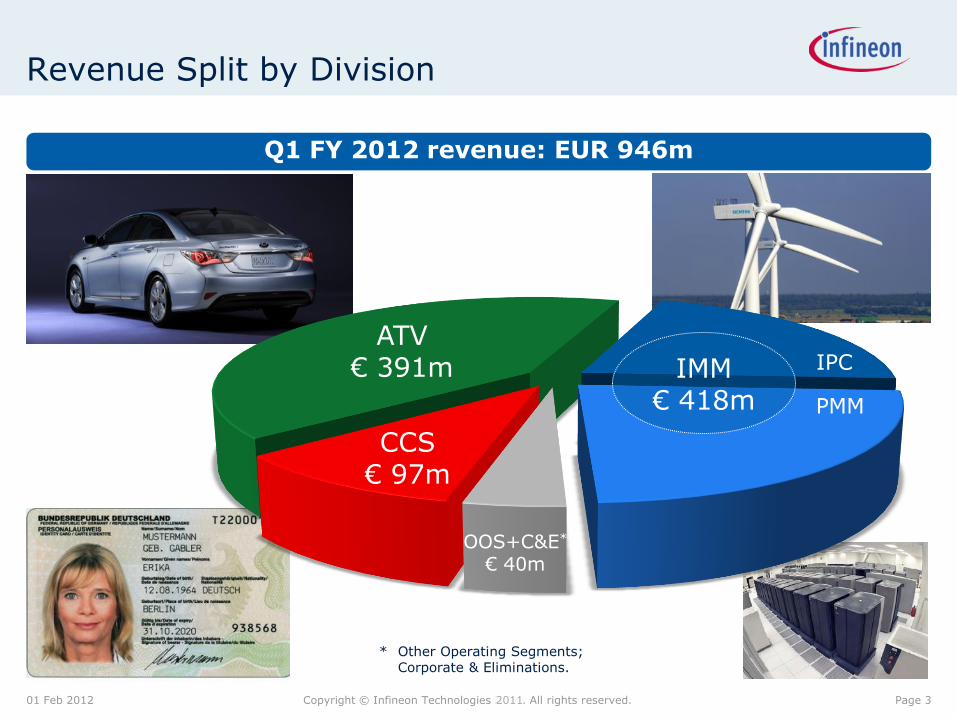
Revenue Split by Division
ATV € 391m
CCS € 97m
IMM € 418m
OOS+C&E*
€ 40m
Page 3
* Other Operating Segments; Corporate & Eliminations.
Q1 FY 2012 revenue: EUR 946m
IPC
PMM
Copyright © Infineon Technologies 2010. All rights reserved. 2011
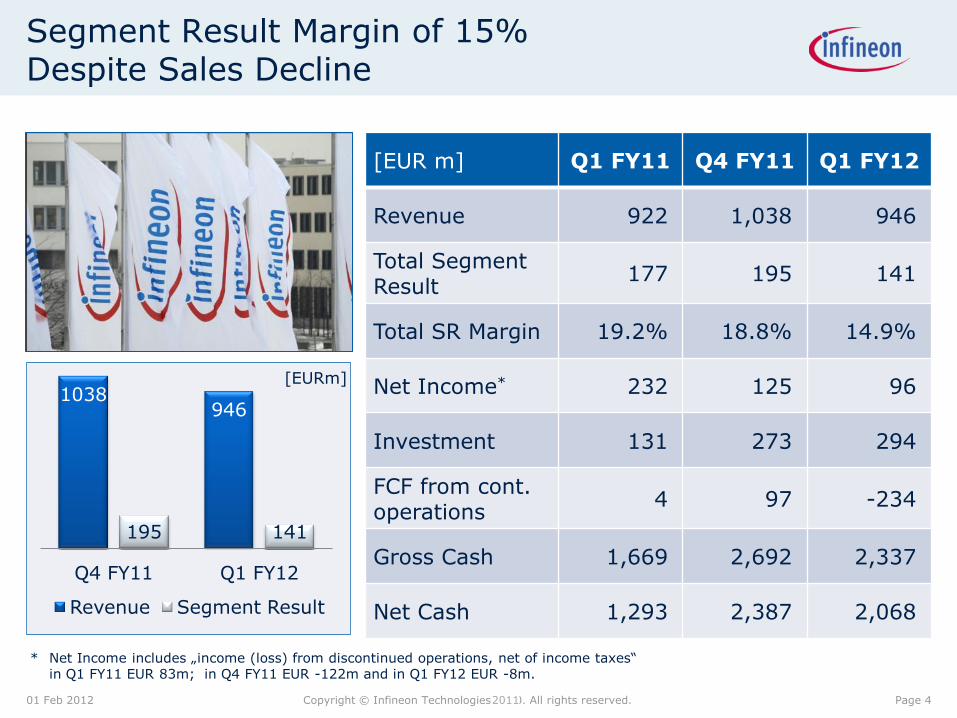
Segment Result Margin of 15% Despite Sales Decline
1038 946
195 141
Q4 FY11 Q1 FY12
Revenue Segment Result
[EUR m] Q1 FY11 Q4 FY11 Q1 FY12
Revenue 922 1,038 946
Total Segment Result
177 195 141
Total SR Margin 19.2% 18.8% 14.9%
Net Income* 232 125 96
Investment 131 273 294
FCF from cont. operations
4 97 -234
Gross Cash 1,669 2,692 2,337
Net Cash 1,293 2,387 2,068
01 Feb 2012
* Net Income includes „income (loss) from discontinued operations, net of income taxes“ in Q1 FY11 EUR 83m; in Q4 FY11 EUR -122m and in Q1 FY12 EUR -8m.
Page 4
[EURm]
Copyright © Infineon Technologies 2010. All rights reserved. 2011
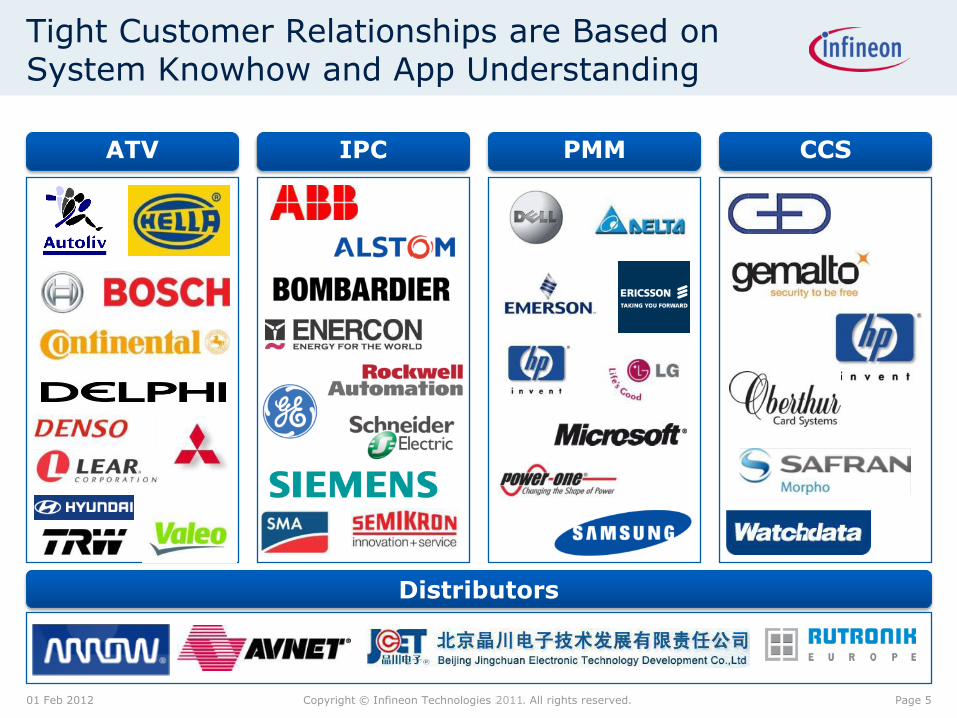
Tight Customer Relationships are Based on System Knowhow and App Understanding
01 Feb 2012
ATV IPC CCS
Distributors
Page 5
PMM
Copyright © Infineon Technologies 2010. All rights reserved. 2011
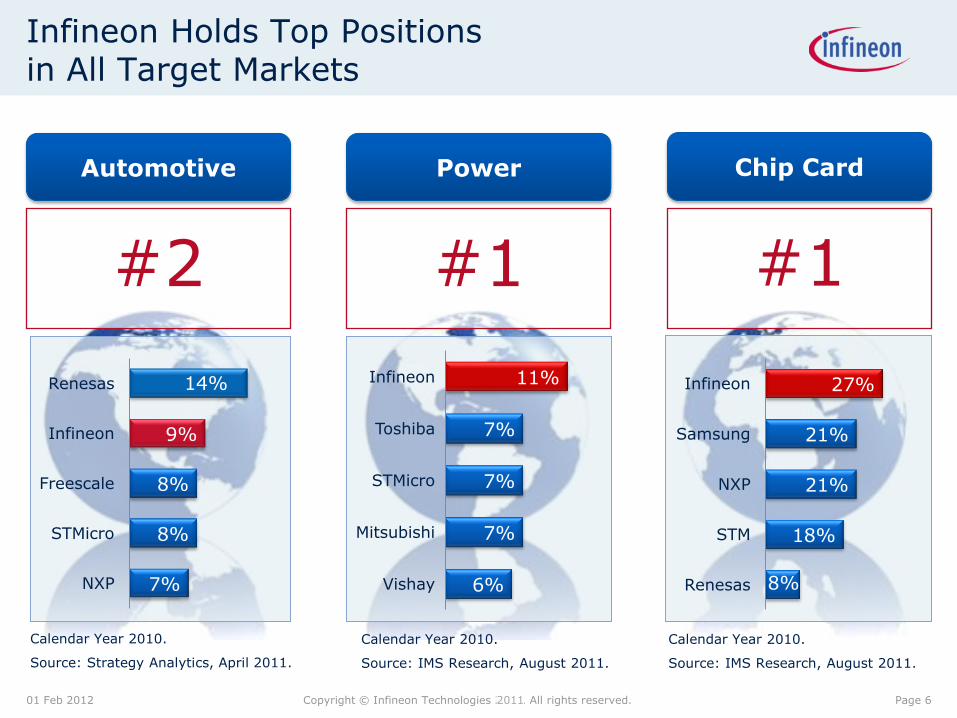
Infineon Holds Top Positions in All Target Markets
#1
Power Chip Card
#1
Automotive
#2
Calendar Year 2010.
Source: IMS Research, August 2011.
Calendar Year 2010.
Source: IMS Research, August 2011.
Calendar Year 2010.
Source: Strategy Analytics, April 2011.
7%
8%
8%
9%
NXP
STMicro
Freescale
Infineon
Renesas
6%
7%
7%
7%
11%
Vishay
Mitsubishi
STMicro
Toshiba
Infineon
8%
18%
21%
21%
27%
Renesas
STM
NXP
Samsung
Infineon 14%
01 Feb 2012 Page 6
Copyright © Infineon Technologies 2010. All rights reserved. 2011
Infineon at a Glance
01 Feb 2012
Results and Outlook
Growth Outlook and Margin Resilience
Page 7
Page 8 Copyright © Infineon Technologies 2011. All rights reserved.
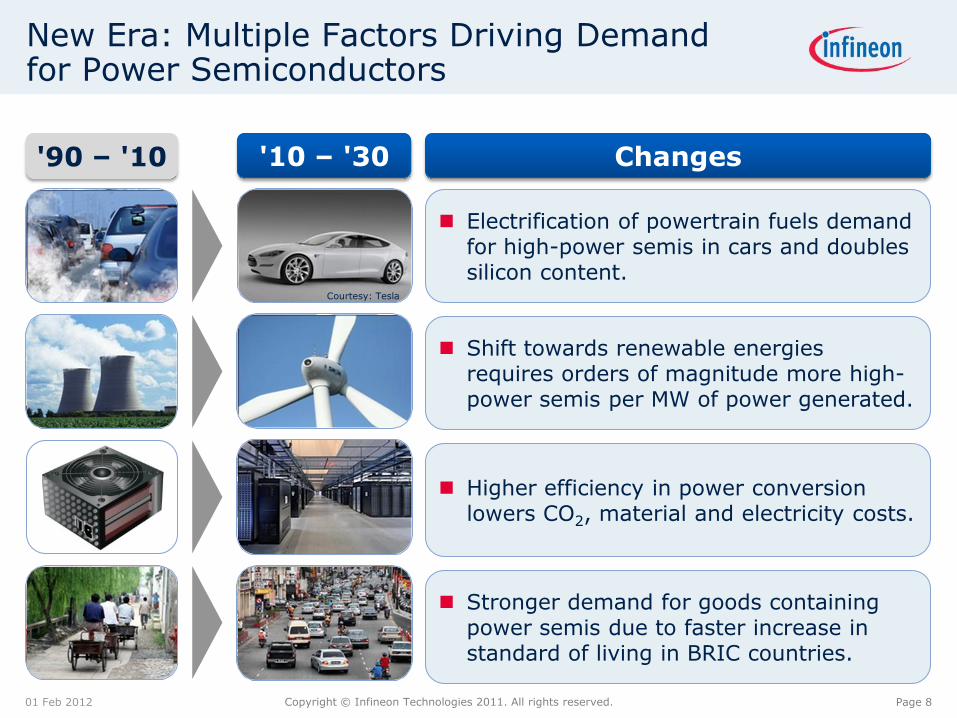
New Era: Multiple Factors Driving Demand for Power Semiconductors
01 Feb 2012
Shift towards renewable energies requires orders of magnitude more high-power semis per MW of power generated.
'90 – '10
Electrification of powertrain fuels demand for high-power semis in cars and doubles silicon content.
Higher efficiency in power conversion lowers CO2, material and electricity costs.
Stronger demand for goods containing power semis due to faster increase in standard of living in BRIC countries.
'10 – '30 Changes
Courtesy: Tesla
Page 9 Copyright © Infineon Technologies 2011. All rights reserved.
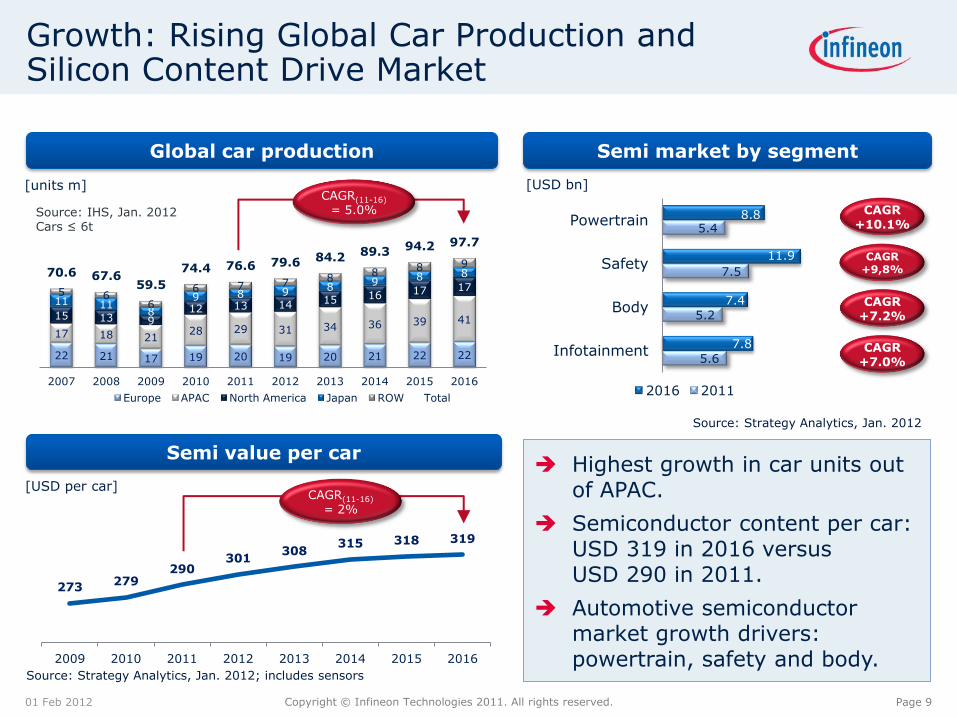
Growth: Rising Global Car Production and Silicon Content Drive Market
Highest growth in car units out of APAC.
Semiconductor content per car: USD 319 in 2016 versus USD 290 in 2011.
Automotive semiconductor market growth drivers: powertrain, safety and body.
Global car production
Semi value per car
Semi market by segment
Source: Strategy Analytics, Jan. 2012
CAGR(11-16) = 2%
22 21 17 19 20 19 20 21 22 22
17 18 21 28 29 31 34 36 39 41 15 13 9 12 13 14 15 16 17 17
11 11 8
9 8 9 8 9 8 8
5 6 6
6 7 7 8 8
8 9 70.6 67.6
59.5
74.4 76.6 79.6 84.2 89.3 94.2 97.7
2007 2008 2009 2010 2011 2012 2013 2014 2015 2016
Europe APAC North America Japan ROW Total
CAGR(11-16) = 5.0%
5.6
5.2
7.5
5.4
7.8
7.4
11.9
8.8
Infotainment
Body
Safety
Powertrain
2016 2011
CAGR +10.1%
CAGR +9,8%
CAGR +7.2%
CAGR +7.0%
273 279
290 301
308 315 318 319
2009 2010 2011 2012 2013 2014 2015 2016
Source: IHS, Jan. 2012 Cars ≤ 6t
Source: Strategy Analytics, Jan. 2012; includes sensors
[units m]
[USD per car]
[USD bn]
01 Feb 2012
Page 10 Copyright © Infineon Technologies 2011. All rights reserved.
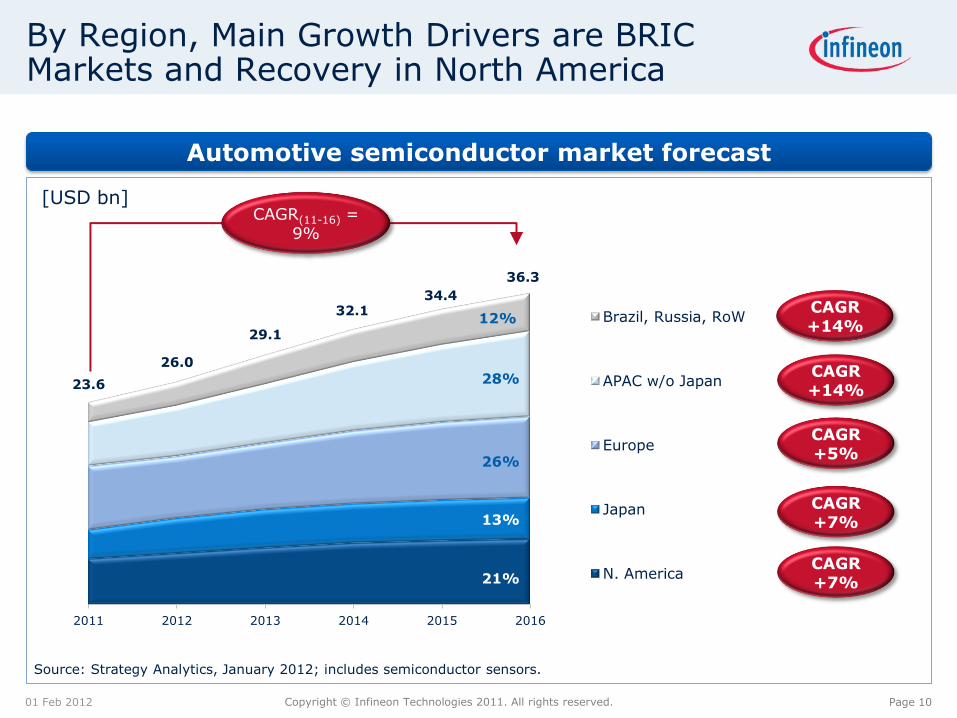
By Region, Main Growth Drivers are BRIC Markets and Recovery in North America
01 Feb 2012
Automotive semiconductor market forecast
Source: Strategy Analytics, January 2012; includes semiconductor sensors.
[USD bn]
CAGR +14%
CAGR +5%
CAGR +7%
CAGR +7%
CAGR +14%
CAGR(11-16) = 9%
13%
28%
26%
21%
23.6
26.0
29.1
32.1 34.4
36.3
2011 2012 2013 2014 2015 2016
Brazil, Russia, RoW
APAC w/o Japan
Europe
Japan
N. America
26%
28%
21%
13%
12%
Copyright © Infineon Technologies 2010. All rights reserved. 2011
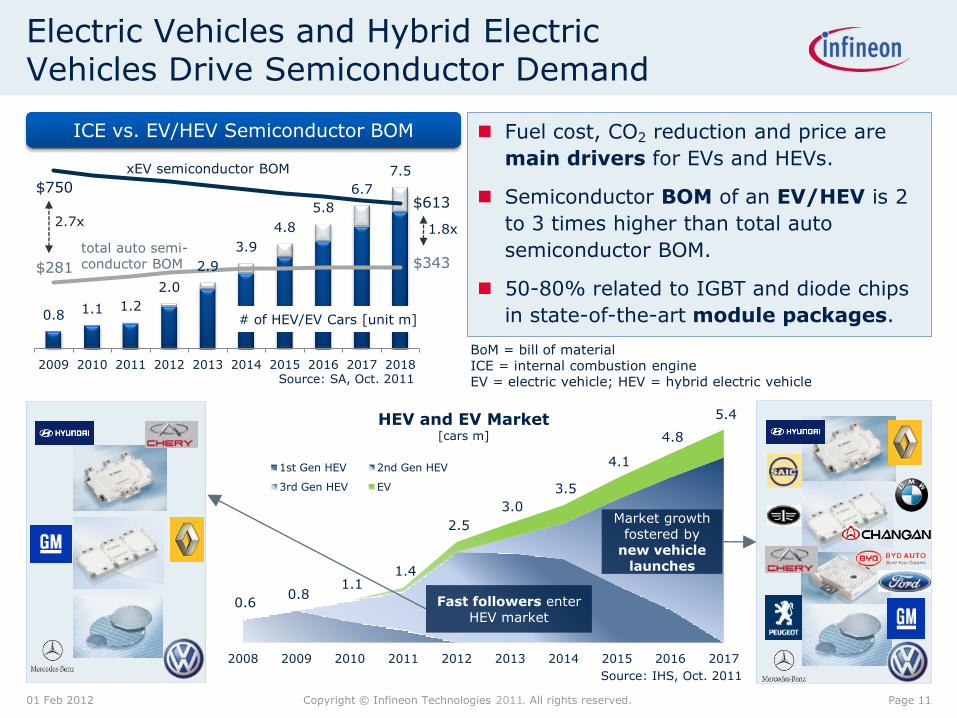
0.6 0.8
1.1 1.4
2.5
3.0
3.5
4.1
4.8
5.4
2008 2009 2010 2011 2012 2013 2014 2015 2016 2017
1st Gen HEV 2nd Gen HEV
3rd Gen HEV EV
Electric Vehicles and Hybrid Electric Vehicles Drive Semiconductor Demand
Fuel cost, CO2 reduction and price are
main drivers for EVs and HEVs.
Semiconductor BOM of an EV/HEV is 2
to 3 times higher than total auto
semiconductor BOM.
50-80% related to IGBT and diode chips
in state-of-the-art module packages.
ICE vs. EV/HEV Semiconductor BOM
Fast followers enter HEV market
Market growth fostered by
new vehicle launches
HEV and EV Market [cars m]
Source: IHS, Oct. 2011
0.8 1.1 1.2
2.0
2.9
3.9
4.8
5.8
6.7
7.5
0
100
200
300
400
500
600
700
800
0
1
2
3
4
5
6
7
8
9
2009 2010 2011 2012 2013 2014 2015 2016 2017 2018
$750
$281
$613
$343 total auto semi-conductor BOM
1.8x
# of HEV/EV Cars [unit m]
2.7x
xEV semiconductor BOM
Source: SA, Oct. 2011
01 Feb 2012 Page 11
BoM = bill of material ICE = internal combustion engine EV = electric vehicle; HEV = hybrid electric vehicle
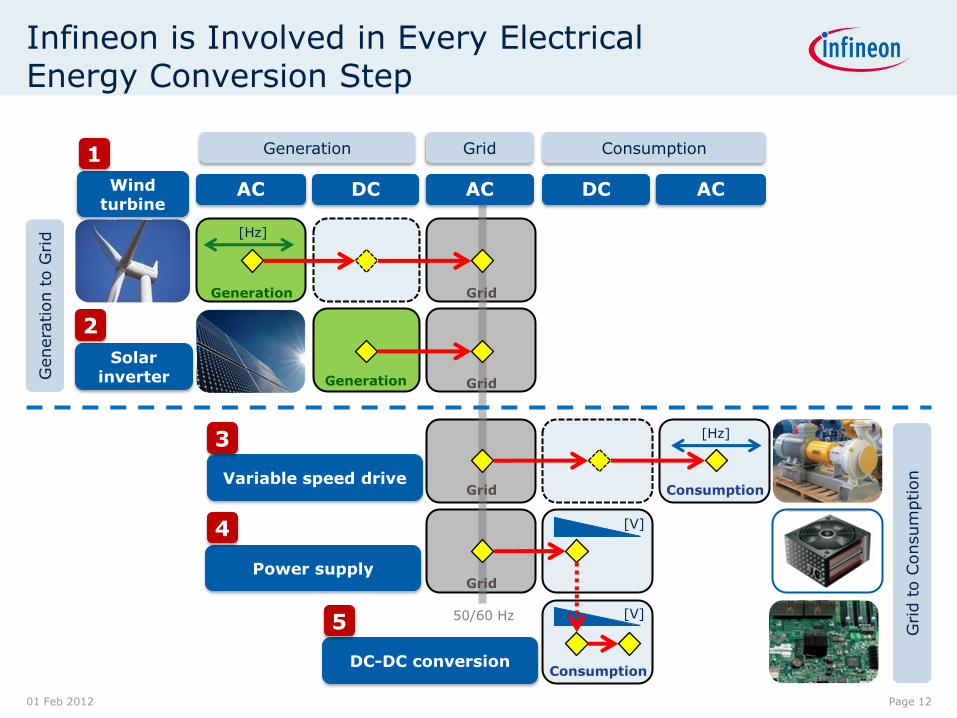
Infineon is Involved in Every Electrical Energy Conversion Step
AC
[Hz]
DC AC
Solar inverter
Wind turbine
Variable speed drive
Power supply
DC-DC conversion
1
2
3
4
5
01 Feb 2012 Page 12
Generation
Generation
Grid
Grid
Grid
Grid
Consumption
Consumption
Genera
tion t
o G
rid
Grid t
o C
onsum
ption
AC DC
[Hz]
[V]
[V]
Generation Grid Consumption
50/60 Hz
Page 13 Copyright © Infineon Technologies 2011. All rights reserved.
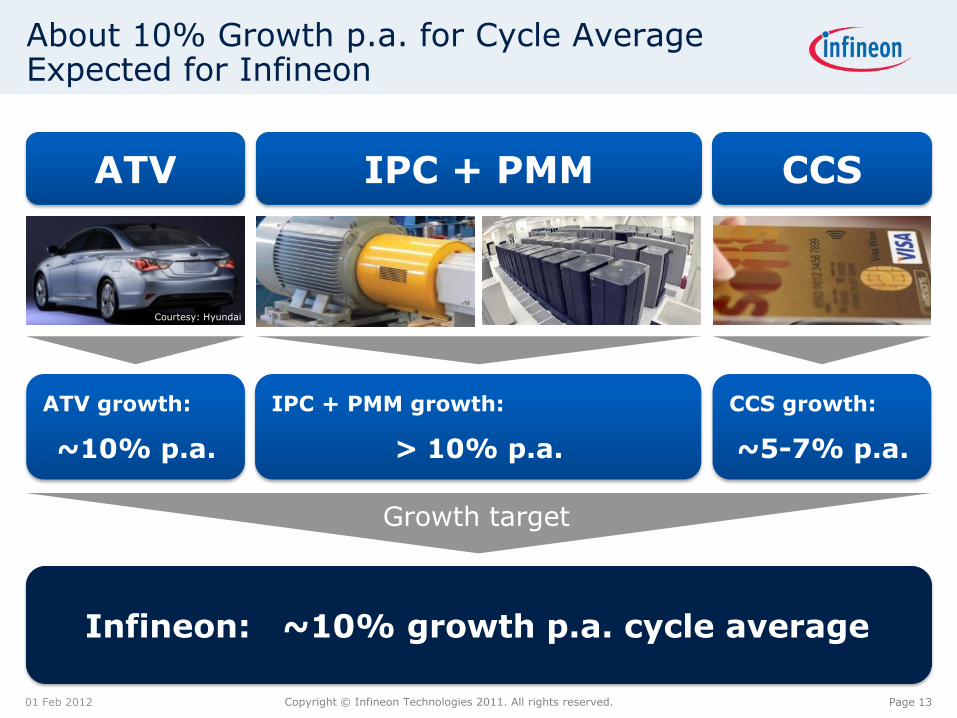
About 10% Growth p.a. for Cycle Average Expected for Infineon
01 Feb 2012
ATV growth:
~10% p.a.
IPC + PMM growth:
> 10% p.a.
CCS growth:
~5-7% p.a.
ATV IPC + PMM CCS
Infineon: ~10% growth p.a. cycle average
Courtesy: Hyundai
Growth target
Page 14 Copyright © Infineon Technologies 2011. All rights reserved.
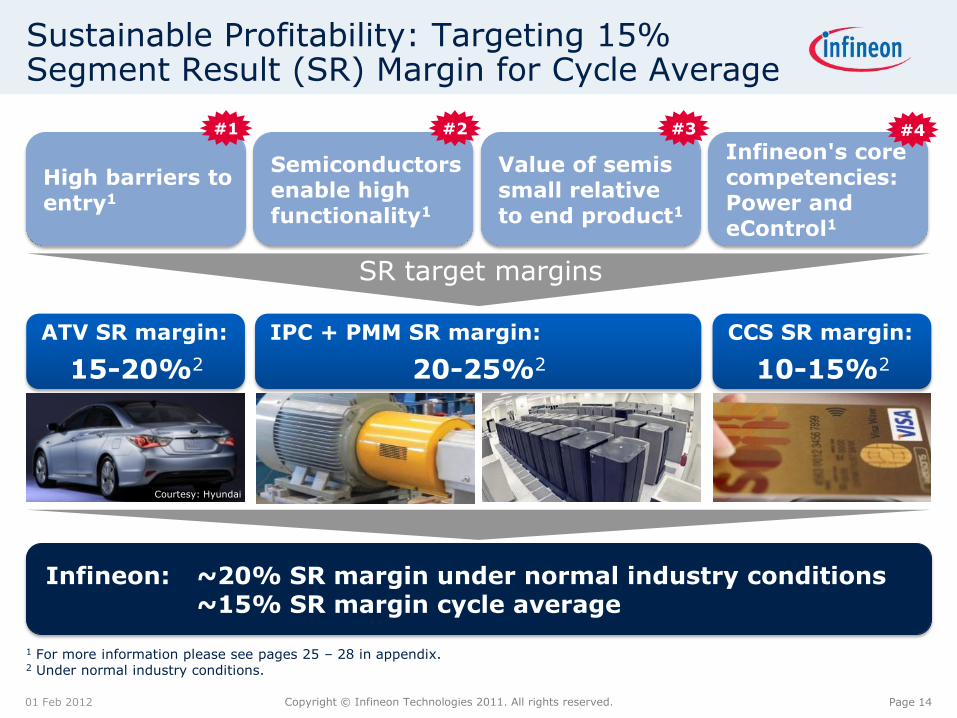
Sustainable Profitability: Targeting 15% Segment Result (SR) Margin for Cycle Average
01 Feb 2012
High barriers to entry1
SR target margins
Semiconductors enable high functionality1
Value of semis small relative to end product1
Infineon's core competencies: Power and eControl1
Infineon: ~20% SR margin under normal industry conditions ~15% SR margin cycle average
#1 #2 #3 #4
Courtesy: Hyundai
ATV SR margin:
15-20%2
IPC + PMM SR margin:
20-25%2
CCS SR margin:
10-15%2
1 For more information please see pages 25 – 28 in appendix. 2 Under normal industry conditions.
Page 15 Copyright © Infineon Technologies 2011. All rights reserved.
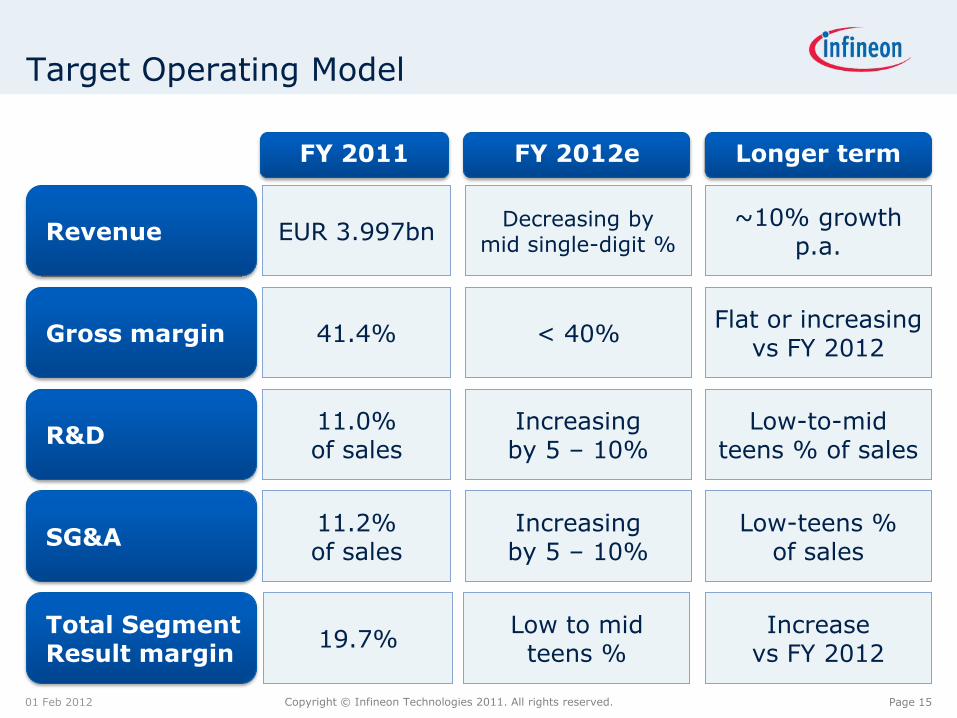
Target Operating Model
01 Feb 2012
Revenue
Gross margin
R&D
SG&A
Total Segment Result margin
19.7%
FY 2011 FY 2012e Longer term
EUR 3.997bn
41.4%
11.0% of sales
11.2% of sales
Decreasing by mid single-digit %
< 40%
Increasing by 5 – 10%
Increasing by 5 – 10%
Low to mid teens %
~10% growth p.a.
Flat or increasing vs FY 2012
Low-to-mid teens % of sales
Low-teens % of sales
Increase vs FY 2012
Copyright © Infineon Technologies 2010. All rights reserved. 2011
Infineon at a Glance
01 Feb 2012
Results and Outlook
Growth Outlook and Margin Resilience
Page 16
Copyright © Infineon Technologies 2010. All rights reserved. 2011
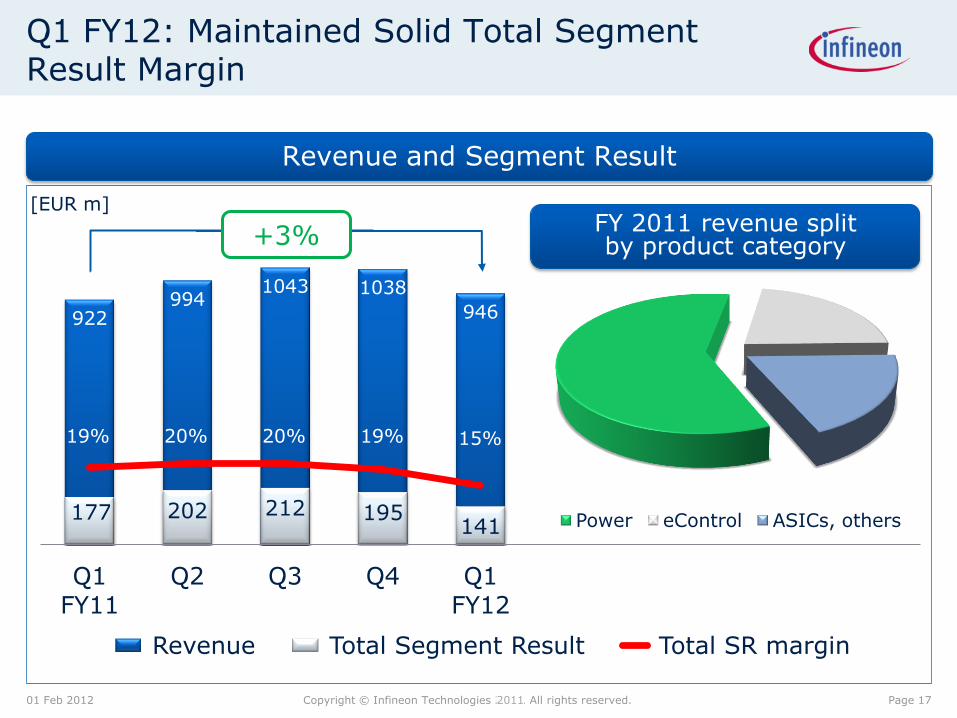
Q1 FY12: Maintained Solid Total Segment Result Margin
01 Feb 2012
Revenue and Segment Result
[EUR m]
922 994
1043 1038
946
177 202 212 195 141
Q1 FY11
Q2 Q3 Q4 Q1 FY12
Revenue Total Segment Result Total SR margin
19% 20% 20% 19% 15%
+3%
Power eControl ASICs, others
FY 2011 revenue split by product category
Page 17
Copyright © Infineon Technologies 2010. All rights reserved. 2011
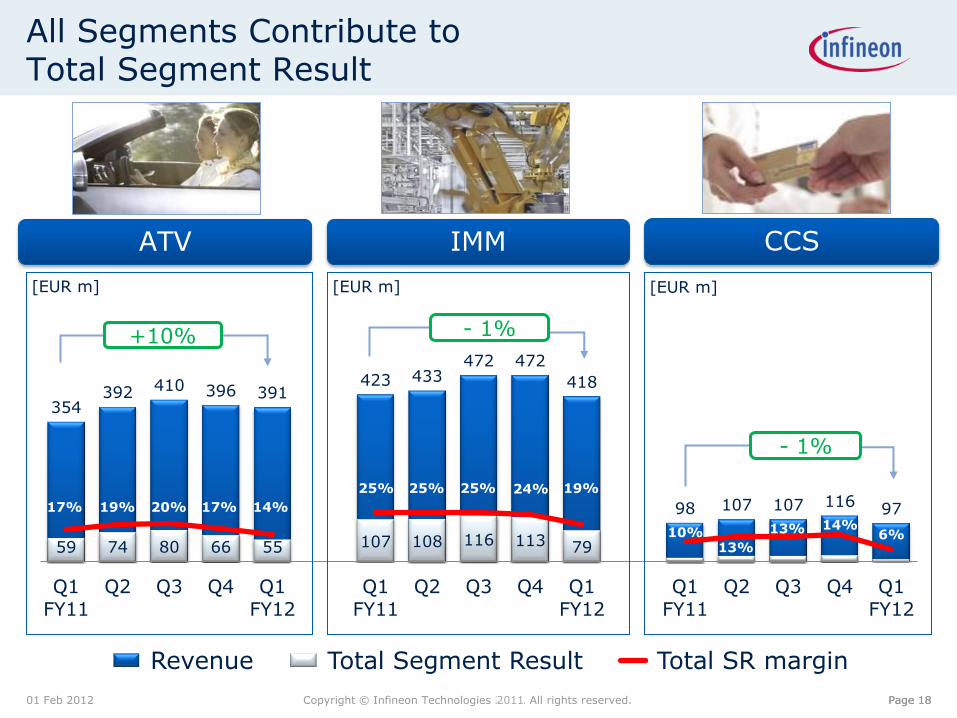
All Segments Contribute to Total Segment Result
01 Feb 2012
354 392 410 396 391
423 433 472 472
418
98 107 107 116 97
59 74 80 66 55 107 108 116 113 79
Q1 FY11
Q2 Q3 Q4 Q1 FY12
Q1 FY11
Q2 Q3 Q4 Q1 FY12
Q1 FY11
Q2 Q3 Q4 Q1 FY12
Revenue Total Segment Result Total SR margin
Page 18
ATV IMM CCS
- 1%
[EUR m]
- 1%
17% 19% 20% 17% 14%
24% 19% 25% 25% 25%
14% 6% 13%
13% 10%
+10%
Page 18
[EUR m] [EUR m]
01 Feb 2012 Page 19
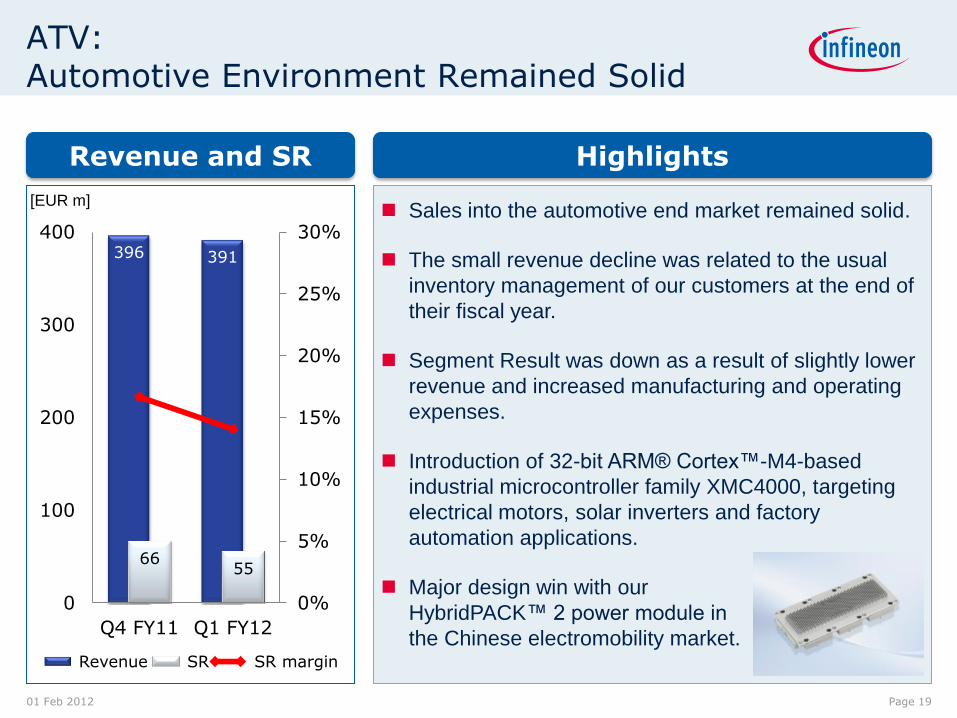
ATV: Automotive Environment Remained Solid
396 391
66 55
0%
5%
10%
15%
20%
25%
30%
0
100
200
300
400
Q4 FY11 Q1 FY12
Revenue SR SR margin
Sales into the automotive end market remained solid.
The small revenue decline was related to the usual
inventory management of our customers at the end of
their fiscal year.
Segment Result was down as a result of slightly lower
revenue and increased manufacturing and operating
expenses.
Introduction of 32-bit ARM® Cortex™-M4-based
industrial microcontroller family XMC4000, targeting
electrical motors, solar inverters and factory
automation applications.
Major design win with our
HybridPACK™ 2 power module in
the Chinese electromobility market.
[EUR m]
Revenue and SR Highlights
01 Feb 2012 Page 20
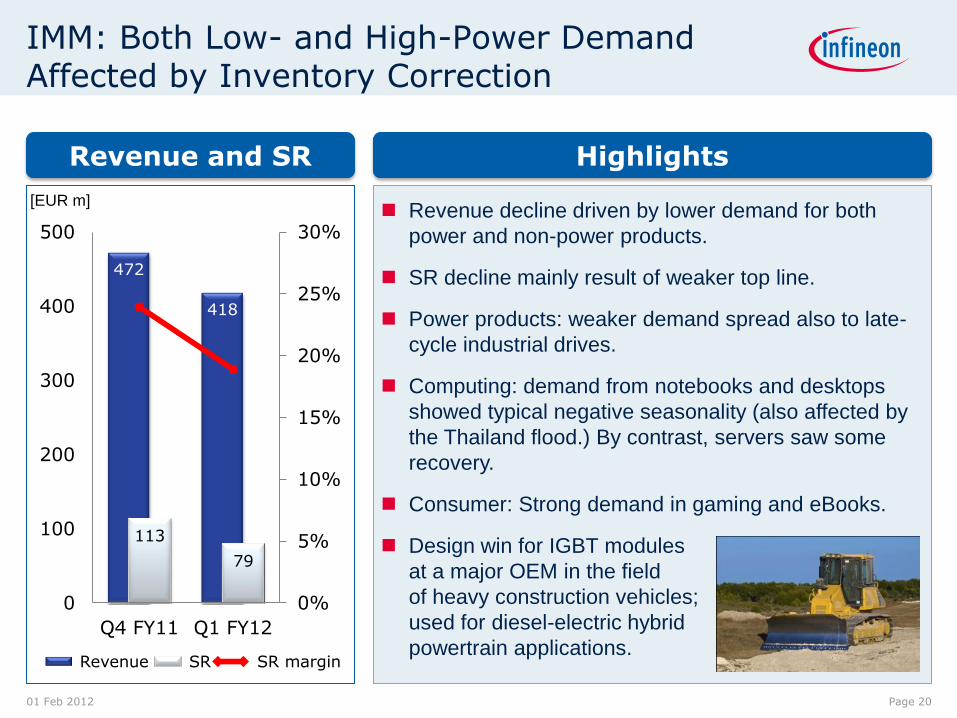
IMM: Both Low- and High-Power Demand Affected by Inventory Correction
472
418
113
79
0%
5%
10%
15%
20%
25%
30%
0
100
200
300
400
500
Q4 FY11 Q1 FY12
Revenue SR SR margin
Revenue decline driven by lower demand for both
power and non-power products.
SR decline mainly result of weaker top line.
Power products: weaker demand spread also to late-
cycle industrial drives.
Computing: demand from notebooks and desktops
showed typical negative seasonality (also affected by
the Thailand flood.) By contrast, servers saw some
recovery.
Consumer: Strong demand in gaming and eBooks.
Design win for IGBT modules
at a major OEM in the field
of heavy construction vehicles;
used for diesel-electric hybrid
powertrain applications.
[EUR m]
Revenue and SR Highlights
Page 21 Copyright © Infineon Technologies 2011. All rights reserved. 01 Feb 2012 Page 21
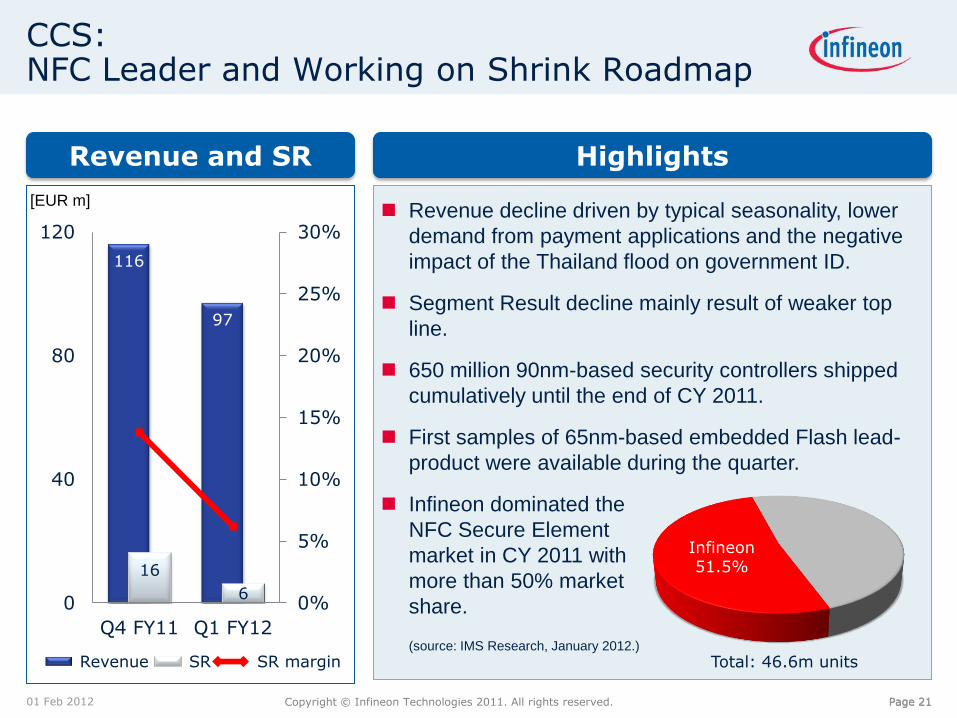
CCS: NFC Leader and Working on Shrink Roadmap
116
97
16
6 0%
5%
10%
15%
20%
25%
30%
0
40
80
120
Q4 FY11 Q1 FY12
Revenue SR SR margin
Revenue decline driven by typical seasonality, lower
demand from payment applications and the negative
impact of the Thailand flood on government ID.
Segment Result decline mainly result of weaker top
line.
650 million 90nm-based security controllers shipped
cumulatively until the end of CY 2011.
First samples of 65nm-based embedded Flash lead-
product were available during the quarter.
Infineon dominated the
NFC Secure Element
market in CY 2011 with
more than 50% market
share. (source: IMS Research, January 2012.)
[EUR m]
Revenue and SR Highlights
Total: 46.6m units
Infineon 51.5%
Copyright © Infineon Technologies 2010. All rights reserved. 2011
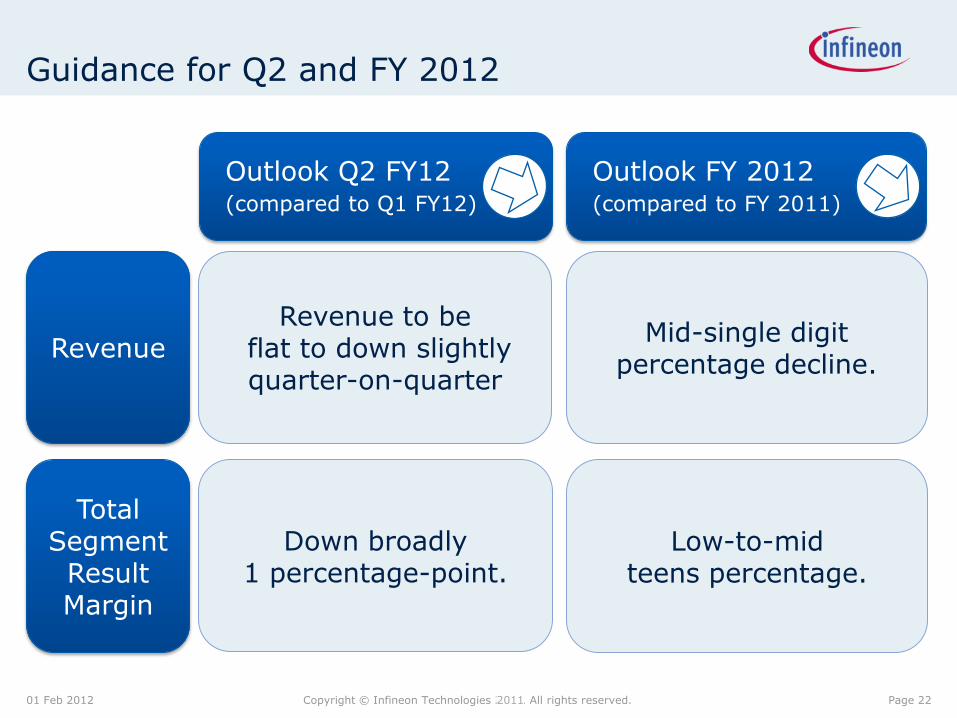
Guidance for Q2 and FY 2012
Total Segment Result Margin
Revenue
Outlook Q2 FY12
(compared to Q1 FY12)
Outlook FY 2012 (compared to FY 2011)
01 Feb 2012 Page 22
Down broadly 1 percentage-point.
Revenue to be flat to down slightly quarter-on-quarter
Low-to-mid teens percentage.
Mid-single digit percentage decline.
Copyright © Infineon Technologies 2010. All rights reserved. 2011
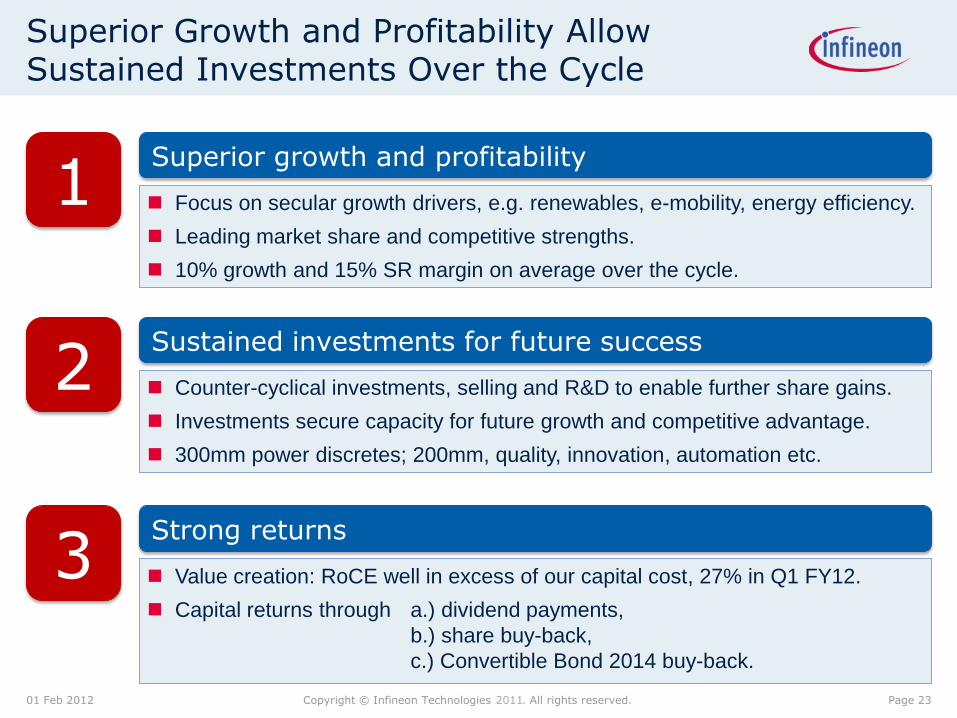
Superior Growth and Profitability Allow Sustained Investments Over the Cycle
01 Feb 2012 Page 23
1
2
3
Superior growth and profitability
Sustained investments for future success
Strong returns
Focus on secular growth drivers, e.g. renewables, e-mobility, energy efficiency.
Leading market share and competitive strengths.
10% growth and 15% SR margin on average over the cycle.
Counter-cyclical investments, selling and R&D to enable further share gains.
Investments secure capacity for future growth and competitive advantage.
300mm power discretes; 200mm, quality, innovation, automation etc.
Value creation: RoCE well in excess of our capital cost, 27% in Q1 FY12.
Capital returns through a.) dividend payments,
b.) share buy-back,
c.) Convertible Bond 2014 buy-back.
Page 25 Copyright © Infineon Technologies 2011. All rights reserved.
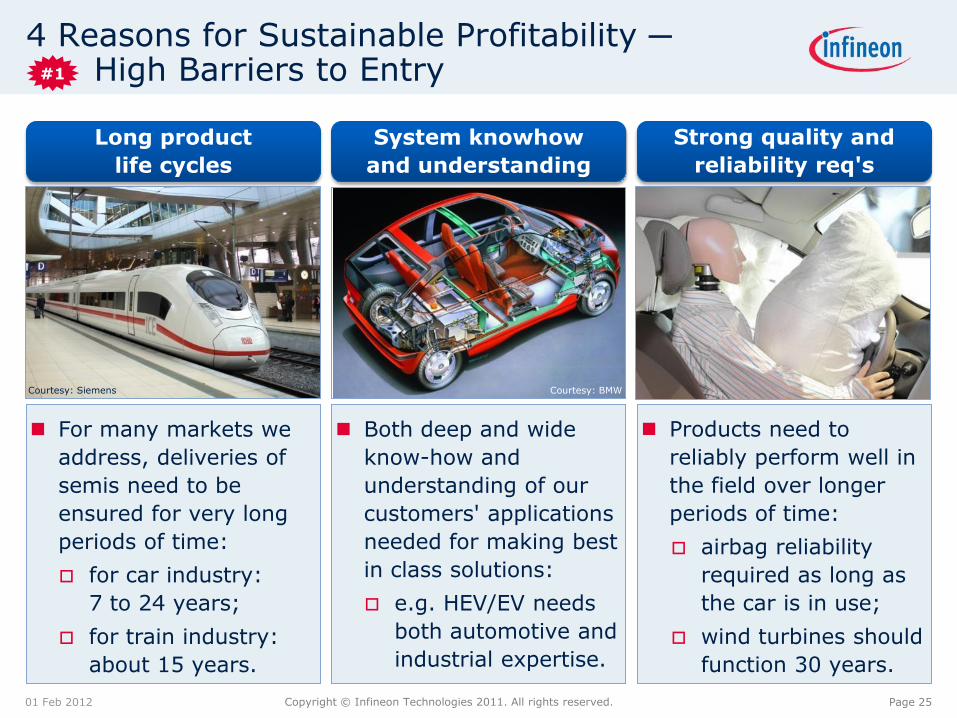
4 Reasons for Sustainable Profitability ─ High Barriers to Entry
01 Feb 2012
Long product
life cycles
System knowhow
and understanding
Strong quality and
reliability req's
For many markets we
address, deliveries of
semis need to be
ensured for very long
periods of time:
for car industry:
7 to 24 years;
for train industry:
about 15 years.
Both deep and wide
know-how and
understanding of our
customers' applications
needed for making best
in class solutions:
e.g. HEV/EV needs
both automotive and
industrial expertise.
Products need to
reliably perform well in
the field over longer
periods of time:
airbag reliability
required as long as
the car is in use;
wind turbines should
function 30 years.
Courtesy: Siemens Courtesy: BMW
#1
Page 26 Copyright © Infineon Technologies 2011. All rights reserved.
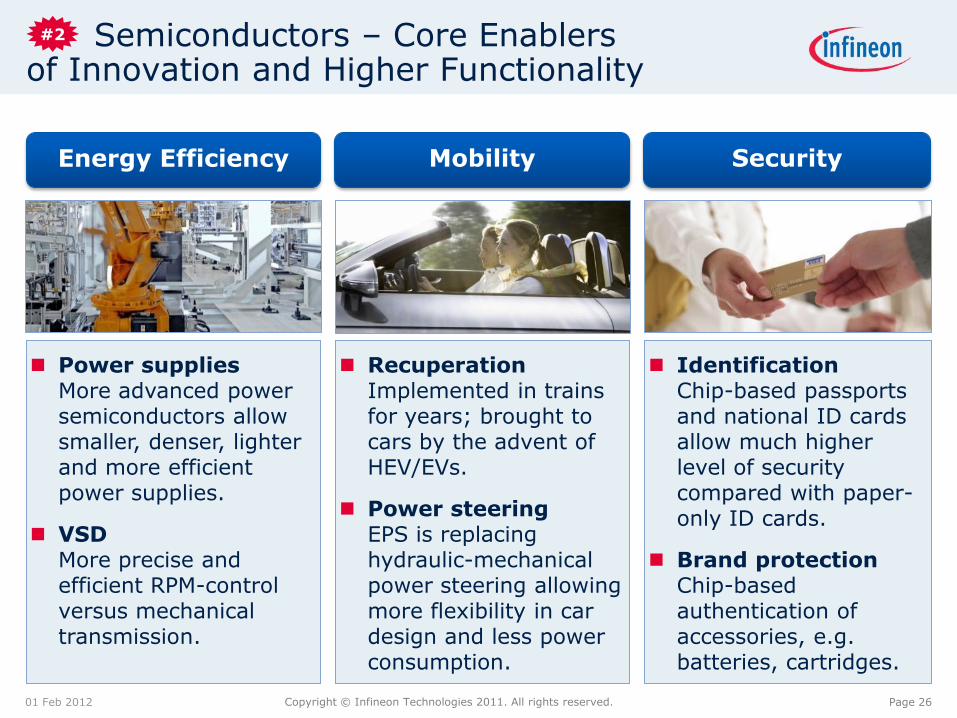
Semiconductors – Core Enablers of Innovation and Higher Functionality
01 Feb 2012
Power supplies More advanced power semiconductors allow smaller, denser, lighter and more efficient power supplies.
VSD More precise and efficient RPM-control versus mechanical transmission.
Recuperation Implemented in trains for years; brought to cars by the advent of HEV/EVs.
Power steering EPS is replacing hydraulic-mechanical power steering allowing more flexibility in car design and less power consumption.
Identification Chip-based passports and national ID cards allow much higher level of security compared with paper-only ID cards.
Brand protection Chip-based authentication of accessories, e.g. batteries, cartridges.
Energy Efficiency Mobility Security
#2
Page 27 Copyright © Infineon Technologies 2011. All rights reserved.
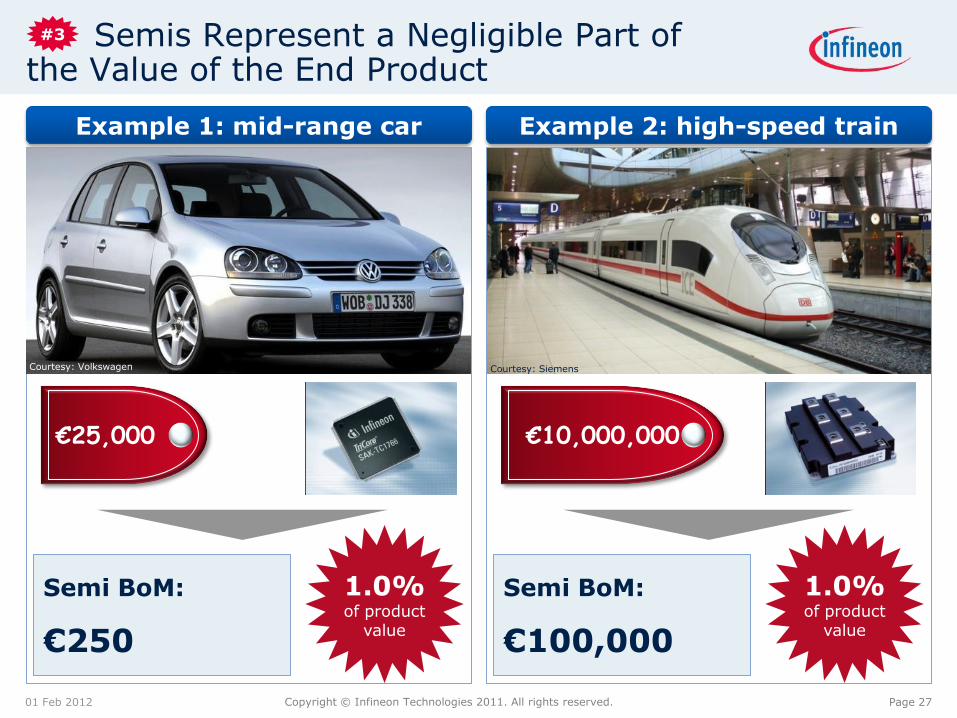
Semis Represent a Negligible Part of the Value of the End Product
01 Feb 2012
Example 1: mid-range car
1.0% of product
value
Example 2: high-speed train
1.0% of product
value
EUR 6m
Semi BoM:
€250
€25,000 €10,000,000
Semi BoM:
€100,000
Courtesy: Siemens Courtesy: Volkswagen
#3
Page 28 Copyright © Infineon Technologies 2011. All rights reserved.
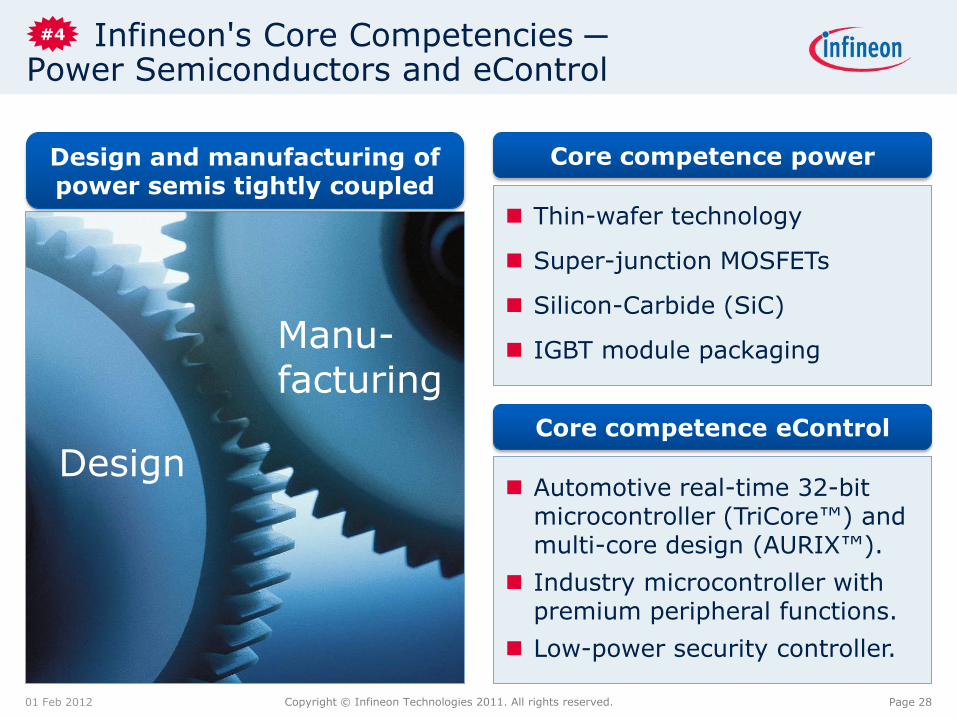
Infineon's Core Competencies ─ Power Semiconductors and eControl
01 Feb 2012
Design
Manu- facturing
Thin-wafer technology
Super-junction MOSFETs
Silicon-Carbide (SiC)
IGBT module packaging
Core competence power Design and manufacturing of power semis tightly coupled
Core competence eControl
Automotive real-time 32-bit microcontroller (TriCore™) and multi-core design (AURIX™).
Industry microcontroller with premium peripheral functions.
Low-power security controller.
#4
Copyright © Infineon Technologies 2010. All rights reserved. 2011
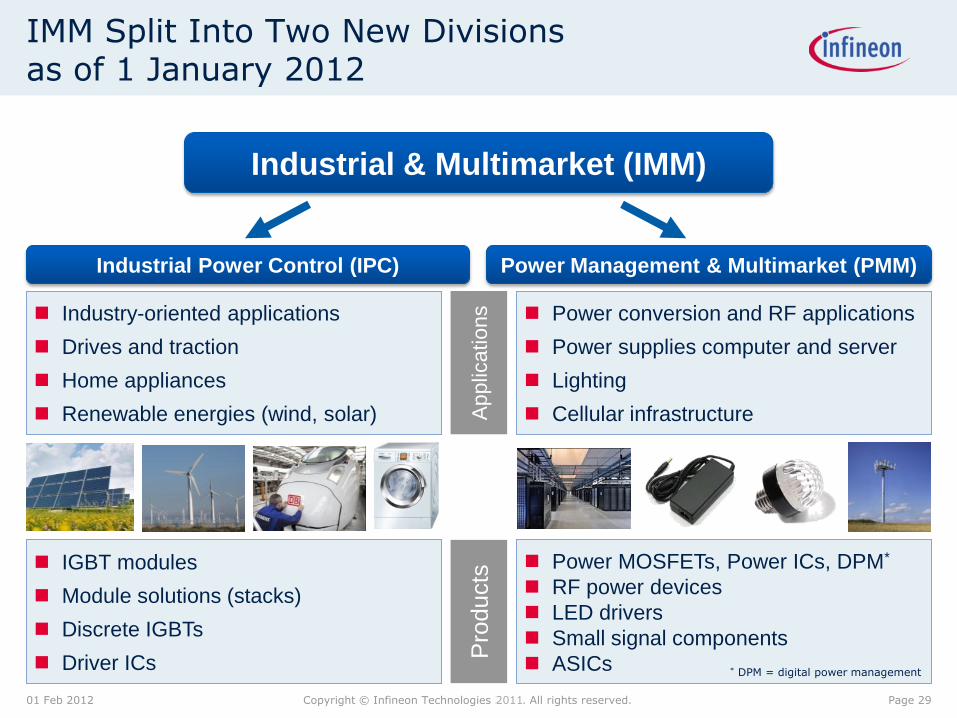
IMM Split Into Two New Divisions as of 1 January 2012
01 Feb 2012
Industry-oriented applications
Drives and traction
Home appliances
Renewable energies (wind, solar)
Power conversion and RF applications
Power supplies computer and server
Lighting
Cellular infrastructure
IGBT modules
Module solutions (stacks)
Discrete IGBTs
Driver ICs
Power MOSFETs, Power ICs, DPM*
RF power devices
LED drivers
Small signal components
ASICs
Pro
ducts
A
pplic
ations
Industrial & Multimarket (IMM)
Power Management & Multimarket (PMM) Industrial Power Control (IPC)
Page 29
* DPM = digital power management
Copyright © Infineon Technologies 2010. All rights reserved. 2011
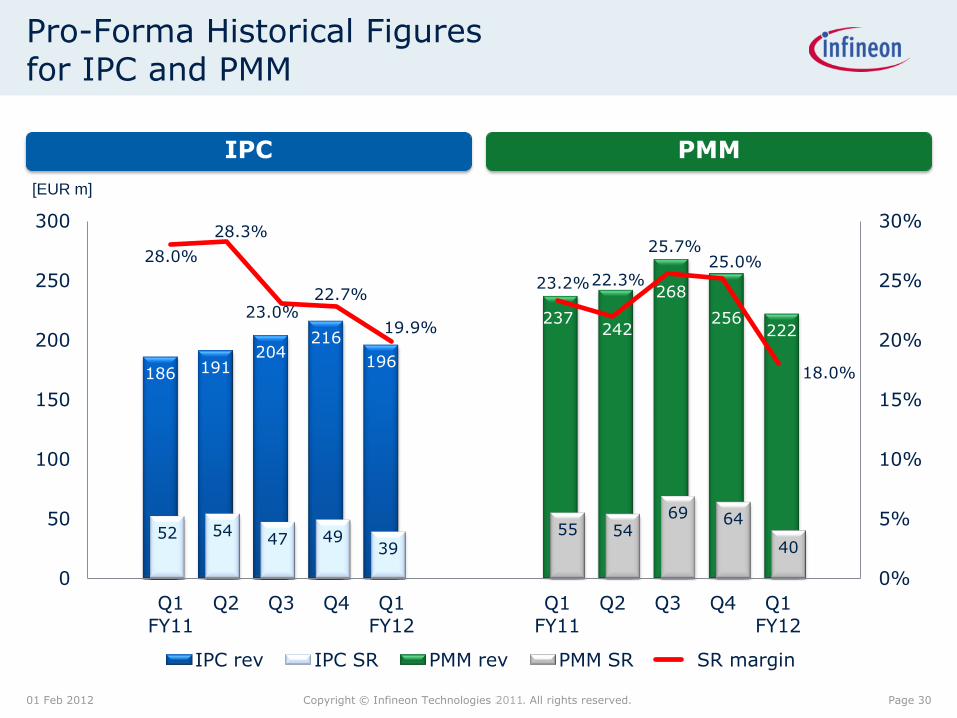
Pro-Forma Historical Figures for IPC and PMM
186 191 204
216
196
52 54 47 49
39
237 242
268
256 222
55 54 69 64
40
28.0%
28.3%
23.0% 22.7%
19.9%
23.2% 22.3%
25.7% 25.0%
18.0%
0%
5%
10%
15%
20%
25%
30%
0
50
100
150
200
250
300
Q1
FY11 Q2 Q3 Q4 Q1
FY12 Q1
FY11 Q2 Q3 Q4 Q1
FY12
IPC rev IPC SR PMM rev PMM SR SR margin
01 Feb 2012 Page 30
IPC PMM
[EUR m]
Copyright © Infineon Technologies 2010. All rights reserved. 2011
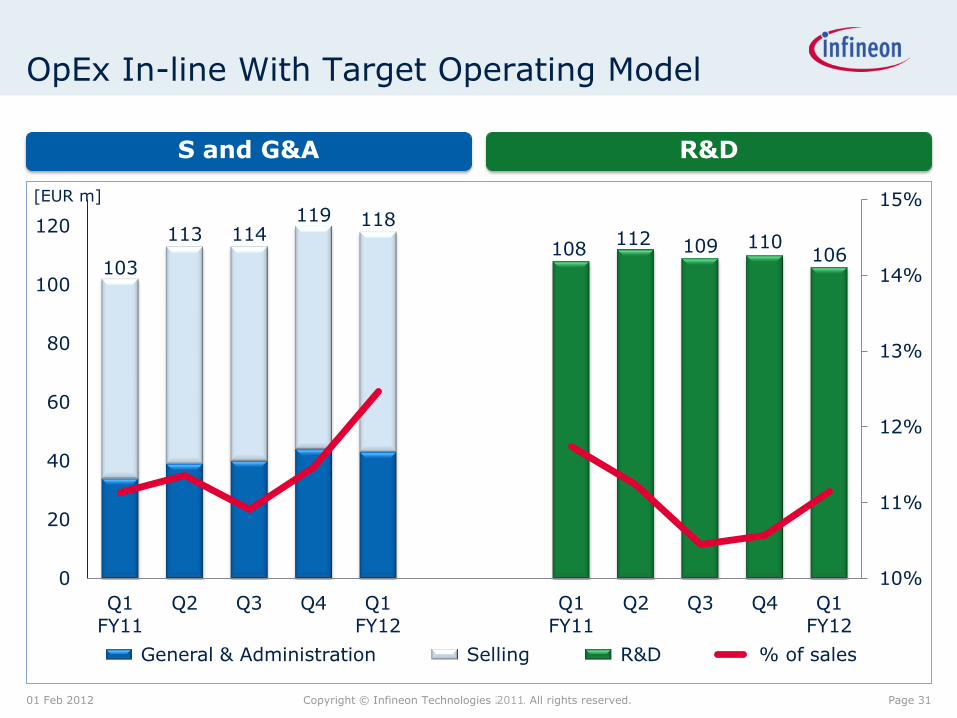
103
113 114 119 118
108 112 109 110
106
10%
11%
12%
13%
14%
15%
0
20
40
60
80
100
120
Q1
FY11 Q2 Q3 Q4 Q1
FY12 Q1
FY11 Q2 Q3 Q4 Q1
FY12
General & Administration Selling R&D % of sales
OpEx In-line With Target Operating Model
01 Feb 2012
S and G&A R&D
[EUR m]
Page 31
Copyright © Infineon Technologies 2010. All rights reserved. 2011 01 Feb 2012 Page 32
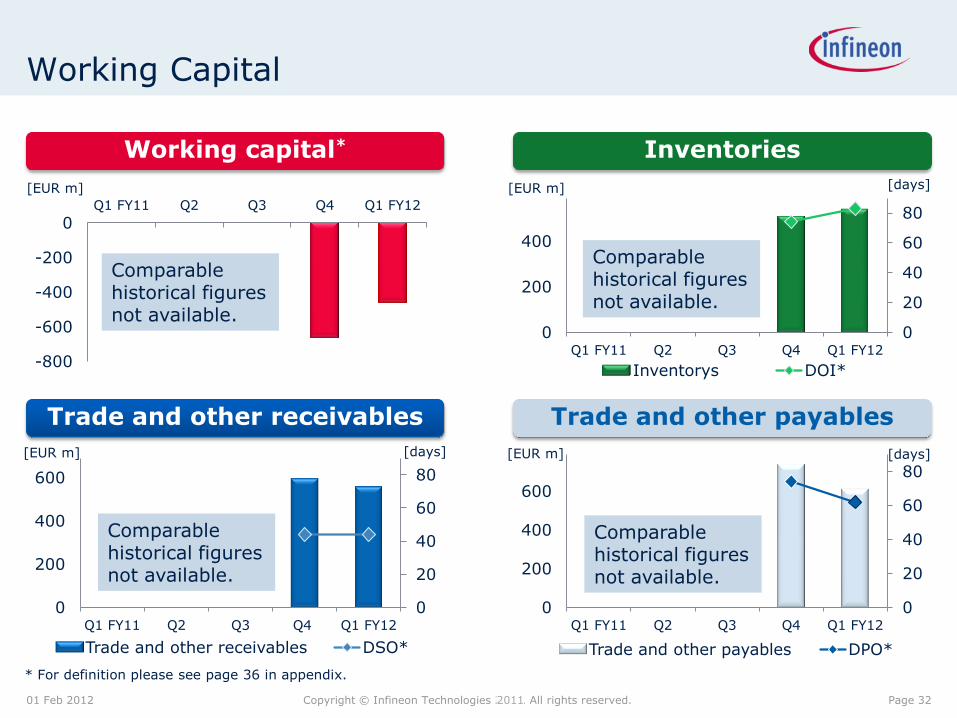
Working capital* Inventories
Trade and other receivables Trade and other payables
[EUR m]
* For definition please see page 36 in appendix.
0
20
40
60
80
0
200
400
Q1 FY11 Q2 Q3 Q4 Q1 FY12
Inventorys DOI*
[EUR m] [days]
Working Capital
0
20
40
60
80
0
200
400
600
Q1 FY11 Q2 Q3 Q4 Q1 FY12
Trade and other receivables DSO*
[EUR m] [days]
0
20
40
60
80
0
200
400
600
Q1 FY11 Q2 Q3 Q4 Q1 FY12
Trade and other payables DPO*
[EUR m] [days]
-800
-600
-400
-200
0 Q1 FY11 Q2 Q3 Q4 Q1 FY12
Comparable historical figures not available.
Comparable historical figures not available.
Comparable historical figures not available.
Comparable historical figures not available.
Copyright © Infineon Technologies 2010. All rights reserved. 2011
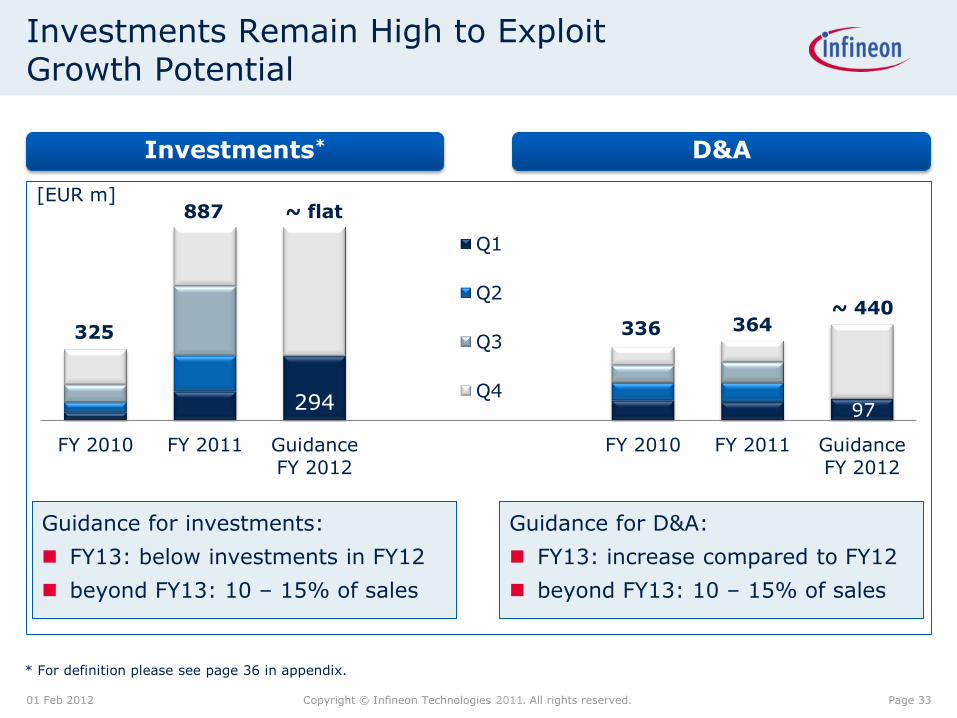
Investments Remain High to Exploit Growth Potential
Investments*
01 Feb 2012
294 97
FY 2010 FY 2011 Guidance
FY 2012 FY 2010 FY 2011 Guidance
FY 2012
Q1
Q2
Q3
Q4
325
~ flat
~ 440
887
336 364
D&A
[EUR m]
Guidance for investments:
FY13: below investments in FY12
beyond FY13: 10 – 15% of sales
Guidance for D&A:
FY13: increase compared to FY12
beyond FY13: 10 – 15% of sales
Page 33
* For definition please see page 36 in appendix.
Copyright © Infineon Technologies 2010. All rights reserved. 2011
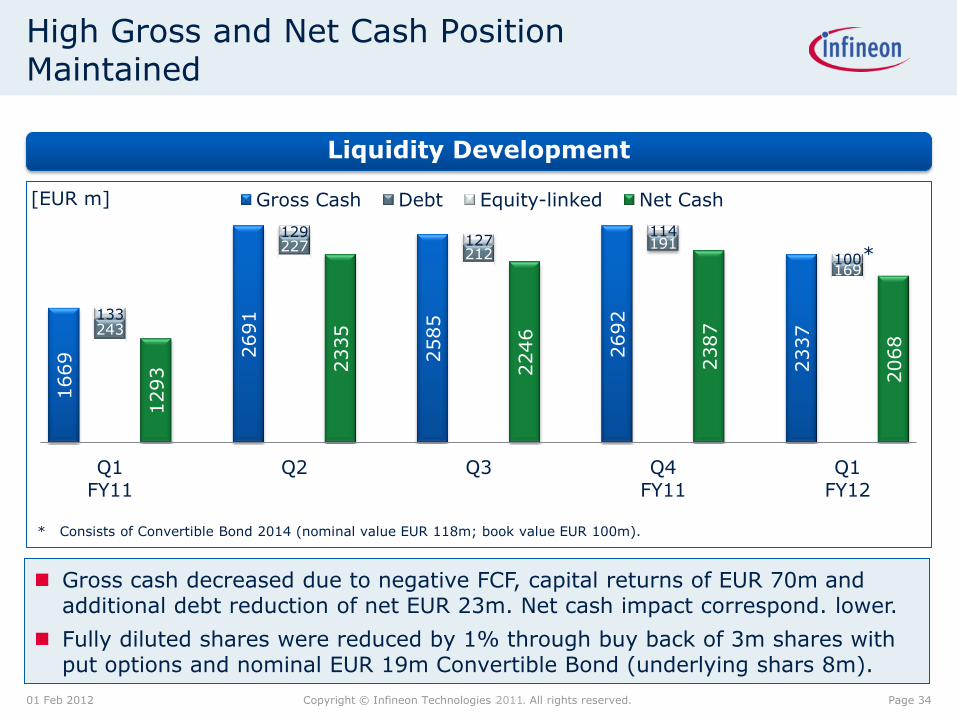
1669 2691
2585
2692
2337
243
227 212
191
169
133
129 127
114
100
1293 2335
2246
2387
2068
Q1 FY11
Q2 Q3 Q4 FY11
Q1 FY12
Gross Cash Debt Equity-linked Net Cash
High Gross and Net Cash Position Maintained
Liquidity Development
* Consists of Convertible Bond 2014 (nominal value EUR 118m; book value EUR 100m).
01 Feb 2012
[EUR m]
*
Page 34
Gross cash decreased due to negative FCF, capital returns of EUR 70m and additional debt reduction of net EUR 23m. Net cash impact correspond. lower.
Fully diluted shares were reduced by 1% through buy back of 3m shares with put options and nominal EUR 19m Convertible Bond (underlying shars 8m).
Copyright © Infineon Technologies 2010. All rights reserved.
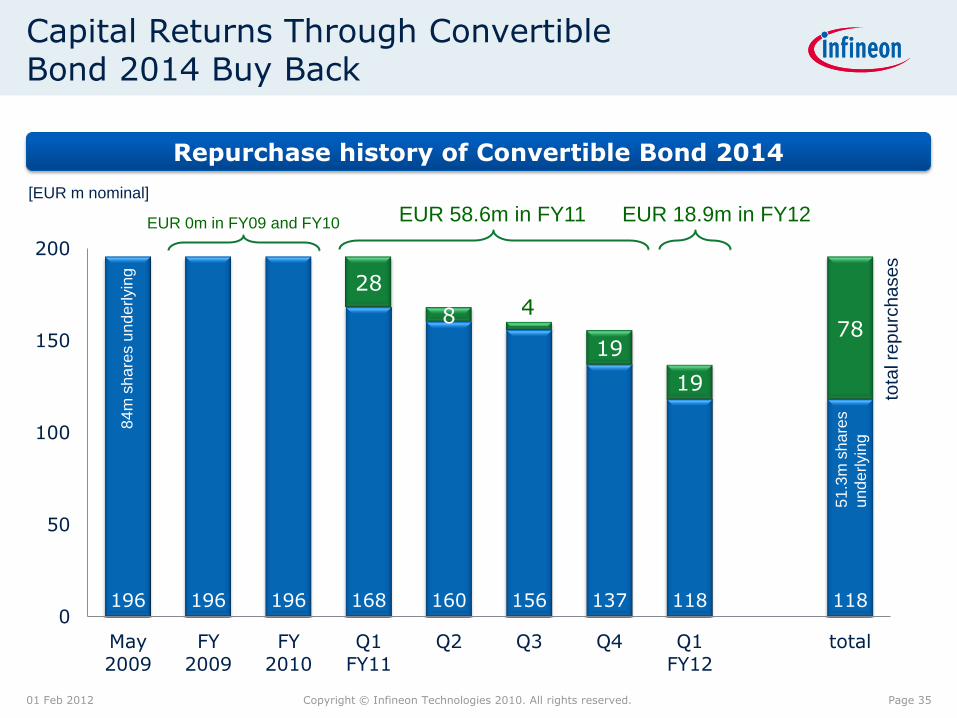
Capital Returns Through Convertible Bond 2014 Buy Back
196 196 196 168 160 156 137 118 118
28
8 4
19
19
78
0
50
100
150
200
May 2009
FY 2009
FY 2010
Q1 FY11
Q2 Q3 Q4 Q1 FY12
total
01 Feb 2012 Page 35
Repurchase history of Convertible Bond 2014
[EUR m nominal]
EUR 58.6m in FY11 EUR 0m in FY09 and FY10 EUR 18.9m in FY12
tota
l re
pu
rch
ases
84
m s
ha
res u
nd
erlyin
g
51
.3m
sh
are
s
un
de
rlyin
g
Copyright © Infineon Technologies 2010. All rights reserved. 2011
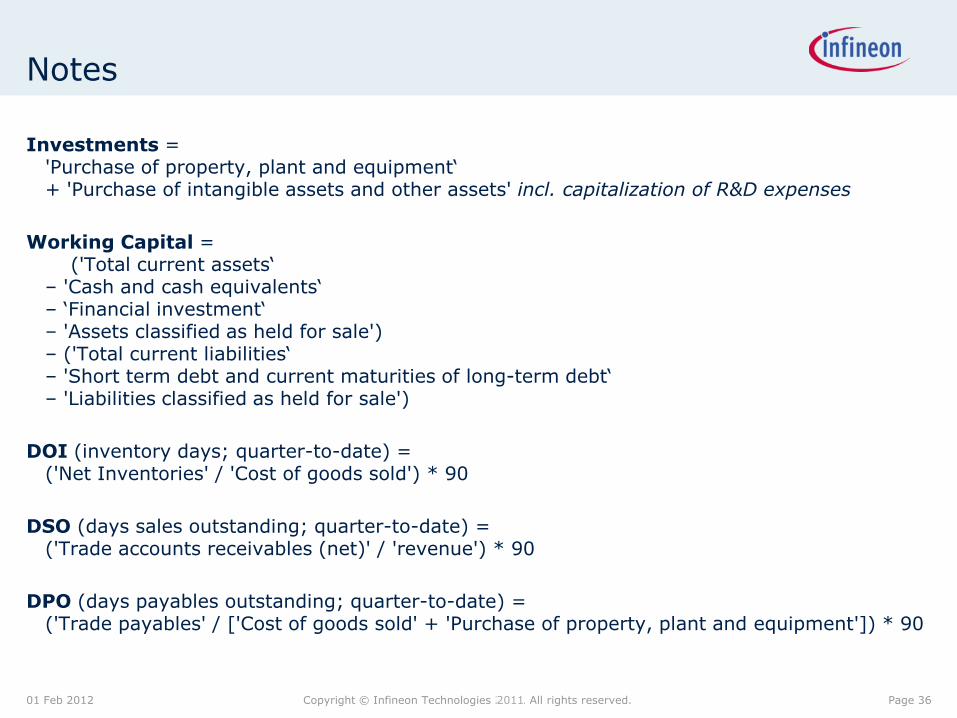
Notes
01 Feb 2012
Investments = 'Purchase of property, plant and equipment‘ + 'Purchase of intangible assets and other assets' incl. capitalization of R&D expenses
Working Capital = ('Total current assets‘ – 'Cash and cash equivalents‘ – ‘Financial investment‘ – 'Assets classified as held for sale') – ('Total current liabilities‘ – 'Short term debt and current maturities of long-term debt‘ – 'Liabilities classified as held for sale')
DOI (inventory days; quarter-to-date) = ('Net Inventories' / 'Cost of goods sold') * 90
DSO (days sales outstanding; quarter-to-date) = ('Trade accounts receivables (net)' / 'revenue') * 90
DPO (days payables outstanding; quarter-to-date) = ('Trade payables' / ['Cost of goods sold' + 'Purchase of property, plant and equipment']) * 90
Page 36
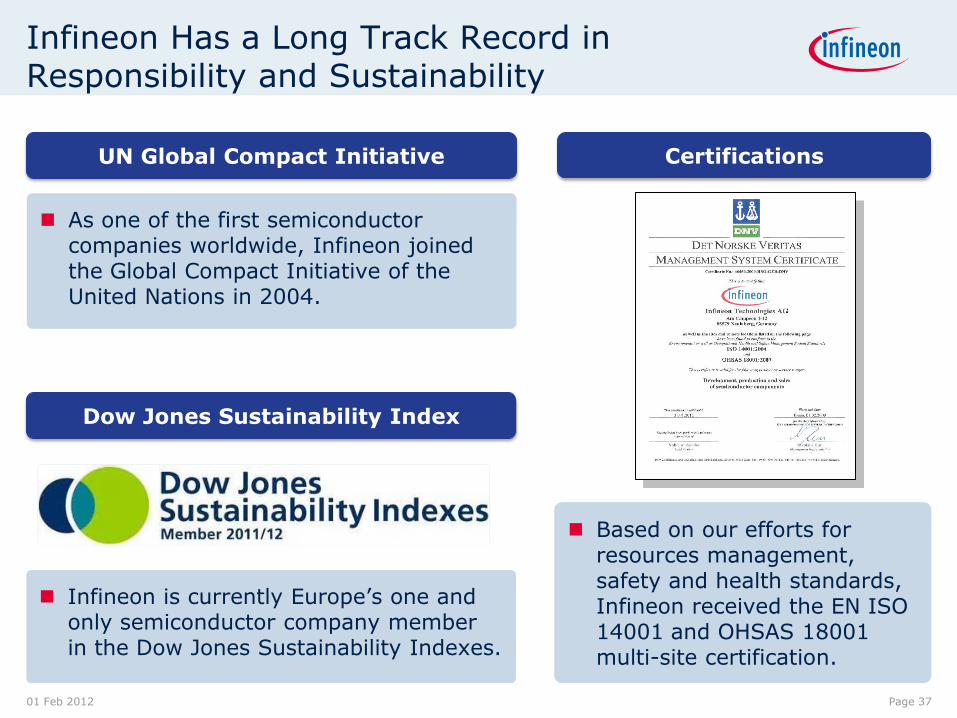
Infineon is currently Europe’s one and only semiconductor company member in the Dow Jones Sustainability Indexes.
Infineon Has a Long Track Record in Responsibility and Sustainability
01 Feb 2012 Page 37
As one of the first semiconductor companies worldwide, Infineon joined the Global Compact Initiative of the United Nations in 2004.
Based on our efforts for resources management, safety and health standards, Infineon received the EN ISO 14001 and OHSAS 18001 multi-site certification.
Certifications
Dow Jones Sustainability Index
UN Global Compact Initiative
Copyright © Infineon Technologies 2010. All rights reserved. 2011
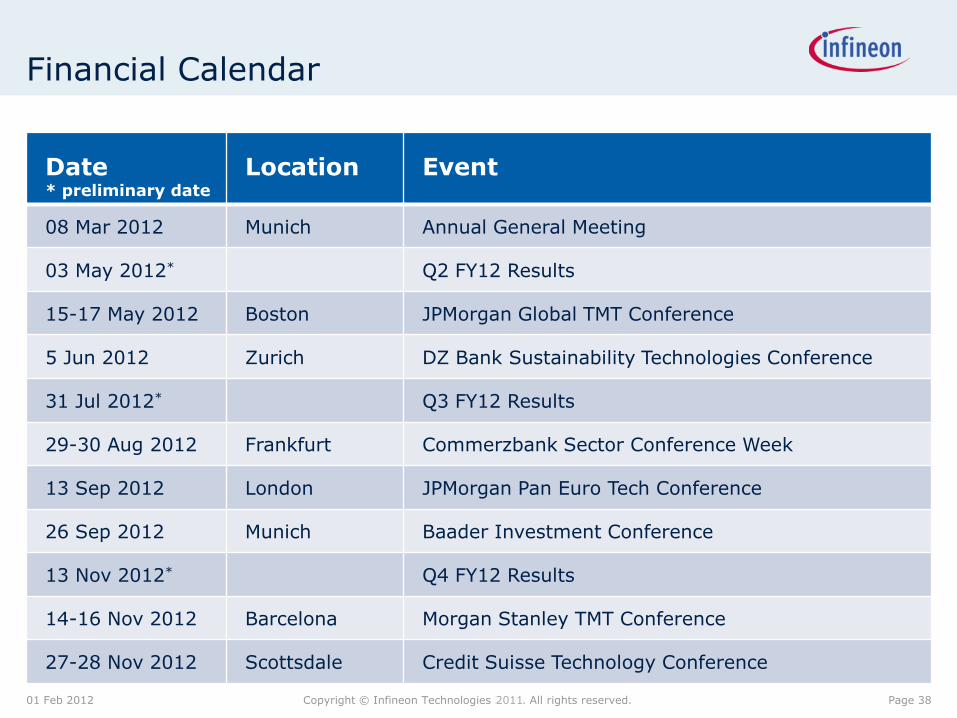
Financial Calendar
01 Feb 2012
Date * preliminary date
Location Event
08 Mar 2012 Munich Annual General Meeting
03 May 2012* Q2 FY12 Results
15-17 May 2012 Boston JPMorgan Global TMT Conference
5 Jun 2012 Zurich DZ Bank Sustainability Technologies Conference
31 Jul 2012* Q3 FY12 Results
29-30 Aug 2012 Frankfurt Commerzbank Sector Conference Week
13 Sep 2012 London JPMorgan Pan Euro Tech Conference
26 Sep 2012 Munich Baader Investment Conference
13 Nov 2012* Q4 FY12 Results
14-16 Nov 2012 Barcelona Morgan Stanley TMT Conference
27-28 Nov 2012 Scottsdale Credit Suisse Technology Conference
Page 38
Copyright © Infineon Technologies 2010. All rights reserved. 2011
Institutional Investor Relations Contact
Ulrich Pelzer
Corporate Vice President, Corporate Finance & Treasury, Investor Relations
+49 89 234-26153 [email protected]
01 Feb 2012
Joachim Binder
Senior Director, Investor Relations
+49 89 234-25649 [email protected]
Aleksandar Josic
Manager, Investor Relations
+49 89 234-83045 [email protected]
Holger Schmidt
Manager, Investor Relations
+49 89 234-22332 [email protected]
Page 39
Copyright © Infineon Technologies 2010. All rights reserved. 2011
Disclaimer
This presentation was prepared as of 1 February 2012 and is current only as of that date.
This presentation includes forward-looking statements and assumptions about the future of Infineon’s
business and the industry in which we operate. These include statements and assumptions relating to general
economic conditions, future developments in the world semiconductor market, our ability to manage our costs
and to achieve our growth targets, the resolution of Qimonda’s insolvency proceedings and the liabilities we
may face as a result of Qimonda’s insolvency, the benefits of research and development alliances and
activities, our planned levels of future investment, the introduction of new technology at our facilities, our
continuing ability to offer commercially viable products, and our expected or projected future results.
These forward-looking statements are subject to a number of uncertainties, such as broader economic
developments, including the market environment; trends in demand and prices for semiconductors generally
and for our products in particular, as well as for the end-products, such as automobiles, drives, renewable
energies and consumer electronics, that incorporate our products; the success of our development efforts,
both alone and with partners; the success of our efforts to introduce new production processes at our facilities;
the actions of competitors; the continued availability of adequate funds; any mergers, acquisitions or
dispositions we may undertake; the outcome of antitrust investigations and litigation matters; and the
resolution of Qimonda’s insolvency proceedings; as well as the other factors mentioned in this presentation
and those disclosed at other occasions.
As a result, Infineon’s actual results could differ materially from those contained in or suggested by these
forward-looking statements. You are cautioned not to place undue reliance on these forward-looking
statements. Infineon does not undertake any obligation to publicly update or revise any forward-looking
statements in light of developments which differ from those anticipated.
01 Feb 2012 Page 40


