34
2018 first quarter report

2018first quarter report
Q1
Contents
Financial review 2Overview 2Market developments and outlook 5Additional factors impacting Hydro 8Underlying EBIT 10Finance 14Tax 14
Pro forma information 15
Interim financial statements 17Condensed consolidated statements of income (unaudited) 17Condensed consolidated statements of comprehensive income (unaudited) 18Condensed consolidated balance sheets (unaudited) 19Condensed consolidated statements of cash flows (unaudited) 20Condensed consolidated statements of changes in equity (unaudited) 21Notes to the condensed consolidated financial statements (unaudited) 22
Alternative performance measures 28
Additional information 32Financial calendar 32
Oslo, April 24, 2018
FIRST QUARTER REPORT 20181

Overview
Summary underlying financial and operating results and liquidity
Key financial information
NOK million, except per share data
First
quarter
2018
First
quarter
2017
Change
prior year
quarter
Fourth
quarter
2017
Change
prior
quarter
Year
2017
Revenue 39 971 23 026 74 % 38 803 3 % 109 220
Earnings before financial items and tax (EBIT) 3 301 2 410 37 % 4 511 (27) % 12 189
Items excluded from underlying EBIT1)
(155) (126) (23) % (956) 84 % (974)
Underlying EBIT1)
3 147 2 284 38 % 3 555 (11) % 11 215
Underlying EBIT :
Bauxite & Alumina 741 756 (2) % 1 872 (60) % 3 704
Primary Metal 823 900 (9) % 1 377 (40) % 5 061
Metal Markets 178 24 >100 % 185 (4) % 544
Rolled Products 232 106 >100 % 95 >100 % 380
Extruded Solutions2)
734 284 >100 % 284
Energy 278 423 (34) % 457 (39) % 1 531
Other and eliminations2)
161 74 >100 % (715) >100 % (289)
Underlying EBIT1)
3 147 2 284 38 % 3 555 (11) % 11 215
Earnings before financial items, tax, depreciation and
amortization (EBITDA)3)
5 193 3 762 38 % 6 481 (20) % 18 344
Underlying EBITDA1)
5 038 3 637 39 % 5 524 (9) % 17 369
Net income (loss) 2 076 1 838 13 % 3 600 (42) % 9 184
Underlying net income (loss)1)
2 201 1 580 39 % 2 816 (22) % 8 396
Earnings per share 1.02 0.86 19 % 1.71 (40) % 4.30
Underlying earnings per share1)
1.06 0.75 41 % 1.33 (21) % 3.95
Financial data:
Investments1) 3) 1 319 1 372 (4) % 24 632 (95) % 28 848
Adjusted net cash (debt)1)
(16 890) (5 358) >(100) % (17 968) 6 % (17 968)
Key Operational informationFirst
quarter
2018
First
quarter
2017
Change
prior year
quarter
Fourth
quarter
2017
Change
prior
quarter
Year
2017
Bauxite production (kmt)4)
2 326 2 400 (3) % 3 049 (24) % 11 435
Alumina production (kmt) 1 277 1 523 (16) % 1 693 (25) % 6 397
Primary aluminium production (kmt) 514 516 - 528 (3) % 2 094
Realized aluminium price LME (USD/mt) 2 140 1 757 22 % 2 092 2 % 1 915
Realized aluminium price LME (NOK/mt) 16 929 14 798 14 % 17 066 (1) % 15 888
Realized USD/NOK exchange rate 7.91 8.42 (6) % 8.16 (3) % 8.30
Rolled Products sales volumes to external market (kmt) 245 241 2 % 224 9 % 940
Extruded Solutions sales volumes to external market (kmt)5)
362 178 >100 % 318 14 % 845
Power production (GWh) 2 433 2 869 (15) % 3 089 (21) % 10 835
1) Alternative performance measures (APMs) are described in the corresponding section in the back of the report.
2) Other and eliminations includes Hydro's 50 percent share of underlying net income from Sapa until end of third quarter 2017. Extruded Solutions was fully consolidated from October 2,2017.
3) EBITDA and investments per segment are specified in Note 2: Operating segment information.
4) Paragominas production, on wet basis.
5) Hydro's 50 percent share of Sapa sales volumes until end of third quarter 2017 and 100 percent of Extruded Solutions sales volumes from the beginning of the fourth quarter 2017.
FIRST QUARTER REPORT 2018 2
Hydro's underlying earnings before financial items and tax increased to NOK 3,147 million in the first quarter, up from NOK2,284 million for same quarter last year. The increase mainly reflects a higher all-in metal price1) and higher realized aluminaprice, partly offset by increased raw material costs.
Compared to the fourth quarter of 2017 the underlying EBIT decreased from NOK 3,555 to NOK 3,147 million. Thedecrease reflects lower alumina sales prices and increased raw material costs.
Following a period of extreme rainfall in February authorities ordered several measures against Alunorte, including that theAlunorte alumina refinery is required to operate at 50 percent of its capacity while authorities review the situation, overconcerns that flooding led to harmful spills. Findings of an internal and an external task force confirm that there was nooverflow from the bauxite residue deposit areas as well as no indication or evidence of contamination to nearby localcommunities from Alunorte as a result of the heavy rainfall.
Due to the situation in Brazil, Hydro's "Better" improvement program is not expected to reach the 2018 target of NOK 500million.
Hydro's net debt position improved from NOK 4.1 billion2) to NOK 3.6 billion at the end of the quarter. Net cash providedby operating activities amounted to NOK 2.0 billion. Net cash used in investment activities, excluding short term investments,amounted to NOK 1.5 billion.
1) The all-in metal price refers to the LME cash price plus premiums.
2) Net cash (debt) includes Cash and cash equivalents and Short-term investments less Bank loans and other interest bearing Short-term debt and Long-term debt.
FIRST QUARTER REPORT 20183

Reported EBIT and net income
In addition to the factors discussed above, reported earnings before financial items and tax (EBIT) and net income includeeffects that are disclosed in the below table. Items excluded from underlying EBIT and underlying net income (loss) aredefined and described as part of the APM section in the back of this report.
Items excluded from underlying EBIT and net income 1)
NOK million
First
quarter
2018
First
quarter
2017
Fourth
quarter
2017
Year
2017
Unrealized derivative effects on LME related contracts (114) 18 140 220
Unrealized derivative effects on power and raw material contracts (87) 173 91 246
Metal effect, Rolled Products 47 (286) (146) (419)
Significant rationalization charges and closure costs2)
- - 210 210
Other effects3)
- - 212 212
Transaction related effects (Sapa)4)
- - (1 463) (1 463)
Items excluded in equity accounted investments (Sapa)5)
- (32) - 19
Items excluded from underlying EBIT (155) (126) (956) (974)
Net foreign exchange (gain)/loss 333 (218) 696 875
Calculated income tax effect (54) 86 (523) (564)
Other adjustments to net income6)
- - - (125)
Items excluded from underlying net income 125 (258) (783) (788)
Income (loss) tax rate 27 % 28 % 4 % 17 %
Underlying income (loss) tax rate 27 % 28 % 19 % 24 %
1) Negative figures indicate reversal of a gain and positive figures indicate reversal of a loss.
2) Significant rationalization charges and closure costs include environmental liability in Kurri Kurri of NOK 181 million and rationalization costs in Extruded Solutions of NOK 29 million in thefourth quarter 2017.
3) Other effects include a charge of NOK 245 million related to a customs case in Germany and a gain of NOK 33 in relation to remeasurement of environmental liabilities related to closedbusiness in Germany in the fourth quarter 2017.
4) Transaction related effects include the revaluation gain of NOK 2,171 million of Hydro’s pre-transactional 50 percent interest in Sapa, as well as the fair value allocated to inventory offinished goods and to the backlog of contractual deliveries as of closure, sold during fourth quarter 2017, reflecting an expense of NOK 707 million.
5) Items excluded in equity accounted investments (Sapa) for the year 2017 include unrealized derivative gains, rationalization charges and net foreign exchange gains.
6) Other adjustments to net income include reduction in tax expense and related interest income of NOK 125 million in total following a closed tax case in September 2017.
FIRST QUARTER REPORT 2018 4

Market developments and outlook
Market statistics
First
quarter
2018
First
quarter
2017
Change
prior year
quarter
Fourth
quarter
2017
Change
prior
quarter
Year
2017
USD/NOK Average exchange rate 7.84 8.44 (7) % 8.16 (4) % 8.26
USD/NOK Period end exchange rate 7.78 8.58 (9) % 8.21 (5) % 8.21
BRL/NOK Average exchange rate 2.42 2.69 (10) % 2.51 (4) % 2.59
BRL/NOK Period end exchange rate 2.34 2.71 (14) % 2.48 (6) % 2.48
USD/BRL Average exchange rate 3.24 3.14 3 % 3.24 - 3.19
USD/BRL Period end exchange rate 3.33 3.16 5 % 3.31 1 % 3.31
EUR/NOK Average exchange rate 9.63 8.99 7 % 9.60 - 9.33
EUR/NOK Period end exchange rate 9.64 9.17 5 % 9.84 (2) % 9.84
Bauxite and alumina:
Average alumina price - Platts PAX FOB Australia (USD/t) 383 340 13 % 446 (14) % 355
China bauxite import price (USD/mt CIF China) 54 49 9 % 53 2 % 51
Global production of alumina (kmt) 30 336 30 357 - 30 799 (2) % 123 779
Global production of alumina (ex. China) (kmt) 14 107 13 684 3 % 14 080 - 55 697
Primary aluminium:
LME three month average (USD/mt) 2 164 1 856 17 % 2 119 2 % 1 980
LME three month average (NOK/mt) 16 958 15 651 8 % 17 285 (2) % 16 337
Standard ingot premium (EU DP Cash) 165 149 11 % 159 4 % 148
Extrusion ingot premium (DP) 351 313 12 % 353 (1) % 334
Global production of primary aluminium (kmt) 15 604 15 573 - 15 831 (1) % 63 527
Global consumption of primary aluminum (kmt) 15 582 14 969 4 % 16 094 (3) % 63 711
Global production of primary aluminium (ex. China) (kmt) 6 854 6 702 2 % 6 940 (1) % 27 222
Global consumption of primary aluminum (ex. China) (kmt) 7 387 7 149 3 % 7 299 1 % 29 242
Reported primary aluminium inventories (kmt) 5 959 5 594 7 % 5 370 11 % 5 370
Rolled products and extruded products:
Consumption rolled products - Europe (kmt) 1 267 1 223 4 % 1 150 10 % 4 882
Consumption rolled products - USA & Canada (kmt) 1 368 1 233 11 % 1 222 12 % 5 063
Consumption extruded products - Europe (kmt) 788 765 3 % 704 12 % 3 050
Consumption extruded products - USA & Canada (kmt) 655 609 8 % 584 12 % 2 448
Energy:
Average southern Norway spot price (NO2) (NOK/MWh) 361 278 30 % 287 26 % 269
Average mid Norway spot price (NO3) (NOK/MWh) 374 282 33 % 291 29 % 275
Average nordic system spot price (NOK/MWh) 372 280 33 % 294 26 % 274
Chinese alumina imports amounted to 0.2 million mt in the first two months of 2018, down 65 percent from the same periodin 2017. Chinese bauxite imports increased 48 percent to 13.1 million mt compared to the first two months of 2017. Drivenby the ramp-up of new bauxite mines during 2017, imports from Guinea surged to 6.9 million mt from 4.8 million mt in thefirst two months of 2017. Supply of bauxite from the Atlantic basin accounted for 56 percent of Chinese imports in the firsttwo months in the year, up from 41 percent in the corresponding period in 2017.
Bauxite and alumina
Platts alumina spot prices averaged USD 383 per mt in the first quarter of 2018, a decrease of USD 63 per mt compared tothe previous quarter. Prices started the quarter at USD 389 per mt and weakened through the end of February on theexpectation of Chinese capacity restarts after the mandated production cuts during the winter heating season from November15 to March 15. Prices then rallied strongly ending the quarter at USD 443 per mt, due to concerns about the market balanceas the Alunorte refinery was required to reduce production by 50 percent. Average prices represented 17.8 percent of LME inthe quarter compared with 18.3 percent in the previous quarter. Lower production at Alunorte has tightened the aluminamarket balance excluding China and driven alumina prices up significantly.
FIRST QUARTER REPORT 20185
According to Chinese import statistics, the average delivered China bauxite price was USD 53.9 per mt in the first two monthsof 2018, 2 percent above the fourth quarter 2017 average of USD 52.7 per mt.
Three-month LME prices ranged between USD 2,014 and USD 2,268 per mt during the first quarter of 2018. The averageLME three-month price was USD 2,164, increasing USD 308 per mt compared to the first quarter of 2017. European averageall-in metal prices 1) increased from USD 1,999 per mt in the first quarter of 2017 to USD 2,324 in the first quarter of 2018,due to a combination of an increase in LME prices, and increased premiums.
Primary aluminium
European duty paid standard ingot premiums ended the first quarter of 2018 at USD 164 per mt, compared to USD 162 atthe beginning of the quarter, averaging USD 165 per mt for the the first quarter compared to USD 149 per mt in the firstquarter of 2017. Midwest premiums started the first quarter at USD 209 per mt, and ended at USD 419 per mt, averagingUSD 318 per mt compared to USD 214 per mt in the first quarter of 2017. The reason for the large increase in premiums inNorth America is the 10 percent import duty that USA has introduced for aluminium imports from many countries.
Shanghai Futures Exchange (SHFE) prices increased by USD 217 per mt ex. VAT, compared to the first quarter in 2017. TheSHFE increase was less than the equivalent LME increase over the quarter as reported stock levels in China continue toincrease, despite the central Government’s efforts to reduce primary production capacity. The US administration'simplementation of higher import duties also contributed to the differentials in price increases. As a consequence, exportarbitrage potential and semis exports increased during the quarter compared to the first quarter of 2017.
Global primary aluminium consumption increased by 4.1 percent to 15.6 million mt in the first quarter of this year comparedto the first quarter of 2017, due to improved global sentiments and a continued still strong demand growth in China.Compared to the fourth quarter of 2017, global demand in the first quarter of 2018 decreased by 3.2 percent, due largely toseasonality effects in China. Global demand for primary aluminium grew by 6.0 percent in 2017, and is expected to grow byaround 4-5 percent in 2018.
Outside China, demand increased by 3.3 percent in the first quarter compared to the first quarter of 2017, while the increasefrom the fourth quarter of 2017 was 1.2 percent. Consumption outside China amounted to 7.4 million mt for the first quarterof 2018. Corresponding production amounted to 6.9 million mt, an increase of 2.3 percent compared to the first quarter of2017. Production outside China experienced a 1.2 percent decrease in the first quarter this year compared to the fourthquarter of 2017. Production was dampened by increasing raw material costs and higher uncertainty. Demand for primaryaluminium outside China grew by around 3.4 percent in 2017, and is expected to grow by 3-4 percent in 2018. Productionoutside China is expected to increase by 3-4 percent in 2018.
Compared to the first quarter of 2017, Chinese aluminium consumption increased by 4.8 percent to 8.2 million mt. Thedecrease compared to the fourth quarter of 2017 was, however, 6.8 percent, due to seasonal effects with the New Year holidayin China occurring in February this year. Corresponding aluminium production decreased by 1.4 percent compared to the firstquarter last year, and decreased 1.6 percent compared to the fourth quarter of 2017, due to government enforced capacityclosures. The Chinese government has announced that they will continue with smelter curtailments also next winter in orderto reduce air pollution in a number of Chinese cities. Production of primary aluminium in China grew by 13.2 percent in2017, but due to the capacity control measurements that were introduced in 2017 production increase is expected to bedampened to around 3-4 percent in 2018. Demand is expected to increase by 4-6 percent in 2018, a dampening compared togrowth of 8.3 percent in 2017. Import tariffs announced by the US administration in March 2018 will most likely lead toreduced semis exports (Sections 232, 301).
1) The all-in metal price refers to the LME cash price plus premiums.
The global primary aluminium market is moving towards a deficit in 2018, driven by slower than expected supply growth.
On March 8th, the US administration announced a 10 percent tariff on aluminium imports to the US, effective from March23rd. Temporary exemptions have been granted until May 1st for Canada and Mexico, EU, Australia, Argentina, Brazil and
FIRST QUARTER REPORT 2018 6

South-Korea. The tariff increases supply cost for the US fabrication sector. However, the increase in US premiums reflectingthe duty level is expected to be passed through to the product price, with uncertain effects for US downstream fabrication.
On April 6, the US Department of Treasury’s Office of Foreign Assets Control issued a sanctions list that included Russianindividuals and companies including the Russian aluminium company Rusal. The US sanctions are likely to lead to changes inthe global metal flow and following this announcement the LME price increased sharply.
European demand for extrusion ingot increased in the first quarter compared to the first quarter of 2017. Demand for sheetingot and primary foundry alloys also continued increasing, mainly due to the positive developments in the automotiveindustry.
Total global stocks at the end of the first quarter were estimated to be 12.3 million mt, 0.6 million mt lower than the level atthe end of first quarter last year, but at the same level as at fourth quarter of 2017. LME stocks have declined 0.6 million mtsince the first quarter of 2017, amounting to 1.3 million mt at the end of the first quarter 2018. LME stocks have, however,increased 0.2 million mt from the end of the fourth quarter 2017. Chinese reported stocks have increased 1.0 million mt sincethe first quarter of 2017, and are now at 3.0 million mt. Chinese reported stocks have increased 0.4 million mt since thefourth quarter of 2017. Estimated unreported global stocks were down 1.2 million mt compared to the first quarter of 2017,and have decreased 0.6 million mt compared to the fourth quarter of 2017.
European demand for flat rolled products increased by around 4 percent compared to the first quarter of last year due toimproved demand across most segments. Compared to the fourth quarter of 2017 growth of around 10 percent was mainlydriven by seasonality.
Rolled products
Compared to the first quarter last year demand in automotive continued to show a positive development, driven by increasingsubstitution of steel by aluminium for automotive body sheet. However, total European car production has been flat in thequarter. Building and construction demand continued to recover, particularly in parts of Southern Europe and in Germany.Beverage can is developing positively due to beverage can steel line conversions and expected new aluminium lines in SouthernEurope. European foil demand improved, partly due to increased demand from the US as a result of the imposed anti-dumping duties on China. The demand growth in general engineering was solid despite the intensified competition fromChina.
The current positive market conditions for rolled products are expected to continue into the second quarter of 2018.
European demand for extrusions increased 3 percent compared to the first quarter of 2017, supported by stronger automotivedemand. Compared to the fourth quarter of the previous year demand increased by 12 percent, caused by increased seasonaldemand and demand growth within the automotive and building and construction markets.
Extruded products
The North American demand for extrusion experienced an increase of 8 percent compared to the first quarter of last year.Demand increased 12 percent compared to the fourth quarter of last year, supported by positive seasonality. North America iscurrently driven by stronger automotive demand and higher activity in the building and construction market. The commercialtrailer market is is also improving.
The current positive market conditions are expected to continue into the second quarter of 2018.
FIRST QUARTER REPORT 20187
Energy
Nordic spot prices were significantly higher compared to the same period last year and the previous quarter. High consumptiondue to cold weather, increasing export volumes towards continental Europe and lower available production capacity in theNordic market gave support to prices. Higher coal and carbon prices also had an impact.
At the end of the first quarter in 2018, the Nordic hydrological balance was around 3 TWh below normal1), which is the samelevel as the end of the first quarter last year. Compared to the previous quarter the hydrological balance decreased from 14TWh above normal to 3 TWh below normal. Water reservoirs in Norway were 29.6 percent of full capacity at the end of thequarter, which is 9.5 percentage points below the normal level. Snow reservoirs were above normal levels at the end of thequarter.
1) Normal based on long term historical averages.
Following a period of extreme rainfall in February authorities ordered several measures against Alunorte, including that theAlunorte alumina refinery is required to operate at 50 percent of its capacity while authorities review the situation, overconcerns that flooding led to harmful spills. Findings of an internal and an external task force confirm that there was nooverflow from the bauxite residue deposit areas as well as no indication or evidence of contamination to nearby localcommunities from Alunorte as a result of the heavy rainfall.
Additional factors impacting Hydro
Hydro has decided to initiate a NOK 500 million investment to the water treatment system at Alunorte. This aims atincreasing the water treatment capacity by 50 percent and improving the robustness of the plant to withstand future extremeweather conditions. In addition, to support broad collaboration for social change in Barcarena, Hydro will commit aroundNOK 250 million in local community investments through the Sustainable Barcarena Initiative. The initiative will establish anindependent organization that will provide a public platform for data monitoring and evaluation, and develop social andenvironmental projects.
On April 10, 2018 Albras’ Board of Directors has decided to curtail 50 percent of aluminium production at the Albrasaluminium plant. The curtailment represents 230,000 mt on an annualized basis and is a result of the Alunorte aluminarefinery not being able to supply more than 50 percent of Albras’ alumina needs following Alunorte’s forced production cut.Hydro has issued a force majeure notice towards Albras' customers due to the production cuts.
On February 26, 2018, Hydro made a binding offer to acquire Rio Tinto's Icelandic aluminium plant Rio Tinto Iceland Ltd(ISAL), its 53 percent share in Dutch anode facility Aluminium & Chemie Rotterdam B.V. (Aluchemie) in which Hydrocurrently holds 47 percent, and 50 percent of the shares in Swedish aluminium fluoride plant Alufluor AB. ISAL produces210,000 mt liquid metal and a total of 230,000 mt extrusion ingot for the European building, construction and transportationsegments from its newly built casthouse with full ultrasonic testing capabilities. Completion of the transaction is subject toapproval from relevant competition authorities, and is expected in the second or third quarter of 2018.
Primary Metal has sold forward around 50 percent of its expected primary aluminium production for the second quarter of2018 at a price level of around USD 2,125 per mt.1)
On March 8, 2018 the US administration imposed tariffs of 10 percent on aluminium imports to the US. Exemptions forcertain countries are currently under discussion. The final framework is yet to be decided, and long-term effects are uncertain.In the short-term, Hydro does not expect any significant impact on its operations.
On April 2, 2018 Norsk Hydro’s acquisition of Arconic’s two extrusion plants in Brazil was completed. The acquisition willstrengthen Hydro’s downstream position in Brazil and create a solid platform for further growth. The two extrusion plants inUtinga and Tubarão in southern Brazil have combined more than 600 employees, one cast house, seven presses ranging from 7to 14 inches and value-added capabilities.
FIRST QUARTER REPORT 2018 8

On April 6, 2018 the US Department of Treasury’s Office of Foreign Assets Control issued a sanctions list that includedRussian individuals and companies including the Russian aluminium company Rusal. Hydro has multiple business relationswith Rusal throughout the value chain and is currently evaluating potential effects and mitigating actions.
Sapa Profiles Inc. (SPI), a Portland, Oregon based subsidiary of Hydro Extruded Solutions AS (formerly Sapa AS) is underinvestigation by the United States Department of Justice (DOJ) Civil and Criminal Divisions regarding certain aluminumextrusions that SPI manufactured from 1996 to 2015, including extrusions that were delivered to a supplier to NASA. SPI iscooperating fully in these investigations. The investigations are currently ongoing, and, at this point, the outcome of theinvestigations and of any identified quality issues, including financial consequences, is uncertain. SPI also has been temporarilysuspended as a federal government contractor. Based on the information currently known to Hydro, Hydro does not expectany resulting liabilities to have a material adverse effect on its consolidated results of operations, liquidity or financial position.As part of the share purchase agreement the parties have agreed that Orkla ASA shall indemnify Hydro for 50 percent of anyliability in relation to this case.
1) Prices are fixed mainly one month prior to production. As a result, and due to the hedging of product inventories, Hydro's realized aluminium prices lag LME spot prices by around 1 to 2months.
FIRST QUARTER REPORT 20189

Underlying EBIT
Alternative performance measures (APMs) are described in the corresponding section in the back of the report.
Operational and financial information
First
quarter
2018
First
quarter
2017
Change
prior year
quarter
Fourth
quarter
2017
Change
prior
quarter
Year
2017
Earnings before financial items and tax (EBIT) (NOK million) 741 756 (2) % 1 872 (60) % 3 704
Underlying EBIT (NOK million) 741 756 (2) % 1 872 (60) % 3 704
Underlying EBITDA (NOK million) 1 370 1 334 3 % 2 551 (46) % 6 190
Alumina production (kmt) 1 277 1 523 (16) % 1 693 (25) % 6 397
Sourced alumina (kmt) 1 121 600 87 % 610 84 % 2 522
Total alumina sales (kmt) 2 071 2 129 (3) % 2 344 (12) % 8 920
Realized alumina price (USD/mt) 1)
371 309 20 % 398 (7) % 326
Bauxite production (kmt) 2)
2 326 2 400 (3) % 3 049 (24) % 11 435
Sourced bauxite (kmt) 3)
1 317 1 675 (21) % 2 103 (37) % 7 601
Bauxite & Alumina
1) Weighted average of own production and third party contracts. The majority of the alumina is sold linked to either the LME prices or alumina index with a one month delay.
2) Paragominas production, on wet basis.
3) 40 percent MRN off take from Vale and 5 percent Hydro share on wet basis.
The 50 percent production restriction at Alunorte and subsequent reduction of production at Paragominas during March hada negative impact on the results for the first quarter. The impact is estimated at around NOK 450 million, largely driven bylost margins on reduced Alunorte and Paragominas volumes.
Underlying EBIT for Bauxite & Alumina was similar to the first quarter of last year. The results were driven by higher realizedalumina sales prices offset by higher raw material prices and reduced output at both plants.
Due to the situation at Alunorte, Bauxite and Alumina's "Better" improvement program will not reach the 2018 target.
Compared to the fourth quarter of 2017 the underlying EBIT decreased driven by lower realized alumina prices, higher rawmaterial prices and lower alumina sales volumes due to the factors discussed above.
FIRST QUARTER REPORT 2018 10
Primary Metal
Operational and financial information 1)
First
quarter
2018
First
quarter
2017
Change
prior year
quarter
Fourth
quarter
2017
Change
prior
quarter
Year
2017
Earnings before financial items and tax (EBIT) (NOK million) 917 797 15 % 1 112 (18) % 4 729
Underlying EBIT (NOK million) 823 900 (9) % 1 377 (40) % 5 061
Underlying EBITDA (NOK million) 1 349 1 392 (3) % 1 900 (29) % 7 078
Realized aluminium price LME (USD/mt) 2)
2 140 1 757 22 % 2 092 2 % 1 915
Realized aluminium price LME (NOK/mt) 2)
16 929 14 798 14 % 17 066 (1) % 15 888
Realized premium above LME (USD/mt) 3)
295 266 11 % 259 14 % 265
Realized premium above LME (NOK/mt) 3)
2 335 2 236 4 % 2 116 10 % 2 197
Realized USD/NOK exchange rate 7.91 8.42 (6) % 8.16 (3) % 8.30
Primary aluminium production (kmt) 514 516 - 528 (3) % 2 094
Casthouse production (kmt) 531 521 2 % 550 (3) % 2 169
Total sales (kmt) 578 577 - 554 4 % 2 278
1) Operating and financial information includes Hydro's proportionate share of underlying income (loss) of equity accounted investments.
2) Realized aluminium prices lag the LME price developments by approximately 1.5 - 2 months.
3) Average realized premium above LME for casthouse sales from Primary Metal.
Operational and financial information Qatalum (50%)
First
quarter
2018
First
quarter
2017
Change
prior year
quarter
Fourth
quarter
2017
Change
prior
quarter
Year
2017
Revenue (NOK million) 1 356 1 355 - 1 613 (16) % 5 821
Underlying EBIT (NOK million) 266 157 69 % 318 (16) % 985
Underlying EBITDA (NOK million) 532 457 16 % 599 (11) % 2 157
Net income (loss) (NOK million) 210 98 >100 % 259 (19) % 747
Underlying Net income (loss) (NOK million) 210 98 >100 % 259 (19) % 747
Primary aluminium production (kmt) 77 76 1 % 78 (1) % 310
Casthouse sales (kmt) 73 80 (9) % 86 (15) % 325
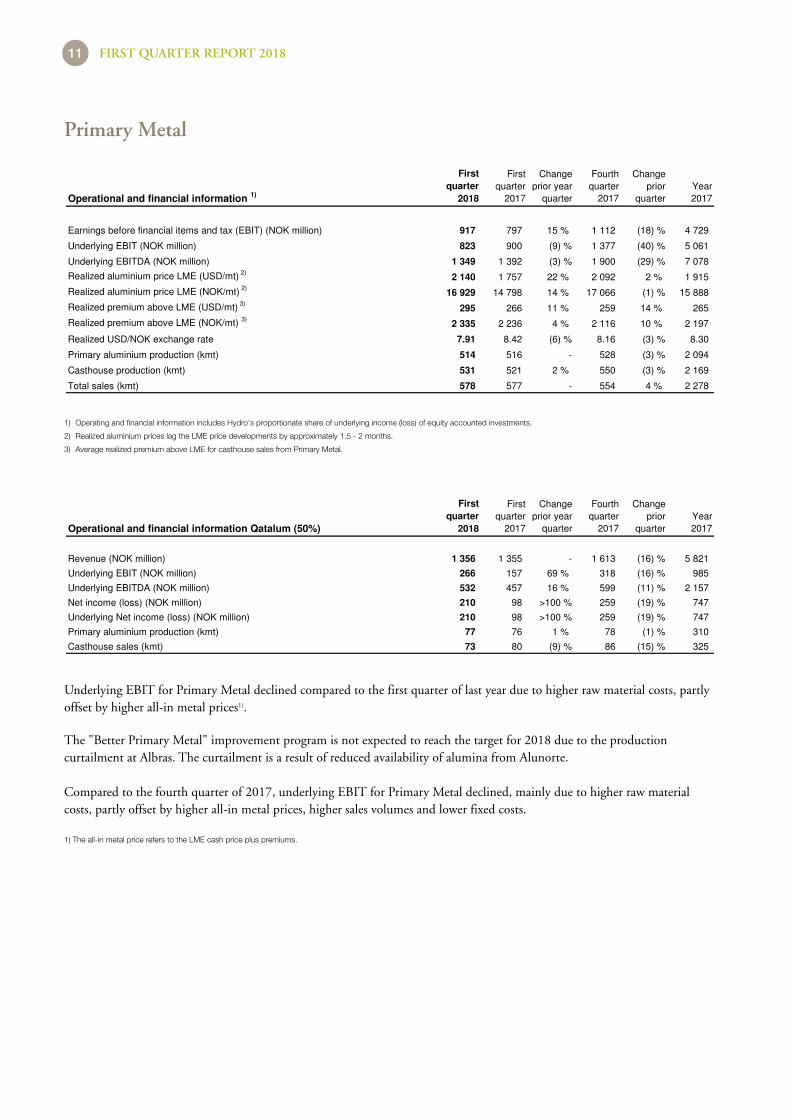
Underlying EBIT for Primary Metal declined compared to the first quarter of last year due to higher raw material costs, partlyoffset by higher all-in metal prices1).
The "Better Primary Metal" improvement program is not expected to reach the target for 2018 due to the productioncurtailment at Albras. The curtailment is a result of reduced availability of alumina from Alunorte.
Compared to the fourth quarter of 2017, underlying EBIT for Primary Metal declined, mainly due to higher raw materialcosts, partly offset by higher all-in metal prices, higher sales volumes and lower fixed costs.
1) The all-in metal price refers to the LME cash price plus premiums.
FIRST QUARTER REPORT 201811

Metal Markets
Operational and financial information
First
quarter
2018
First
quarter
2017
Change
prior year
quarter
Fourth
quarter
2017
Change
prior
quarter
Year
2017
Earnings before financial items and tax (EBIT) (NOK million) 305 (13) >100 % 158 94 % 485
Underlying EBIT (NOK million) 178 24 >100 % 185 (4) % 544
Currency effects (11) (21) 47 % 47 >(100) % 83
Inventory valuation effects 50 (38) >100 % (19) >100 % (38)
Underlying EBIT excl. currency and inventory valuation effects 139 83 67 % 157 (11) % 499
Underlying EBITDA (NOK million) 201 47 >100 % 209 (4) % 638
Remelt production (kmt) 150 143 4 % 137 9 % 568
Metal products sales excluding ingot trading (kmt) 1)
745 735 1 % 720 4 % 2 921
Hereof external sales (kmt) 580 672 (14) % 589 (1) % 2 575
1) Includes external and internal sales from primary casthouse operations, remelters and third party metal sources.
Underlying EBIT for Metal Markets increased compared to the first quarter of last year. The increase was due to higher salesvolumes and margins from the remelters, higher results from sourcing and trading activities, as well as positive inventoryvaluation effects.
Compared to the fourth quarter of 2017 underlying EBIT for Metal Markets declined, mainly due to lower results fromsourcing and trading activities and negative currency effects, partly offset by positive inventory valuation effects and highersales volumes and margins from the remelters.
Operational and financial information
First
quarter
2018
First
quarter
2017
Change
prior year
quarter
Fourth
quarter
2017
Change
prior
quarter
Year
2017
Earnings before financial items and tax (EBIT) (NOK million) 78 450 (83) % - - 512
Underlying EBIT (NOK million) 232 106 >100 % 95 >100 % 380
Underlying EBITDA (NOK million) 456 307 48 % 325 40 % 1 240
Sales volumes to external market (kmt) 245 241 2 % 224 9 % 940
Sales volumes to external markets (kmt) - Product areas
Can & foil 90 85 6 % 87 4 % 352
Lithography & automotive 78 78 - 68 14 % 297
Special products 77 78 (2) % 69 12 % 291
Rolled Products 245 241 2 % 224 9 % 940
Rolled Products
Underlying EBIT increased compared to the first quarter of 2017. Increasing margins and improved production performancewere partly offset by negative currency effects. Results from the Neuss smelter increased mainly due to positive effects fromnew power contracts, including an internal contract with Energy.
Rolled Products is on track with its "Better Rolled Products" improvement program for 2018.
Compared to the fourth quarter of 2017 the underlying EBIT improved significantly. Seasonally higher sales volumes andlower maintenance cost more than offset the negative currency development. Results from the Neuss smelter increased mainlydue to a positive effect from new power contracts.
FIRST QUARTER REPORT 2018 12
Extruded Solutions
Operational and financial information
First
quarter
2018
First
quarter
2017
Change
prior year
quarter
Fourth
quarter
2017
Change
prior
quarter Year 2017
Earnings before financial items and tax (EBIT) (NOK million) 687 1 722 (60) % 1 722
Underlying EBIT (NOK million) 734 284 >100 % 284
Underlying EBITDA (NOK million) 1 155 728 59 % 728
Sales volumes to external markets (kmt) 362 318 14 % 318
Sales volumes to external markets (kmt) - Business units
Extrusion Europe 154 130 18 % 130
Extrusion North America 152 134 13 % 134
Building Systems 20 19 4 % 19
Precision tubing 37 34 8 % 34
Extruded Solutions 362 318 14 % 318
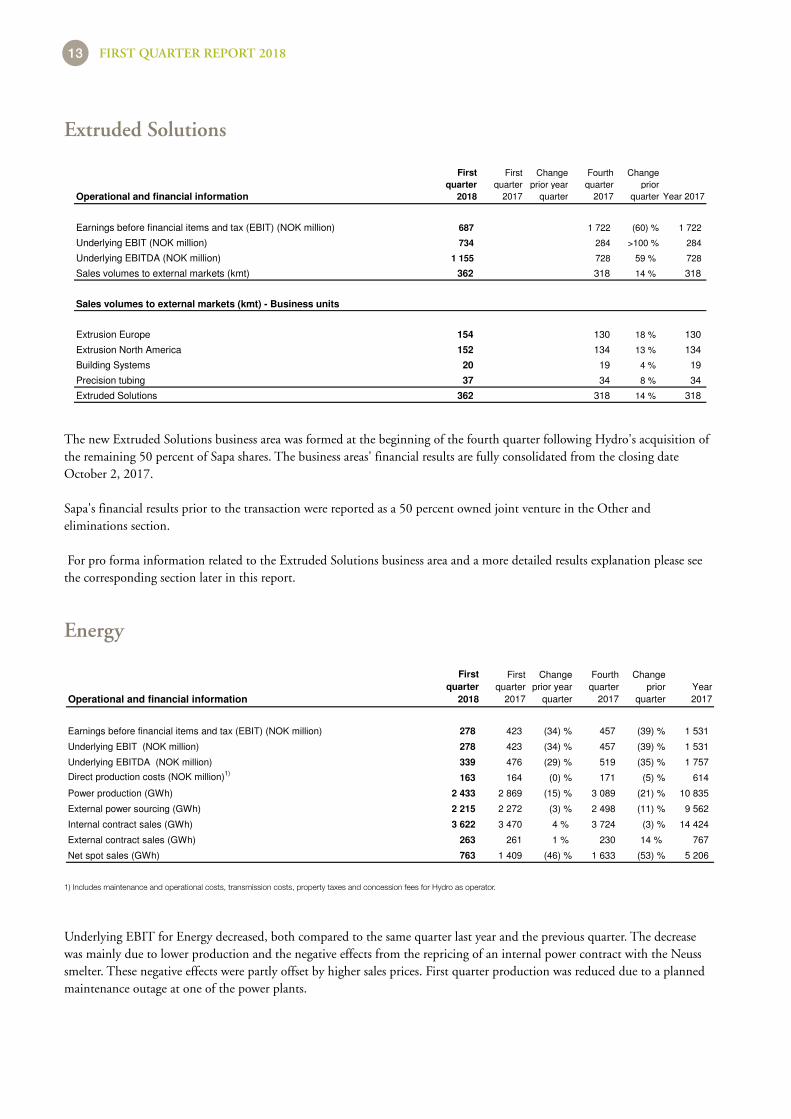
The new Extruded Solutions business area was formed at the beginning of the fourth quarter following Hydro's acquisition ofthe remaining 50 percent of Sapa shares. The business areas' financial results are fully consolidated from the closing dateOctober 2, 2017.
Sapa's financial results prior to the transaction were reported as a 50 percent owned joint venture in the Other andeliminations section.
For pro forma information related to the Extruded Solutions business area and a more detailed results explanation please seethe corresponding section later in this report.
Operational and financial information
First
quarter
2018
First
quarter
2017
Change
prior year
quarter
Fourth
quarter
2017
Change
prior
quarter
Year
2017
Earnings before financial items and tax (EBIT) (NOK million) 278 423 (34) % 457 (39) % 1 531
Underlying EBIT (NOK million) 278 423 (34) % 457 (39) % 1 531
Underlying EBITDA (NOK million) 339 476 (29) % 519 (35) % 1 757
Direct production costs (NOK million)1)
163 164 (0) % 171 (5) % 614
Power production (GWh) 2 433 2 869 (15) % 3 089 (21) % 10 835
External power sourcing (GWh) 2 215 2 272 (3) % 2 498 (11) % 9 562
Internal contract sales (GWh) 3 622 3 470 4 % 3 724 (3) % 14 424
External contract sales (GWh) 263 261 1 % 230 14 % 767
Net spot sales (GWh) 763 1 409 (46) % 1 633 (53) % 5 206
Energy
1) Includes maintenance and operational costs, transmission costs, property taxes and concession fees for Hydro as operator.
Underlying EBIT for Energy decreased, both compared to the same quarter last year and the previous quarter. The decreasewas mainly due to lower production and the negative effects from the repricing of an internal power contract with the Neusssmelter. These negative effects were partly offset by higher sales prices. First quarter production was reduced due to a plannedmaintenance outage at one of the power plants.
FIRST QUARTER REPORT 201813

Other and eliminations
Financial information
NOK million
First
quarter
2018
First
quarter
2017
Change
prior year
quarter
Fourth
quarter
2017
Change
prior
quarter
Year
2017
Earnings before financial items and tax (EBIT) 295 (3) >100 % (810) >100 % (495)
Sapa (50%) 1)
281 819
Other (207) (140) (48) % (279) 26 % (586)
Eliminations 368 (67) >100 % (436) >100 % (522)
Underlying EBIT 161 74 >100 % (715) >100 % (289)
1) Hydro's share of Sapa's underlying net income.
Other is mainly comprised of head office costs, and costs related to holding companies as well as earnings from Hydro'sindustrial insurance company. Other also includes transaction and integration costs related to the Sapa transaction.
Eliminations are comprised mainly of unrealized gains and losses on inventories purchased from group companies whichfluctuate with product flows, volumes and margin developments throughout Hydro's value chain.
Following the acquisition of the remaining 50 percent interest in Sapa AS completed on October 2, 2017, Sapa AS has beenrenamed Hydro Extruded Solutions AS and the fully consolidated financial results are presented in the Extruded Solutionsbusiness area.
Financial income (expense)
NOK million
First
quarter
2018
First
quarter
2017
Change
prior year
quarter
Fourth
quarter
2017
Change
prior
quarter
Year
2017
Interest income 60 93 (36) % 67 (11) % 322
Dividends received and net gain (loss) on securities (2) 11 >(100) % 75 >(100) % 159
Financial income 58 104 (44) % 142 (59) % 481
Interest expense (123) (105) (17) % (115) (7) % (378)
Capitalized interest - 21 - 8 - 76
Net foreign exchange gain (loss) (333) 218 >(100) % (696) 52 % (875)
Net interest on pension liability (33) (33) - (51) 36 % (152)
Other (44) (69) 37 % (65) 33 % (266)
Financial expense (533) 33 >(100) % (919) 42 % (1 596)
Financial income (expense), net (475) 136 >(100) % (776) 39 % (1 114)
Finance
The net foreign exchange loss, mainly unrealized, of NOK 333 million reflects primarily a weakening of USD rates againstNOK. This resulted in an unrealized loss on the intercompany financial assets denominated in USD.
Income tax expense amounted to NOK 749 million for the first quarter of 2018 or about 27 percent of income before tax.
Tax
FIRST QUARTER REPORT 2018 14

Pro forma information
The following section is comprised of selected financial and operating information and a discussion of underlyingdevelopments including 100 percent of the acquired Sapa business for the full year 2017 and the first quarter 2018 on acomparable basis with the earlier periods presented.
Key financial information
NOK million
First
quarter
2018
First
quarter
2017
Change
prior
quarter
Fourth
quarter
2017
Change
prior year
quarter
Year
2017
Revenue 39 971 36 129 11 % 38 803 3 % 148 920
Earnings before financial items and tax (EBIT) 3 301 2 868 15 % 3 048 8 % 11 927
Items excluded from underlying EBIT (155) (182) 15 % 508 >(100) % 510
Underlying EBIT1)
3 147 2 686 17 % 3 555 (11) % 12 437
Earnings before financial items, tax, depreciation and
amortization (EBITDA) 5 193 4 620 12 % 5 016 4 % 19 294
Underlying EBITDA 5 038 4 438 14 % 5 524 (9) % 19 786
Summary consolidated underlying financial and operating results
1) Underlying EBIT includes certain effects of the acquisition such as increased depreciation and amortization following fair value adjustment related to long-lived assets.
Operational and financial information
First
quarter
2018
First
quarter
2017
Change
prior
quarter
Fourth
quarter
2017
Change
prior year
quarter
Year
2017
Revenue (NOK million) 15 911 14 323 11 % 14 153 12 % 57 769
Earnings before financial items and tax (EBIT) (NOK million) 687 778 (12) % 258 >100 % 2 265
Unrealized derivative effects (NOK million) 47 (78) >100 % (4) >100 % 36
Significant rationalization charges and closure costs (NOK million) - - - 29 (100) % 29
Items excluded from underlying EBIT (NOK million) 47 (78) >100 % 25 86 % 65
Underlying EBIT (NOK million)1)
734 700 5 % 284 >100 % 2 330
Earnings before financial items, tax, depreciation and
amortization (EBITDA) 1 108 1 178 (6) % 703 58 % 3 917
Underlying EBITDA (NOK million) 1 155 1 100 5 % 728 59 % 3 982
Sales volumes to external markets (kmt) 362 355 2 % 318 14 % 1 372
Sales volumes to external markets (kmt) - Business units
Extrusion Europe 154 149 3 % 130 18 % 568
Extrusion North America 152 150 1 % 134 13 % 584
Building Systems 20 20 - 19 4 % 78
Precision tubing 37 36 3 % 34 8 % 143
Extruded Solutions 362 355 2 % 318 14 % 1 372
Extruded Solutions
1) Underlying EBIT includes certain effects of the acquisition such as increased depreciation and amortization following fair value adjustment related to long-lived assets.
FIRST QUARTER REPORT 201815

Underlying EBIT for Extruded Solutions increased compared to the pro forma underlying EBIT in the first quarter 2017,driven by improved sales volumes and margins.
Compared to the the fourth quarter 2017 the underlying EBIT increased, primarily due to seasonally higher volumes.
FIRST QUARTER REPORT 2018 16

Interim financial statements
Condensed consolidated statements of income (unaudited)
First quarter Year
NOK million, except per share data 2018 2017 2017
Revenue 39 971 23 026 109 220
Share of the profit (loss) in equity accounted investments 221 409 1 527
Other income, net 155 164 2 947
Total revenue and income 40 346 23 599 113 693
Raw material and energy expense 25 196 14 822 69 848
Employee benefit expense 5 772 2 613 13 285
Depreciation, amortization and impairment 1 909 1 352 6 162
Other expenses 4 168 2 402 12 209
Total expenses 37 045 21 190 101 504
Earnings before financial items and tax (EBIT) 3 301 2 410 12 189
Financial income 58 104 481
Financial expense (533) 33 (1 596)
Financial income (expense), net (475) 136 (1 114)
Income (loss) before tax 2 826 2 546 11 075
Income taxes (749) (707) (1 891)
Net income (loss) 2 076 1 838 9 184
Net income (loss) attributable to non-controlling interests (14) 76 401
Net income (loss) attributable to Hydro shareholders 2 091 1 762 8 783
Basic and diluted earnings per share attributable to Hydro shareholders (in NOK) 1)
1.02 0.86 4.30
Weighted average number of outstanding shares (million) 2 045 2 043 2 044
1) Basic earnings per share are computed using the weighted average number of ordinary shares outstanding. There were no significant diluting elements.
The accompanying notes are an integral part of the condensed consolidated financial statements (unaudited).
FIRST QUARTER REPORT 201817

Condensed consolidated statements of comprehensive income (unaudited)
Year
2018 2017 2017
NOK million Restated Restated
Net income (loss) 2 076 1 838 9 184
Other comprehensive income
Items that will not be reclassified to income statement:
Remeasurement postemployment benefits, net of tax 68 465 761
Unrealized gain (loss) on securities, net of tax (37) (20) (255)
Share of remeasurement postemployement benefits of equity accounted investments, net of tax - - (2)
Total 31 445 504
Items that will be reclassified to income statement:
Currency translation differences, net of tax (3 147) 808 (1 387)
Cash flow hedges, net of tax (86) 32 174
Share of items that will be reclassified to income statement of equity accounted investments, net of tax 39 107 (736)
Total (3 193) 946 (1 949)
Other comprehensive income (3 162) 1 391 (1 444)
Total comprehensive income (1 085) 3 230 7 740
Total comprehensive income attributable to non-controlling interests (287) 184 103
Total comprehensive income attributable to Hydro shareholders (798) 3 046 7 637
First quarter
The accompanying notes are an integral part of the condensed consolidated financial statements (unaudited).
FIRST QUARTER REPORT 2018 18

Condensed balance sheets (unaudited)
December 31
2018 2017 2017
NOK million, except number of shares Restated
Assets
Cash and cash equivalents 9 371 8 333 11 828
Short-term investments 1 031 4 403 1 311
Accounts receivables 22 785 12 851 19 983
Inventories 20 626 12 557 20 711
Other current assets 818 301 798
Total current assets 54 631 38 445 54 631
Property, plant and equipment 69 945 59 627 72 933
Intangible assets 12 133 5 919 12 712
Investments accounted for using the equity method 10 551 19 937 11 221
Prepaid pension 5 933 4 718 5 750
Other non-current assets 5 588 5 630 6 028
Total non-current assets 104 150 95 831 108 643
Total assets 158 781 134 276 163 273
Liabilities and equity
Bank loans and other interest-bearing short-term debt 5 269 3 481 8 245
Trade and other payables 20 621 10 224 19 571
Other current liabilities 4 852 3 337 5 521
Total current liabilities 30 742 17 041 33 337
Long-term debt 8 746 3 373 9 012
Provisions 5 652 4 526 5 828
Pension liabilities 14 911 12 804 15 118
Deferred tax liabilities 3 522 2 567 3 501
Other non-current liabilities 4 084 3 174 4 269
Total non-current liabilities 36 916 26 444 37 728
Total liabilities 67 658 43 486 71 064
Equity attributable to Hydro shareholders 86 233 84 952 87 032
Non-controlling interests 4 891 5 838 5 178
Total equity 91 124 90 790 92 209
Total liabilities and equity 158 781 134 276 163 273
Total number of outstanding shares (million) 2 045 2 043 2 045
March 31
The accompanying notes are an integral part of the condensed consolidated financial statements (unaudited).
FIRST QUARTER REPORT 201819

Condensed consolidated statements of cash flows (unaudited)
Year
NOK million 2018 2017 2017
Operating activities
Net income 2 076 1 838 9 184
Depreciation, amortization and impairment 1 909 1 352 6 162
Other adjustments (1 996) (2 522) (999)
Net cash provided by operating activities 1 989 668 14 347
Investing activities
Purchases of property, plant and equipment (1 369) (1 396) (7 296)
Purchases of other long-term investments (130) (32) (11 190)
Purchases of short-term investments - (1 250) (5 094)
Proceeds from long-term investing activities 28 272 742
Proceeds from sales of short-term investments - 1 750 8 402
Net cash used in investing activities (1 471) (656) (14 436)
Financing activities
Loan proceeds 1 594 2 180 15 271
Principal repayments (1 365) (1 821) (10 917)
Net increase (decrease) in other short-term debt (2 931) (153) 2 515
Proceeds from shares issued 10 5 40
Dividends paid - - (3 069)
Net cash provided by (used in) financing activities (2 692) 211 3 840
Foreign currency effects on cash (283) 73 40
Net increase (decrease) in cash and cash equivalents (2 457) 296 3 791
Cash and cash equivalents at beginning of period 11 828 8 037 8 037
Cash and cash equivalents at end of period 9 371 8 333 11 828
First quarter
The accompanying notes are an integral part of the condensed consolidated financial statements (unaudited).
FIRST QUARTER REPORT 2018 20

Condensed consolidated statements of changes in equity (unaudited)
Equity
Additional Other attributable Non-
Share paid-in Treasury Retained components to Hydro controlling Total
NOK million capital capital shares earnings of equity shareholders interests equity
January 1, 2017 2 272 29 070 (870) 50 210 1 224 81 906 5 733 87 640
Changes in equity for 2017
Dividends - - (79) (79)
Total comprehensive income for the period 1 762 1 283 3 046 184 3 230
March 31, 2017 2 272 29 070 (870) 51 973 2 508 84 952 5 838 90 790
December 31, 2017 2 272 29 097 (810) 56 435 80 87 074 5 178 92 252
Effect of change in accounting principle 17 (60) (43) - (43)
January 1, 2018 2 272 29 097 (810) 56 452 20 87 032 5 178 92 209
Changes in equity for 2018
Total comprehensive income for the period 2 091 (2 889) (798) (287) (1 085)
March 31, 2018 2 272 29 097 (810) 58 543 (2 869) 86 233 4 891 91 124
The accompanying notes are an integral part of the condensed consolidated financial statements (unaudited).
FIRST QUARTER REPORT 201821

Notes to the condensed consolidated financial statements
Note 1: Accounting policies
All reported figures in the financial statements are based on International Financial Reporting Standards (IFRS). Hydro'saccounting principles are presented in note 2 Significant accounting policies and note 3 Changes in accounting principles andnew pronouncements in Hydro's Financial Statements - 2017.
Hydro implemented IFRS 15 as of January 1, 2018. The new standard is implemented retrospectively with the cumulativeeffect of initially applying this standard recognized directly to equity at implementation.
IFRS 15 Revenue from Contracts with Customers
IFRS 15 requires us to, for each contract with a customer, to identify the performance obligations, determine the transactionprice, allocate the transaction price to performance obligations to the extent the contract covers more than one performanceobligation, determine whether revenue should be recognized over time or at a point in time, and, finally, recognize revenuewhen or as performance obligations are recognized. The potential changes for Hydro are related to which contracts that qualifyfor recognition over time, versus recognition at a point in time; at delivery to customer.
Hydro's performance obligations can be described as follows:
• sale of products, produced independent of customer orders
• sale of products, produced to customer order
• sale of products made to customer specifications and order
• sale of electricity
For products which are not made to the customer's specification, performance obligations are either the individual product,the delivery in total, or an agreed volume of products delivered in more than one delivery. Contracts covering a fixed,committed volume at fixed or determinable prices are relevant for this assessment. Delivery period for such contracts can covera period of a few weeks, and up to one year. Some contracts cover more than one year, however, these are a declining number.Prices are usually a combination of fixed elements and market references such as the aluminium price at the London MetalExchange, at, or prior to, delivery. Revenue related to such contracts continues to be recognized at delivery of products tocustomers. Such contracts accounts for the majority of sales in the segments Bauxite & Alumina, Primary Metal, MetalMarkets and Rolled Products, and a significant share of sales in Extruded Solutions. Some of these contracts includes anelement of freight services, which is considered a separate performance obligation under IFRS 15, and related revenue isrecognized over the time of journey.
For products made to customer specifications and orders, we have assessed whether the finished product has an alternative useto Hydro, and whether Hydro has an enforceable right to payment. For contracts where both of these conditions are fulfilled,revenue shall be recognized over the time from start of production of the specialized product until completion of delivery tothe customer. For Hydro's products, the alternative use of customer designed products would, in most cases, be as basis forproducing other products rather than for sale of the product unchanged. Further, we are in the process of finalizing theassessment of whether Hydro has an enforceable right to payment for performance completed to date, including a reasonablemargin, throughout the production period. The assessment is primarily related to the segment Extruded Solutions, which wasacquired by Hydro in October 2017. The main assessment is related to which compensation Hydro would be entitled to in asituation where firm orders are canceled or amended by the customer. Our preliminary conclusion is that most contracts donot secure enforceable right to payment, however, as our conclusions depends both on legal assessment of a large number ofcontracts in many countries, and on the understanding of what constitutes an enforceable right to payment under IFRS 15, wemight reach a different conclusion in the future for some of the contracts. The period from contract inception (firm order) todelivery of products to customer in Extruded Solutions is usually not exceeding about six weeks, often considerably shorter.For one unit in Metal Markets selling casthouse equipment, the period from order to final delivery varies from a few months tomore than one year.
FIRST QUARTER REPORT 2018 22
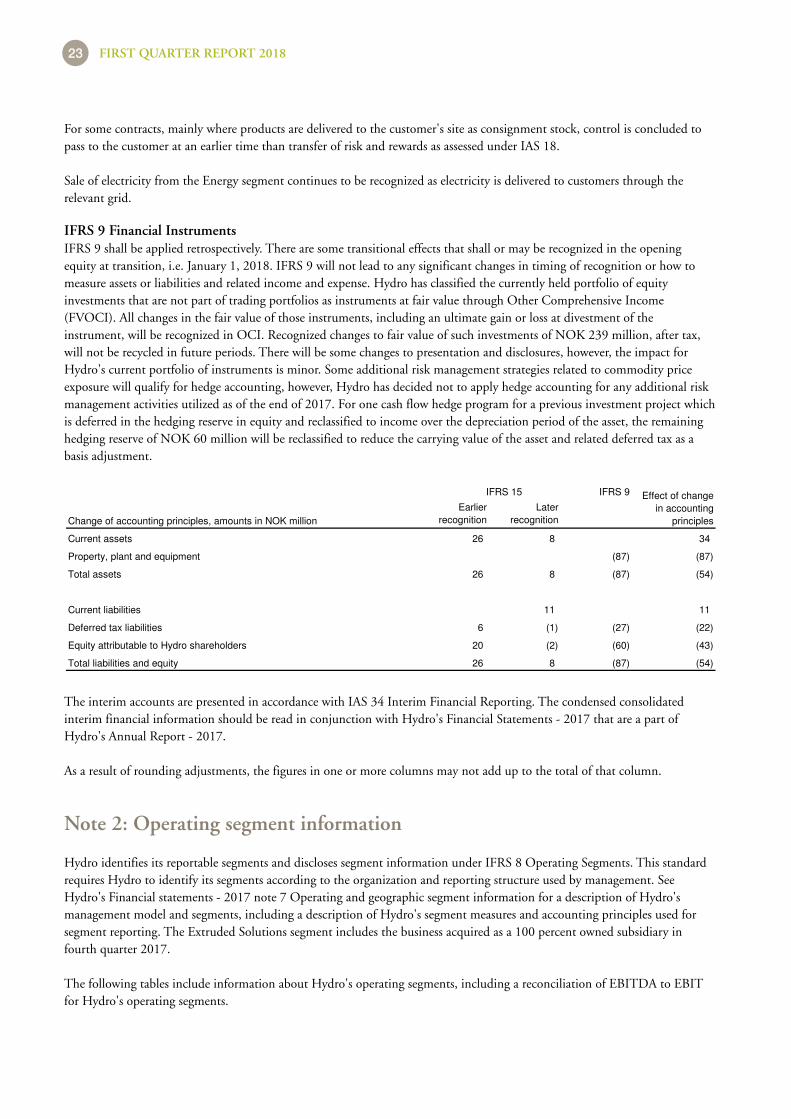
For some contracts, mainly where products are delivered to the customer's site as consignment stock, control is concluded topass to the customer at an earlier time than transfer of risk and rewards as assessed under IAS 18.
Sale of electricity from the Energy segment continues to be recognized as electricity is delivered to customers through therelevant grid.
IFRS 9 shall be applied retrospectively. There are some transitional effects that shall or may be recognized in the openingequity at transition, i.e. January 1, 2018. IFRS 9 will not lead to any significant changes in timing of recognition or how tomeasure assets or liabilities and related income and expense. Hydro has classified the currently held portfolio of equityinvestments that are not part of trading portfolios as instruments at fair value through Other Comprehensive Income(FVOCI). All changes in the fair value of those instruments, including an ultimate gain or loss at divestment of theinstrument, will be recognized in OCI. Recognized changes to fair value of such investments of NOK 239 million, after tax,will not be recycled in future periods. There will be some changes to presentation and disclosures, however, the impact forHydro's current portfolio of instruments is minor. Some additional risk management strategies related to commodity priceexposure will qualify for hedge accounting, however, Hydro has decided not to apply hedge accounting for any additional riskmanagement activities utilized as of the end of 2017. For one cash flow hedge program for a previous investment project whichis deferred in the hedging reserve in equity and reclassified to income over the depreciation period of the asset, the remaininghedging reserve of NOK 60 million will be reclassified to reduce the carrying value of the asset and related deferred tax as abasis adjustment.
IFRS 9 Financial Instruments
IFRS 9
Change of accounting principles, amounts in NOK million
Earlier
recognition
Later
recognition
Current assets 26 8 34
Property, plant and equipment (87) (87)
Total assets 26 8 (87) (54)
Current liabilities 11 11
Deferred tax liabilities 6 (1) (27) (22)
Equity attributable to Hydro shareholders 20 (2) (60) (43)
Total liabilities and equity 26 8 (87) (54)
IFRS 15 Effect of change
in accounting
principles
The interim accounts are presented in accordance with IAS 34 Interim Financial Reporting. The condensed consolidatedinterim financial information should be read in conjunction with Hydro's Financial Statements - 2017 that are a part ofHydro's Annual Report - 2017.
As a result of rounding adjustments, the figures in one or more columns may not add up to the total of that column.
Hydro identifies its reportable segments and discloses segment information under IFRS 8 Operating Segments. This standardrequires Hydro to identify its segments according to the organization and reporting structure used by management. SeeHydro's Financial statements - 2017 note 7 Operating and geographic segment information for a description of Hydro'smanagement model and segments, including a description of Hydro's segment measures and accounting principles used forsegment reporting. The Extruded Solutions segment includes the business acquired as a 100 percent owned subsidiary infourth quarter 2017.
Note 2: Operating segment information
The following tables include information about Hydro's operating segments, including a reconciliation of EBITDA to EBITfor Hydro's operating segments.
FIRST QUARTER REPORT 201823

First quarter Year
NOK million 2018 2017 2017
Total revenue
Bauxite & Alumina 6 309 5 911 25 421
Primary Metal 10 170 8 641 36 466
Metal Markets 13 898 12 149 50 606
Rolled Products 6 797 6 277 25 715
Extruded Solutions1)
15 911 - 14 153
Energy 1 762 1 955 7 705
Other and eliminations (14 877) (11 906) (50 847)
Total 39 971 23 026 109 220
External revenue
Bauxite & Alumina 3 509 3 382 15 188
Primary Metal 2 018 1 700 7 578
Metal Markets 10 901 11 094 44 264
Rolled Products 6 870 6 153 25 538
Extruded Solutions1)
15 932 - 14 083
Energy 738 687 2 550
Other and eliminations 4 9 18
Total 39 971 23 026 109 220
Internal revenue
Bauxite & Alumina 2 800 2 528 10 234
Primary Metal 8 152 6 941 28 888
Metal Markets 2 997 1 054 6 341
Rolled Products (72) 124 178
Extruded Solutions1)
(21) - 70
Energy 1 024 1 267 5 155
Other and eliminations (14 881) (11 915) (50 865)
Total - - -
Share of the profit (loss) in equity accounted investments
Bauxite & Alumina - - -
Primary Metal 210 98 745
Metal Markets - - -
Rolled Products - - -
Extruded Solutions1)
17 313 812
Energy (10) - (7)
Other and eliminations 3 (1) (24)
Total 221 409 1 527
FIRST QUARTER REPORT 2018 24

First quarter Year
NOK million 2018 2017 2017
Depreciation, amortization and impairment
Bauxite & Alumina 630 577 2 486
Primary Metal 546 492 2 026
Metal Markets 24 23 95
Rolled Products 223 201 860
Extruded Solutions1)
421 - 444
Energy 58 53 223
Other and eliminations 7 6 28
Total 1 909 1 352 6 162
Earnings before financial items and tax (EBIT)2)
Bauxite & Alumina 741 756 3 704
Primary Metal 917 797 4 729
Metal Markets 305 (13) 485
Rolled Products 78 450 512
Extruded Solutions1) 687 313 2 522
Energy 278 423 1 531
Other and eliminations 295 (316) (1 295)
Total 3 301 2 410 12 189
EBITDA
Bauxite & Alumina 1 370 1 334 6 190
Primary Metal 1 443 1 289 6 747
Metal Markets 329 9 579
Rolled Products 302 651 1 372
Extruded Solutions1)
1 108 313 2 966
Energy 339 476 1 757
Other and eliminations 302 (310) (1 268)
Total 5 193 3 762 18 344
Investments3)
Bauxite & Alumina 240 318 1 634
Primary Metal 530 827 3 537
Metal Markets 11 14 143
Rolled Products 127 120 997
Extruded Solutions1)
280 - 22 137
Energy 97 75 361
Other and eliminations 34 16 39
Total 1 319 1 372 28 848
1) The Extruded Solutions segment includes the business acquired as a 100 percent owned subsidiary in fourth quarter 2017. For the previous periods, the segment includes the samebusiness reported as 50 percent owned joint venture, reported using the equity method.
2) Total segment EBIT is the same as Hydro group's total EBIT. Financial income and expense are not allocated to the segments. There are no reconciling items between segment EBIT toHydro EBIT. Therefore, a separate reconciliation table is not presented.
3) Additions to property, plant and equipment (capital expenditures) plus long-term securities, intangible assets, long-term advances and investments in equity accounted investments,including amounts recognized in business combinations.
FIRST QUARTER REPORT 201825

NOK million EBIT
Depr.,
amor. and
impairment Other items2)
EBITDA
EBIT - EBITDA First quarter 2018
Bauxite & Alumina 741 630 - 1 370
Primary Metal 917 546 (21) 1 443
Metal Markets 305 24 - 329
Rolled Products 78 223 - 302
Extruded Solutions1)
687 421 - 1 108
Energy 278 58 3 339
Other and eliminations 295 7 - 302
Total 3 301 1 909 (17) 5 193
1) The Extruded Solutions segment includes the business acquired as a 100 percent owned subsidiary in fourth quarter 2017. For the previous periods, the segment includes the samebusiness reported as 50 percent owned joint venture, reported using the equity method.
2) Investment grants, and amortization of excess values in equity accounted investments and impairment loss of such investments.
Hydro is involved in or threatened with various legal and tax matters arising in the ordinary course of business. Hydro is of theopinion that it is not probable that the resulting financial liabilities, if any, will have a material adverse effect on itsconsolidated results of operations, liquidity or financial position.
Note 3: Contingent liabilities
Following a period of extreme rainfall in February authorities ordered several measures against Alunorte, including that theAlunorte alumina refinery is required to operate at 50 percent of its capacity while authorities review the situation, overconcerns that flooding led to harmful spills. Findings of an internal and an external task force confirms that there was nooverflow from the bauxite residue deposit areas as well as no indication or evidence of contamination to nearby localcommunities from Alunorte as a result of the heavy rainfall. Authorities have issued, or are preparing to issue, fines related todischarge of partly untreated water. Hydro is assessing the potential financial and other impacts of these and other potentialactions on an ongoing basis. As of the issuance of these interim financial statements, there is a limited financial effect of finesand related costs that is considered probable and thus provided for. Additional claims for fines and various compensation might be raised against Hydro. The State of Pará has issued a claim with an indicated value of about NOK 600 million, forpredominantly moral damages for the population in the area.
In response to the needs in the area, Hydro has decided to increase the social measures for communities close to the plant.Hydro continues to support the communities with immediate needs for water supply and health services, and has committedto contribute to long-term improvements. The associated costs to such measures are considered future operating expenses andthus not provided for.
On July 10, 2017, Hydro entered into a contract to acquire 50 percent of the shares in Sapa AS, which was a joint ventureowned 50 percent by Hydro and 50 percent by Orkla, a listed company in Norway. Following completion of the transactionon October 2, 2017, Hydro owns 100 percent of the parent company Hydro Extruded Solutions AS.
Note 4: Acquisition of Sapa
Hydro has started the process of identifying the fair value of assets acquired and liabilities assumed. This process depends onaccess to detailed information of Sapa’s businesses, and many of these procedures could thus not start before Hydro obtainedcontrol with Sapa at completion of the transaction. The estimated fair value of net assets of Sapa, which is not yet completed,is unchanged from the amounts recognized at the end of 2017. The valuation of property, plant and equipment and intangibleassets is considered good estimates, however, certain quality assurance procedures have not yet been completed.
A preliminary estimate of goodwill in the transaction amounts to NOK 4,119 million, including goodwill recognized in Sapaprior to the acquisition, and is reflected in the preliminary purchase price allocation. Any adjustments in later period will
FIRST QUARTER REPORT 2018 26

impact deferred tax and goodwill in addition to the item valued. Depreciation and amortization of assets may be impactedshould the value of property, plant and equipment or intangible assets, or the remaining useful life of such assets, bereconsidered in later periods. The final fair value assessment is required to be completed within 12 months from completion ofthe transaction, and may differ from these estimates.
Hydro has considered whether the requirement to reduce production by 50 percent in the alumina refinery Alunorte, andconsequential curtailments represent impairment indicators as of the end of the first quarter. At the time of issuing this report,the duration of the curtailment is still highly uncertain for Alunorte and its primary bauxite source Paragominas, whichconstitute one, combined Cash Generating Unit (CGU) for impairment assessment. The full production can be resumedwithin about three weeks when permission to resume full production is received. The period of curtailment is a limited part ofthe estimated useful life of the CGU provided a restart is allowed within the next few weeks. If a restart permit is not receivedduring the second quarter, the situation is likely to represent a potentially significant reduction of the value of the CGU, andan impairment test may thus be required for the second quarter reporting. For further information about the impairment testof this CGU performed at the end of 2017, see Hydro's Financial statements - 2017 note 19 Impairment of non-current assets.
Note 5: Impairment of non-current assets
In April, Hydro's part-owned subsidiary Albras decided to curtail 50 percent of aluminium production at the Albrasaluminium plant. The curtailment represents 230,000 mt on an annualized basis and is a result of the Alunorte aluminarefinery not being able to supply more than 50 percent of Albras’ alumina needs following Alunorte’s forced production cut.The decision to reduce capacity is considered an impairment indicator for the Albras plant. Assumptions for an impairmenttest are highly uncertain, in particular related to timing of restart of production and the cash flows in the near term impactedby both disturbance in market balance and volatile prices for aluminium, alumina and power in the region. In addition, thereis uncertainty for power prices beyond the current purchase contract, which expires in 2024. The test performed is based onthe assumption that full production is resumed after a limited period; however, reflecting the longer restart period for a smeltercompared to the refinery. There is significant uncertainty related to market prices for aluminum, alumina and other rawmaterial. We have assumed that price levels both for raw materials and metal remains at levels similar to levels observed prior tothe market disruption, with the long-term development assumed in our long-term price assumptions developed in December2017. Based on these assumptions, the plant has a limited coverage above carrying value of the assets.
Should the curtailment of 50 percent of the capacity at the Alunorte alumina refinery continue over a significant period oftime, it may result in impairment assessment in future periods for affected plants, including the alumina refinery at Alunorte,the Paragominas bauxite mine supplying raw material in to Alunorte, the Albras aluminium plant as well as other aluminiumplants using alumina from Alunorte as raw material.
FIRST QUARTER REPORT 201827

Alternative performance measures (APMs)
Alternative performance measures, i.e. financial performance measures not within the applicable financial reportingframework, are used by Hydro to provide supplemental information, by excluding items that, in Hydro’s view, does not give anindication of the periodic operating results or cash flows of Hydro. Financial APMs are intended to enhance comparability ofthe results and cash flows from period to period, and it is Hydro’s experience that these are frequently used by analysts,investors and other parties. Management also uses these measures internally to drive performance in terms of long-term targetsetting and as basis for performance related pay. These measures are adjusted IFRS measures defined, calculated and used in aconsistent and transparent manner over the years and across the company where relevant. Operational measures such as, butnot limited to, volumes, prices per mt, production costs and improvement programs are not defined as financial APMs. Toprovide a better understanding of the company's underlying financial performance for the relevant period, Hydro focuses onunderlying EBIT in the discussions on periodic underlying financial and operating results and liquidity from the business areasand the group, while effects excluded from underlying EBIT and net income (loss) are discussed separately in the section onreported EBIT and net income. Financial APMs should not be considered as a substitute for measures of performance inaccordance with the IFRS. Disclosures of APMs are subject to established internal control procedures.
Hydro's financial APMs
• EBIT: Income (loss) before tax, financial income and expense.
• Underlying EBIT: EBIT +/- identified items to be excluded from underlying EBIT as described below.
• EBITDA: EBIT + depreciation, amortization and impairments, net of investment grants.
• Underlying EBITDA: EBITDA +/- identified items to be excluded from underlying EBIT as described below + impairments.
• Underlying net income (loss): Net income (loss) +/- items to be excluded from underlying income (loss) as described below.
• Underlying earnings per share: Underlying net income (loss) attributable to Hydro shareholders divided by a weighted averageof outstanding shares (ref.: the interim financial statements).
• Investments: Additions to property, plant and equipment (capital expenditures) plus long-term securities, intangible assets,long-term advances and investments in equity accounted investments, including amounts recognized in businesscombinations.
• Adjusted net cash (debt): Short- and long-term interest-bearing debt adjusted for Hydro's liquidity positions, and for liquiditypositions regarded unavailable for servicing debt, pension obligation and other obligations which are considered debt-like innature.
• Metal Markets specific adjustments to underlying EBIT:
• Currency effects include the effects of changes in currency rates on sales and purchase contracts denominated in foreigncurrencies (mainly US dollar and Euro for our European operations) and the effects of changes in currency rates on thefair valuation of derivative contracts (including LME futures) and inventories mainly translated into Norwegian kroner.Hydro manages its external currency exposure on a consolidated basis in order to take advantage of offsetting positions.
• Inventory valuation effects comprise hedging gains and losses relating to inventories. Increasing LME prices result inunrealized hedging losses, while the offsetting gains on physical inventories are not recognized until realized. In period ofdeclining prices, unrealized hedging gains are offset by write-downs of physical inventories.
FIRST QUARTER REPORT 2018 28

Items excluded from underlying EBIT, EBITDA, net income (loss) and earnings per share
Hydro has defined two categories of items which are excluded from underlying results in all business areas, equity accountedinvestments and at group level. One category is the timing effects, which are unrealized changes to the market value of certainderivatives and the metal effect in Rolled Products. When realized, effects of changes in the market values since the inceptionare included in underlying EBIT. Changes in the market value of the trading portfolio are included in underlying results. Theother category includes material items which are not regarded as part of underlying business performance for the period, suchas major rationalization charges and closure costs, major impairments of property, plant and equipment, effects of disposals ofbusinesses and operating assets, as well as other major effects of a special nature. Materiality is defined as items with a valueabove NOK 20 million. All items excluded from underlying results are reflecting a reversal of transactions recognized in thefinancial statements for the current period, except for the metal effect. Part-owned entities have implemented similaradjustments.
• Unrealized derivative effects on LME related contracts include unrealized gains and losses on contracts measured at marketvalue, which are used for operational hedging purposes related to fixed-price customer and supplier contracts, where hedgeaccounting is not applied. Also includes elimination of changes in fair value of certain internal physical aluminium contracts.
• Unrealized derivative effects on power and raw material contracts include unrealized gains and losses on embedded derivativesin raw material and power contracts for Hydro's own use and for financial power contracts used for hedging purposes, aswell as elimination of changes in fair value of embedded derivatives within certain internal power contracts.
• Metal effect in Rolled Products is an effect of timing differences resulting from inventory adjustments due to changingaluminium prices during the production, sales and logistics process, lasting two to three months. As a result, margins areimpacted by timing differences resulting from the FIFO inventory valuation method (first in, first out), due to changingaluminium prices during the process. The effect of inventory write-downs is included. Decreasing aluminium prices in Euroresults in a negative metal effect on margins, while increasing prices have a positive effect.
• Significant rationalization charges and closure costs include costs related to specifically defined major projects, and notconsidered to reflect periodic performance in the individual plants or operations. Such costs involve termination benefits,dismantling of installations and buildings, clean-up activities that exceed legal liabilities, etc. Costs related to regular andcontinuous improvement initiatives are included in underlying results.
• Impairment charges (PP&E and equity accounted investments) relate to significant write-downs of assets or groups of assets toestimated recoverable amounts in the event of an identified loss in value. Gains from reversal of impairment charges aresimultaneously excluded from underlying results.
• (Gains) losses on divestments include a net gain or loss on divested businesses and/or individual major assets.
• Other effects include recognition of pension plan amendments and related curtailments and settlements, insurance proceedscovering asset damage, legal settlements, etc. Insurance proceeds covering lost income are included in underlying results.
• Transaction related effects (Sapa) reflect the net measurement gain relating to previously owned shares in Sapa and aninventory valuation expense related to the Sapa transaction.
• Items excluded in equity accounted investments reflects Hydro's share of items excluded from underlying net income in Sapa,until end of third quarter 2017, and Qatalum and are based on Hydro's definitions, including both timing effects andmaterial items not regarded as part of underlying business performance for the period.
• Net foreign exchange (gain) loss: Realized and unrealized gains and losses on foreign currency denominated accounts receivableand payable, funding and deposits, embedded currency derivatives in certain power contracts and forward currency contractspurchasing and selling currencies that hedge net future cash flows from operations, sales contracts and operating capital.
• Calculated income tax effect: In order to present underlying net income on a basis comparable with our underlying operatingperformance, the underlying income taxes are adjusted for the expected taxable effects on items excluded from underlyingincome before tax.
• Other adjustments to net income include other major financial and tax related effects not regarded as part of the underlyingbusiness performance of the period.
FIRST QUARTER REPORT 201829

Items excluded from underlying EBIT per operating segment and for Other and
eliminations 1)
NOK million
First
quarter
2018
First
quarter
2017
Fourth
quarter
2017
Year
2017
Bauxite & Alumina - - - -
Unrealized derivative effects on LME related contracts (114) 29 100 101
Unrealized derivative effects on power contracts 20 73 (16) 50
Significant rationalization charges and closure costs - - 181 181
Primary Metal (94) 103 265 331
Unrealized derivative effects on LME related contracts (128) 38 27 58
Metal Markets (128) 38 27 58
Unrealized derivative effects on LME related contracts 108 (58) (4) 41
Metal effect 47 (286) (146) (419)
Other effects2)
- - 245 245
Rolled Products 154 (344) 95 (132)
Unrealized derivative effects on LME related contracts 47 (4) (4)
Significant rationalization charges and closure costs - 29 29
Transaction related effects (Sapa)3)
- (1 463) (1 463)
Extruded Solutions 47 (1 438) (1 438)
Energy - - - -
Unrealized derivative effects on power contracts4)
(107) 100 107 197
Unrealized derivative effects on LME related contracts4)
(26) 9 21 23
Other effects5)
- - (33) (33)
Unrealized derivative effects (Sapa) (39) 20
Significant rationalization charges and closure costs (Sapa) - -
Net foreign exchange (gain) loss (Sapa) (4) 5
Calculated income tax effect (Sapa) 11 (6)
Other and eliminations (134) 78 95 206
Items excluded from underlying EBIT (155) (126) (956) (974)
1) Negative figures indicate reversal of a gain and positive figures indicate reversal of a loss.
2) Other effects in Rolled Products reflect a charge related to a customs case in Germany.
3) Transaction related effects include the revaluation gain of Hydro’s pre-transactional 50 percent share in Sapa, as well as the fair value allocated to inventory of finished goods and to thebacklog of contractual deliveries as of closure, sold during fourth quarter 2017.
4) Unrealized derivative effects on power contracts and LME related contracts result from elimination of changes in the valuation of embedded derivatives within certain internal powercontracts and in the valuation of certain internal aluminium contracts.
5) Other effects in Other and eliminations include the remeasurement of environmental liabilities related to closed business in Germany.
Underlying EBITDA
NOK million
First
quarter
2018
First
quarter
2016
Change
prior year
quarter
Fourth
quarter
2017
Change
prior
quarter
Year
2017
EBITDA 5 193 3 762 38 % 6 481 (20) % 18 344
Items excluded from underlying EBIT (155) (126) (23) % (956) 84 % (974)
Underlying EBITDA 5 038 3 637 39 % 5 524 (9) % 17 369
Underlying earnings per share
NOK million
First
quarter
2018
First
quarter
2017
Change
prior year
quarter
Fourth
quarter
2017
Change
prior
quarter
Year
2017
Net income (loss) 2 076 1 838 13 % 3 600 (42) % 9 184
Items excluded from net income (loss) 125 (258) >100 % (783) >100 % (788)
Underlying net income (loss) 2 201 1 580 39 % 2 816 (22) % 8 396
Underlying net income attributable to non-controlling interests 40 44 (9) % 90 (55) % 331
Underlying net income attributable to Hydro shareholders 2 161 1 536 41 % 2 726 (21) % 8 066
Number of shares 2 045 2 043 - 2 045 - 2 044
Underlying earnings per share 1.06 0.75 41 % 1.33 (21) % 3.95
FIRST QUARTER REPORT 2018 30
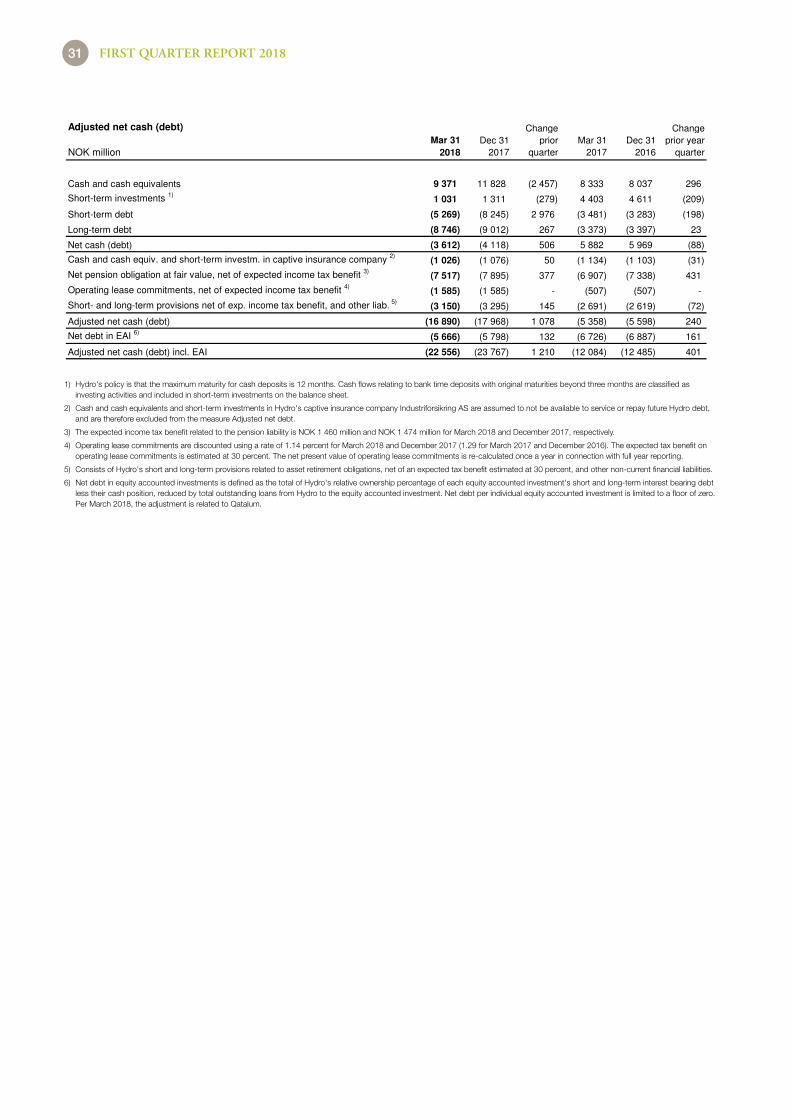
Adjusted net cash (debt)
NOK million
Mar 31
2018
Dec 31
2017
Change
prior
quarter
Mar 31
2017
Dec 31
2016
Change
prior year
quarter
Cash and cash equivalents 9 371 11 828 (2 457) 8 333 8 037 296
Short-term investments 1)
1 031 1 311 (279) 4 403 4 611 (209)
Short-term debt (5 269) (8 245) 2 976 (3 481) (3 283) (198)
Long-term debt (8 746) (9 012) 267 (3 373) (3 397) 23
Net cash (debt) (3 612) (4 118) 506 5 882 5 969 (88)
Cash and cash equiv. and short-term investm. in captive insurance company 2)
(1 026) (1 076) 50 (1 134) (1 103) (31)
Net pension obligation at fair value, net of expected income tax benefit 3)
(7 517) (7 895) 377 (6 907) (7 338) 431
Operating lease commitments, net of expected income tax benefit 4)
(1 585) (1 585) - (507) (507) -
Short- and long-term provisions net of exp. income tax benefit, and other liab. 5)
(3 150) (3 295) 145 (2 691) (2 619) (72)
Adjusted net cash (debt) (16 890) (17 968) 1 078 (5 358) (5 598) 240
Net debt in EAI 6)
(5 666) (5 798) 132 (6 726) (6 887) 161
Adjusted net cash (debt) incl. EAI (22 556) (23 767) 1 210 (12 084) (12 485) 401
1) Hydro's policy is that the maximum maturity for cash deposits is 12 months. Cash flows relating to bank time deposits with original maturities beyond three months are classified asinvesting activities and included in short-term investments on the balance sheet.
2) Cash and cash equivalents and short-term investments in Hydro's captive insurance company Industriforsikring AS are assumed to not be available to service or repay future Hydro debt,and are therefore excluded from the measure Adjusted net debt.
3) The expected income tax benefit related to the pension liability is NOK 1 460 million and NOK 1 474 million for March 2018 and December 2017, respectively.
4) Operating lease commitments are discounted using a rate of 1.14 percent for March 2018 and December 2017 (1.29 for March 2017 and December 2016). The expected tax benefit onoperating lease commitments is estimated at 30 percent. The net present value of operating lease commitments is re-calculated once a year in connection with full year reporting.
5) Consists of Hydro's short and long-term provisions related to asset retirement obligations, net of an expected tax benefit estimated at 30 percent, and other non-current financial liabilities.
6) Net debt in equity accounted investments is defined as the total of Hydro's relative ownership percentage of each equity accounted investment's short and long-term interest bearing debtless their cash position, reduced by total outstanding loans from Hydro to the equity accounted investment. Net debt per individual equity accounted investment is limited to a floor of zero.Per March 2018, the adjustment is related to Qatalum.
FIRST QUARTER REPORT 201831

Additional information
Financial calendar
May 7 Annual General Meeting
July 24 Second quarter results
October 24 Third quarter results
Hydro reserves the right to revise these dates.
Certain statements included in this announcement contain forward-looking information, including, without limitation,information relating to (a) forecasts, projections and estimates, (b) statements of Hydro management concerning plans,objectives and strategies, such as planned expansions, investments, divestments, curtailments or other projects, (c) targetedproduction volumes and costs, capacities or rates, start-up costs, cost reductions and profit objectives, (d) various expectationsabout future developments in Hydro’s markets, particularly prices, supply and demand and competition, (e) results ofoperations, (f ) margins, (g) growth rates, (h) risk management, and (i) qualified statements such as “expected”, “scheduled”,“targeted”, “planned”, “proposed”, “intended” or similar.
Cautionary note
Although we believe that the expectations reflected in such forward-looking statements are reasonable, these forward-lookingstatements are based on a number of assumptions and forecasts that, by their nature, involve risk and uncertainty. Variousfactors could cause our actual results to differ materially from those projected in a forward-looking statement or affect theextent to which a particular projection is realized. Factors that could cause these differences include, but are not limited to: ourcontinued ability to reposition and restructure our upstream and downstream businesses; changes in availability and cost ofenergy and raw materials; global supply and demand for aluminium and aluminium products; world economic growth,including rates of inflation and industrial production; changes in the relative value of currencies and the value of commoditycontracts; trends in Hydro’s key markets and competition; and legislative, regulatory and political factors.
No assurance can be given that such expectations will prove to have been correct. Hydro disclaims any obligation to update orrevise any forward-looking statements, whether as a result of new information, future events or otherwise.
FIRST QUARTER REPORT 2018 32

Norsk Hydro ASANO-0240 Oslo Norway
Tel.: +47 22 53 81 00www.hydro.com
Design and production: Hydro/Artbox Print: Printbox © Hydro 2018
Hydro is a fully integrated aluminium company with 35,000 employees in 40 countries on all continents, combining local expertise, worldwide reach and unmatched capabilities in R&D. In addition to production of primary aluminium, rolled and extruded products and recycling, Hydro also extracts bauxite, refines alumina and generates energy to be the only 360° company of the global aluminium industry. Hydro is present within all market segments for aluminium, with sales and trading activities throughout the value chain serving more than 30,000 customers. Based in Norway and rooted in more than a century of experience in renewable energy, technology and innovation, Hydro is committed to strengthening the viability of its customers and communities, shaping a sustainable future through innovative aluminium solutions.


