16
First-quarter report 2021 Press release 22 April

SKF First-quarter report 2021
First-quarterreport 2021Press release 22 April

2 SKF First-quarter report 2021
-30
-20
-10
0
10
0
10
20
30
40
5
10
15
20
% %
%
-5.1-0.1
8.6
-8.6
-25.2
1521
13.812.0 12.1 12.7 13.1
585 603492 420 381
169 10
0
5
10
15%
12.8 13.3 13.2 14.0
Q1 20 Q2 20 Q3 20 Q4 20 Q1 21
Q1 20 Q2 20 Q3 20 Q4 20 Q1 21
Q1 20 Q2 20 Q3 20 Q4 20 Q1 21 Q1 20 Q2 20 Q3 20 Q4 20 Q1 21
9.4
0
200
400
600
800 Thousand ton C02e
2016 2017 2018 2019 2020
Adjusted operating margin
During the first quarter we saw strong sales and demand growth. We also experienced significant headwinds in terms of cost inflation and currency impact, affecting our operating result by SEK 1.3 billion. Despite this, we delivered a very solid adjusted operating result of SEK 2,789 million (SEK 2,572 mil-lion), representing an adjusted operating margin of 14% (12.8%).
Organic sales development in the quarter was 8.6%, with net sales of SEK 19,865 million (SEK 20,085 million). Sales were significantly higher in Latin America and Asia and relatively unchanged in Europe and North America.
We are already implementing measures across both Indu-strial and Automotive to compensate for rising input costs.
The Industrial business delivered strong results, with an adjusted operating margin of 16.3% (15.5%). The Automotive business continues to perform well, with an adjusted operating margin of 8.9% (6.0%).
The first quarter is historically lower in terms of cash flow generation. The sharp increase in demand in the quarter also contributed to increased working capital. As a result, cash flow was SEK -702 million (SEK 1,930 million).
From this quarter, we will be reporting on our sustainability- related targets as an integrated part of our quarterly report. One of SKF’s strengths is our ability to support the development of industries that enable a shift towards a low-carbon world. Our investments in industries such as renewable energy, electric vehicles and railway is paying off, with sales to these industries growing from SEK 4 billion to 7 billion in the last two years. We are also making progress on our ambitions to reduce CO2 emissions from our own operations.
Operating margin1) Revenue growth2)
ROCE1) Carbon Neutral by 20304)
Net debt/Equity3)
Strong organic growth and operating profit, whilemanaging cost and currency headwinds
SKF’s long-term targets shall be achieved over a business cycle
We continue to capitalize on new ways of working and digitalizing throughout the organization. The sharp increase in demand in the quarter has necessitated an increase of around 200 tempo-rary workers, predominantly in our factories. Permanent staff numbers were unchanged.
Demand has increased gradually since the trough in the second quarter of 2020. Net sales is expected to continue to grow, reaching pre-COVID levels in the second quarter of 2021: i.e. in line with levels reported in the second quarter of 2019.
After close to seven years as CEO, this will be my last quarterly report. To all colleagues, customers and stakeholders: thank you for your support during these years, making all we have done possible.
Alrik DanielsonPresident and CEO
As the Board announced in January, Rickard Gustafson will be joining as President and CEO at the latest by 1 July. Alrik Danielson’s last working day with SKF will be 30 April. The Board has appointed Niclas Rosenlew as Interim CEO in addition to his current role as Chief Financial Officer.
1) Adjusted for items affecting comparability. 2) Including acquisitions, adjusted for divestments. 3) Excluding pension liabilities.4) Scope 1 & 2 C02e from all SKF manufacturing
and logistics units.
Cover picture: Production of a speherical roller bearing at SKF world-class manufacturing site in Gothenburg.
TARGET 14%
TARGET 16% TARGET 0 BY 2030
TARGET 5% TARGET <40%
SKF First-quarter report 2021 3 SKF First-quarter report 2021
-30
-20
-10
0
10
0
10
20
30
40
5
10
15
20
% %
%
-5.1-0.1
8.6
-8.6
-25.2
1521
13.812.0 12.1 12.7 13.1
585 603492 420 381
169 10
0
5
10
15%
12.8 13.3 13.2 14.0
Q1 20 Q2 20 Q3 20 Q4 20 Q1 21
Q1 20 Q2 20 Q3 20 Q4 20 Q1 21
Q1 20 Q2 20 Q3 20 Q4 20 Q1 21 Q1 20 Q2 20 Q3 20 Q4 20 Q1 21
9.4
0
200
400
600
800 Thousand ton C02e
2016 2017 2018 2019 2020
Adjusted operating margin
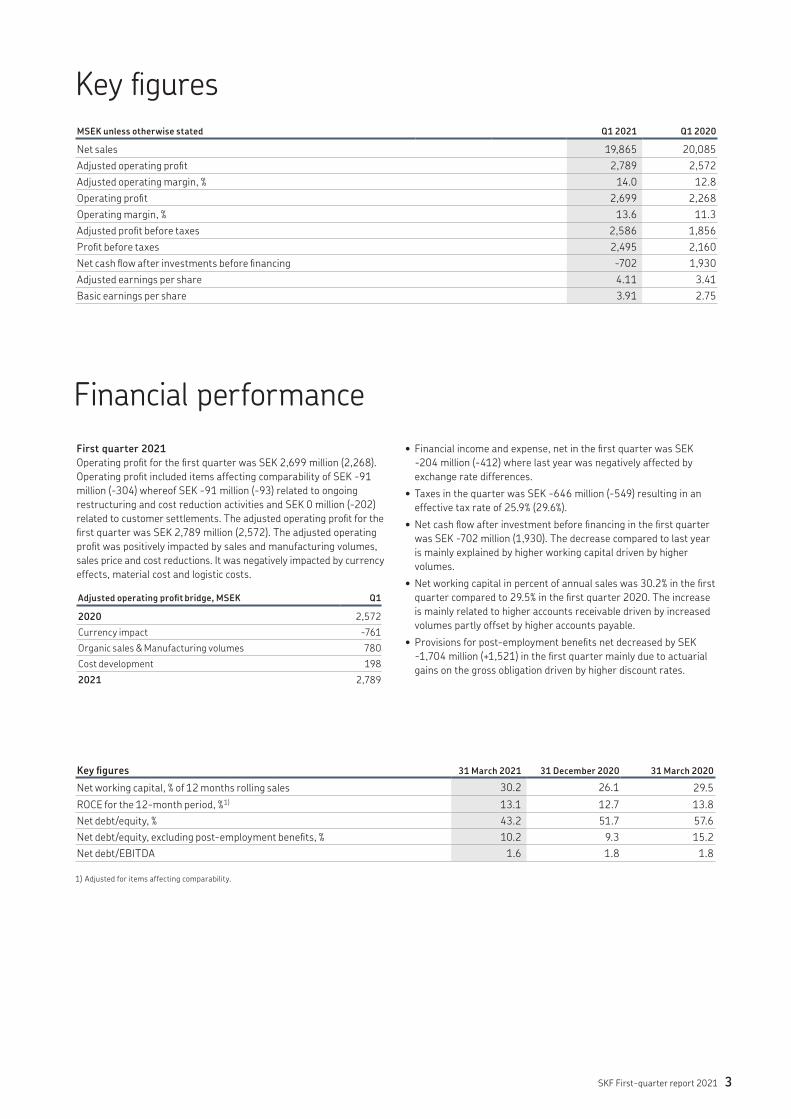
MSEK unless otherwise stated Q1 2021 Q1 2020
Net sales 19,865 20,085Adjusted operating profit 2,789 2,572Adjusted operating margin, % 14.0 12.8Operating profit 2,699 2,268Operating margin, % 13.6 11.3Adjusted profit before taxes 2,586 1,856Profit before taxes 2,495 2,160Net cash flow after investments before financing -702 1,930Adjusted earnings per share 4.11 3.41Basic earnings per share 3.91 2.75
Key figures
First quarter 2021Operating profit for the first quarter was SEK 2,699 million (2,268). Operating profit included items affecting comparability of SEK -91 million (-304) whereof SEK -91 million (-93) related to ongoing restructuring and cost reduction activities and SEK 0 million (-202) related to customer settlements. The adjusted operating profit for the first quarter was SEK 2,789 million (2,572). The adjusted operating profit was positively impacted by sales and manufacturing volumes, sales price and cost reductions. It was negatively impacted by currency effects, material cost and logistic costs.
Adjusted operating profit bridge, MSEK Q1
2020 2,572Currency impact -761Organic sales & Manufacturing volumes 780Cost development 1982021 2,789
Financial performance
Key figures 31 March 2021 31 December 2020 31 March 2020
Net working capital, % of 12 months rolling sales 30.2 26.1 29.5ROCE for the 12-month period, %1) 13.1 12.7 13.8Net debt/equity, % 43.2 51.7 57.6Net debt/equity, excluding post-employment benefits, % 10.2 9.3 15.2Net debt/EBITDA 1.6 1.8 1.8
1) Adjusted for items affecting comparability.
• Financial income and expense, net in the first quarter was SEK -204 million (-412) where last year was negatively affected by exchange rate differences.
• Taxes in the quarter was SEK -646 million (-549) resulting in an effective tax rate of 25.9% (29.6%).
• Net cash flow after investment before financing in the first quarter was SEK -702 million (1,930). The decrease compared to last year is mainly explained by higher working capital driven by higher volumes.
• Net working capital in percent of annual sales was 30.2% in the first quarter compared to 29.5% in the first quarter 2020. The increase is mainly related to higher accounts receivable driven by increased volumes partly offset by higher accounts payable.
• Provisions for post-employment benefits net decreased by SEK -1,704 million (+1,521) in the first quarter mainly due to actuarial gains on the gross obligation driven by higher discount rates.

4 SKF First-quarter report 2021
Q1Net sales, change y-o-y, % Organic1) Structure Currency Total
SKF Group 8.6 0.0 -9.7 -1.1Industrial 5.4 0.0 -9.4 -4.0Automotive 16.7 0.0 -10.5 6.21) Price, mix and volume
Q1Organic sales in local currencies, change y-o-y, %
Europe, Middle East and Africa
North America
Latin America
Asia- Pacific
SKF Group 1.7 -0.4 17.7 26.2Industrial +/- +/- +++ +++Automotive ++ - +++ +++
Q1
Customer industriesEurope, Middle
East and AfricaNorth
AmericaLatin
AmericaAsia-
Pacific
Organic sales in local currencies, change y-o-y:Light vehicles + - ++ +++Trucks +++ ++ +++ +++Vehicle aftermarket +++ -- +++ +++Aerospace --- --- +++Industrial drives +/- - +++ +++Energy +/- --- +++ +++Heavy industries ++ --- +/- +/-Off-highway ++ +++ +++ +++Railway +/- +/- ---Agriculture, food and beverage +/- +++Marine --- +++ ---Electrical +++ +++Other industrial -- -- --- +++Industrial distribution +++ +++ +++ +++
Sales
Europe, Middle East and AfricaIndustrial: Overall, sales were relatively unchanged in the quarter. By industry, sales to industrial distribution were significantly higher, sales to heavy industries and to off-highway were higher while sales to the energy, railway, industrial drives and to the agriculture, food & beverage industries were relatively unchanged. Sales to the aerospace and marine industries were significantly lower compared to Q1 2020. Automotive: Sales in the quarter were higher compared to last year with significantly higher sales to trucks and to the vehicle aftermarket. Sales to light vehicles were slightly higher compared to Q1 2020.
North AmericaIndustrial: Sales were relatively unchanged in the quarter compared to Q1 2020. Sales to industrial distribution, marine and off-highway were significantly higher. Sales to railway were relatively unchanged, sales to industrial drives were slightly lower while sales to all other industries were significantly lower. Automotive: Sales in the quarter were slightly lower compared to last year with higher sales to trucks, slightly lower sales to light vehicles and lower sales to the vehicle aftermarket.
Asia-PacificIndustrial: Sales were significantly higher in the quarter. Sales were significantly higher to all industrial segments with the exception of heavy industries which saw relatively unchanged sales and the marine and railway industries where sales were significantly lower compared to Q1 2020. Automotive: Sales were significantly higher in the quarter. Sales were significantly higher to trucks, light vehicles as well as to the vehicle aftermarket compared to Q1 2020.
Latin AmericaIndustrial: Overall, sales were significantly higher in the quarter. By industry, sales to energy, off-highway, industrial drives and to industrial distribution were all significantly higher. Sales to heavy industries were relatively unchanged compared to Q1 2020. Automotive: Sales in the quarter were significantly higher compared to last year with significantly higher sales to trucks and to the vehicle aftermarket. Sales to light vehicles were higher compared to Q1 2020.
Comments on organic sales in local currencies in Q1 2021, compared to Q1 2020

SKF First-quarter report 2021 5 SKF First-quarter report 2021
Latin America 7%
Light vehicles 50%
Vehicle aftermarket 28%
Trucks 22%
EMEA 42%
Asia-Pacific 29%
North America 16%
Latin America 13%
EMEA 43%
Asia-Pacific 28%
North America 22%
Industrial drives 14%Energy 11%
Aerospace 8%
Industrial distribution 36%
Other industrial 5%Agriculture, food and beverage 1%Electrical 1%Marine 2%Railway 6%
Off-highway 8%Heavy industries 8%
Net sales by region for Industrial Q1 2021
MSEK unless otherwise statedIndustrial Q1 2021 Q1 2020
Net sales 13,788 14,364Adjusted operating profit 2,247 2,230Adjusted operating margin, % 16.3 15.5Operating profit 2,177 2,151Operating margin, % 15.8 15.0
Automotive Q1 2021 Q1 2020
Net sales 6,077 5,721Adjusted operating profit 542 342Adjusted operating margin, % 8.9 6.0Operating profit 522 117Operating margin, % 8.6 2.0
1) Previously published figures for 2020 have been restated to reflect a change in classification of customers between the segments.
Segment information1)
Net sales by customer industry for Industrial Q1 2021
Net sales by customer industry for Automotive Q1 2021
Net sales by region for Automotive Q1 2021

6 SKF First-quarter report 2021
Highlights Investing in Airasca, Italy SKF is investing SEK 400 million in expanding and modernizing its manufacturing facility in Airasca, Italy. The investment will bring the manufacturing of super-precision bearings (SuPBs) for industrial applications into the Group’s largest manufactur-ing site in Italy and enables the consolidation of the Group’s existing manufacturing sites in Northern Italy. The factory in Pianezza, currently manufacturing SuPBs, will be consolidated into Airasca. The factory in Villar Perosa will continue to focus on bearings for the railway and aerospace industries while the production of SuPBs will be transferred to Airasca.
Annual General Meeting of AB SKFRickard Gustafson was newly elected as Board member. The following Board members were re-elected: Hans Stråberg, Hock Goh, Barb Samardzich, Colleen Repplier, Geert Follens, Håkan Buskhe and Susanna Schneeberger. Hans Stråberg was elected Chairman of the Board of Directors.
Outlook and Guidance Demand for Q2 2021 compared to Q2 2020 Demand has improved gradually since the trough in the second quarter of 2020. Net sales is expected to continue to grow, reaching pre-COVID levels in the second quarter of 2021, i.e. in line with levels reported in the second quarter of 2019.
Guidance Q2 2021 Currency impact on the operating profit is expected to be around SEK -400 million compared with Q2 2020, based on exchange rates per 31 March 2021.
Guidance 2021• Tax level excluding effects related to divested businesses:
around 28%. • Additions to property, plant and equipment:
around SEK 3,600 million.
Previous outlook statementDemand for Q1 2021 compared to Q1 2020We expect to see mid-single digit growth in organic sales in the first quarter of 2021 compared to the first quarter of 2020.
The industries and regions in which SKF operates are still impacted by the effects related to the spread of COVID-19.

SKF First-quarter report 2021 7 SKF First-quarter report 2021
0
2
4
6
8
2021 Q12)20201)20192018
SEK billion Thousand ton C02e Equivalent energy GWh
4.15.2
6.6 7.0
0
0.25
0.50
0.75
1.00 0.99
2015 2016 2017 2018 2019 2020 2021 Q11)
0.87 0.85 0.81 0.77 0.75 0.77
0
200
400
600
800
2020201920182017201620150
500
1,000
1,500
2,000
Thousand ton C02e Equivalent energy GWh
0
2
4
6
8
2021 Q12)20201)20192018
SEK billion Thousand ton C02e Equivalent energy GWh
4.15.2
6.6 7.0
0
0.25
0.50
0.75
1.00 0.99
2015 2016 2017 2018 2019 2020 2021 Q11)
0.87 0.85 0.81 0.77 0.75 0.77
0
200
400
600
800
2020201920182017201620150
500
1,000
1,500
2,000
Thousand ton C02e Equivalent energy GWh
Sustainability performanceSKF has been publicly reporting on sustainability performance for many years in the Group’s annual report, on skf.com and in various other forums. Reflecting the increasing operational and strategic importance of these issues, the Group is now including certain related KPI’s also in the quarterly report. It is anticipated that the scope and depth of this reporting will increase over time.
Cleantech revenues Cleantech revenues are the aggregated sales to acknowledged cleantech sectors such as renewable energy, electric vehicles, railway, and recycling. The growth of these sectors has far outstripped the organic growth of SKF as a whole – indicating the successful execution of SKF’s cleantech strategy.1) Previously published figures for 2020 have been restated to reflect a change in classification2) 2021 figures relate to the latest 12 months period.
Accident rateThe Accident rate measures the number of recordable accidents per 100 employees per year. There has been a considerable reduction in the accident rate over the past 5 years.1) 2021 figures relate to the latest 12 months period.
CO2 emissions, Equivalent energyCO2 emissions1) for SKF’s operations (Scope 1 and 2 according to the Greenhouse Gas protocol) and total energy use for the same scope are presented in the graph. SKF continues to make good progress towards the Group’s goal to be Carbon Neutral for these aspects by 2030.1) Due to external reporting constraints, this data is presented for the end
of the previous quarter.
8 SKF First-quarter report 2021
Accounting principlesThe consolidated financial statements of the SKF Group were prepared in accordance with International Financial Reporting Standards (IFRS) as adopted by the EU. The interim report was prepared in accordance with IAS 34 Interim Financial Reporting. The financial statements of the Parent company were prepared in accordance with the “Annual Accounts Act” and the RFR 2 “Accounting for legal entities”. SKF Group and the Parent company
applied the same accounting principles and methods of compu-tation in the interim financial statements as compared with the latest annual report. IASB issued several amended accounting standards that were endorsed by EU, effective date 1 January 2021. None of these have a material effect on the SKF Group s financial statements.
The SKF Group operates in many different industrial and geo-graphical areas that are at different stages of the economic cycle. A general economic downturn at global level, for example caused by a pandemic, or in one of the world’s leading economies, could reduce the demand for the Group’s products, solutions and services for a period of time. In addition, terrorism and other hostilities, as well as disturbances in worldwide financial markets and natural disasters, could have a negative effect on the demand for the Group’s products and services. There are also political and regulatory risks associated with the wide geographical presence.
Regulatory requirements, taxes, tariffs and other trade barriers, price or exchange controls or other governmental policies could limit the SKF Group’s operations. The SKF Group is subject to both transaction and translation of currency exposure.
Risks and uncertainties in the businessFor commercial flows the SKF Group is primarily exposed to the EUR, USD and CNY. As the major part of the profit is made outside Sweden, the Group is also exposed to translational risks in all the major currencies. The financial position of the parent company is dependent on the financial position and development of the subsidiaries. A general decline in the demand for the products and services provided by the Group could mean lower residual profits and lower dividend income for the parent company, as well as a need for writing down values of the shares in the subsidiaries.
SKF is subject to an investigation in Brazil by the General Superintendence of the Administrative Council for Economic Defense, regarding an alleged violation of antitrust rules by several companies active on the automotive aftermarket in Brazil.
Gothenburg, 22 April 2021Aktiebolaget SKF (publ)
Alrik DanielsonPresident and CEO
This report has not been reviewed by AB SKF’s auditors.

SKF First-quarter report 2021 9 SKF First-quarter report 2021
Condensed consolidated income statementsMSEK Jan-Mar 2021 Jan-Mar 2020
Net sales 19,865 20,085Cost of goods sold -14,124 -14,575Gross profit 5,741 5,510
Research and development cost -653 -651Selling and administrative expenses -2,423 -2,708Other operating income/expenses, net 34 117Operating profit 2,699 2,268
Financial income and expense, net -204 -412Profit before taxes 2,495 1,856
Taxes -646 -549Net profit 1,849 1,307
Net profit attributable to:Shareholders of the parent 1,782 1,250Non-controlling interests 67 57
Basic earnings per share (SEK) 3.91 2.75Diluted earnings per share (SEK) 3.91 2.74
Condensed consolidated statements of comprehensive incomeMSEK Jan-Mar 2021 Jan-Mar 2020
Net profit 1,849 1,307
Items that will not be reclassified to the income statement:Remeasurements (actuarial gains and losses) 2,090 -742Income taxes -535 125
1,555 -617Items that may be reclassified to the income statement:Exchange differences arising on translation of foreign operations 1,618 1,706Assets at fair value through other comprehensive income 11 -30Income taxes -20 15
1,609 1,691
Other comprehensive income, net of tax 3,164 1,074Total comprehensive income 5,013 2,381
Shareholders of AB SKF 4,871 2,273Non-controlling interests 142 108

10 SKF First-quarter report 2021
Condensed consolidated balance sheetsMSEK March 2021 December 2020
Goodwill 10,611 10,117Other intangible assets 6,256 6,125Property, plant and equipment 19,105 18,161Right of use asset leases 2,577 2,517Deferred tax assets 4,372 4,800Other non-current assets 1,784 1,939Non-current assets 44,705 43,659
Inventories 16,939 15,733Trade receivables 14,793 12,286Other current assets 4,537 4,242Other current financial assets 15,023 14,637Current assets 51,292 46,898
Total assets 95,997 90,557
Equity attributable to shareholders of AB SKF 39,169 34,309
Equity attributable to non-controlling interests 1,545 1,403
Long-term financial liabilities 18,366 15,089Provisions for post-employment benefits 13,465 15,170Provisions for deferred taxes 926 792Other long-term liabilities and provisions 1,585 2,150Non-current liabilities 34,342 33,201
Trade payables 9,190 8,459Short-term financial liabilities 824 3,260Other short-term liabilities and provisions 10,927 9,925Current liabilities 20,941 21,644
Total equity and liabilities 95,997 90,557
Condensed consolidated statements of changes in shareholders’ equityMSEK Jan-Mar 2021 Jan-Mar 2020
Opening balance 1 January 35,712 37,366Total comprehensive income 5,013 2,381Cost for performance share programmes, net -17 -36Transactions with non-controlling interests, other -1 –Other 7 13Total cash dividends – -1Closing balance 40,714 39,723
SKF First-quarter report 2021 11 SKF First-quarter report 2021
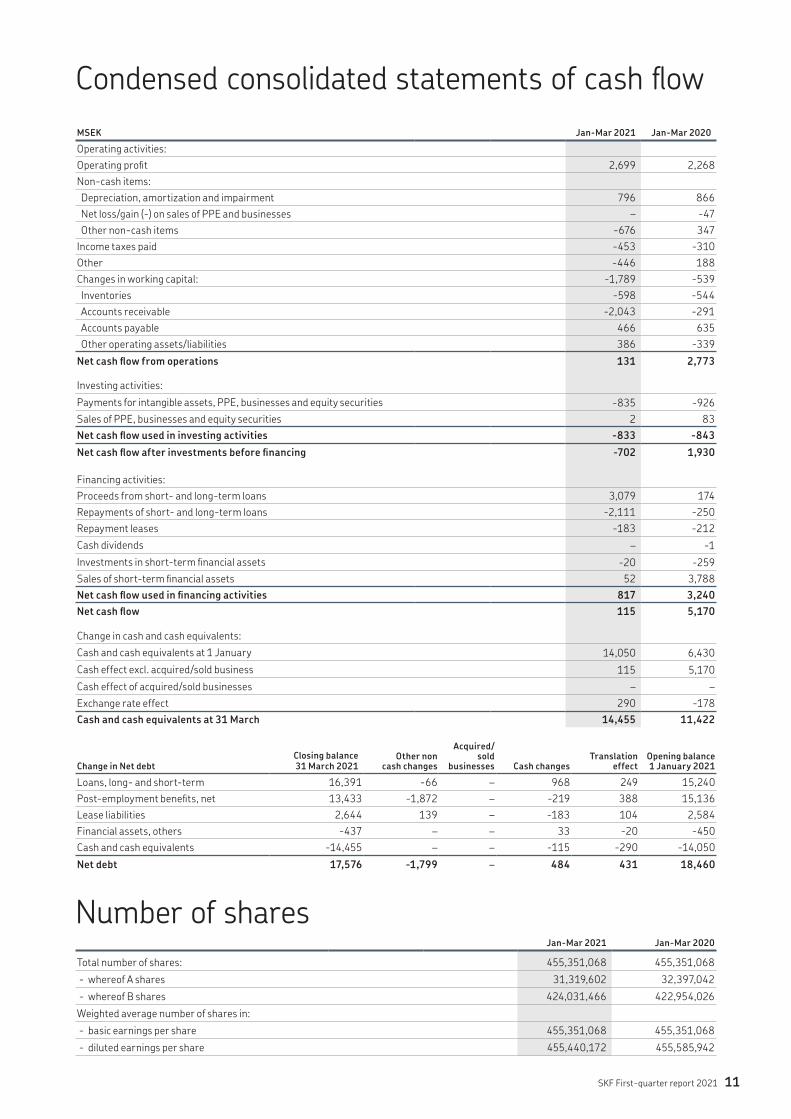
Condensed consolidated statements of cash flowMSEK Jan-Mar 2021 Jan-Mar 2020Operating activities:Operating profit 2,699 2,268Non-cash items: Depreciation, amortization and impairment 796 866 Net loss/gain (-) on sales of PPE and businesses – -47 Other non-cash items -676 347Income taxes paid -453 -310Other -446 188Changes in working capital: -1,789 -539 Inventories -598 -544 Accounts receivable -2,043 -291 Accounts payable 466 635 Other operating assets/liabilities 386 -339Net cash flow from operations 131 2,773
Investing activities:Payments for intangible assets, PPE, businesses and equity securities -835 -926Sales of PPE, businesses and equity securities 2 83Net cash flow used in investing activities -833 -843Net cash flow after investments before financing -702 1,930
Financing activities:Proceeds from short- and long-term loans 3,079 174Repayments of short- and long-term loans -2,111 -250Repayment leases -183 -212Cash dividends – -1Investments in short-term financial assets -20 -259Sales of short-term financial assets 52 3,788Net cash flow used in financing activities 817 3,240Net cash flow 115 5,170
Change in cash and cash equivalents:Cash and cash equivalents at 1 January 14,050 6,430Cash effect excl. acquired/sold business 115 5,170Cash effect of acquired/sold businesses – –Exchange rate effect 290 -178Cash and cash equivalents at 31 March 14,455 11,422
Change in Net debtClosing balance 31 March 2021
Other non cash changes
Acquired/sold
businesses Cash changes Translation
effectOpening balance 1 January 2021
Loans, long- and short-term 16,391 -66 – 968 249 15,240Post-employment benefits, net 13,433 -1,872 – -219 388 15,136Lease liabilities 2,644 139 – -183 104 2,584Financial assets, others -437 – – 33 -20 -450Cash and cash equivalents -14,455 – – -115 -290 -14,050Net debt 17,576 -1,799 – 484 431 18,460
Number of sharesJan-Mar 2021 Jan-Mar 2020
Total number of shares: 455,351,068 455,351,068 - whereof A shares 31,319,602 32,397,042 - whereof B shares 424,031,466 422,954,026Weighted average number of shares in: - basic earnings per share 455,351,068 455,351,068 - diluted earnings per share 455,440,172 455,585,942

12 SKF First-quarter report 2021
Condensed consolidated financial information MSEK unless otherwise stated
Q2/19 Q3/19 Q4/19 Q1/20 Q2/20 Q3/20 Q4/20 Q1/21
Net sales 22,488 21,039 21,208 20,085 16,599 18,596 19,572 19,865Cost of goods sold -16,150 -15,330 -15,717 -14,575 -12,895 -13,759 -14,118 -14,124Gross profit 6,338 5,709 5,491 5,510 3,704 4,837 5,454 5,741Gross margin, % 28.2 27.1 25.9 27.4 22.3 26.0 27.9 28.9
Research and development cost -691 -642 -684 -651 -652 -553 -660 -653Selling and administrative expenses -3,103 -2,918 -2,993 -2,708 -2,569 -2,317 -2,659 -2,423- as % of sales 13.8 13.9 14.1 13.5 15.5 12.5 13.6 12.2Other, net -5 139 96 117 186 -45 75 34Operating profit 2,539 2,288 1,910 2,268 669 1,922 2,210 2,699Operating margin, % 11.3 10.9 9.0 11.3 4.0 10.3 11.3 13.6Adjusted operating profit 2,856 2,380 2,181 2,572 1,565 2,475 2,582 2,789Adjusted operating margin, % 12.7 11.3 10.3 12.8 9.4 13.3 13.2 14.0
Financial net -278 -244 -188 -412 -89 -202 -66 -204Profit before taxes 2,261 2,044 1,722 1,856 580 1,720 2,144 2,495Profit margin before taxes, % 10.1 9.7 8.1 9.2 3.5 9.2 11.0 12.6
Taxes -682 -693 -641 -549 -249 -487 -541 -646Net profit 1,579 1,351 1,081 1,307 331 1,233 1,603 1,849
Net profit attributable toShareholders of the parent company 1,511 1,293 1,035 1,250 342 1,179 1,527 1,782Non-controlling interests 68 58 46 57 -11 54 76 67
Reconciliation of profit before taxes for the GroupMSEK Q2/19 Q3/19 Q4/19 Q1/20 Q2/20 Q3/20 Q4/20 Q1/21
Operating profit:Industrial1) 2,227 2,172 1,879 2,151 1,282 1,595 1,663 2,177Automotive1) 312 116 31 117 -613 327 547 522Financial net -278 -244 -188 -412 -89 -202 -66 -204Profit before taxes for the Group 2,261 2,044 1,722 1,856 580 1,720 2,144 2,495
1) Previously published figures for 2019 and 2020 have been restated to reflect a change in classification of customers between the segments.

SKF First-quarter report 2021 13 SKF First-quarter report 2021
Key figures Definitions, see page 15
Q2/19 Q3/19 Q4/19 Q1/20 Q2/20 Q3/20 Q4/20 Q1/21
EBITDA, MSEK 3,425 3,134 2,840 3,134 1,543 2,734 3,059 3,494EBITA, MSEK 2,691 2,443 2,063 2,421 822 2,069 2,369 2,841Adjusted operating profit 2,856 2,380 2,181 2,572 1,565 2,475 2,582 2,789Adjusted operating margin, % 12.7 11.3 10.3 12.8 9.4 13.3 13.2 14.0Basic earnings per share, SEK 3.32 2.84 2.27 2.75 0.75 2.59 3.36 3.91Adjusted earnings per share, SEK 4.02 3.04 2.86 3.41 2.72 3.80 4.17 4.11Diluted earnings per share, SEK 3.32 2.84 2.27 2.74 0.75 2.59 3.35 3.91Dividend per share, SEK 6.00 – – – 3.00 – – –Net worth per share, SEK 74 76 78 83 76 77 75 86Share price at the end of the period, SEK 170.8 162.7 189.4 136.7 173.2 185.7 213.4 248.2NWC, % of 12 months rolling sales 30.1 29.9 27.7 29.5 30.0 28.7 26.1 30.2ROCE for the 12-month period, % 16.0 15.0 13.2 12.5 9.8 9.3 9.8 10.5ROE for the 12-month period, % 20.1 18.9 15.7 14.3 10.9 10.6 12.1 13.7Gearing, % 49.3 48.9 47.1 47.4 49.7 50.2 48.0 44.4Equity/assets ratio, % 37.6 37.8 39.7 39.4 38.7 38.1 39.4 42.4Additions to property, plant and
equipment, MSEK 684 967 1,154 917 670 796 949 819Net debt/equity, % 67.6 67.0 59.3 57.6 62.5 59.8 51.7 43.2Net debt, MSEK 24,103 24,548 22,176 22,877 22,866 21,868 18,460 17,576Net debt/EBITDA 1.8 1.8 1.7 1.8 2.1 2.1 1.8 1.6Registered number of employees 43,700 43,687 43,360 43,134 41,835 41,174 40,963 41,151
SKF applies the guidelines issued by ESMA (European Securities and Markets Authority) on APMs (Alternative Performance Measures). These key figures are not defined or specified in IFRS but provide complementary information to investors and other stakeholders on the company’s
performance. The definition of each APM is presented at the end of the interim report. For the reconciliation of each APM against the most reconcilable line item in the financial statements, see investors.skf.com/en.
Segment information – quarterly figures 1) MSEK unless otherwise stated
Industrial Q2/19 Q3/19 Q4/19 Q1/20 Q2/20 Q3/20 Q4/20 Q1/21
Net sales 15,909 14,971 15,232 14,364 13,080 12,979 13,489 13,788Adjusted operating profit 2,499 2,078 2,022 2,230 1,832 2,045 1,963 2,247Adjusted operating margin, % 15.7 13.9 13.3 15.5 14.0 15.8 14.6 16.3Operating profit 2,227 2,172 1,879 2,151 1,282 1,595 1,663 2,177Operating margin, % 14.0 14.5 12.3 15.0 9.8 12.3 12.3 15.8Assets and liabilities, net 42,864 43,717 42,949 45,898 43,384 41,713 38,508 41,472Registered number of employees 35,951 36,067 35,839 35,478 33,916 33,400 33,157 33,446
Automotive Q2/19 Q3/19 Q4/19 Q1/20 Q2/20 Q3/20 Q4/20 Q1/21
Net sales 6,579 6,068 5,976 5,721 3,519 5,617 6,083 6,077Adjusted operating profit 357 303 159 342 -267 430 619 542Adjusted operating margin, % 5.4 5.0 2.7 6.0 -7.6 7.7 10.2 8.9Operating profit 312 116 31 117 -613 327 547 522Operating margin, % 4.7 1.9 0.5 2.0 -17.4 5.8 9.0 8.6Assets and liabilities, net 12,738 12,915 11,954 11,909 11,184 10,313 9,358 10,645Registered number of employees 7,106 6,958 6,850 6,741 6,499 6,362 6,351 6,292
1) Previously published figures for 2019 and 2020 have been restated to reflect a change in classification of customers between the segments.

14 SKF First-quarter report 2021
Parent company condensed income statementsMSEK Jan-Mar 2021 Jan-Mar 2020
Revenue 1,532 1,200Cost of goods sold -1,215 -1,224General management and administrative expenses -360 -332Other operating income/expenses, net 1 -9Operating result -42 -365
Financial income and expense, net -5 -17Profit before taxes -47 -382
Taxes 12 74Net profit -35 -308
Parent company condensed statements of comprehensive incomeMSEK Jan-Mar 2021 Jan-Mar 2020
Net profit -35 -308Items that may be reclassified to the income statement:Assets at fair value through other comprehensive income 11 -30Other comprehensive income, net of tax 11 -30Total comprehensive income -24 -338
Parent company condensed balance sheetsMSEK March 2021 December 2020
Intangible assets 1,479 1,528Investments in subsidiaries 22,496 22,496Receivables from subsidiaries 15,998 12,750Other non-current assets 1,022 970Non-current assets 40,995 37,744
Receivables from subsidiaries 2,395 5,971Other receivables 3,096 163Current assets 5,491 6,134
Total assets 46,486 43,878
Shareholders' equity 25,709 25,801Provisions 468 468Non-current liabilities 15,998 12,750Current liabilities 4,311 4,859Total shareholders' equity, provisions and liabilities 46,486 43,878

SKF First-quarter report 2021 15 SKF First-quarter report 2021
Adjusted operating profitOperating profit excluding items affecting comparability.
Adjusted operating marginOperating profit margin excluding items affecting comparability.
Basic earnings/loss per share in SEKProfit/loss after taxes less non-controlling interests divided by the ordinary number of shares.
Currency impact on operating profitThe effects of both translation and transaction flows based on current assumptions and exchange rates compared to the corresponding period last year.
DebtLoans and net provisions for post-employment benefits.
Diluted earnings per shareDiluted earnings per share is calculated using the weighted average number of shares outstanding during the period adjusted for all potential dilutive ordinary shares.
EBITA (Earnings before interest, taxes and amortization). Operating profit before amortizations.
EBITDA (Earnings before interest, taxes, depreciation and amortization)Operating profit before depreciations, amortizations, and impairments.
Equity/assets ratio Equity as a percentage of total assets.
GearingDebt as a percentage of the sum of debt and equity.
Items affecting comparabilitySignificant income/expenses that affect comparability between accounting periods. This includes, but is not limited to, restructuring costs, impairments and write-offs, currency exchange rate effects caused by devaluations and gains and losses on divestments of businesses. Net debtDebt less short-term financial assets excluding derivatives.
Net debt/EBITDANet debt, as a percentage of twelve months rolling EBITDA.
Net debt/equityNet debt, as a percentage of equity.
Net worth per share (Equity per share)Equity excluding non-controlling interests divided by the ordinary number of shares.
Net working capital as % of 12 month rolling sales (NWC)Trade receivables plus inventory minus trade payables as a percentage of twelve months rolling net sales.
Operating marginOperating profit/loss, as a percentage of net sales.
Operational performanceOperational performance includes the effects on operating profit related to changes in organic sales, changes in manu-facturing volumes and manufacturing costs and changes in selling and administrative expenses.
Revenue growth Sales excluding effects of currency and divested businesses.
Registered number of employeesTotal number of employees included in SKF’s payroll at the end of the period.
Return on capital employed (ROCE)Operating profit/loss plus interest income, as a percentage of twelve months rolling average of total assets less the average of non-interest bearing liabilities.
Return on equity (ROE)Profit/loss after taxes as a percentage of twelve months rolling average of equity.
SKF demand outlookThe demand outlook for SKF s products and services represents management’s best estimate based on current information about the future demand from our customers. The demand outlook is the expected volume development in the markets where our customers operate.
Definitions
Cautionary statementThis report contains forward-looking statements that are based on the current expectations of the management of SKF. Although management believes that the expectations reflected in such forward-looking statements are reasonable, no assurance can be given that such expectations will prove to have been correct. Accordingly, results could differ materially from those implied in the forward-looking statements as a
result of, among other factors, changes in economic, market and competitive conditions, changes in the regulatory environment and other government actions, fluctuations in exchange rates and other factors mentioned in SKF’s latest annual report (available on investors.skf.com/en), including under the Administration Report; “Risk management” and in this report under “Risks and uncertainties in the business.”
This is SKFSKF is a leading global supplier of bearings, seals, lubrication systems and services, which include technical support, mainten-ance and reliability services, engineering consulting and training.
Quick factsFounded 1907Represented in more than 130 countries Net sales in 2020: SEK 74,852 million 40,963 employees15 technical centers91 manufacturing sitesMore than 17,000 distributors
AB SKF (publ)Postal address: SE-415 26 Gothenburg, Sweden Visiting address: Sven Wingquists Gata 2 tel. +46 31 337 10 00www.skf.com Company reg.no. 556007-3495
VisionSKF works to reduce friction, make things run faster, longer, cleaner and more safely. Doing this in the most effective, productive and sustainable way contributes to the vision – A world of reliable rotation.
MissionTo be the undisputed leader in the bearing business.
Strategic focus areasBased on SKF’s vision and mission, the company focuses on six strategic areas: 1. Digital sales2. New business models3. Innovation4. World-class manufacturing5. Future workforce6. Cleantech
For further information, please contact:INVESTOR RELATIONS: Patrik Stenberg, Director, SKF Group Investor Relations and Mergers & Acquisitionstel: 46 31-337 2104; 46 705-472 104 e-mail: [email protected]
PRESS: Theo Kjellberg, Director, SKF Group Communicationtel: 46 31 337 6576, mobile: 46 725-776576 e-mail: [email protected]
Webcast 22 April at 10:00 (CEST), 09.00 (UK)https://investors.skf.com/enSweden +46 10 884 8016UK / International +44 20 3936 2999Passcode: 895705
Calendar 20 July, Q2 report 202126 October, Q3 report 2021
The financial information in this press release is information which AB SKF is required to disclose under the EU Market Abuse Regulation (EU) No 596/2014 The information was provided by the above contact persons for publication on 22 April 2021 at 08.45 CEST.
® SKF is a registered trademark of the SKF Group. · © SKF Group 2021 · The contents of this publication are the copyright of the publisher and may not be reproduced (even extracts) unless prior written permission is granted. Every care has been taken to ensure the accuracy of the information contained in this publication but no liability can be accepted for any loss or damage whether direct, indirect or consequential arising out of the use of the information contained herein. · April 2021
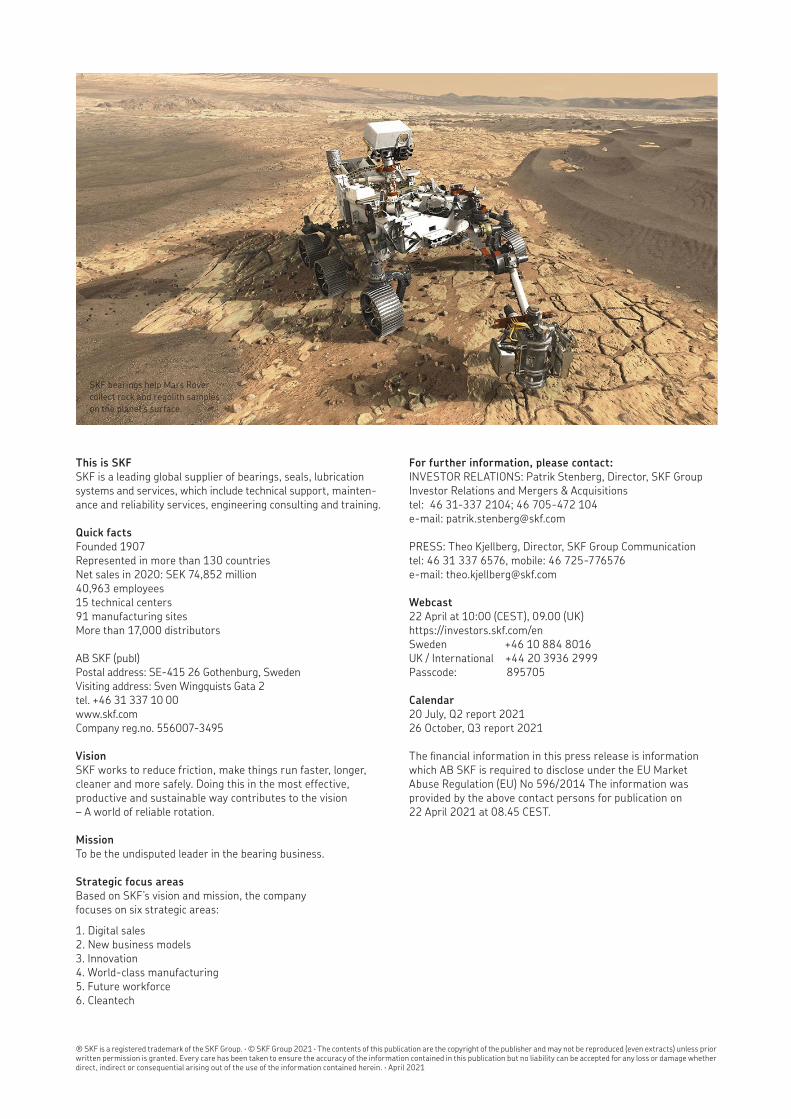
SKF bearings help Mars Rover collect rock and regolith samples on the planet’s surface.


