26
Fiscal Problem In Barbados ! Transfer and Subsidies

Fiscal Problem In Barbados !
Transfer and Subsidies

Overview of Fiscal Situation
1996/1997 2006/2007 2016/2017
Revenue $ 1,437.60 bl $ 2,130.80 bl $ 2,770.90 bl
Current Expenditure $ 1,213.40bl $ 2,112.40 bl $ 3,053.80bl
Capital Expenditure $ 263.20 ml $ 249.50 ml $ 225.10 ml
Total Expenditure $ 1,476.60 bl $ 2,361.90 bl $ 3,278.90 bl
Deficit / Surplus $ (39.00) ml $ (231.10) ml $ (508.00) ml

Changes in Fiscal 1997 to 2007 ($Mls)
1998 1999 2000 2001 2002 2003 2004 2005 2006 2007
Revenue
$
103.2
$
20.4
$
145.9
$
39.4
$
(34.3)
$
149.0
$
34.4
$
146.7
$
88.5
$
340.8
Current Expenditure
$
119.1
$
78.4
$
91.9
$
109.5
$
58.8
$
65.1
$
68.2
$
197.2
$
110.80
$
379.8
Capital Expenditure
$
(15.7)
$
21.6
$
13.0
$
32.3
$
41.9
$
(84.8)
$
(56.3)
$
37.2
$
(2.9)
$
(11.3)
Total Expenditure
$
103.4
$
100.0
$
104.9
$
141.8
$
100.7
$
(19.7)
$
11.9
$
234.4
$
107.9
$
368.5
Transfer and
Subsidies
$
38.0
$
33.6
$
(9.1)
$
70.3
$
17.9
$
126.6
$
49.5
$
93.7
$
38.5
$
157.1
Wages and Salaries
$
70.1
$
11.6
$
71.5
$
(16.4)
$
30.5
$
(50.1)
$
15.5
$
48.4
$
11.1
$
110.4
Goods and Services
$
(3.1)
$
10.4
$
18.7
$
16.2
$
19.5
$
(15.6)
$
3.00
$
28.4
$
30.1
$
98.6
Debt Service
$
14.1
$
22.4
$
11.3
$
39.3
$
(9.2)
$
4.2
$
0.3
$
26.8
$
31.0
$
13.7

Changes in Fiscal 2008 to 2016 $Mls
2008 2009 2010 2011 2012 2013 2014 2015 2016
Revenue
$
125.8
$
(273.7)
$
(44.8)
$
271.6
$
(93.2)
$
(123.0)
$
73.0
$
51.1
$
312.5
Current
Expenditure
$
294.5
$
23.2
$
109.9
$
(103.1)
$
259.8
$
47.5
$
(205.3)
$
166.8
$
(31.7)
Capital
Expenditure
$
15.5
$
(75.4)
$
(43.6)
$
(16.5)
$
2.9
$
48.2
$
24.2
$
42.8
$
(11.2)
Total Expenditure
$
310.0
$
(52.2)
$
66.3
$
(119.6)
$
262.7
$
95.7
$
(181.1)
$
209.6
$
(42.9)
Transfer and
Subsidies
$
159.3
$
(41.3)
$
78.3
$
(151.6)
$
211.2
$
27.6
$
(141.4)
$
64.7
$
(43.0)
Wages and
Salaries
$
23.7
$
28.4
$
(0.9)
$
7.2
$
14.8
$
(10.3)
$
(68.2)
$
(16.5)
$
(2.8)
Goods and
Services
$
58.7
$
(3.3)
$
(38.9)
$
21.1
$
(7.8)
$
(9.5)
$
(40.7)
$
99.8
$
(55.9)
Debt Service
$
52.8
$
39.4
$
71.4
$
20.2
$
41.5
$
39.8
$
45.0
$
18.8
$
70.0
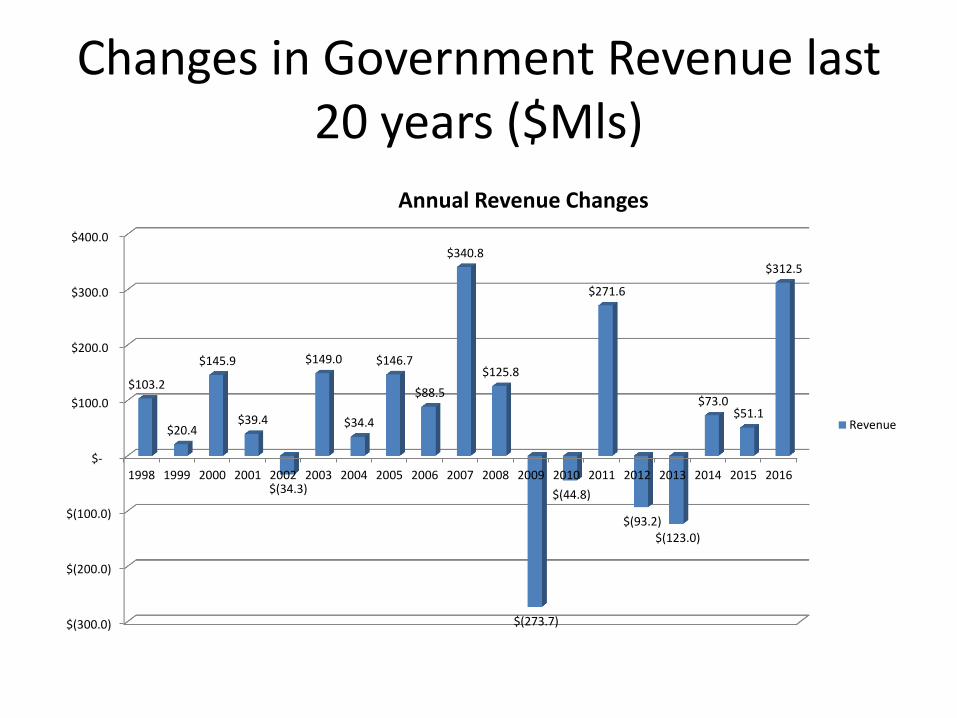
Changes in Government Revenue last 20 years ($Mls)
$(300.0)
$(200.0)
$(100.0)
$-
$100.0
$200.0
$300.0
$400.0
1998 1999 2000 2001 2002 2003 2004 2005 2006 2007 2008 2009 2010 2011 2012 2013 2014 2015 2016
$103.2
$20.4
$145.9
$39.4
$(34.3)
$149.0
$34.4
$146.7
$88.5
$340.8
$125.8
$(273.7)
$(44.8)
$271.6
$(93.2) $(123.0)
$73.0 $51.1
$312.5
Annual Revenue Changes
Revenue

Changes in Recurrent Expenditure Last 20 Years ($ Mls)
$(300.0)
$(200.0)
$(100.0)
$-
$100.0
$200.0
$300.0
$400.0
1998 1999 2000 2001 2002 2003 2004 2005 2006 2007 2008 2009 2010 2011 2012 2013 2014 2015 2016
$119.1
$78.4 $91.9
$109.5
$58.8 $65.1 $68.2
$197.2
$110.8
$379.8
$294.5
$23.2
$109.9
$(103.1)
$259.8
$47.5
$(205.3)
$166.8
$(31.7)
Current Expenditure
Current Expenditure
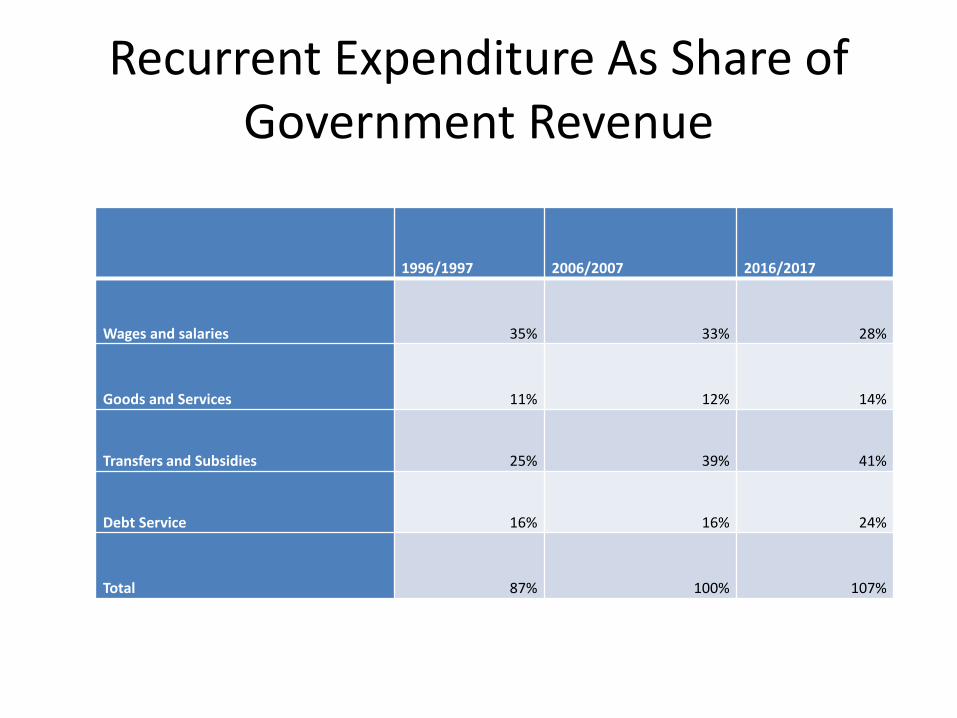
Recurrent Expenditure As Share of Government Revenue
1996/1997 2006/2007 2016/2017
Wages and salaries 35% 33% 28%
Goods and Services 11% 12% 14%
Transfers and Subsidies 25% 39% 41%
Debt Service 16% 16% 24%
Total 87% 100% 107%
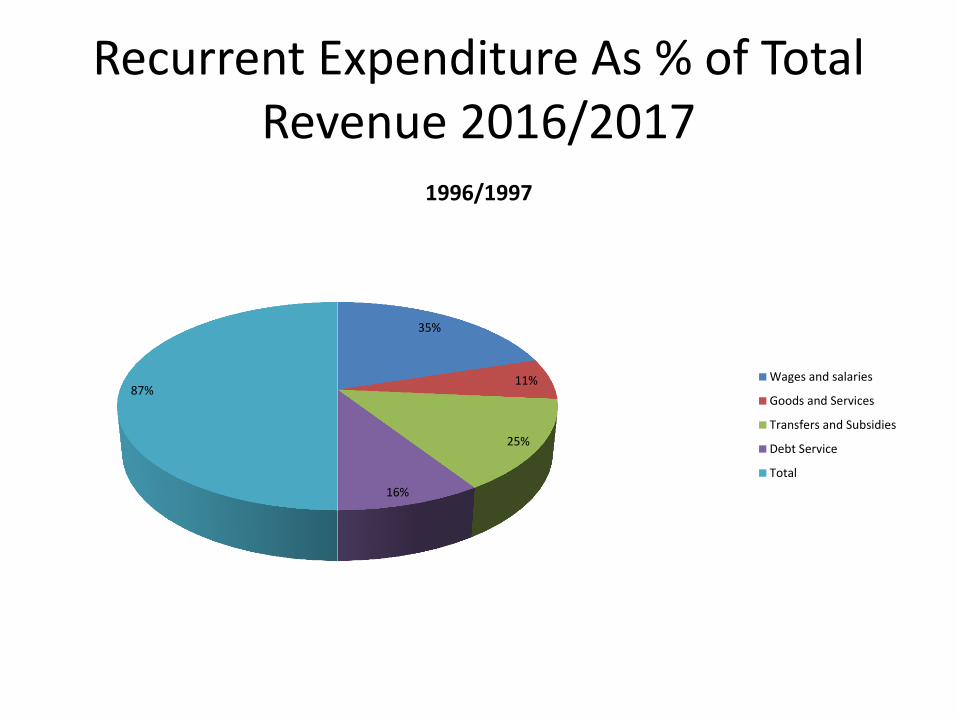
Recurrent Expenditure As % of Total Revenue 2016/2017
35%
11%
25%
16%
87%
1996/1997
Wages and salaries
Goods and Services
Transfers and Subsidies
Debt Service
Total

Recurrent Expenditure As % of Total Revenue 2006/2007
33%
12%
39%
16%
100%
2006/2007
Wages and salaries
Goods and Services
Transfers and Subsidies
Debt Service
Total

Recurrent Expenditure As % of Total Revenue 2016/2017
28%
14%
41%
24%
107%
2016/2017
Wages and salaries
Goods and Services
Transfers and Subsidies
Debt Service
Total

Changes In Transfers & Subsidies Last 20 years ($Mls)
-200
-150
-100
-50
0
50
100
150
200
250
1998 1999 2000 2001 2002 2003 2004 2005 2006 2007 2008 2009 2010 2011 2012 2013 2014 2015 2016
$38.0 $33.6
$(9.1)
$70.3
$17.9
$126.6
$49.5
$93.7
$38.5
$157.1 $159.3
$(41.3)
$78.3
$(151.6)
$211.2
$27.6
$(141.4)
$64.7
$(43.0)
Transfer andSubsidies

Composition of Transfers & Subsidies
• Grants to public institutions – Represents transfers to all State Owned Entities such as NCC, BCC, SSA, QEH, UWI etc.
• Retiring Benefits – Public Servants Pensions
• Subsidies - Support for transport board relative to bus fares subsidized for pensioners, school children and the general public.
Composition of Transfers & Subsidies
• Grants to individuals – principally constituted of support to the welfare department and support for bursaries for children in some private schools through the ministry of education , as well as national development scholarships.
• Grants to non-profit organizations – Represents contributions principally to non-governmental social development organisations such as the cancer society, diabetes association, Council for the Disabled, the Trade Unions, and other civic organizations.

Composition of Transfers & Subsidies
• Subscriptions and contributions – this is largely made up of fees and contributions government is called upon to make as member of many national, regional and international organisations such as the UN, the World Bank, IDB, World Postal Union, Caricom, IMF etc.

Number of State-Owned Entities
• As an Oversight Committee, we identified 57 so called State-Owned Enterprises (SOEs), and there is a much longer list of state supported entities.
• However, the lion share of the expenditure is focused on a small number of these entities.

State-Owned Entities
Short Form Full Name
ATLTA Air Transport Licensing Authority
BAC Barbados Accreditation Council
BAMED Barbados Agency For Micro Enterprise Development
BAMC Barbados Agricultural Management Company
BACT Barbados Agricultural Credit Trust Ltd.
BADMC Barbados Agricultural Development & marketing Corporation
BCIC Barbados Cane Industry Corporation
BCC Barbados Community College
BCCHI Barbados Community College Hospitality Institute
BCSL Barbados Conference Services
BDF Barbados Defense force
BIBPC Barbados International Business Promotion Corporation
BIDC Barbaddos Investment Development Corporation
BNOC Barbados national Oil Company
BNSI Barbados national Standards Institute
BNTC Barbados National Terminal Co. LTD
BPI Barbados Port Inc.
BRA Barbados Revenue Authority

State-Owned Entities
Short Form Full Name
BTRA Barbados Transport Authority
BTII Barbados Tourism Investment Inc.
BTMI Barbados Tourism marketing Inc.
BTPA Barbados Tourism Product Authority
BVTB Barbados Vocational Trainig Board
BWA Barbados Water Authority
CAH Caribbean Aircraft Handling Co. Ltd.
CAIL Caribbean Airways Limited
CBC Caribbean Broadcasting Corporation
COBL Caves of Barbados Limited
CCB Child Care Board
CLSC Community Legal Services Commission
EGFL Enterprise Growth Fund Limited
ETTC Erdiston Teachers Training College
FTC Fair Trading Commission
FSC Financial Services Commission
GYM The Gymnasium Ltd.
GAIA Grantley Adams International Airport Inc.
H&RL Hotel and Resorts Limited
KOMI Kensington Oval Management Inc.
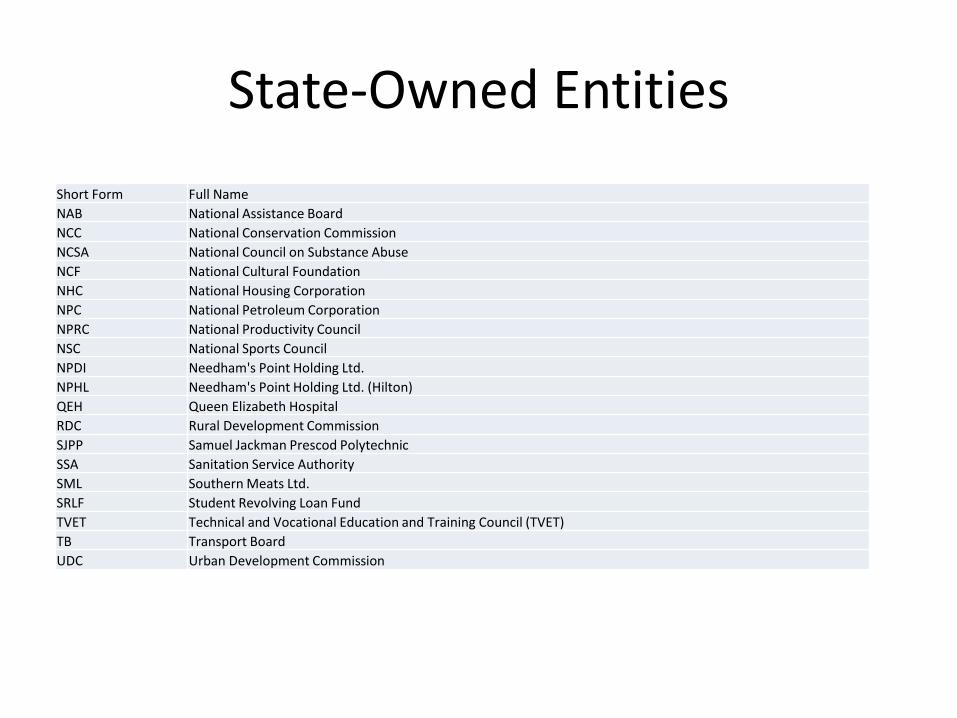
State-Owned Entities
Short Form Full Name
NAB National Assistance Board
NCC National Conservation Commission
NCSA National Council on Substance Abuse
NCF National Cultural Foundation
NHC National Housing Corporation
NPC National Petroleum Corporation
NPRC National Productivity Council
NSC National Sports Council
NPDI Needham's Point Holding Ltd.
NPHL Needham's Point Holding Ltd. (Hilton)
QEH Queen Elizabeth Hospital
RDC Rural Development Commission
SJPP Samuel Jackman Prescod Polytechnic
SSA Sanitation Service Authority
SML Southern Meats Ltd.
SRLF Student Revolving Loan Fund
TVET Technical and Vocational Education and Training Council (TVET)
TB Transport Board
UDC Urban Development Commission
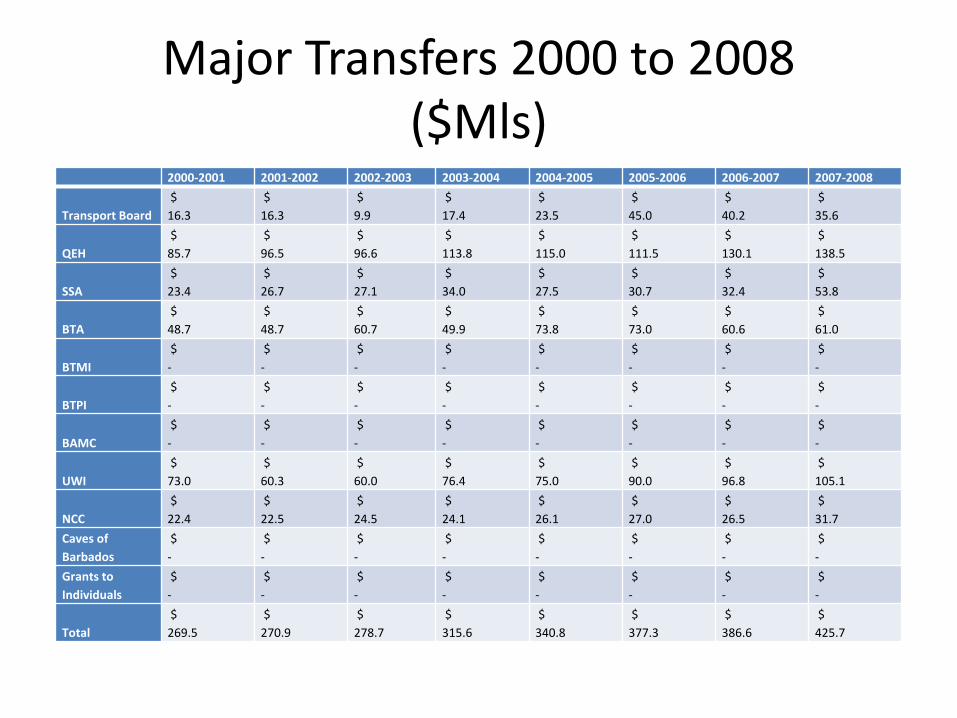
Major Transfers 2000 to 2008 ($Mls)
2000-2001 2001-2002 2002-2003 2003-2004 2004-2005 2005-2006 2006-2007 2007-2008
Transport Board
$
16.3
$
16.3
$
9.9
$
17.4
$
23.5
$
45.0
$
40.2
$
35.6
QEH
$
85.7
$
96.5
$
96.6
$
113.8
$
115.0
$
111.5
$
130.1
$
138.5
SSA
$
23.4
$
26.7
$
27.1
$
34.0
$
27.5
$
30.7
$
32.4
$
53.8
BTA
$
48.7
$
48.7
$
60.7
$
49.9
$
73.8
$
73.0
$
60.6
$
61.0
BTMI
$
-
$
-
$
-
$
-
$
-
$
-
$
-
$
-
BTPI
$
-
$
-
$
-
$
-
$
-
$
-
$
-
$
-
BAMC
$
-
$
-
$
-
$
-
$
-
$
-
$
-
$
-
UWI
$
73.0
$
60.3
$
60.0
$
76.4
$
75.0
$
90.0
$
96.8
$
105.1
NCC
$
22.4
$
22.5
$
24.5
$
24.1
$
26.1
$
27.0
$
26.5
$
31.7
Caves of
Barbados
$
-
$
-
$
-
$
-
$
-
$
-
$
-
$
-
Grants to
Individuals
$
-
$
-
$
-
$
-
$
-
$
-
$
-
$
-
Total
$
269.5
$
270.9
$
278.7
$
315.6
$
340.8
$
377.3
$
386.6
$
425.7
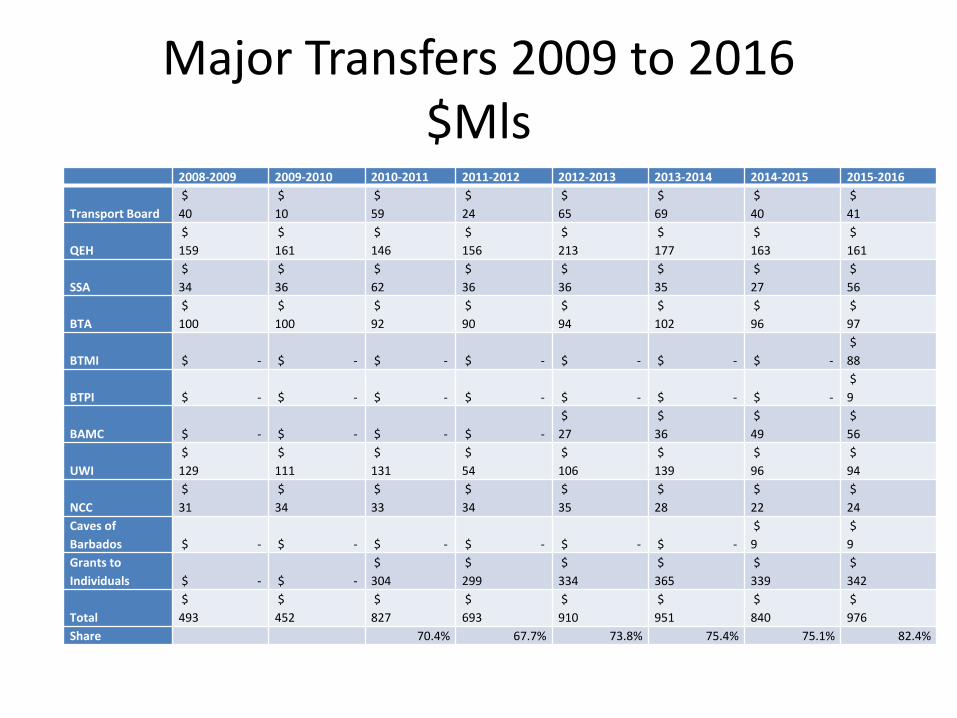
Major Transfers 2009 to 2016 $Mls
2008-2009 2009-2010 2010-2011 2011-2012 2012-2013 2013-2014 2014-2015 2015-2016
Transport Board
$
40
$
10
$
59
$
24
$
65
$
69
$
40
$
41
QEH
$
159
$
161
$
146
$
156
$
213
$
177
$
163
$
161
SSA
$
34
$
36
$
62
$
36
$
36
$
35
$
27
$
56
BTA
$
100
$
100
$
92
$
90
$
94
$
102
$
96
$
97
BTMI $ - $ - $ - $ - $ - $ - $ -
$
88
BTPI $ - $ - $ - $ - $ - $ - $ -
$
9
BAMC $ - $ - $ - $ -
$
27
$
36
$
49
$
56
UWI
$
129
$
111
$
131
$
54
$
106
$
139
$
96
$
94
NCC
$
31
$
34
$
33
$
34
$
35
$
28
$
22
$
24
Caves of
Barbados $ - $ - $ - $ - $ - $ -
$
9
$
9
Grants to
Individuals $ - $ -
$
304
$
299
$
334
$
365
$
339
$
342
Total
$
493
$
452
$
827
$
693
$
910
$
951
$
840
$
976
Share 70.4% 67.7% 73.8% 75.4% 75.1% 82.4%

Transfers and Subsidies
• Transfers and subsidies is now the largest item of public expenditure.
• Hence the focus on Transfers and Subsidies by the International Monetary Fund ($300ml reduction).
• Adjustments in this area are likely to form part of any successful fiscal adjustment strategy.
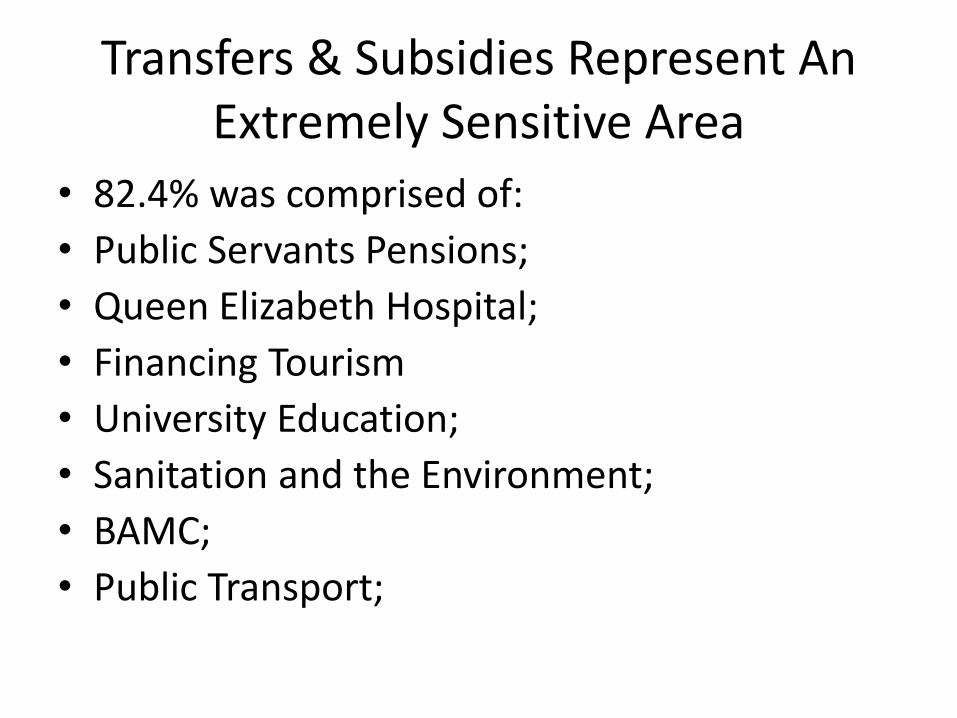
Transfers & Subsidies Represent An Extremely Sensitive Area
• 82.4% was comprised of:
• Public Servants Pensions;
• Queen Elizabeth Hospital;
• Financing Tourism
• University Education;
• Sanitation and the Environment;
• BAMC;
• Public Transport;

Transfers & Subsidies Represent An Extremely Sensitive Area
29%
14%
8%
8%
7%
5% 3%
Public Servants Pensions;
Queen Elizabeth Hospital;
Financing Tourism
University Education;
Sanitation and the Environment;
BAMC;
Public Transport;
Addressing The Issue
• To date Barbados has adopted what some term a “Scandinavian Approach” to major social services:
• Largely funded from general taxation;
• Largely universal access, free at the point of delivery;

Strategic Framework For Transfers and Subsidies
Strategy Rationale
Continue as is with some tweaking System has served Barbados well:
Raise additional revenue to maintain system;
Set strict budgetary targets and reduce service levels to
what country can afford;
Means Testing;
Increased Cost recovery by entities;
Abolish/ Wind-up Entity’s function is not needed or entity has reached end
of useful life.
Merge / Consolidate Entity’s functions are duplicated. Economies of scale
and scope can be achieved through merging with
another entity.
Private Sector / Commercial Delivery
Outright Sale
Leases and Management Contracts
Joint Ventures
Public Share Offerings
Private Tenders
Management Buyouts
Private sector actors are better placed to deliver the
entity’s functions in a more efficient or cost-effective
manner.
The type of vehicle is generally determined by the level
of involvement Government needs to maintain so as to
ensure the following outcomes:
• Essential social services are easily available to the
most vulnerable citizens •
Opportunities for short-term gain do not outweigh need
for long-term investment in activities of strategic
economic or social importance.
Self Financing Autonomous Vehicle Privatization may not be in public interest, but a lean
self financing semi-autonomous agency may be suitable.

What is Required?
• Acknowledgement and understanding of the challenge;
• A political mandate to undertake such major reforms;
• Significant political will given the large amounts of political capital required;
• High levels of technical expertise, careful and detailed analysis, and consideration of the broadest possible range of options;
• Clear plans, targets and time lines.


