64
Division of Waste Management Fiscal Year 2017 Annual Report Commonwealth of Kentucky Department for Environmental Protection Division of Waste Management 502.564.6716 waste.ky.gov

Division of Waste Management
Fiscal Year 2017 Annual Report
Commonwealth of Kentucky Department for Environmental Protection Division of Waste Management 502.564.6716 waste.ky.gov
FY 2017 ANNUAL REPORT DIVISION OF WASTE MANAGEMENT
i
MESSAGE FROM THE DIRECTOR
On behalf of the Division of Waste Management, I am pleased to present the 12th edition of the annual report. This report includes division activities and accomplishments that transpired in fiscal year 2017 (July 1, 2016 to June 30, 2017).
Our primary mission is protecting human health and the environment. I admire the division staff. Their hard work and commitment preserves and improves our environment.
In 2017, the division continued to achieve success across its branches. Our staff work at an intense pace to ensure our mission is sustained. I applaud the dedication of staff as it continues to address all areas entrusted to the division’s care.
To summarize the division's achievements, over 130 illegal dumpsites were remediated, and more than 480 thousand waste tires were recovered. Through the Methamphetamine Lab Cleanup Program 48 residences were decontaminated. There were over seven thousand inspections conducted by field operations. Over eight hundred directives were issued for site investigation or corrective action activities to underground storage tank sites. Municipal solid waste products recycled totaled over 3.3 million tons. Substantial completion status was achieved at Maxey Flats with a projected final completion certification date of December 2017. Jon Maybriar, Director Kentucky Division of Waste Management
FY 2017 ANNUAL REPORT DIVISION OF WASTE MANAGEMENT
ii
TABLE OF CONTENTS
MESSAGE FROM THE DIRECTOR ............................................................... i
TABLE OF CONTENTS .................................................................................... ii
FIGURES ............................................................................................................ iii
EXECUTIVE SUMMARY .................................................................................. 1
INTRODUCTION ................................................................................................ 3
PROGRAM, PLANNING & ADMINISTRATION .......................................... 8
FIELD OPERATIONS ...................................................................................... 15
HAZARDOUS WASTE ..................................................................................... 19
RECYCLING & LOCAL ASSISTANCE ........................................................ 22
SOLID WASTE .................................................................................................. 34
SUPERFUND ...................................................................................................... 42
UNDERGROUND STORAGE TANK ............................................................. 55
ACKNOWLEDGMENTS .................................................................................. 59
BRANCH HIGHLIGHTS Blue Grass Army Depot by Daniel Walker, Page 17 Hazardous Waste Regulations by Heather Alexander, Page 21 Composting Grants Prove to be Very Popular by Donna Conway, Page 32 Technologically Enhanced Naturally Occurring Radioactive Materials by Robin Green, Page 41 State-Lead Superfund Emergency Remedial Action: Southern Wood Treatment by Cliff Hall, Page 49 State Superfund - Ranking System by Sheri Adkins, Page 52 Continuing to Move Forward by Lori Terry, Page 57 Right: Brian Bentley, Mark Cook, Jason Craig, Tim Bryant
Cover Photographs by John W. Brown: Recycling and Local Assistance Branch, State Office Paper Recycling Facility, Northgate Drive, Frankfort
FY 2017 ANNUAL REPORT DIVISION OF WASTE MANAGEMENT
iii
FIGURES Figure 1 DWM Budget Analysis .......................................................................... 8 Figure 2 DWM Funded Positions ........................................................................ 9 Figure 3 Employee Years of Service by Percent ................................................ 9 Figure 4 DWM Inspections ................................................................................ 15 Figure 5 DWM Inspection Compliance Rates .................................................. 16 Figure 6 Hazardous Waste Permits Pending Review ...................................... 20 Figure 7 Kentucky Tons Recycled ..................................................................... 22 Figure 8 State Office Paper Recycling Totals .................................................. 23 Figure 9 Fiber Recyclables Market ................................................................... 24 Figure 10 Plastic Recyclables Market ................................................................. 25 Figure 11 Glass Recyclables Market ................................................................... 25 Figure 12 Metal Recyclables Market .................................................................. 26 Figure 13 Litter Abatement Collection ............................................................... 29 Figure 14 Illegal Open Dump Cleanups and Expenditures .............................. 30 Figure 15 Total Population of Kentucky ............................................................ 34 Figure 16 Municipal Solid Waste Generated in Kentucky ............................... 35 Figure 17 U.S. and Kentucky Recycling Rates ................................................... 35 Figure 18 Municipal Solid Waste Disposal and Recycling ............................... 36 Figure 19 Kentucky Households Participating in MSW Collection ................ 37 Figure 20 Landfarm Permit Reviews Completed by Fiscal Year .................... 37 Figure 21 ERF Reporting Compliance ............................................................... 38 Figure 22 Superfund Program Site Final Actions ............................................. 42 Figure 23 Kentucky Superfund Potential Existing/Projected Liabilities ........ 46 Figure 24 NFA Letters Issued by Number of Sites ............................................ 56 Figure 25 UST Cleanup Sites Remaining FY07-17 ........................................... 56

FY 2017 ANNUAL REPORT DIVISION OF WASTE MANAGEMENT
1
EXECUTIVE SUMMARY The Kentucky Division of Waste Management (DWM) is the second largest division within the Department for Environmental Protection. The 236-staff total remains unchanged from the previous fiscal year. The seven branches that comprise DWM are:
Field Operations; Hazardous Waste; Program Planning and Administration; Recycling and Local Assistance; Solid Waste; Superfund; and Underground Storage Tank
2016 CALENDAR YEAR AND 2017 STATE FISCAL YEAR SELECTED ACHIEVEMENTS AND CHALLENGES:
BROWNFIELD REDEVELOPMENT PROGRAM: Success continues with the Brownfield Redevelopment Program. In FY17, 52 brownfield sites were reviewed pursuant to KRS 224.1-415. The division issued 41 Notice of Eligibility letters, and 35 Notification of Concurrence letters. Two sites were pending review at the end of the fiscal year.
HOUSEHOLD MUNICIPAL SOLID WASTE (MSW) COLLECTION: Participation in household MSW collection has remained steady since legislation in 2002 began requiring waste haulers and recycling haulers to register and to report in each county for which they provide service. The 2016 statewide, household participation rate for MSW collection was 85.5 percent.
ILLEGAL OPEN DUMPSITES: Since 1993, over 25,937 illegal open dumpsites have been addressed at a cost of 79.7 million dollars. In 2016, counties cleaned 137 illegal open dumps at a cost of $1.77 million and collected 7,037 tons of waste. The thirteenth annual round of grants to counties was awarded in January 2017 for the remediation of 112 dumpsites at a projected cost of $1.06 million.
LITTER ALONG PUBLIC ROADS: The Kentucky Pride Fund, Eastern Kentucky PRIDE, Bluegrass Greensource, Kentucky Transportation Cabinet, and Adopt-A-Highway, as well as cities and counties across the commonwealth contributed to the cleanup of 14,267,580 pounds of litter at a cost of $7.6 million during 2016. The average cost of litter picked up in 2016 was 53 cents per pound.

FY 2017 ANNUAL REPORT DIVISION OF WASTE MANAGEMENT
2
MAXEY FLATS PROJECT SUBSTANTIAL COMPLETION CERTIFICATION:
Work began with the clearing of a portion of the southern hillside to construct a haul road that allowed the transportation of construction materials from state-owned property in the valleys below the landfill cap. The Final Cap Phase construction achieved substantial completion in December 2016, at which time the site entered into a U.S. Environmental Protection Agency (EPA) designate Function and Operation Period. This allotted the commonwealth one year to evaluate the cap construction and performance, develop the Institutional Control Work Plan, and make necessary adjustments to reach final completion. The Final Completion Certification is projected for December 2017.
METHAMPHETAMINE LAB CLEANUP PROGRAM: Through the division’s Superfund Branch, 50 contaminated residences were reported as having suspected methamphetamine contamination. Forty-eight (48) residences were decontaminated through the Methamphetamine Lab Cleanup Program in FY17.
RECYCLING Kentuckians recycled 2,602,472 tons of common household recyclables (aluminum, cardboard, steel, plastic, newspaper, glass, and paper) for a recycling rate of 37.2 percent in 2016. Kentuckians recycled a total of 3,302,180 tons of municipal solid waste in 2016 including sludge, concrete, compost, and asphalt.
STATE GOVERNMENT OFFICE PAPER RECYCLING PROGRAM: This program continues to thrive. It serves more than 115 agencies in Frankfort. Office paper, computer paper, newsprint, and cardboard are collected, sorted, shredded, baled, and sold to a paper mill. State employees recycled 1,184 tons of waste paper in 2016, approximately 183 pounds per individual. Confidential document destruction continues to be provided at no charge, boosting the economic efficiency of the program.
UNDERGROUND STORAGE TANK (UST) PROGRAM SUCCESS: The UST program emphasizes immediate and effective remediation. The number of open UST sites continues to decline. The total number of UST cleanups remaining has decreased substantially over the last few years; from 675 in FY16 to 580 in FY17. There were 288 No Further Action letters issued.
WASTE TIRE PROGRAM: In FY17 waste tire collection events (formerly referred to as “tire amnesties”) were conducted at Buffalo Trace, FIVCO, Cumberland Valley, Gateway, Big Sandy and KY River Area Development Districts (ADDs). These districts cover 36 counties. The equivalent of 480,472 waste tires were recovered through FY17 collection events at a cost of $759,145.06.
FY 2017 ANNUAL REPORT DIVISION OF WASTE MANAGEMENT
3
INTRODUCTION The Division of Waste Management (DWM) is one of six divisions within the Department for Environmental Protection in the Energy and Environment Cabinet. The departmental strategic operational plan for the state fiscal year 2017 describes the goals of the agency:
To accomplish this mission, the department has established a set of objectives to be implemented by each division. The objectives, relevant to this division are:
Objective 1 - Ensure programs adhere to federal and state statutory and regulatory requirements.
Tactic 1.1: Review and revise administrative regulations, and propose legislative amendments to comply with federal regulatory requirements.
Measures: Number of legislative proposals drafted in the current fiscal year. Number of regulatory packages developed, promulgated and finalized in the current fiscal year. Number of public notices issued and public hearing conducted by branch.
Action 1.1.1: Develop regulation packages for division programs that comply with state statutory and federal requirements in a manner protective of human health and the environment that accurately reflect programmatic policy. Action 1.1.2: Prepare draft legislative agenda to address any issues requiring legislative solutions and pursue enactment. Action 1.1.3: Develop regulation packages that are inclusive of stakeholder concerns.
Tactic 1.2: Provide resources and oversight to the regulated community to achieve compliance with federal and state regulations.
Measures: Number of underground storage tank owners/operators that completed the Kentucky Tank Operator Online Learning System (KY TOOLS) training. Percentage of underground storage tank owner/operators in compliance with the requirement to have Designated Compliance Managers. Number and percentage of solid waste sites complying with KRS 224.43-500, including those solid waste sites required to submit the Environmental Remediation Fee.
Division of Waste Management Mission Statement
“Preserve and restore Kentucky’s land through the development and implementation of fair, equitable, and effective waste
management programs.”
FY 2017 ANNUAL REPORT DIVISION OF WASTE MANAGEMENT
4
The percentage of authorized hazardous waste facilities in compliance. The percentage of registered underground storage tanks in compliance. Number of facility inspections completed by staff to ensure regulatory compliance.
Action 1.2.1: Utilize KY TOOLS as the program for UST Operator Certification in accordance with the federal Energy Policy Act. KY TOOLS has implemented a site-specific approach to training and testing to support certification which will significantly aid in increased overall compliance and leak prevention. Action 1.2.2: Maintain and enhance TEMPO reporting to accurately track and report on measures. Action 1.2.3: Inspect regulated sites at established intervals to facilitate and ensure compliance with agency requirements. Action 1.2.4: Take enforcement action on regulated sites as necessary to facilitate and achieve compliance with agency requirements.
Tactic 1.3: Review and revise quality assurance documents annually and update as necessary.
Measures: Number of Standard Operating Procedures and guidance documents developed or revised in the current fiscal year. Number of Quality Assurance Project Plans developed or revised in the current fiscal year.
Action 1.3.1: Develop and revise standard operating procedures that comply with state and federal requirements, and agency policy. Action 1.3.2: Revise Quality Assurance Annual Report. Action 1.3.3: Prepare the division annual report and update the Strategic Operational Plan. Action 1.3.4: Develop and revise Quality Assurance Project Plans as necessary.
Tactic 1.4: Ensure waste management programs are fiscally and administratively viable.
Measures: The division staffing levels as compared to cap and budgeted amounts. Number of grant programs administered and completed.
Action 1.4.1: Prepare the division budget for the state fiscal year. Action 1.4.2: Communicate and coordinate with DEP budget staff on the needs of the division. Action 1.4.3: Track expenditures and receipts to ensure programs are within designated budgetary amounts. Action 1.4.4: Implement cabinet, DEP and the division’s operational, personnel, and human resource policies and procedures. Action 1.4.5: Monitor staffing levels and ensure timely processing of personnel actions. Action 1.4.6: Educate division staff on cabinet, DEP, and division policies. Action 1.4.7: Track grants programs and ensure grant programs are meeting expectations. Action 1.4.8: Ensure accurate and timely data entry and reporting.
Objective 2 - Ensure permits are protective of human health and Kentucky’s land resources.

FY 2017 ANNUAL REPORT DIVISION OF WASTE MANAGEMENT
5
Tactic 2.1: Issue appropriate, lawful permits in a timely manner.
Measures: Number of hazardous waste permit applications received. Number of hazardous waste permits pending review. Percentage of hazardous waste permit reviews completed within regulatory timeframes. Number of solid and special waste permit applications received by type. Number of solid and special waste permits pending review. Number and percentage of solid and special waste permit reviews completed within regulatory timeframes. Number of training classes completed by DWM staff.
Action 2.1.1: Issue permitting actions that are inclusive of all federal and state regulatory requirements.
Action 2.1.2: Issue permitting actions within the regulatory timeframes. Action 2.1.3: Utilize TEMPO to accurately track and report on permitting actions. Action 2.1.4: Evaluate and implement streamlining opportunities to address procedural and institutional inefficiencies. Action 2.1.5: Allocate staff as necessary to assist in data entry and permit review. Action 2.1.6: Recruit qualified staff. Action 2.1.7: Provide training to increase knowledge and enhance retention of qualified staff.
Tactic 2.2: Reduce, eliminate, and maintain zero permit and permit activity backlogs.
Measures: Number of hazardous waste permits pending review outside regulatory timeframes. Percentage of hazardous waste permit reviews completed outside regulatory timeframes. Number and percentage of solid and special waste permits pending review outside regulatory timeframes. Number and percentage of solid and special waste permit reviews completed outside regulatory timeframes.
Action 2.2.1: Obtain a zero backlog on all remaining applications beyond regulatory time frames. Action 2.2.2: Allocate staff as necessary to assist with data entry and permit review.
Objective 3 - Ensure remedial investigation, restoration, and management in place decisions are site specific, risk based, and environmental performance standards prone.
Tactic 3.1: Restore sites or manage contamination at sites with known or suspected releases to soil or groundwater.
Measures: The number of sites with known or suspected releases with potential human exposures where no further action is required or otherwise controlled as a result of implementing a management in place technique: Number of underground storage tank cleanups conducted that resulted in a no further action being issued and number remaining.

FY 2017 ANNUAL REPORT DIVISION OF WASTE MANAGEMENT
6
Number of hazardous waste program corrective actions completed and number remaining. Number of EPA indicators corrective action measures achieved. Number of historic landfills remediated and number remaining. Number of historic landfills with on-going remediation projects. Number of solid and special waste facilities in groundwater assessment. Number of illegal open dumps remediated under the Kentucky PRIDE Program and number remaining. Number of tire dumps remediated under the Waste Tire Trust Fund and number remaining. Number of new Superfund sites. Number of PRP-Lead State Superfund sites under review and number remediated. Number of State-Lead sites that require remediation, number remediated utilizing the Hazardous Waste Management Fund, and number under review. Number of sites with a release of petroleum or a petroleum product remediated from a source other than a petroleum storage tank and number under review. Number of methamphetamine contaminated properties reported and number decontaminated. Number of emergency or incident responses made and number of cases closed.
Action 3.1.1: Identify resource and program constraints hindering achievement of our measures; pursue program changes and request funding as necessary in budget. At a minimum, work to maintain current level of funding in cleanup programs. Action 3.1.2: Provide technical oversight and directives for projects to investigate, remediate, manage, or restore properties with contamination. Action 3.1.3: Review analytical and reporting data for projects. Action 3.1.4: Issue letters upon the completion of all corrective actions for facilities. Action 3.1.5: Inventory the list of sites with known or suspected contamination.
Tactic 3.2: Plan, design and execute Final Closure Period activities at Maxey Flats while maintaining regulatory compliance.
Measures: Substantial completion of final cap construction by October 2016. Complete Institutional Control Period Work Plan by October 2017.
Action 3.2.1: Complete construction of final cap. Action 3.2.2: Review weekly and monthly reports from contractors to determine necessary activities for closure. Action 3.2.3: Attend weekly and monthly meetings to discuss progress on final closure activities. Action 3.2.4: Prepare Institutional Control Period Work Plan to ensure compliance and maintenance and monitoring activities beyond the final cap completion. Action 3.2.5: Attend weekly and monthly meetings with regulatory agencies involved in the collaborative compilation of the Institutional Control Period Work Plan.
Objective 4 - Support and encourage economic redevelopment of property with real or perceived contamination.

FY 2017 ANNUAL REPORT DIVISION OF WASTE MANAGEMENT
7
Tactic 4.1: Provide oversight to the investigation, remediation, management, or redevelopment of properties with real or perceived contamination.
Measures: Number of sites under review pursuant to the Voluntary Environmental Remediation Program. Number of brownfield sites assessed under the Targeted Brownfield Assessment Program and number awaiting review. Number of KRS 224.01-415 Brownfields Redevelopment Program applications received, number of eligibility letters issued, number of concurrence letters issued.
Action 4.1.1: Review project data and determine compliance with program requirements. Action 4.1.2: Issue notices and letters for projects in accordance with regulatory guidelines.
Objective 5 - Minimize waste generation and disposal.
Tactic 5.1: Assure proper management and disposal of waste.
Measures: The compliance rate for authorized solid waste management facilities. The amount, by weight, of litter, open dump waste, and household hazardous waste collected by counties through the Kentucky Pride program.
Action 5.1.1: Inspect regulated sites at established intervals to facilitate and ensure compliance with agency requirements. Action 5.1.2: Increase communications between permitting central office staff and field operations staff.
Objective 6 - Encourage beneficial reuse and recycling.
Tactic 6.1: Encourage reduced waste generation and disposal by promoting beneficial reuse, recycling, waste minimization, and pollution prevention.
Measures: Tonnage of municipal solid waste recycled or reused-by type. Tonnage of material recycled through the State Government Recycling Program. Tonnage of solid or special waste used as Alternate Daily Cover (ADC). Percentage of solid or special waste used as Alternate Daily Cover (ADC). Number of waste tires used in tire-derived fuel projects, crumb rubber grants and other beneficial reuse purposes as a percentage of number of tires generated. Number of recycling grants and total amount of funding administered.
Action 6.1.1: Maintain and enhance TEMPO reporting or other databases to accurately track and report on measures. Action 6.1.2: Provide education and outreach for recycling opportunities. Action 6.1.3: Update recycling fact sheets as more current information is available. Action 6.1.4: Administer grant programs in accordance with regulatory requirements. Action 6.1.4: Publish The Marketplace for Recycling Commodities newsletter. Action 6.1.5: Identify resource and program constraints hindering achievement of measures; pursue program changes and request funding as necessary in budget.
FY 2017 ANNUAL REPORT DIVISION OF WASTE MANAGEMENT
8
PROGRAM, PLANNING & ADMINISTRATION
waste.ky.gov/PPA
The mission of the Program Planning and Administration (PPA) Branch is to provide administrative and operational support to all branches in the division through efficient and effective financial administration, personnel management, and regulatory development.
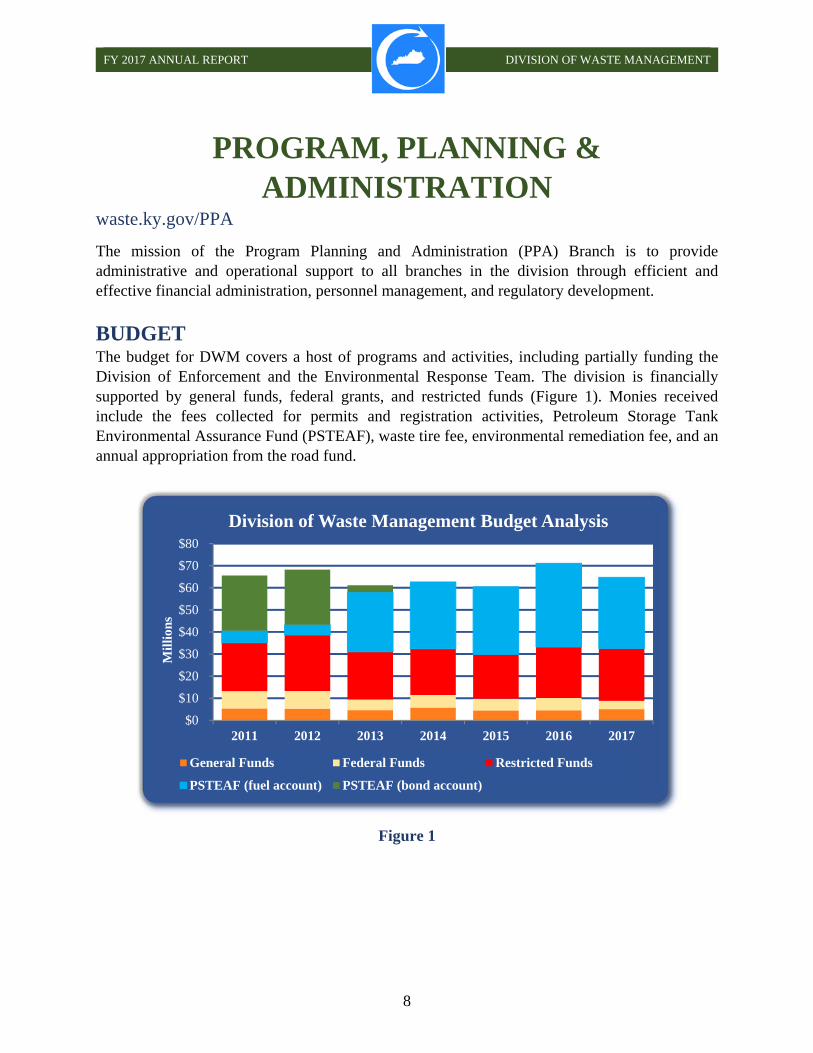
BUDGET The budget for DWM covers a host of programs and activities, including partially funding the Division of Enforcement and the Environmental Response Team. The division is financially supported by general funds, federal grants, and restricted funds (Figure 1). Monies received include the fees collected for permits and registration activities, Petroleum Storage Tank Environmental Assurance Fund (PSTEAF), waste tire fee, environmental remediation fee, and an annual appropriation from the road fund.
Figure 1
$0
$10
$20
$30
$40
$50
$60
$70
$80
2011 2012 2013 2014 2015 2016 2017
Mil
lion
s
Division of Waste Management Budget Analysis
General Funds Federal Funds Restricted Funds
PSTEAF (fuel account) PSTEAF (bond account)

FY 2017 ANNUAL REPORT DIVISION OF WASTE MANAGEMENT
9
The DWM had the budget to employ 236 full-time permanent employees in FY17 (Figure 2). While the number of funded positions decreased significantly in 2014, funded positions have remained relatively unchanged since then. However, the previous reductions in personnel continue to challenge the division to evaluate program priorities and to identify efficiencies (Figure 3).
Figure 2
Figure 3
253
250
239
237 236 236 236
225
230
235
240
245
250
255
2012 2013 2014 2015 2016 2017 2018
Division of Waste Management Funded Positions
17% 17% 21% 22%
11% 10%
2%
0%
5%
10%
15%
20%
25%
0-5 YRS 5-10 YRS 10-15 YRS 15-20 YRS 20-25 YRS 25-30 YRS 30+ YRS
Employee Years of Service by Percent
FY 2017 ANNUAL REPORT DIVISION OF WASTE MANAGEMENT
10
PROJECT ADMINISTRATION SECTION
The Project Administration Section performs the division’s procurement, contract administration, and grant management. This section also manages the division’s accounts payable functions and payment processing for major fee-supported programs. This section typically manages a number of personal service contracts, memoranda of agreements with other government entities, and the solicitation and contracting for necessary goods and services. In FY17, the division issued a request for proposals (RFP), which was awarded to Advanced Technologies and Laboratories International, Inc., for radiological data validation services in response to Technically Enhance Naturally Occurring Radioactive Materials (TENORM) discovered at two Kentucky landfills. An RFP was also issued and subsequently awarded to Liberty Tire Recycling, through the Finance and Administration Cabinet Office of Procurement Services, for the collection and hauling services under the division’s Waste Tire Amnesty Program. A number of other notable purchases were made during the year for equipment that will be used during the Institutional Control Period (ICP) at the Maxey Flats Disposal Facility. This included a John Deere 6120CM Cab Tractor with several attachments that will allow the division to perform routine maintenance activities on site. Many of the division’s programs are completely supported by federal funds, while others are only partially supported or not supported by federal funds at all. Currently, DWM receives funding from a total of 14 federal grants and cooperative agreements. This financial support includes:
• The Assembled Chemical Weapons Alternative (ACWA) Grant from the U.S. Department of Defense (DoD) provides financial support for the division’s efforts to ensure the compliance with storage regulations; review, to amend and approve permit applications; to keep stakeholders and the community informed; and to ensure compliance during construction and operation of the Bluegrass Chemical Agent-Destruction Pilot Plant (BGCAPP) and the Explosive Destruction Technology (EDT) facility.
• The Agreement in Principle (AIP) with the U.S. Department of Energy (DOE)
funding allows DWM to conduct independent and impartial assessments of potential environmental impacts of DOE activities at the Paducah Gaseous Diffusion Plant (PDGP). Through the support of the agreement, DWM is able to manage independent environmental monitoring and research. These funds also allow DWM to enhance communications with concerned citizens.
• The Federal Facilities Agreement (FFA), a three-party agreement between DOE, EPA, and Kentucky, was developed to ensure compliance with and avoid duplication between the corrective action provisions of the Resource Conservation and Recovery Act (RCRA) permitting program and the corrective action

FY 2017 ANNUAL REPORT DIVISION OF WASTE MANAGEMENT
11
requirements under CERCLA at the PGDP site. The FFA outlines regulatory structure and guides interactions between the three parties.
• Under Section 128(a) of the Comprehensive Environmental Response,
Compensation and Liability Act (CERCLA), the U.S. Environmental Protection Agency (EPA) provides financial support to the Brownfield Redevelopment Program to address the assessment, cleanup, and redevelopment of brownfield sites.
• The Department of Defense and State Memorandum of Agreement (DSMOA) provides funding to improve communication, coordination, and cooperation between DoD and DWM in providing protection of human health and the environment on DoD installations in Kentucky. The DSMOA program ensures environmental restoration at DoD installations occurs consistent with state and federal law.
• The Five-Year Review Cooperative Agreement (FYR) provides funding from the EPA to the Superfund Program to perform five-year reviews of remedial action at National Priority List Sites (NPLs) in Kentucky. The purpose of a five-year review is to determine whether a site’s ongoing or completed remedial actions will remain protective of human health and the environment.
• The Support Agency Cooperative Agreement (SACA) provides additional financial support to the Superfund Program to perform five-year reviews of remedial action at National Priority List Sites (NPLs) in Kentucky.
• With financial support from the Preliminary Assessment/Site Investigation Cooperative Agreement (PASI), the Superfund Program assists the EPA with the evaluation of sites with known or suspected releases of hazardous substances, pollutants, or contaminants. Under PASI, DWM assists the EPA through all aspects of the site assessment process and helps identify candidate sites for the NPL list. The NPL list consists of CERCLA sites that represent the most significant risk to human health and the environment.
• The Brownfields Assessment and Cleanup Grant (BAG) from the U.S. Environmental Protection Agency (EPA) provides funding to communities that wish to address brownfield properties in order to protect and or improve water resources. This grant was designed to target rural areas impacted by coal mining, but it may also be used to assess approved sites throughout the commonwealth.
• Financial assistance from the Core Program Cooperative Agreement (CORE) helps
the division’s Superfund Program carry out its activities and responsibilities under CERCLA. Furthermore, the CORE grant supports DWM in identifying, investigating, and addressing environmentally contaminated sites under CERCLA.

FY 2017 ANNUAL REPORT DIVISION OF WASTE MANAGEMENT
12
• The Leaking Underground Storage Tank (LUST) Cleanup Cooperative Agreement with the EPA provides financial assistance to the Underground Storage Tank (UST) program to oversee the cleanup of leaking underground storage tanks by responsible parties and to ensure the cleanup at sites where an owner or operator is unwilling or unable to take necessary corrective action.
• The LUST Prevention Assistance Agreement with the EPA provides financial
support for the development, implementation, and maintenance of the UST program as well as financial support for the detection and prevention, of leaking USTs in Kentucky.
• The Resource Conservation and Recovery Grant (RCRA) provides the division’s
Hazardous Waste Management Program with the financial support necessary to implement RCRA permitting, corrective action, closure, compliance, and enforcement in accordance with the EPA’s performance expectations.
• The EPA’s Toxic Substances Control Act (TSCA) Compliance Monitoring
Cooperative Agreement provides financial support to the division to implement the polychlorinated biphenyls (PCBs) compliance monitoring program. The agreement allows the Field Operation Branch to perform PCB inspections, generate inspection reports, and track facility information in the PCB Transformer Registration Database.
PERSONNEL AND ADMINISTRATIVE SUPPORT SECTION The Personnel and Administrative Support Section performs support-related duties for the PPA Branch and DWM. These duties include the coordination and procurement of goods and services on state contracts such as office supplies, equipment, furniture, uniforms, and boots for DWM’s Central Office. This section provides support in identifying facility needs for division personnel including workspace logistics and new phone installation. Furthermore, the Personnel and Administrative Support Section is tasked with the coordination of employee training and development along with in-state and out-of-state travel logistics and reimbursement. In FY17, division personnel participated in approximately 519 trainings and development opportunities. Under new department training requirements developed in 2016, DWM employees have continued to enroll in various curricula in KELMS based upon their job function. The curricula consist of a series of required online-training modules and instructor-led courses. All DWM employees are required to complete the DEP safety training curriculum while field and technical personnel are also required to complete an additional training curriculum. Expanding on cabinet requirements, the division has also conducted training for managers and supervisors on the enhancement of performance planning as well as an update regarding new statewide hiring and selection policies.

FY 2017 ANNUAL REPORT DIVISION OF WASTE MANAGEMENT
13
This section also works closely with the Environmental Response Team (ERT) processing invoices and payments related to emergency responses and cleanups. In FY17, 27 new ERT contracts were awarded to vendors, 26 of which were done so under an emergency declaration. Moreover, this section provides support in pursuing the recovery of response costs when a viable responsible party is available. For FY17, DWM was able to recover a total of $413,625 in emergency response costs. These funds were deposited back into the Hazardous Waste Management Fund in order to be reutilized for the remediation of environmental contaminations throughout Kentucky.
PROGRAM DEVELOPMENT SECTION
The Program Development Section performs a variety of functions, such as managing (planning initiatives), supporting administrative regulation development, and coordinating the review of proposed bills during the legislative session. REGULATION DEVELOPMENT The division promulgated two regulatory packages during FY17. The coal combustion residual regulatory package, which incorporated changes from the federal rule, was filed in October of 2016 and became effective in February of this year. And the Recycling and Local Assistance Branch regulatory package, filed in May of this year, was aimed at simplifying reporting and grant administration requirements, thereby easing the administrative burden on Kentucky counties. This regulatory package is expected to become effective October 6th of this year. Amendments to administrative regulations currently in progress include filings in July of this year for the Hazardous Waste Program and a regulatory package focused on Technologically Enhanced Naturally Occurring Radioactive Materials (TENORM). LEGISLATION In 2016, Governor Matthew Bevin announced the Red Tape Reduction Initiative, aimed at consolidating and streamlining administrative regulations in Kentucky. This initiative began with reviews of all government regulations that are currently enacted. In addition, House Bill 50 (HB50) passed, and became effective June 29, 2017. HB50 causes all administrative regulations to be amended or reviewed and extended every seven years. The Division of Waste Management is in the process of streamlining and consolidating regulations in line with both the Red Tape Reduction Initiative and this HB50. During the 2017 Legislative Session, several amendments were made to KRS Chapter 224 Environmental Protection. Senate Bill 249 was a combined piece of agency cleanup legislation that served as part of the Governor’s Red Tape Reduction Initiative. This bill repealed 58 statutes and modified an additional 48. Senate Bill 248 was also passed, modifying definitions related to

FY 2017 ANNUAL REPORT DIVISION OF WASTE MANAGEMENT
14
TENORM in the Cabinet for Health and Family Services statutes, as agreed upon by our cabinet’s Oil and Gas Workgroup. REPORTS During FY17, PPA prepared the Waste Tire Trust Fund Report as mandated by KRS 224.50-872 which discussed the expenditures and revenues, effectiveness in developing markets and the fee in funding the cabinet’s implementation of the waste tire program and recommendations for improvement for Kentucky’s Waste Tire Program. Additional reports prepared included the division’s Strategic Operational Plan and mid-year status updates of planning initiatives for 2017.

FY 2017 ANNUAL REPORT DIVISION OF WASTE MANAGEMENT
15
FIELD OPERATIONS waste.ky.gov/fob
The mission of the Field Operations Branch is to identify and abate imminent threats to human health and the environment through inspections, technical assistance, and education. This branch performs inspections at sites managing solid waste, hazardous waste, USTs, and polychlorinated biphenyls (PCBs). The primary duty of a regional inspector is to inspect regulated facilities for compliance. The Field Operations Branch includes a central office and ten waste management regional offices located throughout Kentucky. The regional staff is familiar with the local waste management issues and responds to questions and concerns.
Figure 4
During FY17, the Field Operations Branch conducted 7,255 UST, solid waste, and hazardous waste inspections. This was an eight percent increase over FY16. The 3,950 UST inspections conducted in FY16 accounted for 54 percent of the total inspections. UST inspections were up eleven percent from the previous year. UST compliance rates remained
0
100
200
300
400
500
600
700
800
Jul-
16
Aug
-16
Sep
-16
Oct
-16
Nov
-16
Dec
-16
Jan-
17
Feb
-17
Mar
-17
Ap
r-17
May
-17
Jun
-17
DWM Inspections
Underground Storage Tank Hazardous Waste Solid Waste

FY 2017 ANNUAL REPORT DIVISION OF WASTE MANAGEMENT
16
the same as the previous year at 52 percent. UST Notices of Violations declined from FY16 by seven percent. The increase in compliance rates can be attributed in part to awareness with the new regulations which incorporated provisions of the Energy Policy Act of 2005. Field operations conducted 1,722 solid waste inspections in FY17. This is a five percent increase from the previous year. The compliance rate for solid waste facilities was at 69 percent. Compliance rates increased by one percent from FY16. Field operations conducted 1,533 hazardous waste inspections in FY17, an increase of one percent from the previous year. The compliance rate for hazardous waste facilities totaled at 83 percent. Compliance rates increased one percent from FY16. Field operations conducted 2,199 complaint investigations in FY17; a nine percent increase from FY16. FY17 led to a seven percent increase for inspections and investigations from the previous year, with a total of 9,454.
Figure 5
Note: “Compliance Rate” means the percent of total inspections where an inspector noted that no violation had
occurred. This does not include investigations triggered by citizen complaints.
“UST TCI” means a technical compliance inspection for a site’s USTs.
0%
10%
20%
30%
40%
50%
60%
70%
80%
90%
100%
Jul-
16
Au
g-16
Sep
-16
Oct
-16
Nov
-16
Dec
-16
Jan
-17
Feb
-17
Mar
-17
Ap
r-17
May
-17
Jun
-17
DWM Inspection Compliance Rates
Solid Waste UST TCI Hazardous Waste

FY 2017 ANNUAL REPORT DIVISION OF WASTE MANAGEMENT
17
FIELD OPERATIONS BRANCH
Blue Grass Army Depot by Daniel Walker
The Field Operations Branch of the Division of Waste Management maintains a satellite office for DWM staff. It is tasked with overseeing the division’s interests at Blue Grass Army Depot (BGAD). The Richmond Satellite Office (RSO) staff has a variety of duties in addition to performing compliance inspections and responding to incidents. The inspectors’ responsibilities consist of providing counsel to the division’s dedicated BGAD Permitting Section as the section reviews various permits and modifications. The inspectors’ proximity to the site and its stakeholders has elevated effectiveness as the eyes and ears of the division. This will increasingly improve throughout the coming years as the inspectors will take occupancy of an on-site office space with CCTV and radio access to supplement oversight of the chemical demilitarization facility.
RSO staff members conduct recurring scheduled meetings with the Bechtel Parsons Blue Grass (BPBG) Environmental team to discuss systemization activities currently taking place, design modifications that have environmental significance, and track outstanding items requiring resolution. The relationship is one of transparency where the facility representatives willingly convey environmental concerns to the inspectors and discuss solutions together under the guidance of the RCRA regulations. The RSO staff has completed over 200 hours of main plant, systems, and refresher training alongside the facility workers. An additional 100 hours of training will occur when the federal government determines a strategy for the Static Detonation Chamber to destroy the mustard agent portion of the stockpile. Blue Grass Chemical Agent-Destruction Pilot Plant (BGCAPP) systemization is over 80 percent complete with operations anticipated to commence in 2019.
BGAD aerial view. Photo by Assembled Chemical Weapons Alternative

FY 2017 ANNUAL REPORT DIVISION OF WASTE MANAGEMENT
18
This year, the RSO staff has tracked three separate chemical agent leakers; one GB (NATO designation for sarin gas) rocket, one GB projectile, and one mustard projectile. This staff has also participated in the Chemical Accident/Incident Response and Assistance (CAIRA) exercises from the BGAD Emergency Operations Center (EOC). In May, representatives from the RSO attended a global demilitarization symposium in Pennsylvania for the demilitarization of conventional munitions. There are plans to visit the BGCAPP sister site Pueblo Chemical Agent-Destruction Pilot Plant (PCAPP) in early 2018 to view the facility and to discuss accomplished experiences with the Colorado Department of Public Health and Environment (CDPHE) regulators.
Enhanced on-site container (EONC) practice run. Munitions stored in EONCs for transport from Chemical Limited Area to Container Handling Building.
Photo by ACWA.
FY 2017 ANNUAL REPORT DIVISION OF WASTE MANAGEMENT
19
HAZARDOUS WASTE waste.ky.gov/hwb
The Hazardous Waste Branch oversees the management of hazardous waste from generation to disposal. This involves the promotion of hazardous waste minimization and hazardous waste management, and remediation of hazardous waste releases. These activities are accomplished through permitting, corrective action (cleanup), registration, and reporting requirements.
Hazardous Waste Corrective Actions The Corrective Action Section completed several significant activities of interest during FY17. Through many years of work, all state-lead sites have now attained the “Human Exposures Controlled” and “Groundwater Releases Controlled” Environmental Indicators (EI) designation; two measures of progress tracked by the U.S. Environmental Protection Agency (EPA) and Congress. DWM has also continued to make progress in meeting the other two EIs currently tracked, CA550 “Remedy Constructed” and CA900 “Performance Standards Attained”. This section has continued to meet or exceed EPA progress goals for EI’s determinations, groundwater monitoring system inspections, renewal and issuance of post-closure permits, and the review of work plans and reports. ENVIRONMENTAL INDICATORS DETERMINATIONS COMPLETED In FY17, 12 EIs were completed, and six CA550s Remedy Constructed were achieved and documented. These included the Corning (Harrodsburg), Kentucky Electric Steel, Monument Chemical, Rohm and Haas (Dow), Safety Kleen (Lexington) and YKK facilities. In addition, six CA900s, Performance Standards Attained, were completed during this fiscal year, including the Ashland Route 23, Florida Tile, General Electric Appliance Park, Kosmos, and Wald facilities. GROUNDWATER MONITORING SYSTEM EVALUATIONS CONDUCTED Evaluations were conducted during FY17 on 14 groundwater monitoring systems. Operations and Maintenance (OAMs) inspections were conducted at these sites: ARCO, Arkema, Chemours, Continental Refining, Corning (formerly Philips), Dunaway Timber, Federal Mogul, Fort Campbell, Fort Knox, Gates, PMC Organometallix, Pregis, and Safety Kleen (Smithfield). No significant problems were identified during these inspections. POST-CLOSURE PERMITS REVIEWED/RENEWED/ISSUED/ TERMINATED Corrective Action Section personnel issued two notices of deficiencies for post closure permit renewals for the Wald and Lexmark facilities.

FY 2017 ANNUAL REPORT DIVISION OF WASTE MANAGEMENT
20
INVESTIGATION AND REMEDIATION WORK PLANS AND REPORTS FOUND DEFICIENT OR
APPROVED During FY17, eight investigation related activities were conducted or approved for projects. Fifteen interim measures related activities and two corrective measures studies activities were conducted or approved. A total of 19 monitoring reports were reviewed, and five miscellaneous activities were conducted or approved. This section also completed numerous other miscellaneous activities such as maintaining Formerly Used Defense Sites and non-notifier sites. This section maintained environmental covenant (EC) related activities, including annual inspections and revisions to ECs, conducted contained-in determinations, and participated in public meetings.
Of particular note during the first half of 2017 was the completion of remedial measures related to the former Philips site in Danville. Contamination from the site had impacted a tributary to Clark’s Run and its adjacent banks and wetlands. To further complicate matters, the stream was adjacent to a railroad embankment, traversed under railways, and transected a closed municipal landfill. Approximately 4,100 feet of drainage and stream was remediated. The area of wetland and streambank that was remediated included approximately 547,000 square feet of land (12.5 acres). This necessitated soil and sediment excavation, reestablishment of stream features, and planting of native vegetation. HAZARDOUS WASTE PERMITTING
The total number of pending permit applications remained steady (Figure 6). At the end of FY17, four hazardous waste permits were pending review within the regulatory timeframe; eight hazardous waste permits were pending review that had exceeded the regulatory timeframe. Permits or modifications were issued to Blue Grass Army Depot, Luvata Franklin, PMC Organometallix, and the Paducah Gaseous Diffusion Plant in FY17.
Figure 6
0
2
4
6
8
10
12
14
16
Jul-
16
Aug
-16
Sep
-16
Oct
-16
Nov
-16
Dec
-16
Jan-
17
Feb
-17
Mar
-17
Ap
r-17
May
-17
Jun
-17
Hazardous Waste Permits Pending Review
Within Regulatory Timeframe Exceeding Regulatory Timeframe
FY 2017 ANNUAL REPORT DIVISION OF WASTE MANAGEMENT
21
HAZARDOUS WASTE BRANCH
Hazardous Waste Regulations By Heather Alexander
The Hazardous Waste Branch and the Program Planning and Administration Branch have completed a comprehensive review and revision of the Kentucky hazardous waste administrative regulations, known to many as RCRA (Resource Conservation and Recovery Act). These draft administrative regulations, 401 KAR Chapters 31 through 40, 43 and 44 and 410 KAR Chapter 1, were filed with the Legislative Research Commission on July 13, 2017. These administrative regulations are currently divided into 166 different regulations within twelve different chapters. This draft package has been reduced to five regulations in one chapter. Most of the hazardous waste program will not change, only the regulation formatting will change. A brief summary of the notable changes under consideration include:
Transporters would be charged a registration fee, and Federal forms would be used along with Kentucky addendum forms for some of
the required paperwork.

FY 2017 ANNUAL REPORT DIVISION OF WASTE MANAGEMENT
22
RECYCLING & LOCAL ASSISTANCE waste.ky.gov/rla
The Recycling and Local Assistance (RLA) Branch provides technical and financial assistance, as well as, training to public and private entities on solid waste and recycling, while promoting individual responsibility and accountability for proper solid waste management. In accordance with KRS 224.43-315, recyclers are required to report annually to their counties the amount of municipal solid waste collected for recycling by volume, weight, or number of items, and the type of items recycled. Data received for the 2016 report year showed a statewide recycling rate of 37.2 percent, which is a small decrease from 37.9 percent in 2015 (Figure 7). This fluctuation could be due to market forces (low commodity prices), or simply reflect minor inconsistencies in data collection and reporting methodologies from year-to-year. This branch relies on individual counties and recycling operations to report accurate data. A strong effort to confirm and cross check these numbers, ensures that entities are consistent and uniform data generation.
Figure 7
Although there is a significant year-to-year fluctuation in the reported volumes of individual commodities (2016 showed an increase in sorted office paper and steel cans, while mixed paper and non-ferrous metals decreased), the overall recycling rate in Kentucky and nationally has been comparatively flat in the 35 to 40 percent range in recent years.
0%
5%
10%
15%
20%
25%
30%
35%
40%
0
500,000
1,000,000
1,500,000
2,000,000
2,500,000
3,000,000
2007 2008 2009 2010 2011 2012 2013 2014 2015 2016
Kentucky Tons Recycled
Tons Recycled Percentage of Total Waste Recycled

FY 2017 ANNUAL REPORT DIVISION OF WASTE MANAGEMENT
23
THE STATE OFFICE PAPER RECYCLING PROGRAM The Government Recycling Section continues to operate the State Office Paper Recycling Program, serving more than 115 agencies in Frankfort. The program offers free pickup and document destruction of governmental office paper. Their location on Northgate Drive in Frankfort offers a secure environment to ensure proper processing of confidential documents. Office paper represents 80 percent of the waste stream in the office environment. Since 2006, state employees have recycled more than 16,240 tons of waste paper, generating approximately $3.25 million in revenue. In 2016, state employees recycled 1,184 tons of waste paper, an average of approximately 183 pounds per state employee; a slight decrease in revenue in 2016 (Figure 8).
Figure 8
$0
$50
$100
$150
$200
$250
$300
$350
$400
0
200
400
600
800
1,000
1,200
1,400
1,600
1,800
2007 2008 2009 2010 2011 2012 2013 2014 2015 2016
Rev
enu
e (T
hou
san
ds)
Ton
s
State Office Paper Recycling Totals
Total Tons of Recycled Paper Revenue
Kentucky Government Recycling Center in Frankfort Bales of recycled paper. Photo by John W. Brown
FY 2017 ANNUAL REPORT DIVISION OF WASTE MANAGEMENT
24
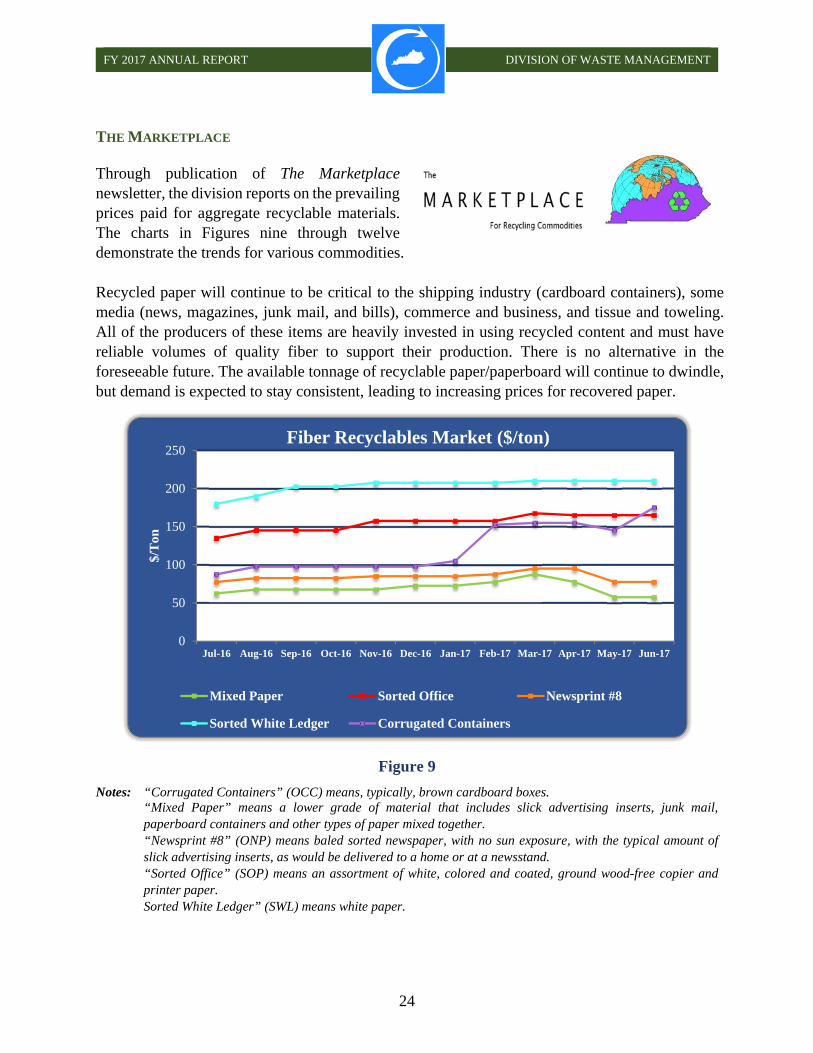
THE MARKETPLACE Through publication of The Marketplace newsletter, the division reports on the prevailing prices paid for aggregate recyclable materials. The charts in Figures nine through twelve demonstrate the trends for various commodities. Recycled paper will continue to be critical to the shipping industry (cardboard containers), some media (news, magazines, junk mail, and bills), commerce and business, and tissue and toweling. All of the producers of these items are heavily invested in using recycled content and must have reliable volumes of quality fiber to support their production. There is no alternative in the foreseeable future. The available tonnage of recyclable paper/paperboard will continue to dwindle, but demand is expected to stay consistent, leading to increasing prices for recovered paper.
Figure 9
Notes: “Corrugated Containers” (OCC) means, typically, brown cardboard boxes. “Mixed Paper” means a lower grade of material that includes slick advertising inserts, junk mail,
paperboard containers and other types of paper mixed together. “Newsprint #8” (ONP) means baled sorted newspaper, with no sun exposure, with the typical amount of
slick advertising inserts, as would be delivered to a home or at a newsstand. “Sorted Office” (SOP) means an assortment of white, colored and coated, ground wood-free copier and
printer paper. Sorted White Ledger” (SWL) means white paper.
0
50
100
150
200
250
Jul-16 Aug-16 Sep-16 Oct-16 Nov-16 Dec-16 Jan-17 Feb-17 Mar-17 Apr-17 May-17 Jun-17
$/T
on
Fiber Recyclables Market ($/ton)
Mixed Paper Sorted Office Newsprint #8
Sorted White Ledger Corrugated Containers
FY 2017 ANNUAL REPORT DIVISION OF WASTE MANAGEMENT
25
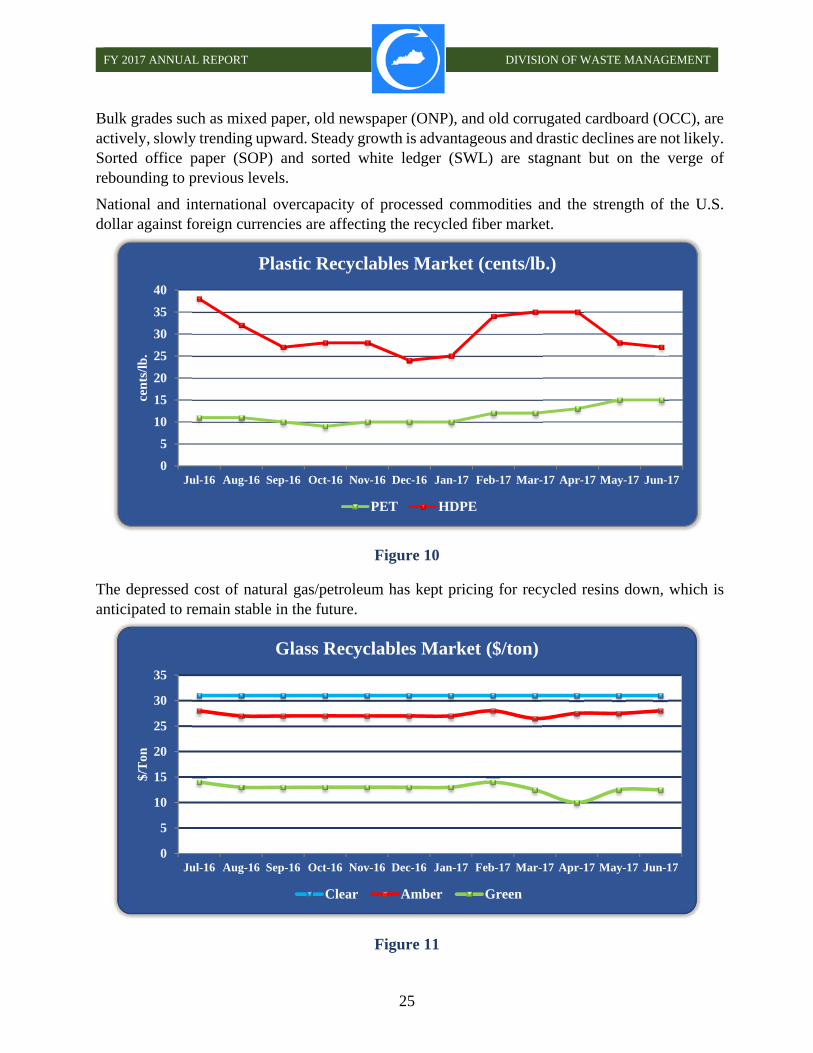
Bulk grades such as mixed paper, old newspaper (ONP), and old corrugated cardboard (OCC), are actively, slowly trending upward. Steady growth is advantageous and drastic declines are not likely. Sorted office paper (SOP) and sorted white ledger (SWL) are stagnant but on the verge of rebounding to previous levels.
National and international overcapacity of processed commodities and the strength of the U.S. dollar against foreign currencies are affecting the recycled fiber market.
Figure 10
The depressed cost of natural gas/petroleum has kept pricing for recycled resins down, which is anticipated to remain stable in the future.
Figure 11
0
5
10
15
20
25
30
35
40
Jul-16 Aug-16 Sep-16 Oct-16 Nov-16 Dec-16 Jan-17 Feb-17 Mar-17 Apr-17 May-17 Jun-17
cen
ts/l
b.
Plastic Recyclables Market (cents/lb.)
PET HDPE
0
5
10
15
20
25
30
35
Jul-16 Aug-16 Sep-16 Oct-16 Nov-16 Dec-16 Jan-17 Feb-17 Mar-17 Apr-17 May-17 Jun-17
$/T
on
Glass Recyclables Market ($/ton)
Clear Amber Green
FY 2017 ANNUAL REPORT DIVISION OF WASTE MANAGEMENT
26
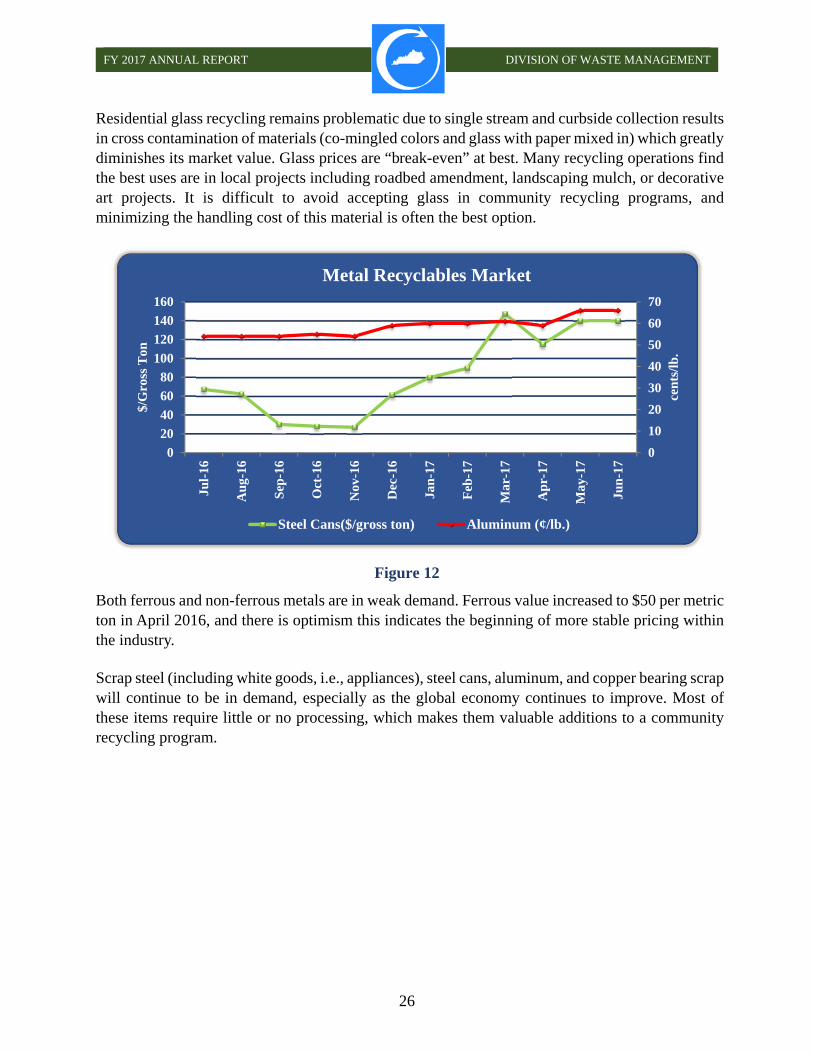
Residential glass recycling remains problematic due to single stream and curbside collection results in cross contamination of materials (co-mingled colors and glass with paper mixed in) which greatly diminishes its market value. Glass prices are “break-even” at best. Many recycling operations find the best uses are in local projects including roadbed amendment, landscaping mulch, or decorative art projects. It is difficult to avoid accepting glass in community recycling programs, and minimizing the handling cost of this material is often the best option.
Figure 12
Both ferrous and non-ferrous metals are in weak demand. Ferrous value increased to $50 per metric ton in April 2016, and there is optimism this indicates the beginning of more stable pricing within the industry. Scrap steel (including white goods, i.e., appliances), steel cans, aluminum, and copper bearing scrap will continue to be in demand, especially as the global economy continues to improve. Most of these items require little or no processing, which makes them valuable additions to a community recycling program.
0
10
20
30
40
50
60
70
0
20
40
60
80
100
120
140
160
Jul-
16
Aug
-16
Sep
-16
Oct
-16
Nov
-16
Dec
-16
Jan-
17
Feb
-17
Mar
-17
Ap
r-17
May
-17
Jun
-17
cen
ts/l
b.
$/G
ross
Ton
Metal Recyclables Market
Steel Cans($/gross ton) Aluminum (¢/lb.)
FY 2017 ANNUAL REPORT DIVISION OF WASTE MANAGEMENT
27
WASTE TIRE TRUST FUND
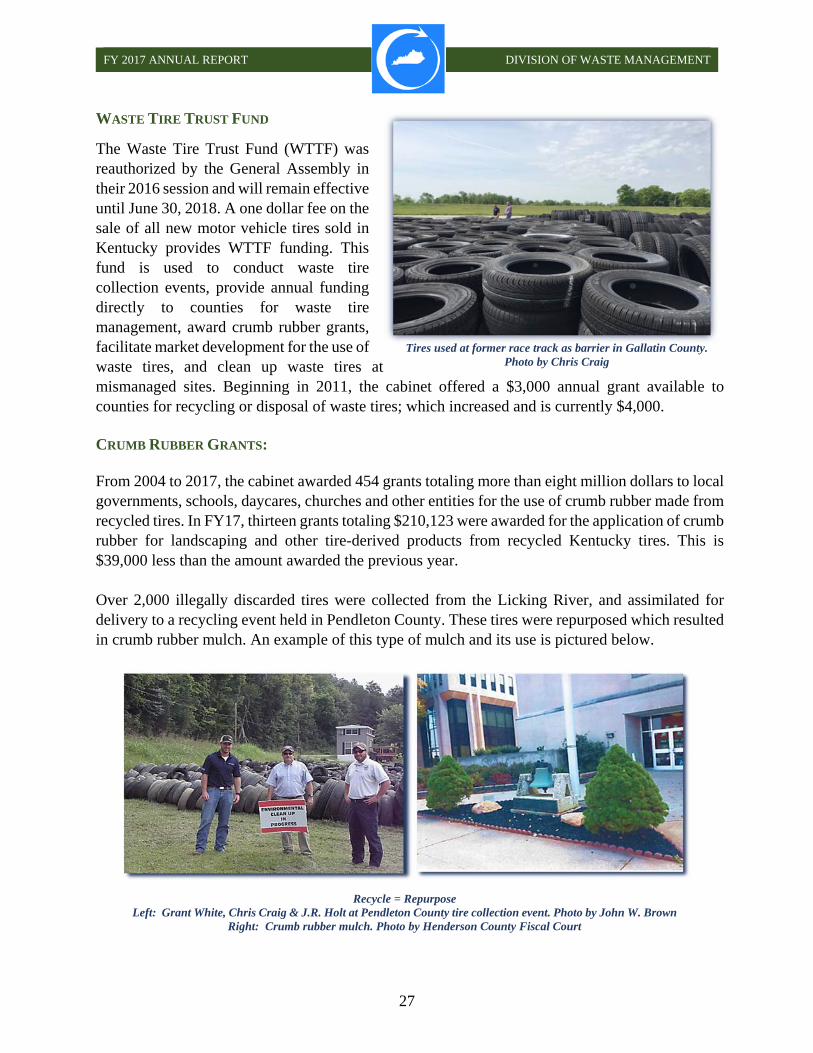
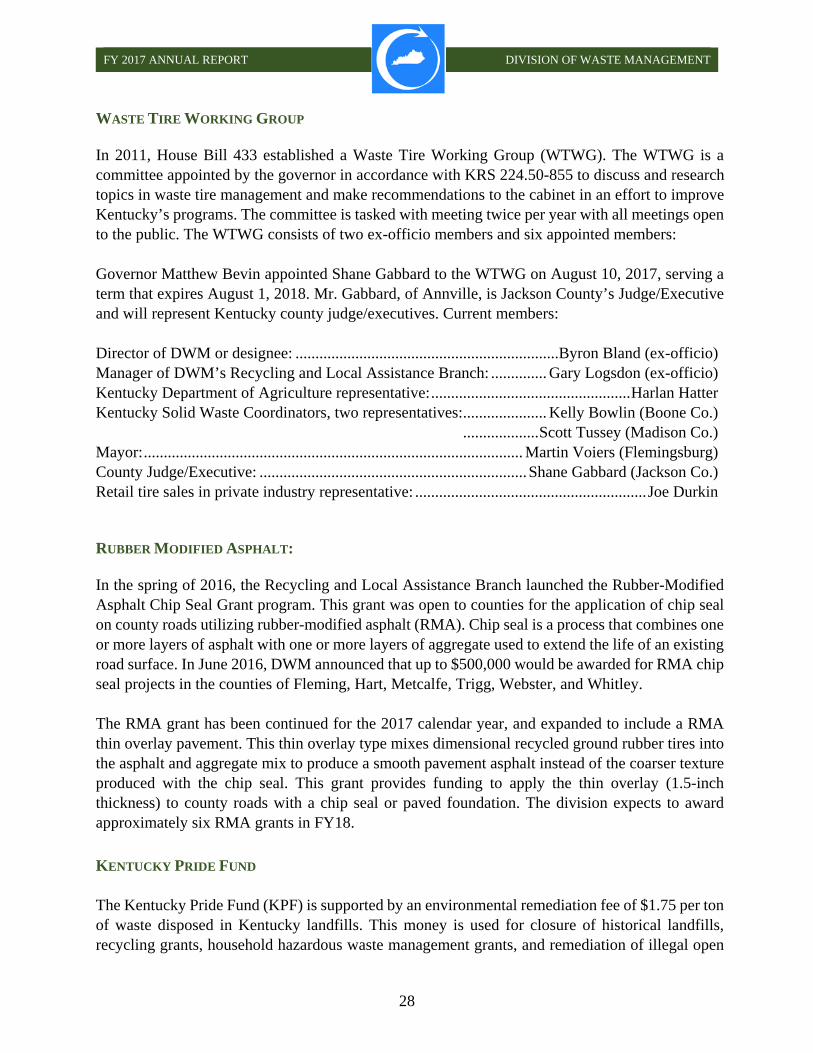
The Waste Tire Trust Fund (WTTF) was reauthorized by the General Assembly in their 2016 session and will remain effective until June 30, 2018. A one dollar fee on the sale of all new motor vehicle tires sold in Kentucky provides WTTF funding. This fund is used to conduct waste tire collection events, provide annual funding directly to counties for waste tire management, award crumb rubber grants, facilitate market development for the use of waste tires, and clean up waste tires at mismanaged sites. Beginning in 2011, the cabinet offered a $3,000 annual grant available to counties for recycling or disposal of waste tires; which increased and is currently $4,000. CRUMB RUBBER GRANTS: From 2004 to 2017, the cabinet awarded 454 grants totaling more than eight million dollars to local governments, schools, daycares, churches and other entities for the use of crumb rubber made from recycled tires. In FY17, thirteen grants totaling $210,123 were awarded for the application of crumb rubber for landscaping and other tire-derived products from recycled Kentucky tires. This is $39,000 less than the amount awarded the previous year. Over 2,000 illegally discarded tires were collected from the Licking River, and assimilated for delivery to a recycling event held in Pendleton County. These tires were repurposed which resulted in crumb rubber mulch. An example of this type of mulch and its use is pictured below.
Tires used at former race track as barrier in Gallatin County. Photo by Chris Craig
Recycle = Repurpose Left: Grant White, Chris Craig & J.R. Holt at Pendleton County tire collection event. Photo by John W. Brown
Right: Crumb rubber mulch. Photo by Henderson County Fiscal Court
FY 2017 ANNUAL REPORT DIVISION OF WASTE MANAGEMENT
28
WASTE TIRE WORKING GROUP In 2011, House Bill 433 established a Waste Tire Working Group (WTWG). The WTWG is a committee appointed by the governor in accordance with KRS 224.50-855 to discuss and research topics in waste tire management and make recommendations to the cabinet in an effort to improve Kentucky’s programs. The committee is tasked with meeting twice per year with all meetings open to the public. The WTWG consists of two ex-officio members and six appointed members: Governor Matthew Bevin appointed Shane Gabbard to the WTWG on August 10, 2017, serving a term that expires August 1, 2018. Mr. Gabbard, of Annville, is Jackson County’s Judge/Executive and will represent Kentucky county judge/executives. Current members: Director of DWM or designee: ..................................................................Byron Bland (ex-officio) Manager of DWM’s Recycling and Local Assistance Branch: .............. Gary Logsdon (ex-officio) Kentucky Department of Agriculture representative: .................................................. Harlan Hatter Kentucky Solid Waste Coordinators, two representatives: ..................... Kelly Bowlin (Boone Co.) ................... Scott Tussey (Madison Co.) Mayor: ............................................................................................... Martin Voiers (Flemingsburg) County Judge/Executive: ................................................................... Shane Gabbard (Jackson Co.) Retail tire sales in private industry representative: .......................................................... Joe Durkin RUBBER MODIFIED ASPHALT: In the spring of 2016, the Recycling and Local Assistance Branch launched the Rubber-Modified Asphalt Chip Seal Grant program. This grant was open to counties for the application of chip seal on county roads utilizing rubber-modified asphalt (RMA). Chip seal is a process that combines one or more layers of asphalt with one or more layers of aggregate used to extend the life of an existing road surface. In June 2016, DWM announced that up to $500,000 would be awarded for RMA chip seal projects in the counties of Fleming, Hart, Metcalfe, Trigg, Webster, and Whitley. The RMA grant has been continued for the 2017 calendar year, and expanded to include a RMA thin overlay pavement. This thin overlay type mixes dimensional recycled ground rubber tires into the asphalt and aggregate mix to produce a smooth pavement asphalt instead of the coarser texture produced with the chip seal. This grant provides funding to apply the thin overlay (1.5-inch thickness) to county roads with a chip seal or paved foundation. The division expects to award approximately six RMA grants in FY18.
KENTUCKY PRIDE FUND The Kentucky Pride Fund (KPF) is supported by an environmental remediation fee of $1.75 per ton of waste disposed in Kentucky landfills. This money is used for closure of historical landfills, recycling grants, household hazardous waste management grants, and remediation of illegal open

FY 2017 ANNUAL REPORT DIVISION OF WASTE MANAGEMENT
29
dumps. Additionally, this fund receives $5 million annually from the Transportation Cabinet specifically for distribution to counties and incorporated cities for litter abatement activities. LITTER ABATEMENT DWM began tracking the cost of litter activities and the amount of litter collected in 2001. State litter abatement grant funding through the KPF began in FY02. In 2016, counties removed 713,379 bags of litter, equal to 14,267,580 pounds, from 180,697 miles of Kentucky roadways. Litter collection costs totaled $7.5 million, an average cost of 53 cents per pound. Litter collection is expensive, at $1,059.80 per ton, when compared to the average landfill disposal rate of $39.91 per ton. The most common items found on roadways are plastic bottles and food containers.
Figure 13
Note: The amount of litter collected on public roads may not include litter collected by state road crews as part of the Department of Transportation’s efforts to maintain state roads.
There is a substantial variation of dollars spent per number of bags collected over the past ten years (Figure 13). Collection and recordkeeping procedures may not be consistent among the counties. Expenses such as education and outreach, which do not contribute to the number of bags collected can vary considerably from year to year. RECYCLING AND HOUSEHOLD HAZARDOUS WASTE The KPF Fund was amended in 2006 to provide grants for the development and expansion of recycling programs and household hazardous waste (HHW) management. During FY17, 73 entities were awarded grants for over $4.6 million. A total of 45 recycling grants were awarded to cities, counties, and universities. These grants assist in funding the establishment or expansion of
$0
$1
$2
$3
$4
$5
$6
$7
$8
$9
$10
0
100,000
200,000
300,000
400,000
500,000
600,000
700,000
800,000
900,000
2007 2008 2009 2010 2011 2012 2013 2014 2015 2016
Dol
lars
Sp
ent
Col
lect
ing
(Mil
lion
s)
Nu
mb
er o
f B
ags
Col
lect
ed
Litter Abatement Collection
Bags Collected Dollars Spent
FY 2017 ANNUAL REPORT DIVISION OF WASTE MANAGEMENT
30
recycling operations. The goal of the Recycling Grant Program is to build recycling infrastructure, emphasizing regional cooperative efforts, in areas where limited opportunities for citizens currently exist. In addition, a composting grant was awarded in FY17, and more composting projects may be funded in the future. The cities or counties receiving this grant award are required to provide a 25 percent local match in the form of cash or “in-kind” personnel, educational activities/materials, or advertising to promote the program. In FY17 HHW grants were awarded to twenty-eight counties in Kentucky. Over 391 tons of HHW were collected by counties through this program. Materials collected included electronic scrap, pesticides, solvents, mercury, and other potentially hazardous products from residences.
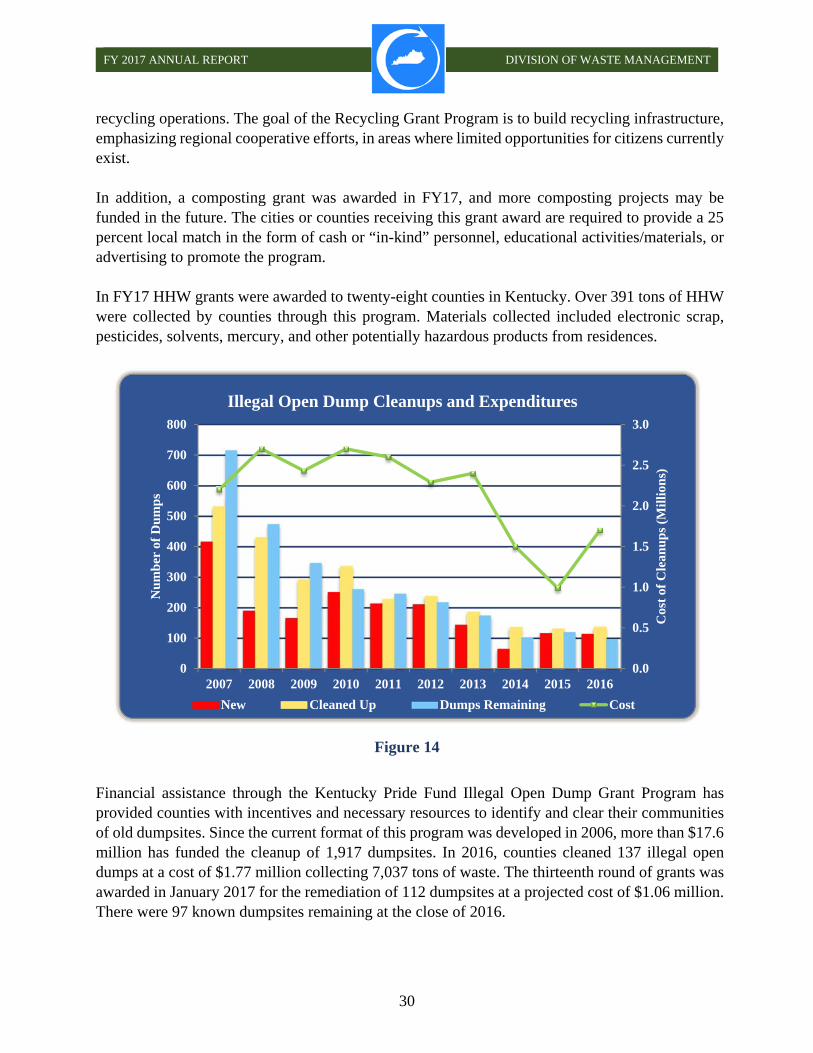
Figure 14
Financial assistance through the Kentucky Pride Fund Illegal Open Dump Grant Program has provided counties with incentives and necessary resources to identify and clear their communities of old dumpsites. Since the current format of this program was developed in 2006, more than $17.6 million has funded the cleanup of 1,917 dumpsites. In 2016, counties cleaned 137 illegal open dumps at a cost of $1.77 million collecting 7,037 tons of waste. The thirteenth round of grants was awarded in January 2017 for the remediation of 112 dumpsites at a projected cost of $1.06 million. There were 97 known dumpsites remaining at the close of 2016.
0.0
0.5
1.0
1.5
2.0
2.5
3.0
0
100
200
300
400
500
600
700
800
2007 2008 2009 2010 2011 2012 2013 2014 2015 2016
Cos
t of
Cle
anu
ps
(Mil
lion
s)
Nu
mb
er o
f D
um
ps
Illegal Open Dump Cleanups and Expenditures
New Cleaned Up Dumps Remaining Cost

FY 2017 ANNUAL REPORT DIVISION OF WASTE MANAGEMENT
31
Figure l4 displays all documented dump cleanups, including many sites cleaned with funding sources other than the Illegal Open Dump Grant. Overall, more than 25,937 illegal open dumpsites have been cleaned at a cost of $79.7 million dollars since 1993.
E-SCRAP RECYCLING
The challenge of properly managing waste computer and electronic parts and equipment (e-scrap) continues to be emphasized throughout the state. Over 50 counties reportedly offer some type of e-scrap collection; year-round drop-off programs or periodic events. Counties reported nearly 2,300 tons of e-scrap collected in 2016, similar to the 2015 total but noticeably less than the nearly 3,000 tons reported in 2014. This variation is possibly due to issues with the statewide e-scrap collection contract, or more generally related to weak markets for recycled e-scrap. From 2009 to 2015, the Finance and Administration Cabinet awarded an e-scrap contract to provide services to the state. This “all-agency” contract allowed the executive, judicial, and legislative branches of government, school districts, universities, and other public not-for-profit organization convenient access to e-scrap recycling. This contract provided for statewide pickup and recycling services and was unique in that the vendor would typically pay the generator a small reimbursement for the items collected. From January 2009 to September 2015, over 7,937 tons of e-scrap were collected under the contract, and refurbished or recycled in an environmentally sound and data-secure manner. Payments to generators netted over $494,000 during that timeframe. In late 2015, the statewide e-scrap contractor, Global Environmental Services, was found to be in violation of several environmental regulations, and their contract was voided. This was the second vendor to go out of business while holding the statewide contract. While management and internal issues likely played significant roles in each instance, it became more evident that e-scrap management was struggling by altering business models throughout this industry. In response, DWM united with other executive branch agencies as a work group to develop a new framework for statewide e-scrap collection based on current market conditions and increasing data security needs. It is expected that a request for proposals for a statewide e-scrap management vendor will be issued and a contract awarded in FY18. DWM also promotes proper management of e-scrap through their HHW Grant Program. Since 2006, the Kentucky Pride Fund has provided grants awards for the management of HHW, a category that includes e-scrap and mercury bearing wastes.
FY 2017 ANNUAL REPORT DIVISION OF WASTE MANAGEMENT
32
RECYCLING & LOCAL ASSISTANCE BRANCH COMPOSTING GRANTS PROVE TO BE VERY POPULAR By Donna Conway
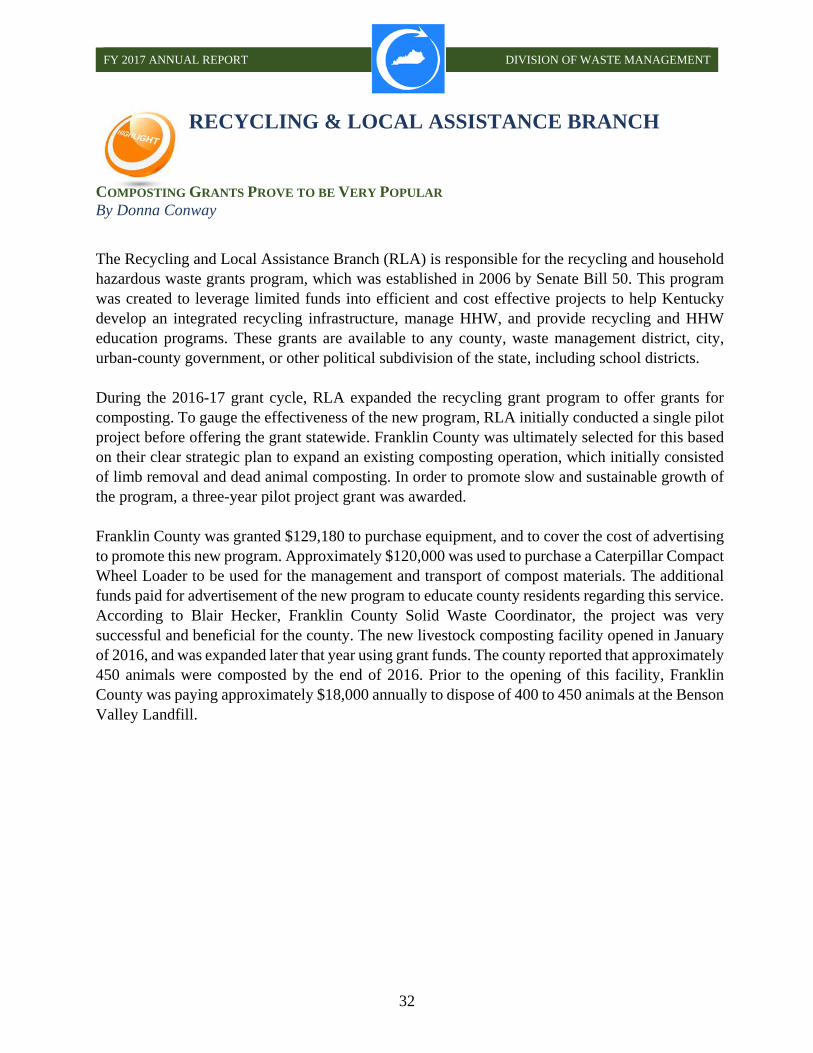
The Recycling and Local Assistance Branch (RLA) is responsible for the recycling and household hazardous waste grants program, which was established in 2006 by Senate Bill 50. This program was created to leverage limited funds into efficient and cost effective projects to help Kentucky develop an integrated recycling infrastructure, manage HHW, and provide recycling and HHW education programs. These grants are available to any county, waste management district, city, urban-county government, or other political subdivision of the state, including school districts. During the 2016-17 grant cycle, RLA expanded the recycling grant program to offer grants for composting. To gauge the effectiveness of the new program, RLA initially conducted a single pilot project before offering the grant statewide. Franklin County was ultimately selected for this based on their clear strategic plan to expand an existing composting operation, which initially consisted of limb removal and dead animal composting. In order to promote slow and sustainable growth of the program, a three-year pilot project grant was awarded. Franklin County was granted $129,180 to purchase equipment, and to cover the cost of advertising to promote this new program. Approximately $120,000 was used to purchase a Caterpillar Compact Wheel Loader to be used for the management and transport of compost materials. The additional funds paid for advertisement of the new program to educate county residents regarding this service. According to Blair Hecker, Franklin County Solid Waste Coordinator, the project was very successful and beneficial for the county. The new livestock composting facility opened in January of 2016, and was expanded later that year using grant funds. The county reported that approximately 450 animals were composted by the end of 2016. Prior to the opening of this facility, Franklin County was paying approximately $18,000 annually to dispose of 400 to 450 animals at the Benson Valley Landfill.
FY 2017 ANNUAL REPORT DIVISION OF WASTE MANAGEMENT
33
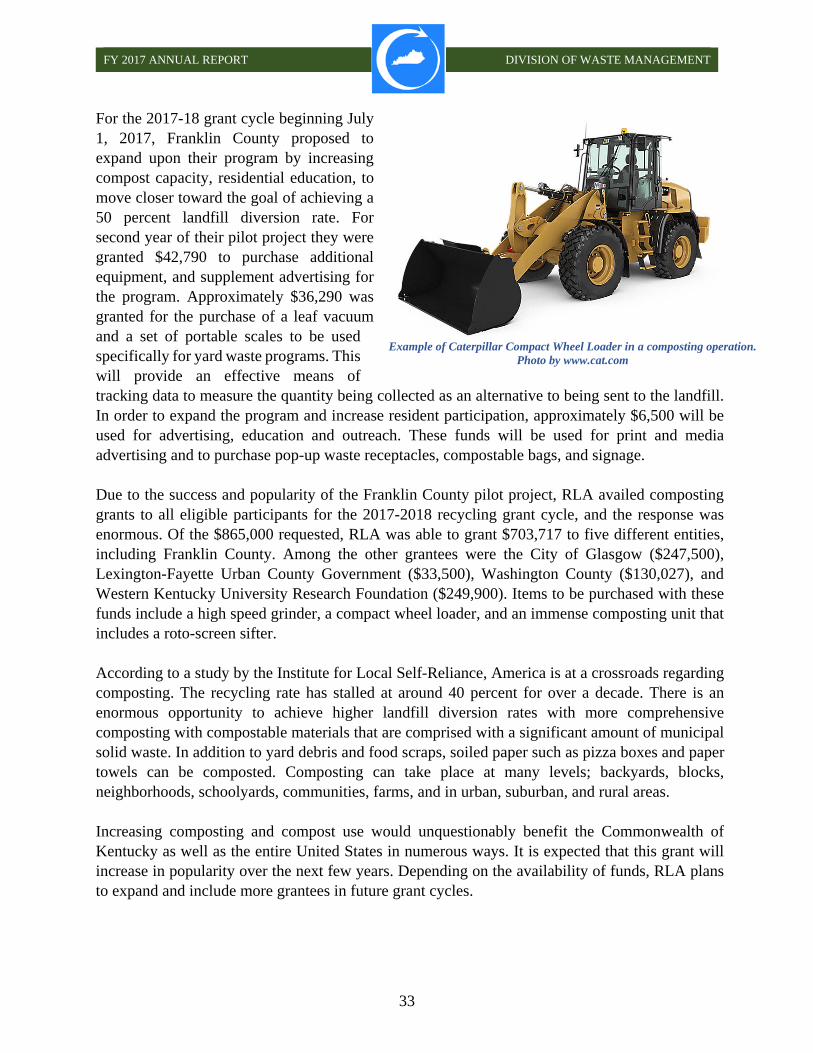
For the 2017-18 grant cycle beginning July 1, 2017, Franklin County proposed to expand upon their program by increasing compost capacity, residential education, to move closer toward the goal of achieving a 50 percent landfill diversion rate. For second year of their pilot project they were granted $42,790 to purchase additional equipment, and supplement advertising for the program. Approximately $36,290 was granted for the purchase of a leaf vacuum and a set of portable scales to be used specifically for yard waste programs. This will provide an effective means of tracking data to measure the quantity being collected as an alternative to being sent to the landfill. In order to expand the program and increase resident participation, approximately $6,500 will be used for advertising, education and outreach. These funds will be used for print and media advertising and to purchase pop-up waste receptacles, compostable bags, and signage. Due to the success and popularity of the Franklin County pilot project, RLA availed composting grants to all eligible participants for the 2017-2018 recycling grant cycle, and the response was enormous. Of the $865,000 requested, RLA was able to grant $703,717 to five different entities, including Franklin County. Among the other grantees were the City of Glasgow ($247,500), Lexington-Fayette Urban County Government ($33,500), Washington County ($130,027), and Western Kentucky University Research Foundation ($249,900). Items to be purchased with these funds include a high speed grinder, a compact wheel loader, and an immense composting unit that includes a roto-screen sifter. According to a study by the Institute for Local Self-Reliance, America is at a crossroads regarding composting. The recycling rate has stalled at around 40 percent for over a decade. There is an enormous opportunity to achieve higher landfill diversion rates with more comprehensive composting with compostable materials that are comprised with a significant amount of municipal solid waste. In addition to yard debris and food scraps, soiled paper such as pizza boxes and paper towels can be composted. Composting can take place at many levels; backyards, blocks, neighborhoods, schoolyards, communities, farms, and in urban, suburban, and rural areas. Increasing composting and compost use would unquestionably benefit the Commonwealth of Kentucky as well as the entire United States in numerous ways. It is expected that this grant will increase in popularity over the next few years. Depending on the availability of funds, RLA plans to expand and include more grantees in future grant cycles.
Example of Caterpillar Compact Wheel Loader in a composting operation. Photo by www.cat.com
FY 2017 ANNUAL REPORT DIVISION OF WASTE MANAGEMENT
34
SOLID WASTE waste.ky.gov/swb
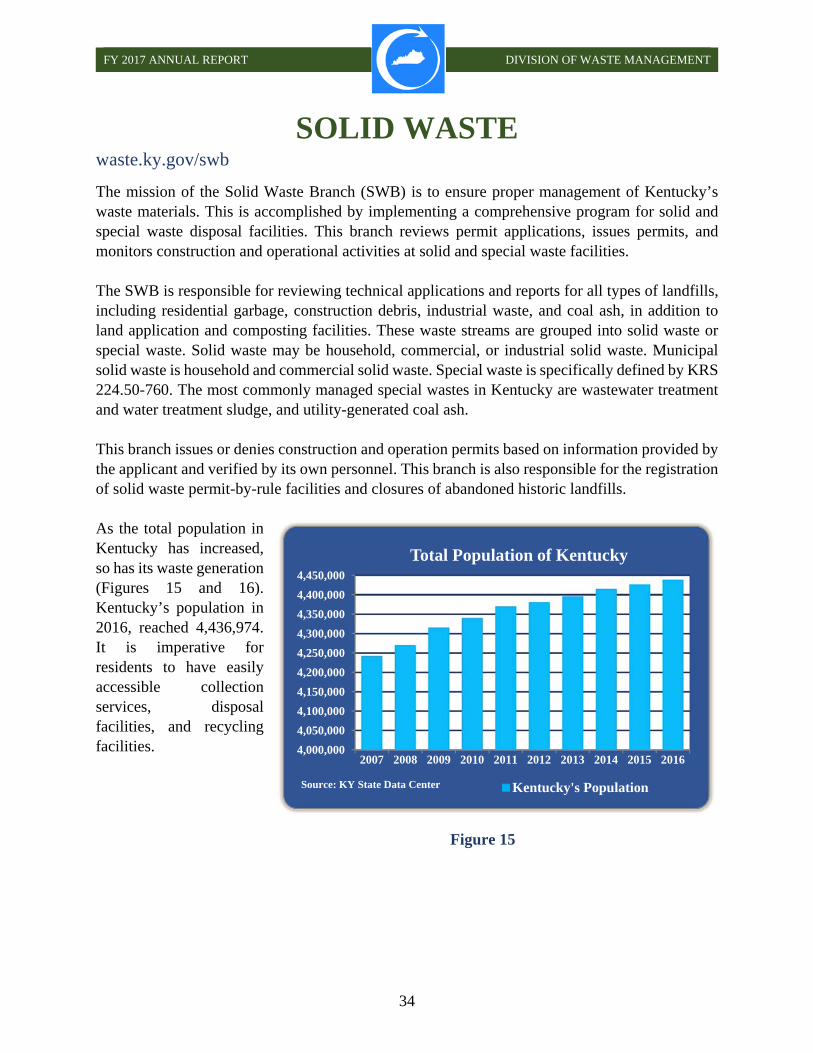
The mission of the Solid Waste Branch (SWB) is to ensure proper management of Kentucky’s waste materials. This is accomplished by implementing a comprehensive program for solid and special waste disposal facilities. This branch reviews permit applications, issues permits, and monitors construction and operational activities at solid and special waste facilities. The SWB is responsible for reviewing technical applications and reports for all types of landfills, including residential garbage, construction debris, industrial waste, and coal ash, in addition to land application and composting facilities. These waste streams are grouped into solid waste or special waste. Solid waste may be household, commercial, or industrial solid waste. Municipal solid waste is household and commercial solid waste. Special waste is specifically defined by KRS 224.50-760. The most commonly managed special wastes in Kentucky are wastewater treatment and water treatment sludge, and utility-generated coal ash. This branch issues or denies construction and operation permits based on information provided by the applicant and verified by its own personnel. This branch is also responsible for the registration of solid waste permit-by-rule facilities and closures of abandoned historic landfills. As the total population in Kentucky has increased, so has its waste generation (Figures 15 and 16). Kentucky’s population in 2016, reached 4,436,974. It is imperative for residents to have easily accessible collection services, disposal facilities, and recycling facilities.
Figure 15
4,000,000
4,050,000
4,100,000
4,150,000
4,200,000
4,250,000
4,300,000
4,350,000
4,400,000
4,450,000
2007 2008 2009 2010 2011 2012 2013 2014 2015 2016
Total Population of Kentucky
Kentucky's PopulationSource: KY State Data Center
FY 2017 ANNUAL REPORT DIVISION OF WASTE MANAGEMENT
35
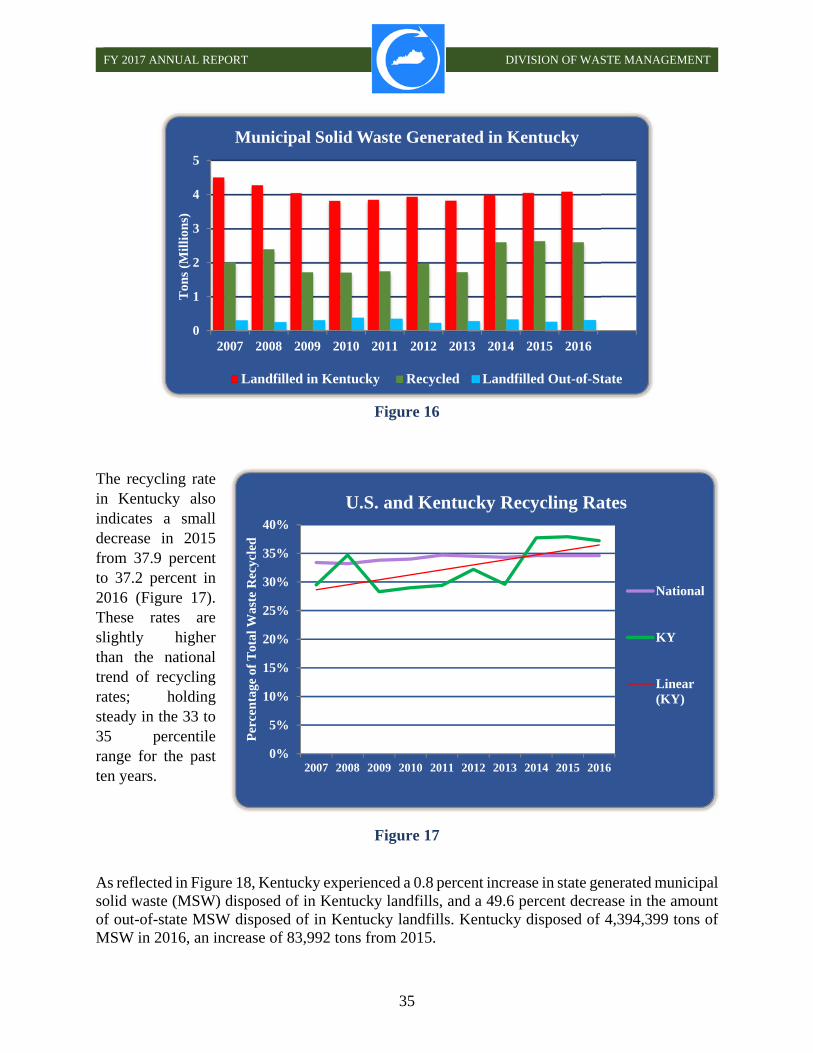
Figure 16
The recycling rate in Kentucky also indicates a small decrease in 2015 from 37.9 percent to 37.2 percent in 2016 (Figure 17). These rates are slightly higher than the national trend of recycling rates; holding steady in the 33 to 35 percentile range for the past ten years.
Figure 17
As reflected in Figure 18, Kentucky experienced a 0.8 percent increase in state generated municipal solid waste (MSW) disposed of in Kentucky landfills, and a 49.6 percent decrease in the amount of out-of-state MSW disposed of in Kentucky landfills. Kentucky disposed of 4,394,399 tons of MSW in 2016, an increase of 83,992 tons from 2015.
0
1
2
3
4
5
2007 2008 2009 2010 2011 2012 2013 2014 2015 2016
Ton
s (M
illi
ons)
Municipal Solid Waste Generated in Kentucky
Landfilled in Kentucky Recycled Landfilled Out-of-State
0%
5%
10%
15%
20%
25%
30%
35%
40%
2007 2008 2009 2010 2011 2012 2013 2014 2015 2016
Per
cen
tage
of
Tot
al W
aste
Rec
ycle
d
U.S. and Kentucky Recycling Rates
National
KY
Linear(KY)

FY 2017 ANNUAL REPORT DIVISION OF WASTE MANAGEMENT
36
Figure 18
All of the counties in Kentucky offer a system of universal waste collection through a combination of curbside collection, drop-off collection centers and transfer stations.
“Universal collection” is defined by KRS 224.1-010(44) as: “… a municipal solid waste collection system which is established by ordinance and approved by the cabinet and requires access for each household or solid waste generator in a county. A commercial or industrial entity which transports or contracts for the transport of the municipal solid waste it generates or which operates a solid waste management facility for its exclusive use may be excluded from participation.”
In accordance with KRS 224.43-315, waste haulers are required to report annually the number of households serviced and the monthly cost of service. The reported participation rate in approved MSW collection systems has remained steady since 2006 with an average of 86 percent. In 2016, Kentucky counties reported that 1,514,988 households were participating in approved MSW collection services, Figure 19. The average reported household participation rate for MSW collection systems in 2016 was 85.5 percent. Approximately 14.5 percent of households (251,561) were not accounted for by current tracking methods; self-haul to transfer stations and convenience centers are often not tracked. Multi-unit apartments comprise approximately 17.7 percent of Kentucky households; most of these are serviced by dumpsters via commercial accounts, and consequently are not figured as individual households. As a result of these tracking limitations, actual participation rates could be five to ten percentage points higher than county reporting. The average cost per month for household curbside MSW collection was $15.79 in 2016.
0
1,000,000
2,000,000
3,000,000
4,000,000
5,000,000
6,000,000
7,000,000
8,000,000
2007 2008 2009 2010 2011 2012 2013 2014 2015 2016
Ton
s
Municipal Solid Waste Disposal and Recycling
KY WasteLandfilled in KY
Out-of-State WasteLandfilled in KY
Total WasteLandfilled in KY
KY WasteLandfilled Out-of-StateTotal KY WasteLandfilled
Recycled
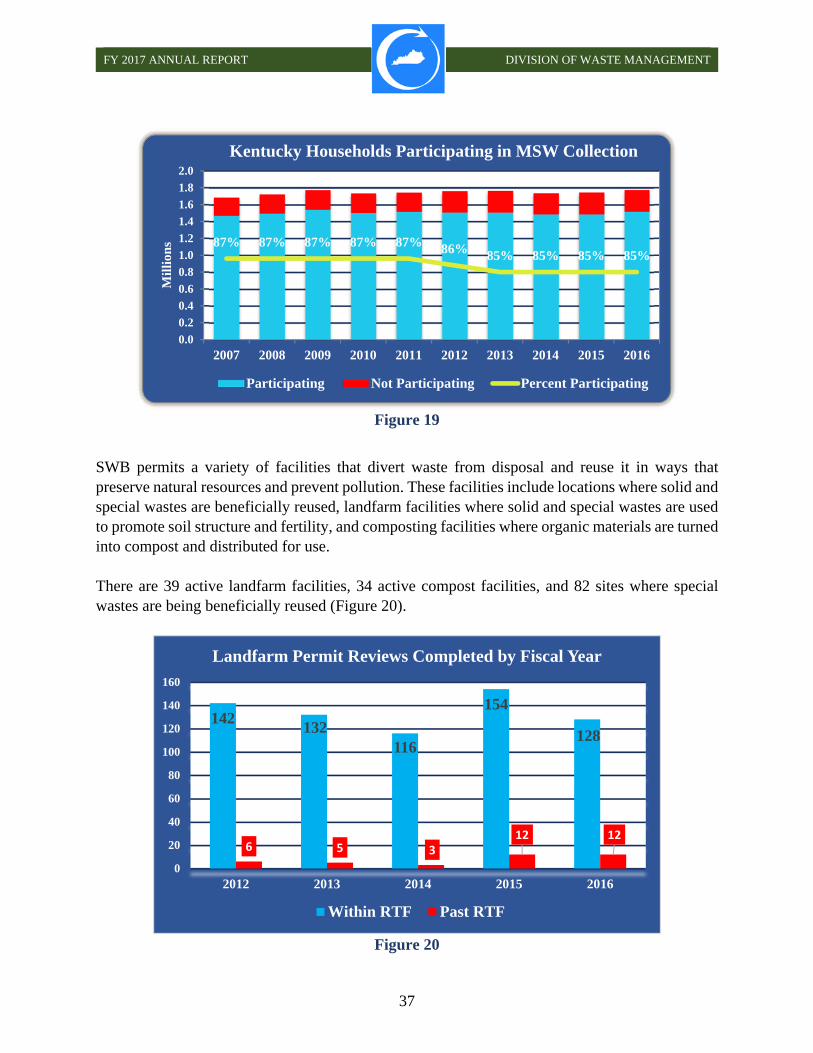
FY 2017 ANNUAL REPORT DIVISION OF WASTE MANAGEMENT
37
Figure 19
SWB permits a variety of facilities that divert waste from disposal and reuse it in ways that preserve natural resources and prevent pollution. These facilities include locations where solid and special wastes are beneficially reused, landfarm facilities where solid and special wastes are used to promote soil structure and fertility, and composting facilities where organic materials are turned into compost and distributed for use. There are 39 active landfarm facilities, 34 active compost facilities, and 82 sites where special wastes are being beneficially reused (Figure 20).
Figure 20
87% 87% 87% 87% 87% 86% 85% 85% 85% 85%
0.0
0.2
0.4
0.6
0.8
1.0
1.2
1.4
1.6
1.8
2.0
2007 2008 2009 2010 2011 2012 2013 2014 2015 2016
Mil
lion
sKentucky Households Participating in MSW Collection
Participating Not Participating Percent Participating
142132
116
154
128
6 5 312 12
0
20
40
60
80
100
120
140
160
2012 2013 2014 2015 2016
Landfarm Permit Reviews Completed by Fiscal Year
Within RTF Past RTF

FY 2017 ANNUAL REPORT DIVISION OF WASTE MANAGEMENT
38
Sites where solid waste are beneficially reused are designated “permit-by-rule”, meaning the operator may begin beneficial reuse activities without having obtained written authorization from the cabinet, as long as the operation meets regulatory requirements. Some operators choose to receive written authorization from the cabinet, and in FY17, seven facilities for beneficial reuse of solid waste were approved. ENVIRONMENTAL REMEDIATION FEE The environmental remediation fee (ERF) was established by Kentucky Revised Statute 224.43-500. This statute requires all generators of waste in Kentucky to pay $1.75 per ton of waste disposed in a municipal solid waste disposal facility to be collected by municipal solid waste facilities or transfer stations. This fee is deposited into the Kentucky Pride Fund and used to fund grants for the cleanup of illegal open dumps, recycling, and household hazardous waste management. The ERF form which accompanies the fee compliance is shown in Figure 21.
Figure 21
GROUNDWATER MONITORING Groundwater assessment requires the owner or operator of a facility to determine the existence, extent, and depth of groundwater degradation, as well as the rate and direction of migration of contaminants in the groundwater. Groundwater assessment is triggered if the analysis of groundwater at the facility shows one or more parameters exceeding the maximum contaminant
113 114 113 121
1 0 1
6
0.5
20.5
40.5
60.5
80.5
100.5
120.5
140.5
2nd Qtr2016
3rd Qtr2016
4th Qtr2016
1st Qtr2017
ERF Reporting Compliance
Did not Report
Sent in Form

FY 2017 ANNUAL REPORT DIVISION OF WASTE MANAGEMENT
39
levels (MCL) specified by regulation, or an increase over the naturally occurring background levels of parameters lacking promulgated MCLs. Of the 77 facilities currently required to monitor groundwater, 15 are in groundwater assessment (19 percent). Corrective action requires the owner or operator of a facility to abate groundwater contamination, prevent further groundwater contamination from the facility, and restore or replace public or private water supplies affected by contamination from the special waste facility. Groundwater corrective action is currently being carried out by six facilities (eight percent). HISTORICAL LANDFILLS A total of 95 historic landfills have been closed through construction and remediation projects or by no further action due to intensive site studies. Total costs associated with the closure projects exceed $69 million, excluding branch personnel direct and indirect expenses. Phase I of the Butler County landfill completed construction and is within the warranty period with costs estimated to be approximately $2.7 million. Trigg County Landfill has nearly completed construction. Cost are estimated to be approximately $1.3 million.
Four historical landfill closure projects are in the design phase and will be scheduled for construction once the design has been completed. Construction and engineering oversight costs are estimated to be approximately $7 million:
Bullitt County Landfill Butler County Landfill – Phase II City of Covington Landfill Johnson County Landfill
Eight historic landfill projects are in the site characterization phase at an estimated cost of $750,000:
Foothills Sanitary Landfill Goodridge Avenue Harlan Drum Site Henderson Drum Site Hobson Grove Landfill McCracken County Landfill Mercer County Landfill Mount Sterling Landfill

FY 2017 ANNUAL REPORT DIVISION OF WASTE MANAGEMENT
40
Two historic landfill closure projects are in the process of a contract being awarded through the Division of Engineering and Contract Administration of the Finance and Administration Cabinet. These projects consist of site characterizations estimated to be approximately $1 million:
Northwest-Central KY Area (Breckinridge, Grayson, Hancock, Meade, and Ohio Counties)
South Central KY Area (Adair, Allen, Barren, Cumberland, Green, Hart, Metcalfe, Monroe, and Taylor Counties)
Initial characterization of 288 landfills is complete. These landfills are being prioritized based on the perceived threat to human health and the environment. The approximate cost for the initial site characterization of these sites is $3.9 million. There are 526 historical landfills remaining to be closed.

FY 2017 ANNUAL REPORT DIVISION OF WASTE MANAGEMENT
41
SOLID WASTE BRANCH
TECHNOLOGICALLY ENHANCED NATURALLY OCCURRING RADIOACTIVE MATERIALS By Robin Green In 2015 and 2016, shipments of oil and gas drilling-related technologically enhanced naturally occurring radioactive materials (TENORM) wastes generated in Ohio, West Virginia, and Pennsylvania were brought into Kentucky and disposed of in two landfills. On February 22, 2016, the Energy and Environment Cabinet (EEC) sent a notice to all solid and special waste facilities informing them of Kentucky administrative regulations for TENORM wastes. During the 2016 Regular Session, the Kentucky House passed an act related to naturally occurring radioactive materials (NORM) and declared an emergency. The EEC and the Cabinet for Health and Family Services were specifically directed in this statute to review and revise their existing regulations to ensure the proper management of oil and gas wastes containing NORM. These two cabinets sought input from a variety of groups including those that produce and transport oil and gas wastes, environmental groups, owners and operators of waste disposal facilities, other state bodies, and the public at large. The EEC reconvened the Oil and Gas Workgroup with these groups to facilitate the review process, draft recommendations, and propose amendments to regulations and statutes. The Kentucky Senate passed an act during the 2017 Regular Session related to radioactive materials and their management. The act amended two statutes; KRS 211.862 and 211.863, with an effective date of June 29, 2017. These statutes identify the various state agencies with regulatory authority over the management of NORM, as well as their specific responsibilities, and the statutes ban the importation of TENORM into Kentucky for disposal. They also provided a revised definition for NORM and a definition for TENORM. On July 13, 2017, the Division of Waste Management completed revisions to 401 KAR 45:060, 48:005, and 48:090 and filed these regulations with the Legislative Research Commission.

FY 2017 ANNUAL REPORT DIVISION OF WASTE MANAGEMENT
42
SUPERFUND waste.ky.gov/sfb
The Superfund Branch (SFB) seeks to ensure that contaminated sites are evaluated and cleaned up in a timely manner to reduce risks to human health and the environment. Usually this is accomplished by overseeing companies or individuals who have taken responsibility for cleaning up contamination found on their property. In cases where a responsible party cannot be found or is unable to act, the SFB may take a direct role in cleaning up a site. This program handles oversight of cleanup of hazardous substance, pollutants, and contaminant releases and non-UST petroleum releases across the commonwealth. The SFB maintains a list of sites in which releases are managed on-site through some form of engineered control; a cap or structure and/or institutional control, such as an environmental covenant or deed restriction. There are currently 232 sites where releases to the environment are managed on- and off-site. These sites require inspections and reporting such as an annual report or five-year review as established by statute. For sites that are being managed by using institutional and/or engineering controls, the obligations to continue to manage the releases are indefinite. Therefore, the amount of total managed sites in Superfund have and will continue to increase as new sites are approved for closure under this option. The only way a site can be removed from the managed site list is if additional cleanup is performed to restore the site to safely allow for unrestricted (residential) use of the impacted land(s).
Figure 22
0
50
100
150
200
250
FY
12
FY
13
FY
14
FY
15
FY
16
FY
-17
Superfund Program Site Final Actions
Superfund Sites RemediatedPetroleum Sites RemediatedMethamphetamine Properties Decontaminated1-415 NOCs IssuedTargeted Brownfield Sites Assessed

FY 2017 ANNUAL REPORT DIVISION OF WASTE MANAGEMENT
43
In FY17, the Superfund Branch remediated 67 state Superfund sites with 603 pending review and/or actions, and 19 new state sites. The branch remediated two major state-lead sites using the Hazardous Waste Management Fund, and 26 sites are in the process of review. There were no cleanups conducted under state oversight via the Voluntary Environmental Remediation Program. There were 20 sites in FY17 with a release of petroleum or a petroleum product remediated from a source other than a petroleum storage tank, with 127 pending review or actions. There were 16 new petroleum sites registered. BROWNFIELDS Brownfields are abandoned, idled, or underutilized industrial and commercial facilities/sites where expansion or redevelopment is complicated by real or perceived environmental contamination. They can be in urban, suburban, or rural areas. The Brownfield redevelopment is a joint effort between the Division of Waste Management and the Division of Compliance Assistance. In FY17:
14 Targeted Brownfields Assessments were conducted, and four are awaiting
review. Multiple other sites have been reviewed and technical assistance was provided for recipients of various EPA 128(a) Brownfields Grants.
52 brownfield sites were reviewed under KRS 224.1-415, 41 Notice of Eligibility letters issued, 35 Notification of Concurrence letters issued, and two sites are pending review at the end of FY17.
METHAMPHETAMINE LAB CLEANUP Kentucky’s Division of Waste Management works in conjunction with law enforcement and health departments to remediate structures and homes contaminated with illicit methamphetamine waste through the division’s Methamphetamine Lab Cleanup Program. Due to methamphetamine waste being toxic, especially to small children, and due to its ability (propensity) to absorb into home surfaces and structures, it must be remediated by certified contractors. In FY17, there were 50 contaminated residences reported and 48 residences were decontaminated through the Methamphetamine Lab Cleanup Program. http://waste.ky.gov/SFB/MethLabCleanup/Pages/default.aspx STATUS OF SUPERFUND, HAZARDOUS WASTE MANAGEMENT FUND, AND COMMONWEALTH OF
KENTUCKY’S LIABILITY
Superfund’s process progresses from site investigation and characterization through selecting an appropriate cleanup option to implementing the remedy selected. After a remedy is executed and the cleanup has achieved the de minimis remedial concentrations, a site can be truly considered closed. If de minimis concentrations are not achieved immediately, a remedy will continue in operation until de minimis levels are achieved. Under the latter scenario long-term management,
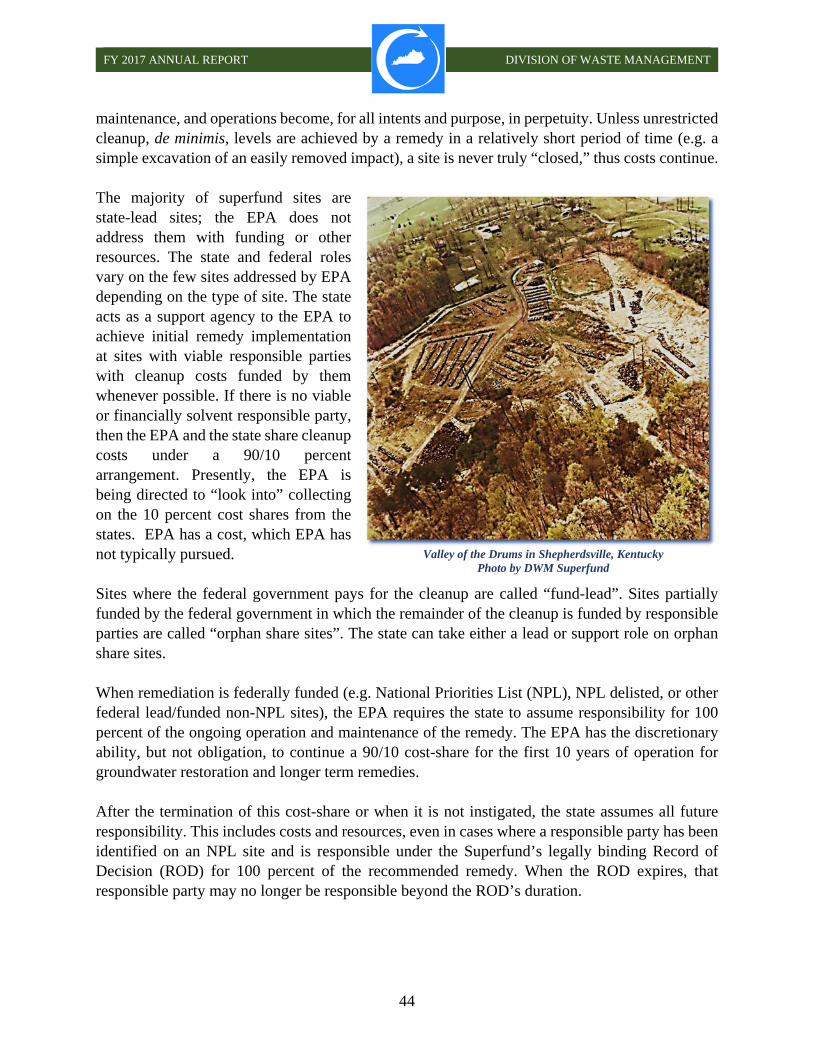
FY 2017 ANNUAL REPORT DIVISION OF WASTE MANAGEMENT
44
maintenance, and operations become, for all intents and purpose, in perpetuity. Unless unrestricted cleanup, de minimis, levels are achieved by a remedy in a relatively short period of time (e.g. a simple excavation of an easily removed impact), a site is never truly “closed,” thus costs continue. The majority of superfund sites are state-lead sites; the EPA does not address them with funding or other resources. The state and federal roles vary on the few sites addressed by EPA depending on the type of site. The state acts as a support agency to the EPA to achieve initial remedy implementation at sites with viable responsible parties with cleanup costs funded by them whenever possible. If there is no viable or financially solvent responsible party, then the EPA and the state share cleanup costs under a 90/10 percent arrangement. Presently, the EPA is being directed to “look into” collecting on the 10 percent cost shares from the states. EPA has a cost, which EPA has not typically pursued. Sites where the federal government pays for the cleanup are called “fund-lead”. Sites partially funded by the federal government in which the remainder of the cleanup is funded by responsible parties are called “orphan share sites”. The state can take either a lead or support role on orphan share sites. When remediation is federally funded (e.g. National Priorities List (NPL), NPL delisted, or other federal lead/funded non-NPL sites), the EPA requires the state to assume responsibility for 100 percent of the ongoing operation and maintenance of the remedy. The EPA has the discretionary ability, but not obligation, to continue a 90/10 cost-share for the first 10 years of operation for groundwater restoration and longer term remedies. After the termination of this cost-share or when it is not instigated, the state assumes all future responsibility. This includes costs and resources, even in cases where a responsible party has been identified on an NPL site and is responsible under the Superfund’s legally binding Record of Decision (ROD) for 100 percent of the recommended remedy. When the ROD expires, that responsible party may no longer be responsible beyond the ROD’s duration.
Valley of the Drums in Shepherdsville, Kentucky Photo by DWM Superfund

FY 2017 ANNUAL REPORT DIVISION OF WASTE MANAGEMENT
45
CERCLA RODs run approximately 30 years. Most of Kentucky’s RODs on NPL caliber sites have either expired or are within 5 to 20 years of reaching their term limits. NPL sites in Kentucky are of such magnitude, nature, and severity that the remaining contamination was simply buried and capped in place. In some cases, they require active large volume groundwater pump and treatment systems to maintain hydraulic control. Kentucky’s NPL sites are some of the oldest existing NPL sites in the nation. Kentucky’s infamous “Valley of the Drums”, in Shepherdsville, was one of the two national archetypical sites that precipitated the promulgation of the federal CERCLA (a.k.a. “Superfund”) in 1980 along with upper New York state’s notorious “Love Canal”. Simply put, many of Kentucky’s NPL site RODs have expired and several more will be terminating fairly soon; most under eight years or less. These NPL sites require on-going, very costly, and resource intensive annual long-term (in perpetuity) sampling, maintenance, and operations that revert to the state.
The state’s sole source of any long-term operations and maintenance at sites, expired NPL RODs and other cleanup actions, is the Hazardous Waste Management Fund (HWMF). The HWMF is the Kentucky’s sole funding source for all superfund related activities whether it is the reversion of NPL RODs sites, state super fund long-term operations and maintenance requirements, initial ERT and state-lead emergency cleanups/actions, and non-emergency/non-NPL remedial actions. This fund also covers the internal cost for the required oversight of sites in which managed closure was the selected protective measure; institutionally controlled sites requiring deed instruments such as environmental covenants, deed restrictions, and deed notices.
The HWMF was created to provide the Energy and Environment Cabinet (EEC) with the funds necessary to implement its omnibus to protect the health of the citizens and natural resources of the commonwealth from threats associated with releases of hazardous substances, pollutants, and contaminants. EEC uses this fund to provide for technical reviews, oversight of responsible party driven actions, and contracted state-lead investigations and remediation projects. This fund finances regulatory oversight, emergency responses, state-lead, and time-critical remediation projects at sites across the commonwealth. These projects range from large industrial sites, medium sized sites, to persistent dry cleaners’ plumes, and small projects such as roadside drums, orphan wastes, and transformer releases. Presently, there are no other available funding sources to conduct emergency response, NPL responsibilities, state-lead cleanup actions, or regulatory oversight.
Under the present circumstances the HWMF can no longer nominally meet its statutory obligations to protect human health and the environment. Currently, the HWMF can no longer plausibly or realistically undertake the existing and projected superfund long-term operations and maintenance of the state’s NPL sites, state superfund backlog, or sustain sufficient funding to mount medium- to large-scale emergency and state-lead remedial projects that arise year to year.
Site groupings Major categories of site groupings:
1. The existing active superfund universe as of FY17 (588+); 2. High risk RCRIS Generator sites likely to have had a release (609+);

FY 2017 ANNUAL REPORT DIVISION OF WASTE MANAGEMENT
46
o Dry Cleaners (293+) o Wood Treating (38+) o Plating Operations (73+) o Battery Operations (25+) o Other General (180+)
3. NPL ROD Reversion Sites LTMOM in perpetuity (14); 4. High potential near future NPL caliber sites (2); 5. Annual ERT Short-Term Emergencies (avg. 1,000 per yr. require action); and 6. Long-Term Option B Managed “Closure” Sites Long-Term state Oversight in perpetuity
(232).
Major assessment categories of costs: 1. Total Initial Remedial Cost;
o Cost at Worst Case Scenario ($2.4 Billion) o Cost at Medium Case Scenario ($2.0 Billion) o Cost at Best Case Scenario ($1.6 Billion)
2. Total Annual LTMOM Reoccurring Cost ($4.0 Million/Year); and 3. X Years Out Cost Totals for Annual LTMOM Reoccurring Cost.
o 5 Years Out ($20 Million) o 10 Years Out ($40 Million) o 20 Years Out ($80 Million) o 30 Years Out ($120 Million)
DWM requested the Superfund Branch to assess the state’s existing, near future, and projectable long-term potential liability costs (Figure 23) for its existing active and known likely potential
$0
$500,000,000
$1,000,000,000
$1,500,000,000
$2,000,000,000
$2,500,000,000
Total InitialRemedial Cost(Worse Case)
Total InitialRemedial Cost(Medium Case)
Total InitialRemedial Cost
(Best Case)
AnnualReoccurring
LTMOM Cost
ApplicableAnnual
HWMF Level
$2,434,989,440
$2,050,689,440
$1,634,550,000
$4,008,625 $450,000
Kentucky Superfund Potential Existing/Projected Liabilities
Figure 23
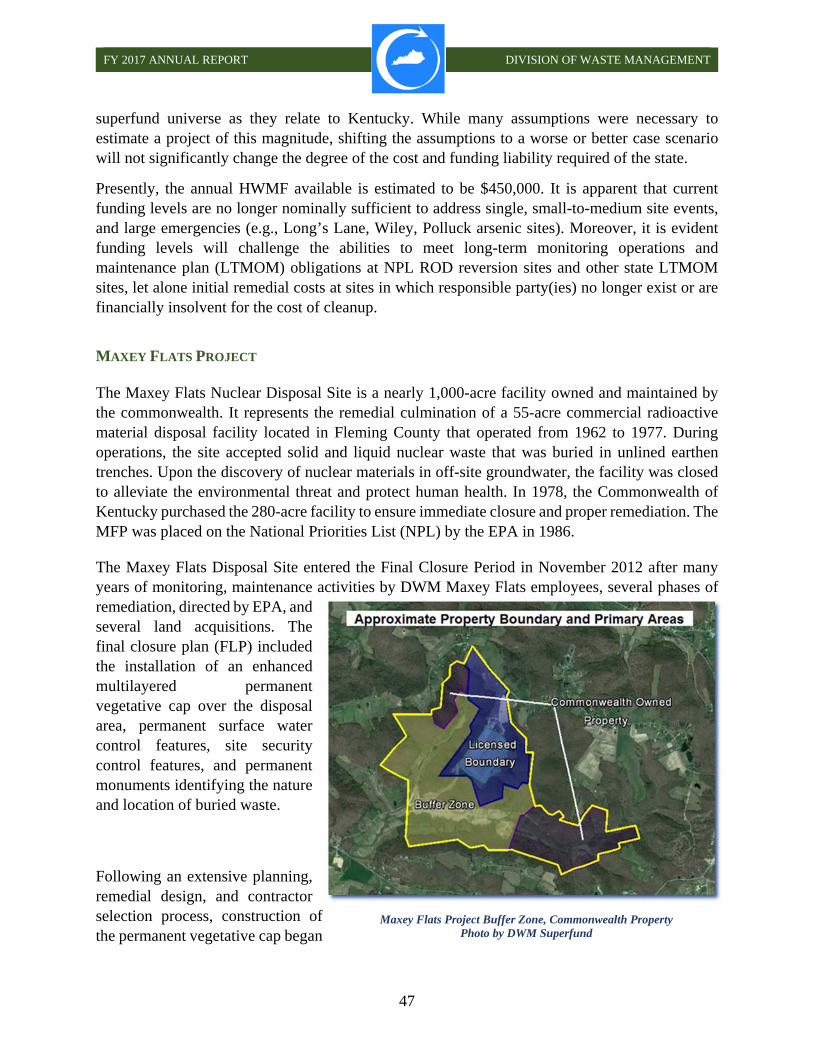
FY 2017 ANNUAL REPORT DIVISION OF WASTE MANAGEMENT
47
superfund universe as they relate to Kentucky. While many assumptions were necessary to estimate a project of this magnitude, shifting the assumptions to a worse or better case scenario will not significantly change the degree of the cost and funding liability required of the state.
Presently, the annual HWMF available is estimated to be $450,000. It is apparent that current funding levels are no longer nominally sufficient to address single, small-to-medium site events, and large emergencies (e.g., Long’s Lane, Wiley, Polluck arsenic sites). Moreover, it is evident funding levels will challenge the abilities to meet long-term monitoring operations and maintenance plan (LTMOM) obligations at NPL ROD reversion sites and other state LTMOM sites, let alone initial remedial costs at sites in which responsible party(ies) no longer exist or are financially insolvent for the cost of cleanup.
MAXEY FLATS PROJECT The Maxey Flats Nuclear Disposal Site is a nearly 1,000-acre facility owned and maintained by the commonwealth. It represents the remedial culmination of a 55-acre commercial radioactive material disposal facility located in Fleming County that operated from 1962 to 1977. During operations, the site accepted solid and liquid nuclear waste that was buried in unlined earthen trenches. Upon the discovery of nuclear materials in off-site groundwater, the facility was closed to alleviate the environmental threat and protect human health. In 1978, the Commonwealth of Kentucky purchased the 280-acre facility to ensure immediate closure and proper remediation. The MFP was placed on the National Priorities List (NPL) by the EPA in 1986.
The Maxey Flats Disposal Site entered the Final Closure Period in November 2012 after many years of monitoring, maintenance activities by DWM Maxey Flats employees, several phases of remediation, directed by EPA, and several land acquisitions. The final closure plan (FLP) included the installation of an enhanced multilayered permanent vegetative cap over the disposal area, permanent surface water control features, site security control features, and permanent monuments identifying the nature and location of buried waste.
Following an extensive planning, remedial design, and contractor selection process, construction of the permanent vegetative cap began
Maxey Flats Project Buffer Zone, Commonwealth Property Photo by DWM Superfund
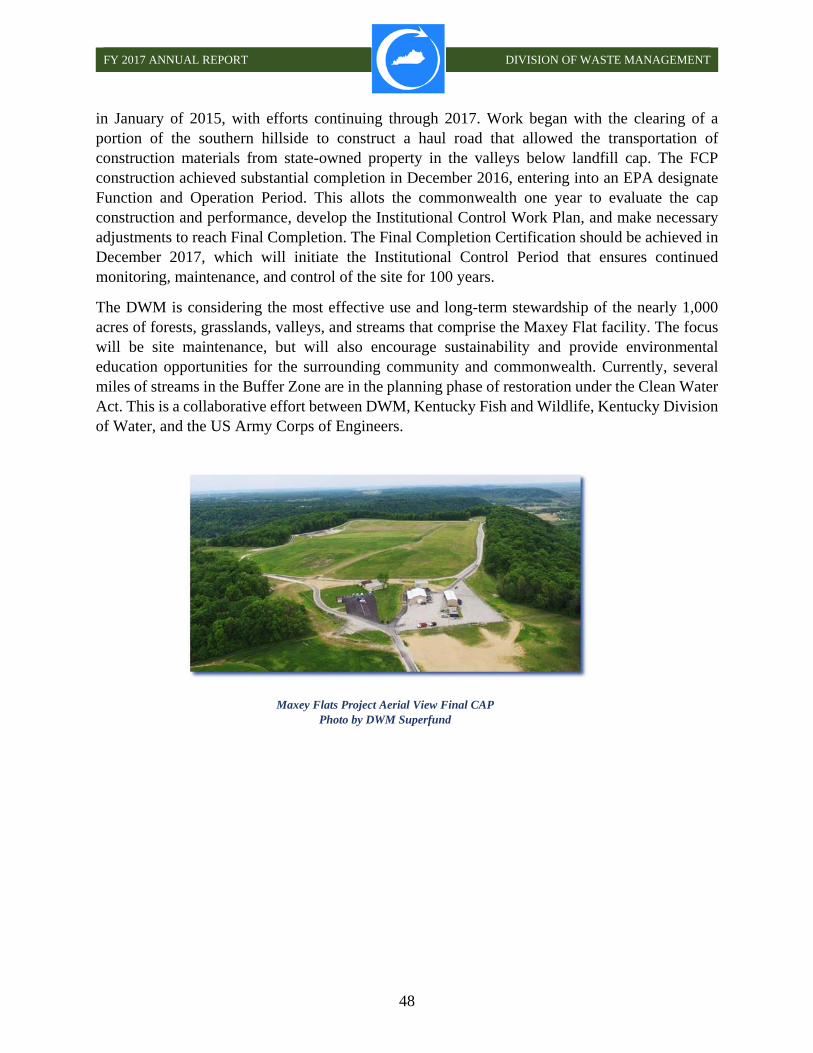
FY 2017 ANNUAL REPORT DIVISION OF WASTE MANAGEMENT
48
in January of 2015, with efforts continuing through 2017. Work began with the clearing of a portion of the southern hillside to construct a haul road that allowed the transportation of construction materials from state-owned property in the valleys below landfill cap. The FCP construction achieved substantial completion in December 2016, entering into an EPA designate Function and Operation Period. This allots the commonwealth one year to evaluate the cap construction and performance, develop the Institutional Control Work Plan, and make necessary adjustments to reach Final Completion. The Final Completion Certification should be achieved in December 2017, which will initiate the Institutional Control Period that ensures continued monitoring, maintenance, and control of the site for 100 years.
The DWM is considering the most effective use and long-term stewardship of the nearly 1,000 acres of forests, grasslands, valleys, and streams that comprise the Maxey Flat facility. The focus will be site maintenance, but will also encourage sustainability and provide environmental education opportunities for the surrounding community and commonwealth. Currently, several miles of streams in the Buffer Zone are in the planning phase of restoration under the Clean Water Act. This is a collaborative effort between DWM, Kentucky Fish and Wildlife, Kentucky Division of Water, and the US Army Corps of Engineers.
Maxey Flats Project Aerial View Final CAP Photo by DWM Superfund

FY 2017 ANNUAL REPORT DIVISION OF WASTE MANAGEMENT
49
SUPERFUND BRANCH
STATE-LEAD SUPERFUND EMERGENCY REMEDIAL ACTION: SOUTHERN
WOOD TREATMENT By Cliff Hall, P.G.
From March 2015 through August 2016, in preparation for an upcoming office move, a site in Montgomery County was rediscovered by the Superfund Branch (SFB) staff when reviewing archived paper files. The site had previously undergone active KRS 224.1-400 oversight, but appeared to have been referred to another program. SFB employees followed up on the status of the site and it became apparent that no regulatory agency had been providing oversight since the attempted referral. The potential responsible parties still in existence were contacted, and it was discovered that this site had been sold. At this point, a visit to the site was necessary.
Upon arrival on August 24, 2016, it was ascertained that this site had been redeveloped into a residential subdivision, which resulted in unsuccessful efforts to locate the area of the former wood treater. Most of the landmarks referenced in archived, hand-drawn maps were no longer present. Using the SFB’s handheld X-ray fluorescence (XRF) unit, their staff targeted metals known to be part of the former treatment process (ammoniacal copper arsenate). An initial concern was whether any of the residential properties were contaminated. The XRF readings indicated that one of the residential property’s surface soils contained arsenic at three orders of magnitude above normal background concentrations. Soil samples were collected and sent to the state lab for verification of the field data. Two days later, laboratory analytical testing confirmed these results of the XRF. An emergency action was immediately declared, and during the evening hours of August 26th,
Montgomery County Arsenic Site – 14 Impacted Residences. Photo by DWM Superfund

FY 2017 ANNUAL REPORT DIVISION OF WASTE MANAGEMENT
50
residents of the subdivision were notified that their homes were either contaminated or potentially contaminated with arsenic. Fact sheets were quickly drafted and provided to each residence, and the county health department was also notified.
Site characterization activities began August 30th utilizing the SFB’s Geoprobe®. Site access agreements were obtained and numerous Superfund and Environmental Response Team personnel were detailed for collection and analyses of soil samples. By the end of the week, it was determined that the area was too congested and unsafe to implement corrective measures while residents remained on-site. Residents who were asked to leave received an initial reimbursement per diem for 14 days while away from their homes. This per diem was later adjusted to 90 days and ultimately to 120 days. Residents not impacted but requiring travel through the contaminated areas, were also asked to leave and provided with a per diem. All residents accepted the terms of their per diem.
Contractors mobilized the site on September 4, 2016. The goal of the emergency phase of cleanup was to prevent the completed exposure pathways to residents. Once the emergency phase had ended, issues relating to long term management of the impacted property could be addressed. During the emergency phase, 15 properties underwent either a removal action or capping, and a combination of the two. A total of 197 cubic yards of contaminated soil was disposed of as hazardous waste. A total of 24,100 cubic yards of contaminated soils was disposed of as solid waste. The excavation and disposal was completed by January 4, 2017. Due to the complexity of the waterline layout, almost all the waterlines had to be moved and replaced to the water meters for the entire site. Septic tanks were replaced at two properties onsite, and new telephone lines were installed for the entire site under the supervision of AT&T employees.
Most of the impacted properties were excavated to a depth of two feet in order to place a clean soil cap as a protective barrier. Prior to placement of clean soils, a marker fabric was installed to signify the transition from clean to contaminated soil. Contingent on remaining arsenic concentrations after excavation, backfill was placed between one and three feet in depth.
Demarcation liner (orange) indicating separation of clean soil and impacted soil on 12/1/16. Photo by DWM Superfund

FY 2017 ANNUAL REPORT DIVISION OF WASTE MANAGEMENT
51
The majority of the excavated areas is currently overlain by a one foot cap. The remaining site area required that one of the residences be overlain by a two to three foot cap, and two vacant properties that contained the former treatment areas, were capped with two feet of soil. A total of 15,600 cubic yards of borrow material was used to cap the properties after excavation.
The Emergency Phase of this project was officially considered completed on June 9, 2017. Although the majority of corrective action work had been complete by January 4, 2017, touch up work to restore landscaping and fencing were not completed until the subsequent spring. Erosion control measures also had to be implemented prior to vegetation reestablishment. The total expenditure of the emergency phase was 5.4 million dollars.
Blue barrier under trailer serving as barrier. Excavations did not occur under trailers on 12/1/16. Photo by DWM Superfund
Same Property and Trailer Restored on 5/4/17. Photo by DWM Superfund

FY 2017 ANNUAL REPORT DIVISION OF WASTE MANAGEMENT
52
SUPERFUND BRANCH
STATE SUPERFUND - RANKING SYSTEM By Sheri Adkins, P.G.
The Superfund Branch (SFB) is responsible for a large number of sites that essentially do not fall under other programs’ regulatory authority; sites that are otherwise abandoned and most often without the financial solvency of the party responsible for contamination. This lack of a financially viable responsible party (RP) leads to what can be best described as ‘financial liability’ for SFB. As funding dwindles, and as the number of sites, costs of remediation and long-term oversight continue to increase, the financial capacity of the SFB to address contaminated sites has steadily declined. A little over a year ago the severity of SFB’s decreasing funding and increasing state cleanup liabilities were brought into sharp focus by a very significant site.
In late spring or early summer of 2016, the Southern Wood Treaters site in Mt. Sterling, Kentucky, was identified as an immediate exposure threat to residents unknowingly living on the former facility’s property, and it was declared a state emergency, undergoing a Kentucky Superfund State-lead removal action (see “…Southern Wood Treatment” article for more details on page 49). Final cost to mitigate only the immediate site emergency totaled approximately $4.6
million. In view of the now known full scope of the arsenic impacts additional costs have been estimated to be $11 million. This prompted Energy and Environment Cabinet (EEC) Secretary, Charles Snavely, to task DWM and SFB with quantifying the potential financial liability facing the state for state Superfund sites in which the responsible party either no longer exists or is financially not solvent enough to remediate a site. This task included the characterization and cleanup costs for current active Superfund sites, likely Superfund sites, projected long-term management of managed closures, Kentucky’s post-closure National Priority List (NPL) sites, and oversight expenses related to the division’s popular Brownfields Redevelopment Program. While SFB was gathering data related to these liabilities and projecting out for future costs, the staff contacted Texas’ Superfund Pre-Remedial coordinator about the increasing expenses of the
Wood Treating Facilities Ranking - KY
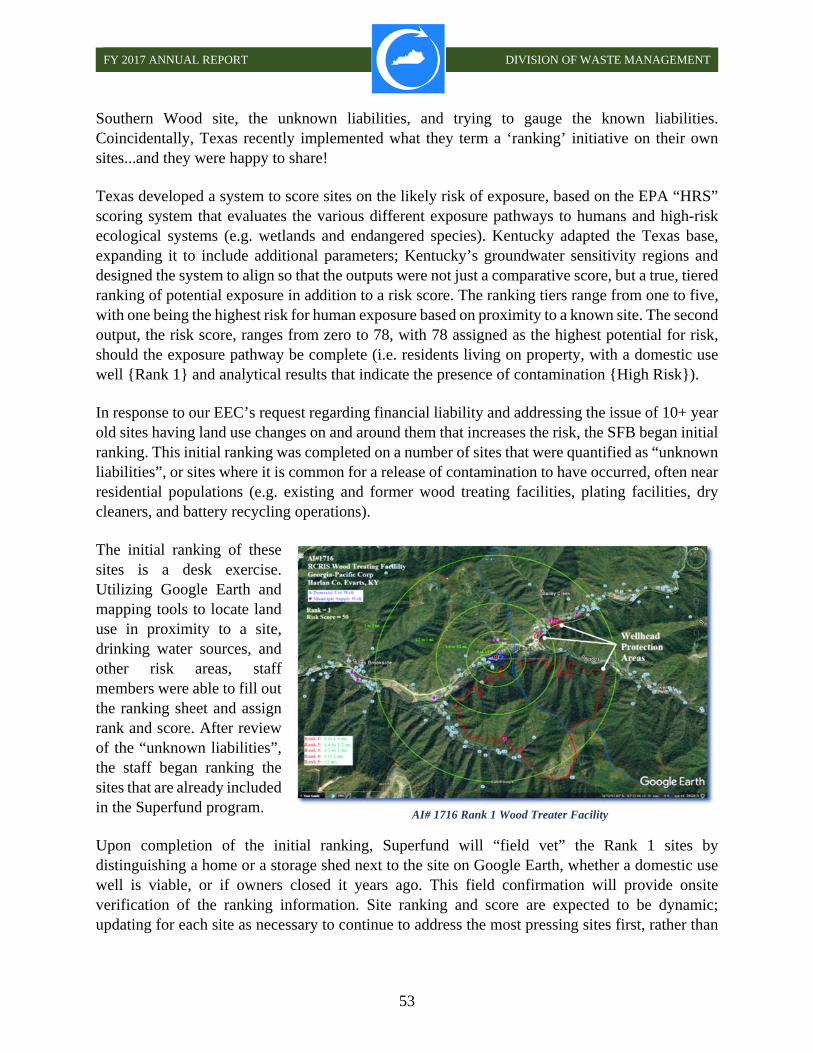
FY 2017 ANNUAL REPORT DIVISION OF WASTE MANAGEMENT
53
Southern Wood site, the unknown liabilities, and trying to gauge the known liabilities. Coincidentally, Texas recently implemented what they term a ‘ranking’ initiative on their own sites...and they were happy to share! Texas developed a system to score sites on the likely risk of exposure, based on the EPA “HRS” scoring system that evaluates the various different exposure pathways to humans and high-risk ecological systems (e.g. wetlands and endangered species). Kentucky adapted the Texas base, expanding it to include additional parameters; Kentucky’s groundwater sensitivity regions and designed the system to align so that the outputs were not just a comparative score, but a true, tiered ranking of potential exposure in addition to a risk score. The ranking tiers range from one to five, with one being the highest risk for human exposure based on proximity to a known site. The second output, the risk score, ranges from zero to 78, with 78 assigned as the highest potential for risk, should the exposure pathway be complete (i.e. residents living on property, with a domestic use well {Rank 1} and analytical results that indicate the presence of contamination {High Risk}). In response to our EEC’s request regarding financial liability and addressing the issue of 10+ year old sites having land use changes on and around them that increases the risk, the SFB began initial ranking. This initial ranking was completed on a number of sites that were quantified as “unknown liabilities”, or sites where it is common for a release of contamination to have occurred, often near residential populations (e.g. existing and former wood treating facilities, plating facilities, dry cleaners, and battery recycling operations). The initial ranking of these sites is a desk exercise. Utilizing Google Earth and mapping tools to locate land use in proximity to a site, drinking water sources, and other risk areas, staff members were able to fill out the ranking sheet and assign rank and score. After review of the “unknown liabilities”, the staff began ranking the sites that are already included in the Superfund program. Upon completion of the initial ranking, Superfund will “field vet” the Rank 1 sites by distinguishing a home or a storage shed next to the site on Google Earth, whether a domestic use well is viable, or if owners closed it years ago. This field confirmation will provide onsite verification of the ranking information. Site ranking and score are expected to be dynamic; updating for each site as necessary to continue to address the most pressing sites first, rather than
AI# 1716 Rank 1 Wood Treater Facility
FY 2017 ANNUAL REPORT DIVISION OF WASTE MANAGEMENT
54
focusing on a site after reaching a stable or non-threatening point in contaminant flow and exposure routes. Sites verified by field vetting to be top-priority exposure risks will proceed to classification through sampling. If remediation is deemed necessary, or an immediate threat to human health and the environment is identified, available remedial and management options will be reviewed and the best path forward will be implemented. The SFB has adopted this ranking method in efforts to methodically and systematically address threats of exposure to toxic and harmful substances. Also, to sustain a high level of protectiveness necessary to uphold our mission of protecting human health and the environment with very limited funding resources. The ranking initiative has been crucial for attaining an enhanced understanding of the distribution and severity of contamination across our state, and keeping pace with changes in land use around sites that alter the risks to humans. It has also been eye opening bringing attention to the financial liability of unfunded contaminated sites, which is vastly greater than anticipated, and will require additional resources to effectively address in the future.
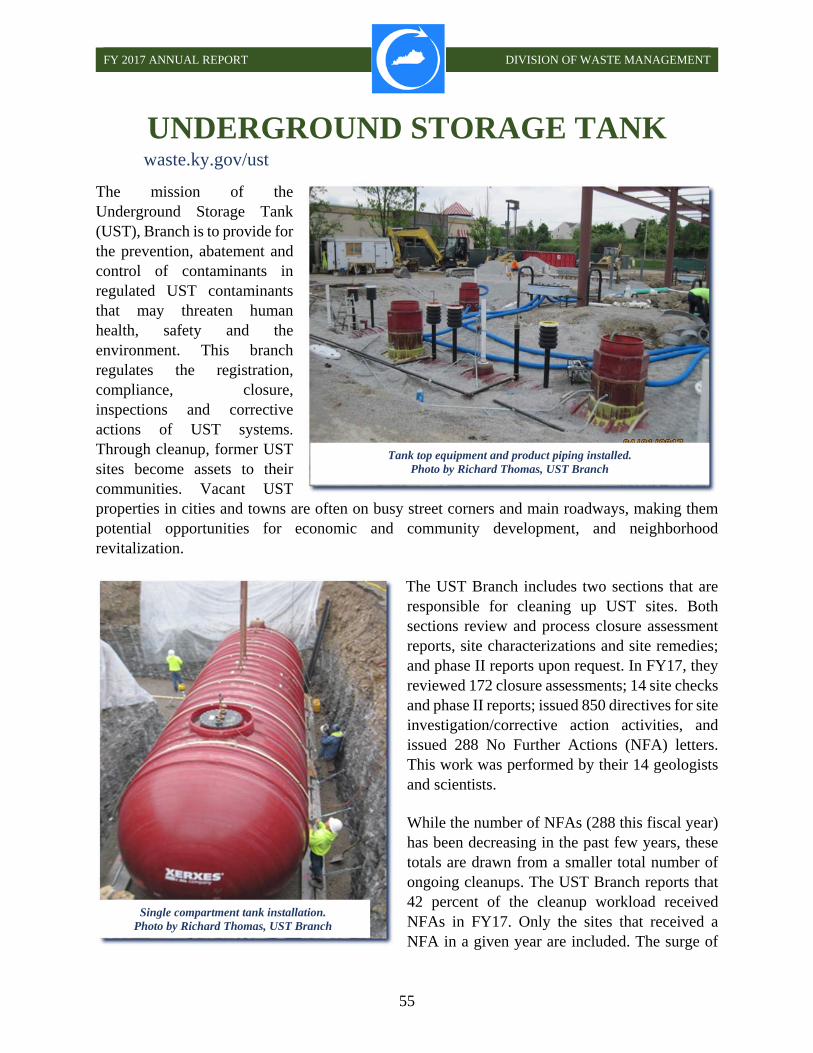
FY 2017 ANNUAL REPORT DIVISION OF WASTE MANAGEMENT
55
UNDERGROUND STORAGE TANK waste.ky.gov/ust
The mission of the Underground Storage Tank (UST), Branch is to provide for the prevention, abatement and control of contaminants in regulated UST contaminants that may threaten human health, safety and the environment. This branch regulates the registration, compliance, closure, inspections and corrective actions of UST systems. Through cleanup, former UST sites become assets to their communities. Vacant UST properties in cities and towns are often on busy street corners and main roadways, making them potential opportunities for economic and community development, and neighborhood revitalization.
The UST Branch includes two sections that are responsible for cleaning up UST sites. Both sections review and process closure assessment reports, site characterizations and site remedies; and phase II reports upon request. In FY17, they reviewed 172 closure assessments; 14 site checks and phase II reports; issued 850 directives for site investigation/corrective action activities, and issued 288 No Further Actions (NFA) letters. This work was performed by their 14 geologists and scientists. While the number of NFAs (288 this fiscal year) has been decreasing in the past few years, these totals are drawn from a smaller total number of ongoing cleanups. The UST Branch reports that 42 percent of the cleanup workload received NFAs in FY17. Only the sites that received a NFA in a given year are included. The surge of
Single compartment tank installation. Photo by Richard Thomas, UST Branch
Tank top equipment and product piping installed. Photo by Richard Thomas, UST Branch

FY 2017 ANNUAL REPORT DIVISION OF WASTE MANAGEMENT
56
NFA letters issued in FY08 and FY13 were due, in part, to regulatory changes in FY07 and FY12 (Figure 24).
Figure 24
As a direct result of changes in the regulatory process in 2006 and 2011, the total number of UST cleanups remaining has decreased substantially. There were 580 UST cleanups requiring further work before they received NFA letters at the close of FY17 (Figure 25).
Figure 25
566
344
459
532616
658
517271 303 288
0
100
200
300
400
500
600
700
FY08 FY09 FY10 FY11 FY12 FY13 FY14 FY15 FY16 FY17
NFA Letters Issued by Number of Sites
NFAs Issued
2,380 2,170
2,078 1,9801,852
1,517
1,117
832 757
675
580
0
500
1,000
1,500
2,000
2,500
FY07 FY08 FY09 FY10 FY11 FY12 FY13 FY14 FY15 FY16 FY17
Nu
mb
er o
f S
ites
UST Cleanup Sites Remaining FY07-17
# of Sites
FY 2017 ANNUAL REPORT DIVISION OF WASTE MANAGEMENT
57
The Underground Storage Tank Branch publishes and maintains the UST Quarterly and the UST Branch website. These efforts focus on providing support to UST owners, operators, contractors, and companies through timely information concerning regulatory
aspects of owning and managing USTs and the cleanup of UST-related contamination. The UST website may be accessed using URL. http://waste.ky.gov/ust/USTQuarterly/Pages/default.aspx Kentucky Underground Storage Tank Operator Online Learning System (KY TOOLS) has been operational since it began May of 2013. Since that time, an estimated 2,758 of Kentucky’s 3,211 active facilities have successfully designated a compliance manager and completed online training to fulfill state and federally mandated training requirements for UST personnel. Successful completion of the training is required annually. In accordance with federal law, states are to ensure that UST operators are trained according to state-specific requirements.
UNDERGROUND STORAGE TANK BRANCH
CONTINUING TO MOVE FORWARD By Lori R. Terry The Underground Storage Tank (UST) branch has achieved continued success in reducing the backlog of sites requiring assessment. As of June 30, 2017, there are 580 remaining sites requiring site assessments and remediation through oversight from the Corrective Action Sections. In addition to the sites being managed by the Corrective Action Sections, UST reported that owners and operators failed to perform the required assessment at over 150 sites at the time of permanent closures. The branch applied and received additional federal grant funding for addressing these backlog sites. Over the course of three years, UST has directed 149 site assessments and issued 95 No Further Actions (NFA) letters resulting from these assessments. The efforts of the branch have reduced the number of sites to only 37 that still require an assessment from the initial 150 plus sites, and an estimated ten sites will require additional assessments. Over the course of the project, these site assessments were performed by responsible parties and consultants that were contracted by the state. This project has been successful by eliminating 95 sites from the backlog. UST is in the process of applying for additional federal grant funding to address the remaining 47 sites.

FY 2017 ANNUAL REPORT DIVISION OF WASTE MANAGEMENT
58
The Administrative Section oversees the annual invoices for tank fees, collects tank fees, and the registration of tanks. In 2017, a total of 725 new and amended registrations were received. This section mailed invoices resulting in the collection of $291,150.00 in annual tank fees. The Claims and Payments section, which manages the Petroleum Storage Tank Environmental Assurance Fund (PSTEAF), obligated $13,737,229.98 for small owner tank removal account (SOTRA), Financial Responsibility Account (FRA), and the Petroleum Storage Tank Account (PSTA) corrective actions. Claims are reviewed and approved within an average of 15 days upon report approval. Reimbursements totaled $13,997,974.17 from all PSTEAF accounts. The branch is committed to continuing efforts to facilitate the needs of the cleanup program. The new Tools for Environmental Management and Protection Organizations (TEMPO) database build, designed to include the claims and payment processes and information, has been successful in increasing overall efficiency. TEMPO tracks dollars obligated for UST work directed and claims for payment as a result of work completed. The Compliance Section has been focused on building relations with the regulated community to provide ongoing support to field inspectors with data input into the TEMPO database. Their staff continues to assist trained operators with the Kentucky Underground Storage Tank Operator Online Learning System (KY TOOLS), the online compliance training program. Currently, 88 percent of Kentucky’s UST facilities have only one employee staff member who is responsible for compliance that has completed the KY TOOLS online training. The Compliance Section is continually seeking additional ways to provide greater service to the regulated community by coordinating compliance awards; the Tank Excellence in Compliance (TEC) Award with the Kentucky Petroleum Marketers Association, and by participating in fuel schools to educate the UST community on UST regulations. The UST employees are looking forward to participating in compliance inspections with the field inspectors and acquiring additional hands-on training with UST relevant equipment.

FY 2017 ANNUAL REPORT DIVISION OF WASTE MANAGEMENT
59
ACKNOWLEDGMENTS
Commonwealth of Kentucky Governor Matthew G. Bevin
Energy and Environment Cabinet
Secretary Charles G. Snavely Deputy Secretary R. Bruce Scott, P.E.
Kentucky Department for Environmental Protection
Commissioner Aaron Keatley Deputy Commissioner Tony Hatton, P.G.
Kentucky Division of Waste Management
Director Jon Maybriar Assistant Director Edward Winner, Ph.D.
This annual report is intended to provide a concise set of facts and measurements to support environmental decision-making. We welcome your questions and comments to the contacts below.
Kentucky Division of Waste Management 300 Sower Boulevard, 2nd Floor, Frankfort, Kentucky 40601
Phone: 502-564-6716 Fax: 502-564-4245 waste.ky.gov
We acknowledge the contributions of management and personnel of the Division of Waste Management:
Sheri Adkins, P.G. Louanna Aldridge Heather Alexander
Danny Anderson, P.E. Donna Conway
Chris Craig Robin Green
Cliff Hall, P.G. J. R. Holt
Larry Hughes, P.G. Gary Logsdon John Maddy
Brian Osterman Bart Schaffer, P.G.
Lori R. Terry Richard Thomas Daniel Walker
April Webb, P.E.
Compiled by: John W. Brown Edited by: Louanna Aldridge and Michelle Mitchell
The Kentucky Division of Waste Management does not discriminate on the basis of race, color, religion, sex, national origin, sexual orientation or gender identity, ancestry, age, disability or veteran status. The
division provides, on request, reasonable accommodations necessary to afford an individual with a disability an equal opportunity to participate in all services, programs, and activities. Contact the
division to request materials in an alternate format.
Printed with state funds on recycled paper, September 2017

FY 2017 ANNUAL REPORT DIVISION OF WASTE MANAGEMENT
Kentucky Division of Waste Management 300 Sower Boulevard, 2nd Floor Frankfort, KY 40601
Report an Environmental Emergency, 24-hours, to the Environmental Response Team 502-564-2380 or 800-928-2380


