63
ANNUAL REPORT FISCAL YEAR 2015 COMMONWEALTH OF KENTUCKY ENERGY AND ENVIRONMENT CABINET DEPARTMENT FOR ENVIRONMENTAL PROTECTION DIVISION OF WASTE MANAGEMENT WASTE.KY.GOV

ANNUAL REPORT FISCAL YEAR 2015
COMMONWEALTH OF KENTUCKY ENERGY AND ENVIRONMENT CABINET
DEPARTMENT FOR ENVIRONMENTAL PROTECTION DIVISION OF WASTE MANAGEMENT
WASTE.KY.GOV
i
MESSAGE FROM THE DIRECTOR
It is my pleasure to submit the tenth edition of our annual report for fiscal year 2015 (July 1, 2014 to June 30, 2015). The information provided within represents activities and accomplishments of the division as we continue to make progress in the mission of protecting human health and the environment. While budget cuts and cap reductions have been difficult to balance, division staff has continued to do their jobs effectively. I admire them for their hard work and commitment to preserving and improving our environment. During the fiscal year, the division made progress in several program areas. I am pleased to report the Brownfield’s Redevelopment Program,
under KRS 224.1-415, has assisted in the redevelopment of 80 properties, improving nearly 1,200 acres of land across the commonwealth. The division has also begun actual field work related to the final capping at the Maxey Flats project. Additionally, division staff has been busy developing a state Coal Combustion Residual (CCR) regulatory program in light of the new federal CCR rule, which will become effective in October of 2015. Lastly, the division continues to make significant progress in the cleanup of leaking underground petroleum storage tanks. These and the many other division accomplishments are discussed in this annual report. Anthony R. Hatton, P.G., Director Kentucky Division of Waste Management

ii
TABLE OF CONTENTS
Selected Figures
iii
Executive Summary
1
Introduction
3
Solid Waste
7
Recycling and Local Assistance
14
Hazardous Waste
26
Field Operations
33
Underground Storage Tanks
36
Superfund
40
Program Planning and Administration
50
Acknowledgments 57

iii
SELECTED FIGURES
1. Total Population - Kentucky 7
2. Municipal Solid Waste Generated in Kentucky 8 3. Municipal Solid Waste Disposal and Recycling 8 4. U.S. and Kentucky Recycling Rates 9 5. Kentucky Households Participating in MSW Collection 10 6. Solid Waste Permits Pending 11 7. Kentucky Tons Recycled 14
8. State Office Paper Recycling Totals 15 9. Fiber Recyclables Market 16 10. Plastic Recyclables Market 17 11. Glass Recyclables Market 18 12. Metal Recyclables Market 19 13. Litter Abatement 21 14. Illegal Open Dump Cleanups and Expenditures 22
15. Hazardous Waste Permits Pending 27 16. Division of Waste Management Inspections 33 17. Division of Waste Management Compliance Rates 34 18. Underground Storage Tank Cleanups Completed 36 19. Underground Storage Tank Cleanups Remaining 37 20. Superfund Sites Remediated and Characterized 40
21. New Superfund Sites 41 22. Division of Waste Management Budget Analysis 50 23. Division of Waste Management Funded Positions 51 24. Division of Waste Management Employee Years of
Service Profile in FY15
51
iv
In Kentucky, “Waste” means… Kentucky Revised Statutes, Chapter 224.1-010 states,
(31) "Waste" means:
(a) "Solid waste" means any garbage, refuse, sludge, and other discarded material, including solid, liquid, semi-solid, or contained gaseous material resulting from industrial, commercial, mining (excluding coal mining wastes, coal mining by-products, refuse, and overburden), agricultural operations, and from community activities, but does not include those materials including, but not limited to, sand, soil, rock, gravel, or bridge debris extracted as part of a public road construction project funded wholly or in part with state funds, recovered material, tire-derived fuel, special wastes as designated by KRS 224.50-760, solid or dissolved material in domestic sewage, manure, crops, crop residue, or a combination thereof which are placed on the soil for return to the soil as fertilizers or soil conditioners, or solid or dissolved material in irrigation return flows or industrial discharges which are point sources subject to permits under Section 402 of the Federal Water Pollution Control Act, as amended (86 Stat. 880), or source, special nuclear, or by-product material as defined by the Atomic Energy Act of 1954, as amended (68 Stat. 923):
1. "Household solid waste" means solid waste, including garbage and trash generated by single and multiple family residences, hotels, motels, bunkhouses, ranger stations, crew quarters, and recreational areas such as picnic areas, parks, and campgrounds, but it does not include tire-derived fuel;
2. "Commercial solid waste" means all types of solid waste generated by stores, offices, restaurants, warehouses, and other service and nonmanufacturing activities, excluding tire-derived fuel and household and industrial solid waste;
3. "Industrial solid waste" means solid waste generated by manufacturing or industrial processes that is not a hazardous waste or a special waste as designated by KRS 224.50-760, including, but not limited to, waste resulting from the following manufacturing processes: electric power generation; fertilizer or agricultural chemicals; food and related products or by-products; inorganic chemicals; iron and steel manufacturing; leather and leather products; nonferrous metals manufacturing/foundries; organic chemicals; plastics and resins manufacturing; pulp and paper industry; rubber and miscellaneous plastic products, except tire-derived fuel; stone, glass, clay, and concrete products; textile manufacturing; transportation equipment; and water treatment; and
4. "Municipal solid waste" means household solid waste and commercial solid waste; and (b) "Hazardous waste" means any discarded material or material intended to be discarded or substance or combination of such substances intended to be discarded, in any form which because of its quantity, concentration or physical, chemical or infectious characteristics may cause, or significantly contribute to an increase in mortality or an increase in serious irreversible, or incapacitating reversible, illness or pose a substantial present or potential hazard to human health or the environment when improperly treated, stored, transported, or disposed of, or otherwise managed;

1
EXECUTIVE SUMMARY
With 237 staff positions, the Kentucky Division of Waste Management is the second largest division in the Department for Environmental Protection. It consists of seven branches:
• Solid Waste Branch
• Recycling and Local Assistance Branch
• Hazardous Waste Branch
• Field Operations Branch
• Underground Storage Tank Branch
• Superfund Branch and
• Program Planning and Administration Branch
Selected achievements and challenges for calendar year 2014 and state fiscal year 2015:
• Household municipal solid waste (MSW) collection – Participation in household MSW collection has remained steady since legislation in 2002 began requiring waste haulers and recycling haulers to register and report to each county in which they provide service. The 2014 statewide household participation rate for MSW collection was 85.5 percent.
• Recycling – Kentuckians recycled 37.7 percent of common household recyclables (aluminum, cardboard, steel, plastic, newspaper, glass, and paper) in 2014. There was a sharp increase in ferrous scrap metals recycling in 2014, accounting for a significant increase in both total waste generated in Kentucky, from 5,821,600 tons in 2013 to 6,920,867 tons in 2014, and Kentucky’s recycling rate, from 29.6% in 2013 to 37.6% in 2014. The large increase in ferrous recycling was likely a product of natural market forces, but probably also is a reflection of anomalies in data collection and reporting. Kentuckians recycled 2,606,056 tons of all municipal solid waste in 2014, which includes sludge, concrete, compost, and asphalt in addition to the common household recyclables.
• Illegal open dumpsites – More than 25,700 illegal open dumpsites have been cleaned up since 1993. In 2014, counties cleaned up 129 illegal open dumps at a cost of $1.3 million. The average cost to clean up each dumpsite was $11,143.
• Litter along public roads – The Kentucky Pride Fund, Eastern Kentucky PRIDE, Bluegrass Greensource, Transportation Cabinet, Adopt-A-Highway, and cities and counties across the commonwealth contributed to the cleanup of 10,187,600 pounds of litter at a cost of $7.7 million during 2014. The average cost of litter picked up in 2014 was 76 cents per pound.

2
• Waste Tire Program – In FY 2015, waste tire collection events (formerly referred to as “tire amnesties”) were conducted in 50 counties in the Purchase, KIPDA, Cumberland Valley, Pennyrile, Barren River, and Green River Area Development Districts (ADDs). Standard passenger car tires weigh approximately 20 pounds, thus 20 pounds of waste tire material is considered a “passenger-tire-equivalent” or PTE. The equivalents of 688,218 waste tires were recovered through FY 2015 collection events at a cost of $983,823.
• Crumb rubber grants awarded – In 2015, the Waste Tire Trust Fund was modified to exclude playground and athletic field applications. Thus, in FY15, only eight grants totaling $105,300, primarily for landscaping applications, were awarded through the fund.
• The Division of Waste Management’s State Government Office Paper Recycling Program thrives – This program serves more than 115 agencies in Frankfort. Office paper, computer paper, newsprint, and cardboard are collected, sorted, shredded, baled and sold to a paper mill, allowing this program to operate on its own receipts. State employees recycled 1,221 tons of waste paper in 2014; approximately 225 pounds per state employee. Confidential document destruction provides a zero cost alternative to state and local governments, adding to the economic benefit of this program.
• Brownfield Redevelopment Program, KRS 224.1-415 – The program has achieved early success. In FY15, the division reviewed 49 brownfield sites and issued 21 Notice of Eligibility letters and 36 Notification of Concurrence letters to applicants who have entered the program. There were no sites pending review at the end of the fiscal year.
• Maxey Flats Project Final Capping – In September 2014, The Walker Group from Mt. Sterling, KY, was selected as the construction contractor for building the final cap. The final cap design was approved by United States Environmental Protection Agency (USEPA) in October 2014 and the contractor mobilized to the site in January to commence final cap construction. From January through May 2015, wooded areas were cleared and the haul road and drainage features were constructed. Since June 2015, 129,000 cubic yards of dirt were hauled and placed for the final cap. By mid-August 2015, over three acres of geo-synthetic liner had been installed.
• Underground Storage Tank (UST) Program Success – As a direct result of changes in the regulatory process in 2006 and 2011, the total number of UST cleanups remaining has decreased substantially over the last few years. The number of UST cleanups remaining decreased from 832 in FY14 to 757 in FY15. There were 271 No Further Action (NFA) letters issued.
• Methamphetamine Lab Cleanup Program – Through the division’s Superfund Branch, 160 contaminated residences were reported and 63 residences were decontaminated through the Methamphetamine Lab Cleanup Program in FY15.

3
INTRODUCTION
The Division of Waste Management is one of six divisions of the Department for Environmental Protection in the Energy and Environment Cabinet. The departmental strategic operational plan for state fiscal year 2015 describes the mission of the agency:
Preserve and restore Kentucky’s land through the development and implementation of fair, equitable and effective waste
management programs.
To accomplish this mission, the department has developed a set of objectives to be implemented by each division. The objectives, tactics, and measures germane to this division are:
Objective 1 – Reduce or eliminate DWM permit and data entry backlogs. Tactic 1.1 Maintain progress toward reducing and/or maintaining zero permit and
data entry backlogs.
Measures Number of hazardous waste permits pending review.
Number of hazardous waste permits pending review that are outside of regulatory timeframes.
Percentage of hazardous waste permit reviews completed within regulatory timeframes.
Percentage of hazardous waste permit reviews completed outside of the regulatory timeframe.
Number of solid waste permits pending review.
Number of solid waste permits pending review that are outside of the regulatory timeframes.
Percentage of solid waste permit reviews completed within regulatory timeframes.
Percentage of solid waste permit reviews completed outside of the regulatory timeframe.

4
Tactic 1.2 Ensure accurate data entry and reporting, and provide training and
guidance to staff and stakeholders.
Measures Number of trainings completed by DWM staff.
Number of underground storage tank owners/operators that complete the Kentucky Tank Operator On-line Learning System (KY TOOLS) training.
Objective 2 - Protect human health and enhance Kentucky’s land
resources.
Tactic 2.1 Restore or manage contamination at sites with known or suspected releases to soil or groundwater.
Measures Number of sites with known or suspected releases with potential
human exposures where no further action is required or otherwise controlled as a result of implementing a management in place technique.
Number of underground storage tank cleanups conducted that resulted in a no further action being issued and number remaining.
Number of hazardous waste program corrective actions completed and number remaining.
Number of historic landfills characterized, number remediated and number remaining.
Number of illegal open dumps remediated under the Kentucky PRIDE Program and number remaining.
Number of tire dumps remediated under the Waste Tire Trust Fund and number remaining.
Number of State Superfund sites characterized and number remediated.
Number of State-Lead sites remediated utilizing the Hazardous Waste Management Fund.
Number of sites with a release of petroleum or a petroleum product remediated from a source other than a petroleum storage tank and

5
number awaiting review.
Number of methamphetamine contaminated properties reported and number decontaminated.
Number of emergency or incident responses made and number of cases closed.
Number of cleanups conducted under state oversight via the Voluntary Environmental Remediation Program (see also DCA Brownfields measure).
Number of brownfield sites assessed under the Targeted Brownfield Assessment Program and number awaiting review.
Number of brownfield sites reviewed under KRS 224.01-415, number pending review, and number of concurrence letters issued.
Tactic 2.2 Encourage reduced waste generation and disposal by promoting beneficial reuse, recycling, waste minimization and pollution prevention.
Measures Tonnage of solid and special waste recycled or reused, by type.
Tonnage of material recycled through the State Government Recycling program.
Number of waste tires used in tire-derived fuel projects, crumb rubber grants and other beneficial reuse purposes as a percentage of number of tires generated.
Tonnage of waste recycled as a result of recycling grant program.
Tactic 2.3 Assure proper management and disposal of waste. Measures The compliance rates for authorized solid waste management
facilities.
The amount, by weight, of litter, open dump waste, recycled municipal solid waste and household hazardous waste collected by counties through the Kentucky Pride Program.
The compliance rates for authorized hazardous waste facilities.
The compliance rates for registered underground storage tanks.

6
Tactic 2.4 Plan, design and execute Final Closure Period activities at Maxey Flats
while maintaining regulatory compliance. Measures Complete design package submitted by URS and approved by EPA.
Documentation of sump abandonment completion.
Modified contract completed with URS to include sump abandonment oversight and design of the final cap.

7
SOLID WASTE WASTE.KY.GOV/SWB
The mission of the Solid Waste Branch is to ensure Kentucky’s waste is managed properly. This is accomplished by implementing a comprehensive program for solid and special waste disposal facilities. The branch reviews permit applications, issues permits, and monitors construction and operational activities at solid waste facilities. The Solid Waste Branch is responsible for reviewing technical applications and reports for all types of landfills, including residential garbage, construction debris, industrial waste, and coal ash, in addition to land application and composting facilities. The branch issues or denies construction and operation permits based on information provided by the applicant and verified by its own personnel. The branch is also responsible for the registration of solid waste permit-by-rule facilities and closure of abandoned historic landfills. As the total population in Kentucky has increased, so has waste generation. The charts below show these trends. In 2014, Kentucky’s population reached 4,413,457. This makes it imperative for residents to have easy collection services, disposal facilities, and recycling facilities. An encouraging trend is that Kentucky’s recycling rate is increasing as well. Figure 1
4,000,000
4,050,000
4,100,000
4,150,000
4,200,000
4,250,000
4,300,000
4,350,000
4,400,000
4,450,000
2003 2004 2005 2006 2007 2008 2009 2010 2011 2012 2013 2014
Total Population - Kentucky
Kentucky's PopulationSource: State Data Center

8
Figure 2
Figure 3
0
1
2
3
4
5
6
7
8
2003 2004 2005 2006 2007 2008 2009 2010 2011 2012 2013 2014
Tons
(Mill
ions
) Municipal Solid Waste Generated in Kentucky
Kentucky Waste Landfilled in KentuckyKentucky Waste RecycledKentucky Waste Landfilled Out-of-State
0
1,000,000
2,000,000
3,000,000
4,000,000
5,000,000
6,000,000
7,000,000
8,000,000
1994
1995
1996
1997
1998
1999
2000
2001
2002
2003
2004
2005
2006
2007
2008
2009
2010
2011
2012
2013
2014
Tons
Year
Municipal Solid Waste Disposal and Recycling
Kentucky WasteLandfilled in Kentucky
Out of State WasteLandfilled in Kentucky
Total Waste Landfilledin Kentucky
Kentucky WasteLandfilled Out of State
Total Kentucky WasteLandfilled
Recycled
Total WasteGenerated in Kentucky

9
Figure 4
Figure 3 shows a large increase in the total tonnage of waste generated in Kentucky in 2014. Kentucky’s recycling rate in Figure 4 also shows a very large rise, from 29.6 percent in 2013 to 37.6 percent in 2014. However, closer review of the data shows a sharp increase in ferrous scrap metals recycling in 2014 that accounts for much of the increase in the overall recycling rate and in the total waste generated. This large increase in ferrous recycling is likely a product of natural market forces, but also probably reflects anomalies in data collection and reporting. See the Recycling and Local Assistance chapter for a discussion of this recycling data. In 2014, Kentucky experienced a 4.5 percent increase in Kentucky MSW disposed of in Kentucky landfills and a 48 percent increase in the amount of out-of-state MSW disposed of in Kentucky landfills. Kentucky disposed of 4,317,851 tons of MSW in 2014, an increase of 221,041 tons from 2014.
All counties in Kentucky offer a system of universal waste collection through the form of curbside collection, drop-off centers, collection centers, or transfer stations.
0.00%
5.00%
10.00%
15.00%
20.00%
25.00%
30.00%
35.00%
40.00%19
9419
9519
9619
9719
9819
9920
0020
0120
0220
0320
0420
0520
0620
0720
0820
0920
1020
1120
1220
1320
14
Perc
enta
ge o
f Tot
al W
aste
Rec
ycle
d
Year
U.S. and Kentucky Recycling Rates
NationalRecycling RateKentuckyRecycling RateLinear (KentuckyRecycling Rate)
10
“Universal collection” is defined by KRS 224.1-010(45) as: “… a municipal solid waste collection system which is established by ordinance and approved by the cabinet and requires access for each household or solid waste generator in a county. A commercial or industrial entity which transports or contracts for the transport of the municipal solid waste it generates or which operates a solid waste management facility for its exclusive use may be excluded from participation.”
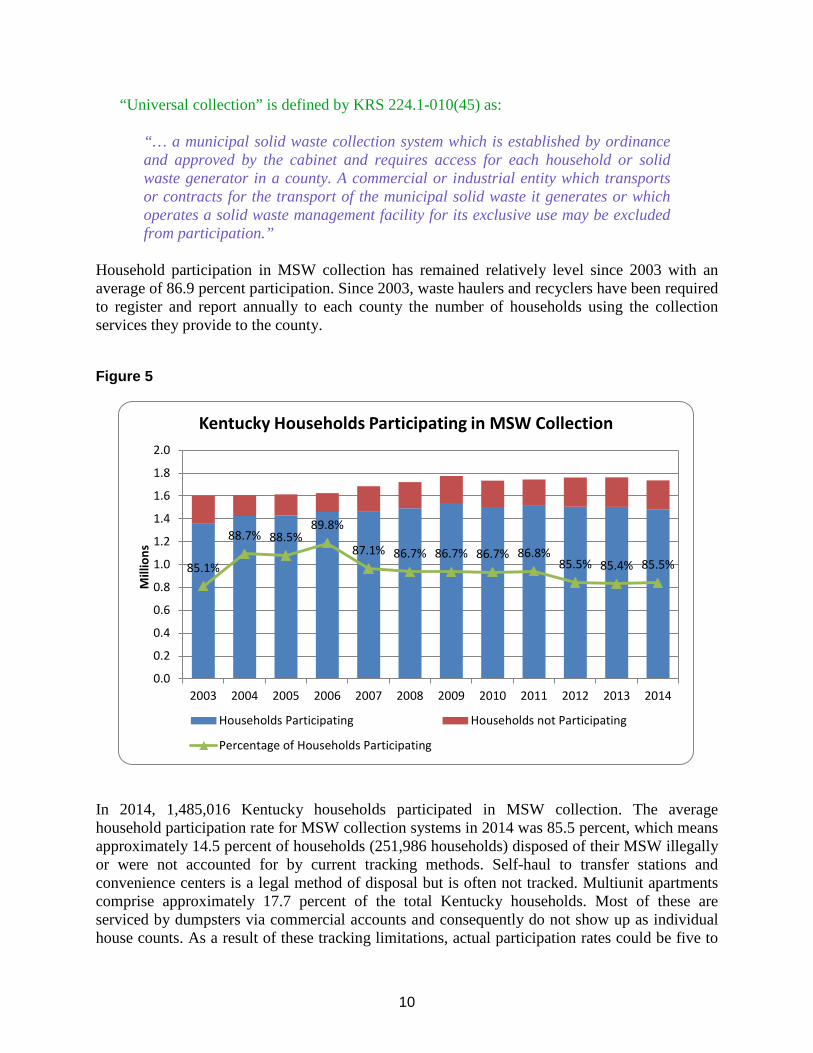
Household participation in MSW collection has remained relatively level since 2003 with an average of 86.9 percent participation. Since 2003, waste haulers and recyclers have been required to register and report annually to each county the number of households using the collection services they provide to the county. Figure 5
In 2014, 1,485,016 Kentucky households participated in MSW collection. The average household participation rate for MSW collection systems in 2014 was 85.5 percent, which means approximately 14.5 percent of households (251,986 households) disposed of their MSW illegally or were not accounted for by current tracking methods. Self-haul to transfer stations and convenience centers is a legal method of disposal but is often not tracked. Multiunit apartments comprise approximately 17.7 percent of the total Kentucky households. Most of these are serviced by dumpsters via commercial accounts and consequently do not show up as individual house counts. As a result of these tracking limitations, actual participation rates could be five to
85.1%
88.7% 88.5% 89.8%
87.1% 86.7% 86.7% 86.7% 86.8% 85.5% 85.4% 85.5%
0.0
0.2
0.4
0.6
0.8
1.0
1.2
1.4
1.6
1.8
2.0
2003 2004 2005 2006 2007 2008 2009 2010 2011 2012 2013 2014
Mill
ions
Kentucky Households Participating in MSW Collection
Households Participating Households not Participating
Percentage of Households Participating

11
ten percentage points higher than what is reflected by county reporting. The average cost per month for household curbside MSW collection was $14.99 in 2014. Solid Waste Permitting The Solid Waste Branch continues to issue the majority of permits within regulatory timeframes. This includes permits for new landfills, permit modifications for existing landfills, and permits for land application and composting facilities. There were 66 solid waste permits pending at the end of FY15, with 63 within regulatory timeframes and three exceeding regulatory timeframes. In FY15, of the 117 solid waste permit reviews completed, 114 (97 percent) were within the regulatory timeframe. Figure 6
Historical Landfills A total of 89 historic landfills have been closed through construction and remediation projects or by no further action due to intensive site studies. Total costs associated with the closure projects exceed $52 million, excluding branch personnel direct and indirect expenses. Phase I of the Butler County landfill is under construction. Costs are estimated to be approximately $2.6 million.
0
10
20
30
40
50
60
70
80
Jul-1
3
Aug-
13
Sep-
13
Oct
-13
Nov
-13
Dec-
13
Jan-
14
Feb-
14
Mar
-14
Apr-
14
May
-14
Jun-
14
Jul-1
4
Aug-
14
Sep-
14
Oct
-14
Nov
-14
Dec-
14
Jan-
15
Feb-
15
Mar
-15
Apr-
15
May
-15
Jun-
15
Solid Waste Permits Pending
Within Regulatory Timeframes Exceeding Regulatory Timeframes
12
Three historical landfill closure projects are in the design phase and will be scheduled for construction. Construction and engineering oversight costs are estimated to be approximately $6 million.
• Johnson County Landfill • Trigg County Landfill • Bullitt County Landfill
Initial characterization of 288 landfills is complete. The landfills are being prioritized based on the perceived threat to human health and the environment. The approximate cost for the initial site characterization of these sites is $3.9 million. There are 531 historical landfills remaining to be closed.
BRANCH HIGHLIGHT
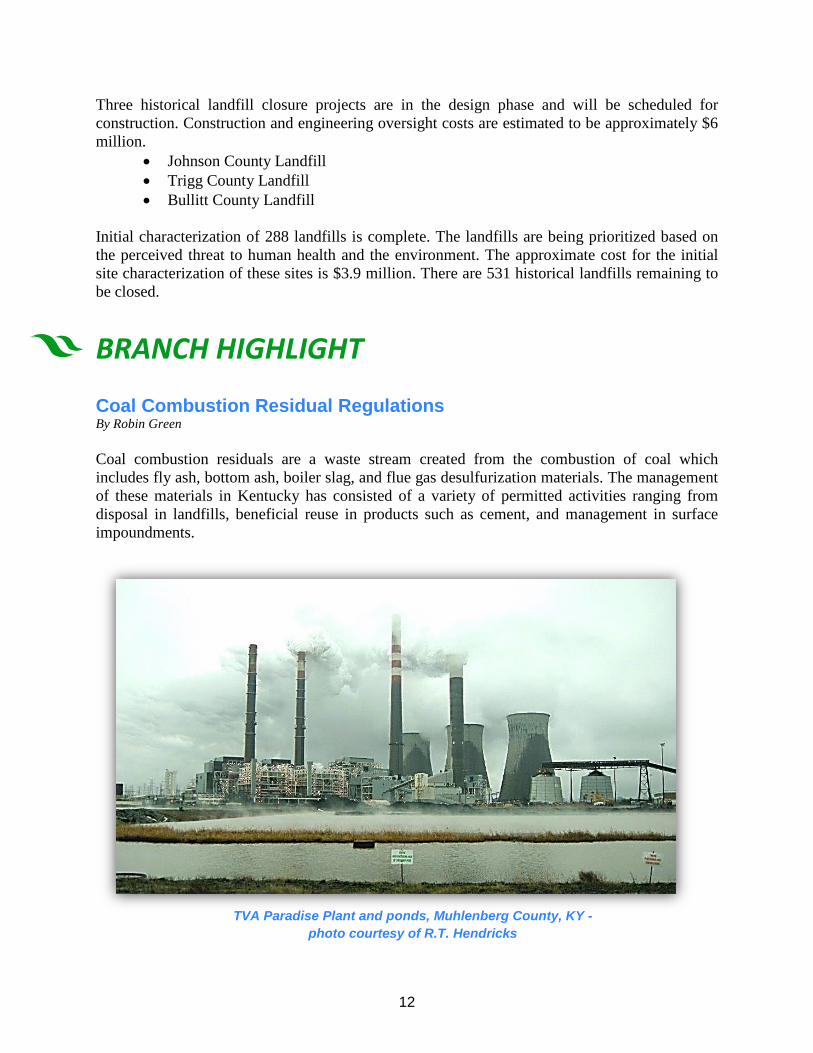
Coal Combustion Residual Regulations By Robin Green Coal combustion residuals are a waste stream created from the combustion of coal which includes fly ash, bottom ash, boiler slag, and flue gas desulfurization materials. The management of these materials in Kentucky has consisted of a variety of permitted activities ranging from disposal in landfills, beneficial reuse in products such as cement, and management in surface impoundments.
TVA Paradise Plant and ponds, Muhlenberg County, KY - photo courtesy of R.T. Hendricks
13
On April 17, 2015, the federal Environment Protection Agency published their final rule on the management of coal combustion residuals. This rule will become effective on October 19, 2015. The rule was published under Subtitle D of the Code of Federal Regulations, which is for non-hazardous wastes. The rule establishes standards for disposal of coal combustion residuals in landfills and surface impoundments which also define beneficial use as a category separate from disposal.
After the publication of the final rule, Kentucky’s Division of Waste Management chose to update the state’s existing regulations for the disposal of coal combustion residuals. In Kentucky, these materials are a subcategory of “special wastes” which also includes water and wastewater treatment residuals and a few other identified waste streams which are categorized as high volume and low hazard.
Since March of 2015, staff of the Energy and Environment Cabinet have spent over 1,600 hours reviewing existing regulations and writing new regulations to clarify management and disposal options for coal combustion residuals. Energy and Environment Cabinet staff carefully reviewed the EPA’s 201-page final rule in order to ensure Kentucky regulations will remain consistent with federal regulations. Once the regulation package has been drafted, it will be published for public review and comment. At the end of the comment period, cabinet staff will review all comments and respond to them as part of the regulation promulgation process.
14
RECYCLING & LOCAL ASSISTANCE WASTE.KY.GOV/RLA
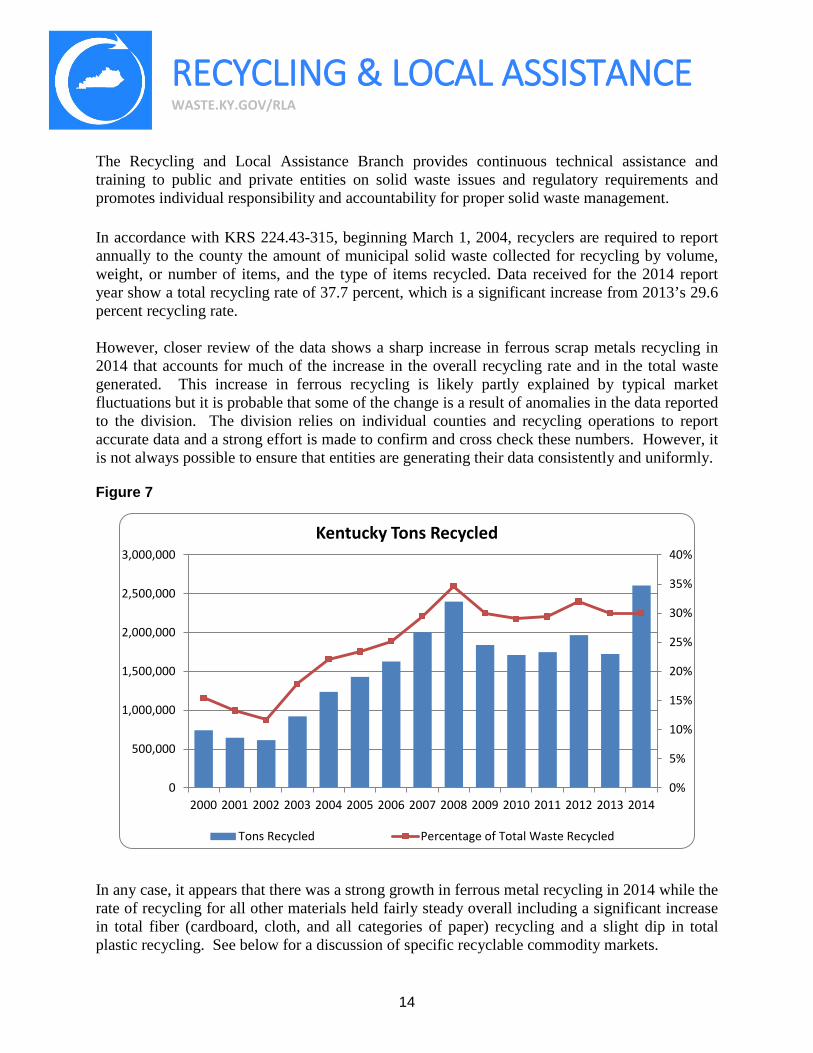
The Recycling and Local Assistance Branch provides continuous technical assistance and training to public and private entities on solid waste issues and regulatory requirements and promotes individual responsibility and accountability for proper solid waste management. In accordance with KRS 224.43-315, beginning March 1, 2004, recyclers are required to report annually to the county the amount of municipal solid waste collected for recycling by volume, weight, or number of items, and the type of items recycled. Data received for the 2014 report year show a total recycling rate of 37.7 percent, which is a significant increase from 2013’s 29.6 percent recycling rate. However, closer review of the data shows a sharp increase in ferrous scrap metals recycling in 2014 that accounts for much of the increase in the overall recycling rate and in the total waste generated. This increase in ferrous recycling is likely partly explained by typical market fluctuations but it is probable that some of the change is a result of anomalies in the data reported to the division. The division relies on individual counties and recycling operations to report accurate data and a strong effort is made to confirm and cross check these numbers. However, it is not always possible to ensure that entities are generating their data consistently and uniformly. Figure 7
In any case, it appears that there was a strong growth in ferrous metal recycling in 2014 while the rate of recycling for all other materials held fairly steady overall including a significant increase in total fiber (cardboard, cloth, and all categories of paper) recycling and a slight dip in total plastic recycling. See below for a discussion of specific recyclable commodity markets.
0%
5%
10%
15%
20%
25%
30%
35%
40%
0
500,000
1,000,000
1,500,000
2,000,000
2,500,000
3,000,000
2000 2001 2002 2003 2004 2005 2006 2007 2008 2009 2010 2011 2012 2013 2014
Kentucky Tons Recycled
Tons Recycled Percentage of Total Waste Recycled

15
The State Office Paper Recycling Program The Government Recycling Section continues to operate the State Office Paper Recycling Program, serving more than 115 agencies in Frankfort. This program continues to be self-supporting, funding nine full-time and two temporary staff positions. The program offers free pickup and free document destruction of governmental office paper. The Government Recycling Section’s location on Northgate Drive offers a secure environment to address confidentiality issues. Office paper represents 80 percent of the waste stream in the office environment. Since 2002, state employees recycled more than 19,422 tons of waste paper, generating more than $2.78 million in revenue. In 2014, state employees recycled 1,221 tons of waste paper – approximately 225 pounds per state employee. Figure 8
The Marketplace Through publication of The Marketplace newsletter, the division reports on the prevailing prices paid for aggregate recyclable materials. The following figures show the trends for various commodities.
$0
$50
$100
$150
$200
$250
$300
$350
$400
0
200
400
600
800
1,000
1,200
1,400
1,600
1,800
2,000
2002 2003 2004 2005 2006 2007 2008 2009 2010 2011 2012 2013 2014Re
venu
e (T
hous
ands
)
Tons
State Office Paper Recycling Totals
Total Amount of Recycled Paper Revenue

16
Figure 9
Notes:
∗ “Newsprint #8” means baled sorted newspaper, with no sun exposure, with the typical amount of slick advertising inserts, as would be delivered to a home or at a newsstand.
∗ “Newsprint #6” means baled newspaper that typically has more advertising slicks, paper and plastic bags, magazines, and types of paper other than newsprint.
∗ “Sorted Office” means an assortment of white, colored and coated, ground wood-free copier and printer paper.
∗ “Mixed Paper” means a lower grade of material that includes slick advertising inserts, junk mail, paperboard containers and other types of paper mixed together.
∗ “Sorted White Ledger” means white paper such as stationery, copy paper, book pages, and printing papers (free of ground wood fiber).
∗ “Corrugated Containers” means, typically, brown cardboard boxes.
Recovered paper prices have remained stagnant due in large part to significantly reduced export to China and lower domestic generation and mill use. China has also begun increasing their own domestic recovery/recycling programs in order to protect their citizenry from the negative effects of the declining export economy, which will further negatively affect their use of U.S. recyclable paper stock.
The expected increase in U.S. domestic use of recycled paper has not materialized to date. The use of Sorted White Ledger (SWL #40) and Sorted Office Paper (SOP #37) remains steady, primarily in tissue and toweling manufacturing but, improved prices have not materialized.
0
50
100
150
200
250
Jul-1
3Au
g-13
Sep-
13O
ct-1
3N
ov-1
3De
c-13
Jan-
14Fe
b-14
Mar
-14
Apr-
14M
ay-1
4Ju
n-14
Jul-1
4Au
g-14
Sep-
14O
ct-1
4N
ov-1
4De
c-14
Jan-
15Fe
b-15
Mar
-15
Apr-
15M
ay-1
5Ju
n-15
$/To
n Fiber Recyclables Market ($/Ton)
Mixed Paper Sorted Office Newsprint #6Newsprint #8 Sorted White Ledger Corrugated Containers

17
Except for the need for 40 – 60% Newsprint (#6 and #8 ONP) in boxboard manufacturing, ONP has become a dying grade due to the popularity of electronic news and social media over print media.
Recycled content packaging and container production has remained steady or declined slightly in FY 2014, with the much anticipated packaging production increases expected somewhere in FY 2015-16.
Figure 10
The price paid for number one plastic, polyethylene teraphthalate (PET #1) typically known as “soda bottles” has seen continued stagnation as the price for natural gas (which virgin PET is made from) has fallen due to improved extraction methods (fracking), making virgin resin more competitive with recycled PET. Except for a short term “bump” due to the effects of the “Green Fence” initiative in China, PET shipments were brought to a crawl as quality issues were sorted out. Also, with limited export movement for most of the year, an oversupply of material has continued to be left on the domestic market, much of which is now being warehoused in hopes of strengthening demand and increasing prices in FY16. Prices for number two, high density polyethylene (HDPE #2) typically known as “milk jugs”, has also slowed over the last fiscal year. Again, the slowing pace of the booming Chinese economy has lowered export volume and prices since China purchases 30 - 40% of all U.S. recyclable plastic produced. Export shipment of all plastics is the key to improving pricing and increased domestic demand for this material.
0
10
20
30
40
50
60
Jul-1
3Au
g-13
Sep-
13O
ct-1
3N
ov-1
3De
c-13
Jan-
14Fe
b-14
Mar
-14
Apr-
14M
ay-1
4Ju
n-14
Jul-1
4Au
g-14
Sep-
14O
ct-1
4N
ov-1
4De
c-14
Jan-
15Fe
b-15
Mar
-15
Apr-
15M
ay-1
5Ju
n-15
cent
s/lb
.
Plastic Recyclables Market (cents/lb.)
PET HDPE

18
Figure 11
Glass prices remained at levels established two years ago due to the combination of increased interest in recycled content in glass containers (particularly wine bottles) and the shortage of clean recyclable cullet available since the widespread advent of “single stream” recycling collection. Cross contamination of all commodities, especially glass bottles and jars, required manufacturers that use recyclable cullet to increase pricing to stimulate the generation of more clean material suitable for their use in making new glass containers. Unfortunately, glass usage continues to decline against plastic and aluminum containers, leaving huge amounts of recyclable cullet with no market. With only one recovered bottle used to make three new bottles (33% recycled content) glass bottle to bottle recycling will never reach equilibrium. Recycling bottles and jars into fiber glass insulation continues to grow but is largely dependent on the growth of the house building market.
0
5
10
15
20
25
30
35Ju
l-13
Aug-
13Se
p-13
Oct
-13
Nov
-13
Dec-
13Ja
n-14
Feb-
14M
ar-1
4Ap
r-14
May
-14
Jun-
14Ju
l-14
Aug-
14Se
p-14
Oct
-14
Nov
-14
Dec-
14Ja
n-15
Feb-
15M
ar-1
5Ap
r-15
May
-15
Jun-
15
$/To
n Glass Recyclables Market ($/Ton)
Clear Amber Green

19
Figure 12
Recycling prices for aluminum cans remain depressed, as are all non-ferrous scrap metal prices, due to lower demand as economies remain stagnant worldwide. China’s use of lower grades of non-ferrous scrap has continued to keep scrap copper prices low. Solid growth in world markets will be necessary to advance prices to even close to previous levels. Steel prices have continued to be severely depressed due primarily to decreased use of new steel worldwide for new construction, other than for automobiles and drastically limited export movement. Sustaining growth of ferrous scrap user economies, such as China, India, Turkey, Brazil and Japan, will be needed to drive pricing up, both for export and domestic markets. Waste Tire Trust Fund
The Waste Tire Trust Fund was reauthorized by the General Assembly in the 2014 session and will remain in effect until June 30, 2016. The cabinet submitted a report to the General Assembly in January 2014 recommending that the program continue to be reauthorized. Funding comes from a one dollar fee on the sale of all new motor vehicle tires sold in Kentucky. The fund is used to conduct waste tire collection events, provide annual funding directly to counties for waste tire management, award crumb rubber grants, facilitate market development for the use of waste tires, and clean up waste tires at sites where tires have been mismanaged. In 2011, the General
0102030405060708090
0
20
40
60
80
100
120
140
Jul-1
3Au
g-13
Sep-
13O
ct-1
3N
ov-1
3De
c-13
Jan-
14Fe
b-14
Mar
-14
Apr-
14M
ay-1
4Ju
n-14
Jul-1
4Au
g-14
Sep-
14O
ct-1
4N
ov-1
4De
c-14
Jan-
15Fe
b-15
Mar
-15
Apr-
15M
ay-1
5Ju
n-15
cent
s/lb
.
$/G
ross
Ton
Metal Recyclables Market
Steel Cans($/gross ton) Aluminum (¢/lb.)
Daviess County Waste Tire Collection Event (WTCE), Owensboro, KY - photo by Chris Craig, June 2015

20
Assembly passed House Bill 433, which established a Waste Tire Working Group to advise the cabinet on, among other things, administering and implementing alternative methods for controlling waste tires, developing a formula to apportion money in the Waste Tire Trust Fund, and preparing a report for the General Assembly. Also beginning in 2011, the cabinet made a $3,000 annual grant available to counties for recycling or disposal of waste tires. Since that time, the annual grant amount has been increased from $3,000 to $4,000 annually.
In FY 2015, waste tire collection events (formerly referred to as “tire amnesties”) were conducted in 50 counties in the Purchase, KIPDA, Cumberland Valley, Pennyrile, Barren River and Green River Area Development Districts (ADDs). Standard passenger car tires weigh approximately 20 pounds. Thus, 20 pounds of waste tire material is considered a “passenger-tire-equivalent” or PTE. The equivalents of 688,218 waste tires were recovered through FY 2015 collection events at a cost of $983,823. Kentucky Pride Fund
The environmental remediation fee of $1.75 per ton of waste disposed in Kentucky is placed into the Kentucky Pride Fund. This money is used for closure of historical landfills, debt service, recycling grants, household hazardous waste management grants, and remediation of illegal open dumps. Litter Abatement - The division began tracking the cost of litter activities and the number of bags of litter collected in 2001. State litter abatement grant funding through the Kentucky Pride Fund began in fiscal year 2002. The cabinet receives $5 million annually from the Transportation Cabinet for distribution to counties and incorporated cities for litter abatement activities. In 2014, counties cleaned up 509,380 bags of litter on 168,873 miles of roadways. A total of 10,187,600
Crumb Rubber Grants - From 2004–2015, the cabinet awarded 422 grants totaling more than $7.54 million to local governments, schools, daycares, churches and other entities for the use of crumb rubber made from recycled tires for athletic fields, playgrounds, walking trails, landscaping, gym floors, etc. In 2015, the program was modified to exclude playground and athletic field applications. Eight grants were awarded for a total of $105,300, primarily for landscaping applications. Funding for the crumb rubber grants comes from the Waste Tire Trust Fund - photo by Lisa Evans, June 2015.

21
pounds of litter was collected by counties through the Kentucky Pride Fund in 2014. Litter collection costs totaled $7.7 million, an average cost of 76 cents per pound. Most of the items found on roadways are plastic bottles and food containers. Litter collection is costly, at $1,525 per ton, when compared to the average landfill disposal rate of $38.95 per ton. Figure 13 shows a significant variation of dollars spent per number of bags collected over the last eleven years. This is likely due to a number of factors, including the fact that collection and recordkeeping procedures may not be uniform among the counties, and expenses such as education and outreach that do not contribute to the number of bags collected can vary considerably from year to year. Figure 13
Note: The amount of litter collected on public roads may not include litter collected by state road crews as part of the Department of Transportation’s efforts to maintain state roads. Recycling and Household Hazardous Waste - In 2006, the Kentucky Pride Fund was amended to provide grants for the development and expansion of recycling programs and household hazardous waste (HHW) management. In 2015, 71 entities were awarded grants for a total of over $3.3 million. Forty-six recycling grants were awarded to cities, counties, and universities. Twenty-five HHW grants were awarded. These grants are to help fund the establishment or expansion of recycling operations. Materials collected during HHW events included e-scrap, pesticides, solvents, mercury and other HHW products found around the home. These events were made possible by the Kentucky Pride Fund. The grants require a 25 percent local match in the form of cash or “in-kind” personnel, educational activities/materials and advertising to promote the program from the cities or counties receiving the awards. The grants are funded through the $1.75 environmental remediation fee paid on each ton of waste disposed
$0
$1
$2
$3
$4
$5
$6
$7
$8
$9
$10
0
100,000
200,000
300,000
400,000
500,000
600,000
700,000
800,000
900,000
2004 2005 2006 2007 2008 2009 2010 2011 2012 2013 2014
Dolla
rs S
pent
Col
lect
ing
(Mill
ions
)
Num
ber o
f Bag
s Co
llect
ed
Litter Abatement
Number of Bags Collected Dollars Spent Collecting

22
of in Kentucky landfills. The goal of the program is to build recycling infrastructure and fund HHW management collection events in areas where few of these opportunities for citizens exist, with an emphasis on regional cooperative efforts. In FY15, approximately 243.85 tons of household hazardous waste were collected by counties through the Kentucky Pride Fund. Cleanup of Illegal Open Dumps - More than 25,700 illegal open dumpsites have been cleaned at a cost of $76.9 million dollars since 1993. In 2014, counties cleaned 129 illegal open dumps at a cost of $1.3 million. Through the Kentucky Pride Fund, counties collected 4,281 tons of illegal open dump waste in 2014. The average cost to clean each dumpsite was $11,143. There were 136 known dumpsites remaining at the end of 2014 and the number of remaining illegal open dumps is decreasing. Figure 14
Financial assistance, through the Kentucky Pride Fund Illegal Open Dump Grant Program, has provided counties the incentive and the necessary financial help to identify and rid their communities of old dumpsites. Since 2006, this program has funded the cleanup of 2,069 dumpsites at a cost of more than $14.4 million. The eleventh round of illegal open dump grants was awarded in January 2015 for the remediation of 104 dumpsites at a projected $1.1 million.
$0.0
$1.0
$2.0
$3.0
$4.0
$5.0
$6.0
$7.0
0
200
400
600
800
1,000
1,200
1,400
1,600
2003 2004 2005 2006 2007 2008 2009 2010 2011 2012 2013 2014
Cost
of C
lean
ups (
Mill
ions
)
Num
ber o
f Dum
ps
Illegal Open Dump Cleanups and Expenditures
New Dumps Dumps Cleaned Up Dumps Remaining Cost

23
E-Scrap Recycling
Collection of waste computer and electronic parts and equipment (e-scrap) continues to grow in the state, with over 50 counties reportedly offering some type of e-scrap collection, whether year-round e-scrap drop-off programs, periodic events, or annual events. Nearly 3,000 tons of e-scrap was reported to have been collected in 2014 which, while slightly less than reported in 2013, is reasonable considering that the backlog of old televisions and other e-scrap previously stored in people’s attics and garages are now entering the recycling stream. Beginning in 2008, the Kentucky Pride Fund Program provided grant awards for the management of HHW, a category that includes e-scrap and mercury. In 2014, 23 counties held HHW collection events, most of which included collecting e-scrap.
Since 2008, the state has had an e-scrap contract awarded by the Finance and Administration Cabinet. Currently the vendor is Global Environmental Services (GES) headquartered in Georgetown, KY, (http://waste.ky.gov/RLA/recycling/Pages/ElectronicsRecycling.aspx). This “all-agency” contract allows the executive, judicial, and legislative branches of government, school districts, universities, and any other public not-for-profit organization convenient access to e-scrap recycling. The contract provides for statewide pickup and recycling services with effectively zero percent of the scrap going to commonwealth landfills. This contract is unique in that the vendor pays the agency, school district, university or local government for the majority of items aggregated for recycling. From January 2009 to July 2014, over 7,557 tons of e-scrap have been collected from over 600 locations and refurbished or recycled in an environmentally sound and data secure manner. Payments to generators have netted over $445,000. An additional 301 net tons and $37,434 in payments have been generated under the new contract with GES to date.
BRANCH HIGHLIGHT
The Kentucky Government Recycling Section By Kitt Tuttle The Kentucky Government Recycling Section (KGRS) is one of the three sections that comprise the Recycling and Local Assistance Branch (RLA). The KGRS offers free waste-paper collection and confidential document destruction to 115 State agencies, typically collecting two to three millions pounds of paper and cardboard each year. They are some of the most visible members of the Division of Waste Management in Frankfort, as they interface with all three branches of state government and multiple cabinets while performing collections. Brian Bentley has been the KGRS supervisor for the past nine years.
24
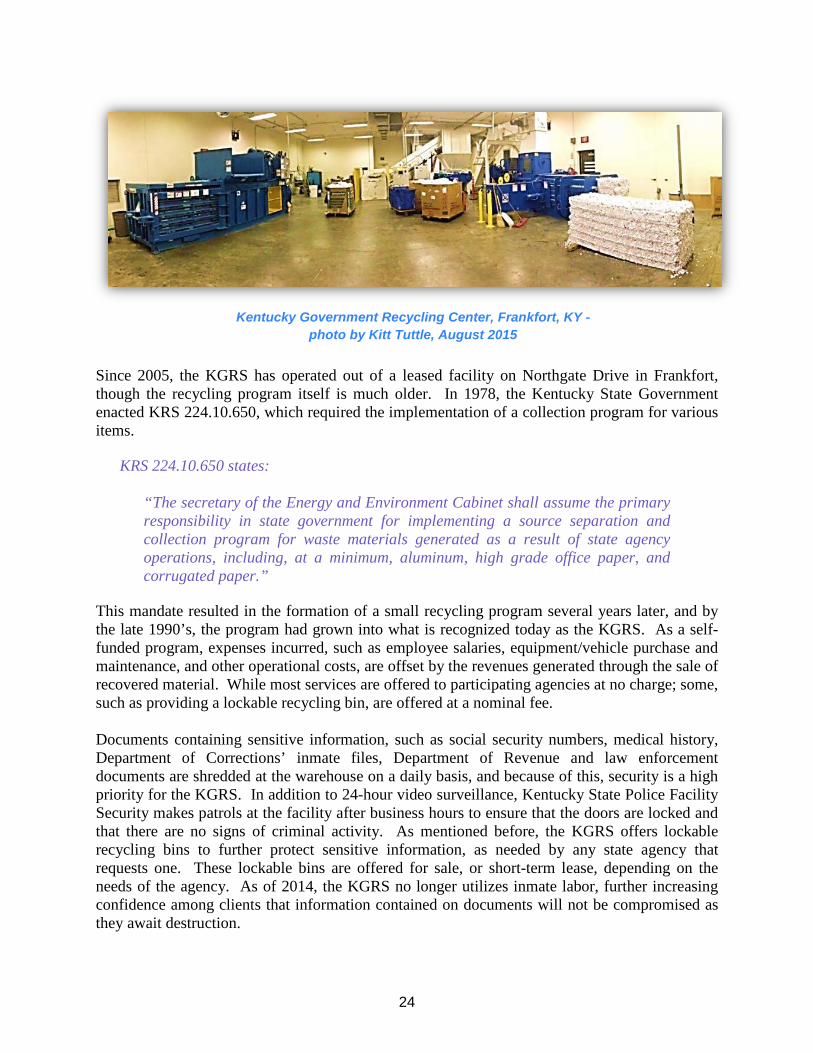
Since 2005, the KGRS has operated out of a leased facility on Northgate Drive in Frankfort, though the recycling program itself is much older. In 1978, the Kentucky State Government enacted KRS 224.10.650, which required the implementation of a collection program for various items.
KRS 224.10.650 states:
“The secretary of the Energy and Environment Cabinet shall assume the primary responsibility in state government for implementing a source separation and collection program for waste materials generated as a result of state agency operations, including, at a minimum, aluminum, high grade office paper, and corrugated paper.”
This mandate resulted in the formation of a small recycling program several years later, and by the late 1990’s, the program had grown into what is recognized today as the KGRS. As a self-funded program, expenses incurred, such as employee salaries, equipment/vehicle purchase and maintenance, and other operational costs, are offset by the revenues generated through the sale of recovered material. While most services are offered to participating agencies at no charge; some, such as providing a lockable recycling bin, are offered at a nominal fee. Documents containing sensitive information, such as social security numbers, medical history, Department of Corrections’ inmate files, Department of Revenue and law enforcement documents are shredded at the warehouse on a daily basis, and because of this, security is a high priority for the KGRS. In addition to 24-hour video surveillance, Kentucky State Police Facility Security makes patrols at the facility after business hours to ensure that the doors are locked and that there are no signs of criminal activity. As mentioned before, the KGRS offers lockable recycling bins to further protect sensitive information, as needed by any state agency that requests one. These lockable bins are offered for sale, or short-term lease, depending on the needs of the agency. As of 2014, the KGRS no longer utilizes inmate labor, further increasing confidence among clients that information contained on documents will not be compromised as they await destruction.
Kentucky Government Recycling Center, Frankfort, KY - photo by Kitt Tuttle, August 2015
25
There is no shortage of demand for the program as it continues to be successful and profitable today. The nine full-time employees and one temporary employee perform weekly pick-up runs to various government buildings, as well as separate and process the material at the warehouse for shipment and sale. Over the last decade, the program has recycled over 33 million pounds of fiber products, and has generated approximately $2.5 million in sales. In fiscal year 2014 alone, the program recovered almost 2.5 million pounds of fiber products, and earned approximately $189,000 through sales of the material. Over the years, receipts from sales have allowed for several upgrades in equipment. In 2012, the program had generated sufficient funds for the purchase of a new paper shredder and baler for the warehouse, replacing old equipment and increasing efficiency. In FY 2015, the program purchased two new pieces of machinery; the first was a new recycling truck, which allows the KGRS to send out more employees on each pick-up run, as well as bring back more material during each pick-up. The second was a new cardboard baler that has the capability to bale 2,000 pounds at a time, an increase over the previous baler’s capacity of 800 to 900 pound bales, which allows for more cardboard to be processed for shipment in less time. Additionally, the KGRS re-bid its recycling contract this past year and now will be marketing recovered material through Central Kentucky Fiber Resources of Lexington, Kentucky. As the Department for Environmental Protection prepares to move to its new building on Sower Boulevard in Frankfort next year, the KGRS has been preparing as well. The department has been purging obsolete documents over the past year, with more to come, resulting in an influx of paper to the program. While most purged documents have been from the Energy and Environment Cabinet, the KGRS expects other cabinets affected by the move to begin purging large amounts of paper over the next year to prepare for relocation. The KGRS is also preparing to expand its operation as the new state building opens. There are plans to place a cardboard baler on-site in the new building, and there is research being done into the purchase of new recycling bins, as well. While meeting current demands, there is still potential for growth, and the KGRS is always pursuing new sources of waste paper. The RLA branch plans to increase outreach to all agencies to improve efficiency and encourage participation in the recycling process.

26
HAZARDOUS WASTE WASTE.KY.GOV/HWB
The Hazardous Waste Branch oversees the management of hazardous waste from generation to disposal. This involves the promotion of hazardous waste minimization, hazardous waste management, and remediation of hazardous waste releases. These activities are accomplished through permitting, corrective action, registration, and reporting requirements. Hazardous Waste Corrective Actions
The major activities the Corrective Action Section completed during the 2015 fiscal year are listed below. It is noteworthy that, through many years of work, only one state-lead site remains to achieve the “Human Exposures Controlled” and “Groundwater Releases Controlled” designation, two measures of progress tracked by the U.S. EPA and Congress. The section has continued to meet or exceed U.S. EPA progress goals for environmental indicators determinations, groundwater monitoring system inspections, renewal and issuance of post-closure permits, and the review of work plans and reports. Significant activities of interest conducted during this time period included a multi-media investigation in the vicinity of Federal Mogul (Scottsville), a vapor intrusion study at Naval Ordnance (Louisville), extensive remediation on Philips Lighting (Danville) and neighboring property, numerous interim measures at Arkema (Calvert City), and an investigation at Osram Sylvania (Versailles). Environmental Indicators Determinations Completed
In FY15, ten environmental indicators determinations were completed. There were a total of three human exposures controlled at the following sites: Calgon Carbon, Safety Kleen (Ashland), and Safety Kleen (Lexington). Four groundwater releases were controlled at the following sites: Hallmack, Safety Kleen (Ashland), Safety Kleen (Lexington), and The Chemours Company. Remedies were selected for Hallmack and Monument Chemical Kentucky, and a remedy was constructed at General Electric (Louisville).
Groundwater Monitoring System Evaluations Conducted
In FY15, nine groundwater monitoring system evaluations were conducted. Operations and maintenance inspections were conducted at the following sites: IPSCO Tubulars, Kelley Technical Coatings – Plant 2, Koppers, Owensboro Riverport Properties, Rohm and Haas, and Wald. Groundwater monitoring evaluations were conducted at Florida Tile and Fort Knox.
Post-Closure Permits Renewed/Issued/Tentatively Terminated
In FY15, four post-closure permits were renewed, issued, or tentatively terminated. Koppers and Thomas Industries had permits renewed, a new permit was issued to Continental Refining, and Alabama Wire Products’ permit was terminated.
27
Investigation and Remediation Work Plans and Reports Found Deficient or Approved
In FY15, 34 investigation and remediation work plans and reports findings were reported. An investigation deficiency notification was issued to Kelley Technical Coatings. Investigation approvals were issued to the following sites: Arkema, BGAD (two), BGCAPP, Chemours, Federal Mogul (four), Fort Knox (two), Kelley Technical Coatings (two), Naval Ordnance, and Rohm and Haas. An interim measures deficiency notification was issued to Arkema. Interim measures approvals were issued to the following sites: Arkema, BGAD, Custom Resins, and Fort Knox. Corrective measures deficiency notifications were issued to Rohm and Haas (two) and Custom Resins. A corrective measures approval was issued to General Electric (Louisville), and a miscellaneous deficiency notification was issued to Kelley Technical Coatings. Miscellaneous approvals were issued to BGAD, Gates Corporations, General Electric (Lexington), Fort Campbell, LBAD, Rohm and Haas, and PMC Organometallix (two).
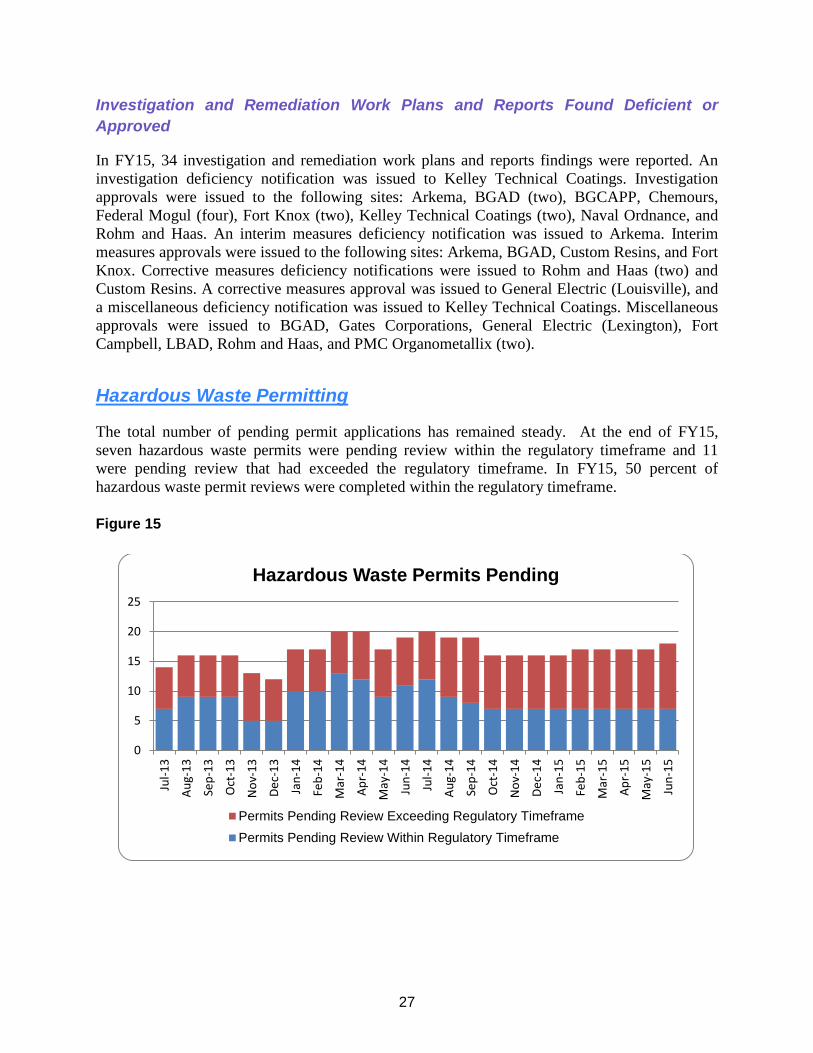
Hazardous Waste Permitting
The total number of pending permit applications has remained steady. At the end of FY15, seven hazardous waste permits were pending review within the regulatory timeframe and 11 were pending review that had exceeded the regulatory timeframe. In FY15, 50 percent of hazardous waste permit reviews were completed within the regulatory timeframe. Figure 15
0
5
10
15
20
25
Jul-1
3
Aug-
13
Sep-
13
Oct
-13
Nov
-13
Dec-
13
Jan-
14
Feb-
14
Mar
-14
Apr-
14
May
-14
Jun-
14
Jul-1
4
Aug-
14
Sep-
14
Oct
-14
Nov
-14
Dec-
14
Jan-
15
Feb-
15
Mar
-15
Apr-
15
May
-15
Jun-
15
Hazardous Waste Permits Pending
Permits Pending Review Exceeding Regulatory TimeframePermits Pending Review Within Regulatory Timeframe

28
BRANCH HIGHLIGHT
Blue Grass Army Depot By Dale Burton The Blue Grass Army Depot (BGAD) is situated in Madison County, KY, six miles southeast of Richmond and 30 miles southeast of Lexington. This 14,600 acre facility was originally established in April of 1942 for the receipt, issuance, storage, maintenance, and disposal of ammunition.
The present day mission of BGAD is to provide munitions, chemical defense equipment, and special operations support to the Department of Defense (DoD).
Aerial photo of the BGCAPP construction site - photo courtesy of U.S. Army PEO-ACWA, June 2015
29
There are several types of hazardous waste storage and treatment operations at BGAD which either have or will require a hazardous waste permit, including:
• Storage of conventional hazardous wastes managed by BGAD;
• Storage of chemical munitions and associated wastes managed by the tenant Blue Grass Chemical Activity (BGCA);
• A Research, Development, and Demonstration (RD&D) permit (currently in effect) that will
later be developed into a full Part B permit. The RD&D permit allows for changes to the process design during the construction and pilot testing stages of the Blue Grass Chemical Agent-Destruction Pilot Plant (BGCAPP). The BGCAPP facility will destroy munitions containing nerve agents GB and VX;
• Under review – permit modification to allow for the open burn/open detonation/confined detonation chamber (OB/OD/CDC) operations for conventional munitions. These units are currently under interim status; and
• Under review – permit modification to allow the destruction of mustard projectiles using explosive destruction technology (EDT).
Construction of the BGCAPP main plant was determined to be substantially complete as of July 31, 2015. Construction of the EDT facility is ongoing and will be completed by early 2016. The systemization process, which includes verifying that all systems and control equipment are in place and operating properly, as well as developing detailed procedures and training staff, is ongoing and will continue through the start of operations. The current schedule is for EDT operations to begin in March 2017 and be completed close to the end of that year. The BGCAPP main plant is scheduled to begin operations in 2018 and be complete by 2020, with final closure in 2025. For more information on BGCAPP: http://www.peoacwa.army.mil/bgcapp/ For more information on BGAD/BGCA: http://www.bluegrass.army.mil/Default.aspx For public participation information: http://www.peoacwa.army.mil/bgcapp/public-involvement-at-bgcapp/

30
BRANCH HIGHLIGHT
Paducah Gaseous Diffusion Plant By Brian Begley The Paducah Gaseous Diffusion Plant (PGDP), an EPA Superfund site listed on the National Priorities List, was until recently an operating uranium enrichment facility. The facility is owned by Department of Energy (DOE) and leased and operated by the United States Enrichment Corporation (USEC). The PGDP was constructed in 1952 by the U.S. Atomic Energy Commission at the site of the former Kentucky Ordnance Works, a TNT production facility used during World War II. The original mission of the PGDP was production of highly enriched uranium to fuel military reactors used to produce nuclear weapons. In recent decades, the PGDP has produced low enriched uranium fuel for commercial nuclear power plants. In May 2013, USEC announced that it would no longer continue operating the PGDP and in fact has ceased operations. USEC continued work at the facility to render it safe for transfer back to the DOE in October 2014. Fluor Federal Services, Inc. was awarded the prime contract for deactivation of the facility and will also take over management of environmental remediation efforts starting in late July 2015. During the PGDP’s operating lifetime, soils, sediments, groundwater and structures have become contaminated and require remediation. Soils and sediments at the site have been found to contain PCBs, radionuclides, and some heavy metals. Groundwater is contaminated primarily with trichloroethene (TCE) and technetium-99, a radionulclide. Remediation efforts at PGDP are prioritized and managed according to an Operable Unit (OU) strategy. An OU includes contaminated or potentially contaminated areas that share a common media (e.g., groundwater, surface water, sediment, soil) and similar exposure pathways (ingestion, inhalation, dermal exposure). For example, the Surface Water OU includes all surface water and associated sediment on the site (common media) where human exposure to contamination may occur through ingestion, dermal exposure, or perhaps through the consumption of fish tissue. Other OUs currently being addressed at the site include the Groundwater OU, the Decontamination and Decommissioning OU, the Soils OU, and the Burial Grounds OU. In 2014, the primary Groundwater OU initiatives were remediation of TCE contaminated soils at the C-400 Cleaning Building and at the C-747-C Oil Landfarm. TCE is a chlorinated industrial solvent (and probable human carcinogen) that in the past was often used as a degreaser for metal parts. TCE is a dense non-aqueous phase liquid (DNAPL) that is denser than water and does not dissolve readily in water. Consequently, TCE typically sinks when spilled onto the ground or discharged into subsurface soils. As it sinks, the TCE DNAPL leaves residual traces in the shallower soils. This is what occurred at both the C-400 Cleaning Building and at the Oil Landfarm. The C-400 Cleaning Building is the source of much of the TCE that now contaminates over a billion gallons of groundwater at the site. TCE used to remove grease from parts leaked into the

31
ground at this location and eventually made its way into the groundwater. The second phase of an Electrical Resistance Heating (ERH) remedy intended to address a portion of the estimated 75,000 gallons of TCE thought to have been released to the environment. ERH is used to heat the soils near the C-400 Building. The heat vaporizes the TCE so that it can be removed from the soil via extraction wells which are operated under a vacuum. Once this phase of the C-400 remedy is complete a final phase will be initiated to address TCE present at greater depths within an aquifer. A technology other than ERH will be used to address this contamination due to a confirmed inability of ERH to adequately heat deeper aquifer materials. A treatability study is underway to evaluate the use of steam-enhanced extraction and preliminary results look promising. The Oil Landfarm was historically used as a dumping ground for various waste oils and associated contaminants. These contaminants included TCE. The technology selected to address this contamination consists of a slew of proven technologies, commonly referred to as a treatment train. At the Oil Landfarm, an auger, eight feet in diameter, will mix the soil while steam is injected to heat the subsurface soils above the boiling point of TCE. A 12-ft diameter shroud sits overtop the boring and a vacuum is pulled during the steam injection process where the vapor and liquid pass through activated carbon units. The steam injection process can be repeated until vapor concentrations diminish throughout the mixing column. As a polishing step, a final treatment pass is completed where zero valent iron is injected to destroy any residual TCE. Field implementation of this remedy began in 2015. The Decontamination and Decommissioning (D&D) OU was created to address structures that have no further use at the site and consisted of 32 inactive facilities. Most recently, D&D activities at the PGDP have involved the demolition of the C-340 Metals Reduction Plant and the demolition of the former C-410/420 Feed Plant. The C-410/420 Feed Plant demolition and waste disposition was completed by mid-2015. The slabs and underlying contaminated soils at both of these facilities will be addressed under the Soils & Slabs Operable Unit, which has yet to be scheduled. The Burial Grounds OU consists of eleven solid waste management units (SWMU) or burial areas, each with their own designation. During 2014-2015, Burial Ground OU activities included the continuing characterization of the SWMU 4 Burial Yard and review of the SWMUs 2, 3, 7 and 30 burial grounds feasibility study and SWMUs 5&6 Proposed Plan. The fourth phase of the SWMU 4 characterization effort is being completed and will be followed by a trenching and final phase. It is anticipated that portions of SWMU 4 will be excavated at some point in the future since this unit is believed to be a contributor to groundwater contamination. Remedial actions to address the SMWUs 2, 3, 7, and 30 burial grounds are being evaluated as alternatives in a feasibility study which is currently under review. The division’s review of the Proposed Plan for the SWMU 5&6 burial grounds has been temporarily placed on hold pending a decision on the potential citing of an on-site Waste Disposal Facility (OSWDF). A potential site for this facility encompasses the SWMUs 5 & 6 footprint and could impact remedy selection for these two burial grounds. Even when accounting for current delays, an action to address SWMUs 5&6 will likely occur several years before any action to address the other burial grounds.

32
The Waste Disposal Options (WDO) project is concerned with determining if building an OSWDF is a viable option at the PGDP. A feasibility study currently under review attempts to compare and contrast the various waste disposition options available. According to this study, approximately $500 million dollars could be saved if wastes were dispositioned within a newly constructed on-site landfill rather than being shipped to the western U.S. for disposal. The division is continuing to evaluate the efficacy of constructing a new landfill at the PGDP. In FY 2014 DOE secured funding to expedite investigation for the Soils OU project. Work plans are being finalized under an expedited schedule for Soils OU projects with the investigations scheduled for completion in 2015. U.S. DOE and contractors submitted a permit application for the facility’s storage, treatment and post-closure care 10-year permit reissuance in 2014. The application is currently under review with plans to reissue the permit in 2015. Initial scoping for the 2015 Site Management Plan occurs annually. The division is interested in beginning discussions for schedules pertaining to the D&D of the gaseous diffusion plant. In 2014, the division continued to conduct independent sampling at the PGDP in close proximity to known zones of groundwater contamination. The purpose of this sampling was to evaluate and substantiate DOE’s sampling procedures and to verify the quality of their laboratory analysis. Split sampling was also conducted at select wells associated with the C-746-U Solid Waste Landfill and the C-404 Hazardous Waste Landfill. In general, the division’s laboratory results have been similar to those reported by DOE. The division continues to sample private water wells to insure that groundwater contamination has not expanded beyond the area within which DOE supplies municipal water to residents.

33
FIELD OPERATIONS WASTE.KY.GOV/FOB
The mission of the Field Operations Branch is to identify and abate imminent threats to human health and the environment through fair and equitable inspections, technical assistance and education. The branch performs inspections at sites managing solid waste, hazardous waste, underground storage tanks (USTs) and polychlorinated biphenyls (PCBs). The primary duty of a regional inspector is to inspect for the compliance of regulated facilities. The branch includes a central office and ten waste management regional offices located throughout Kentucky. Regional staff is familiar with the local waste management issues and can respond to questions and concerns. Figure 16
During FY15, the Field Operations Branch conducted 6,866 UST, solid waste, and hazardous waste inspections. This was a six percent increase over FY14. The 3,509 UST inspections in FY15 conducted accounted for 51 percent of the total inspections. This was down 3 percent from the previous year. The compliance rate for UST inspections has dropped 7% over the previous year to 51.3%. Notices of Violations grew by 6 percent from FY14 to FY15. The decrease in compliance rates can be attributed in part to the noncompliance
0
100
200
300
400
500
600
700
Jul-1
4
Aug-
14
Sep-
14
Oct
-14
Nov
-14
Dec-
14
Jan-
15
Feb-
15
Mar
-15
Apr-
15
May
-15
Jun-
15
DWM Inspections
Underground Storage Tank Hazardous Waste Solid Waste

34
with the new regulations which incorporated provisions of the Energy Policy Act of 2005 including full implementation of Designated Compliance Managers and the issuance of annual Compliance Management Plans. Field operations conducted 1,693 solid waste inspections in FY15, an increase of fifteen percent from FY14. The compliance rate for solid waste facilities increased 1.1% over the previous year to 66.8%. The increase can be attributed to an increase in the frequency of inspections performed at facilities. Field operations conducted 1,611 hazardous waste inspections during FY15, a fifteen percent increase from the previous year. The compliance rate has increased 6% over the previous year to 82.3% percent. Field operations conducted nearly fifteen percent more complaint investigations in FY15 for the 2,297 complaints. FY15 led to an eight percent increase for inspections and investigations, with a total of 9,163. Figure 17
Note: “Compliance Rate” means the percent of total inspections where an inspector noted that no violation had occurred. This does not include investigations triggered by citizen complaints. Note: “UST TCI” means a technical compliance inspection for a site’s USTs.
0%10%20%30%40%50%60%70%80%90%
100%
Jul-1
4
Aug-
14
Sep-
14
Oct
-14
Nov
-14
Dec-
14
Jan-
15
Feb-
15
Mar
-15
Apr-
15
May
-15
Jun-
15
DWM Compliance Rates
Solid Waste Compliance Rates UST TCI Compliance Rates
Hazardous Waste Compliance Rates

35
Emergency Response KRS 224.1-400 establishes the cabinet as the lead agency for hazardous substance, pollutant or contaminant emergency spill response. The Department for Environmental Protection maintains a roster of field staff who serve as part of the Environmental Response Team. They are the first to respond to environmental emergencies. In FY15, the Environmental Response Team had 14,220 incidents, 538 emergency responses, and closed 537 cases.
BRANCH HIGHLIGHT
Southern Kentucky Tire Cleanup By John Rogers, Columbia Regional Office Supervisor In June 2015, the Columbia Regional Office aided in the cleanup of waste tires in conjunction with the Kentucky Tire Collection programs in Metcalfe and Monroe Counties. Staff contacted the judge executive’s office in each county and offered assistance to individuals with transporting waste tires during the program. The Columbia regional staff asked each judge executive to qualify each individual based on their need for assistance. As a result of this, a large tire pile was identified and later cleaned up for a disabled individual in Monroe County. The tire pile contained approximately 5,000 PTE (passenger tire equivalent) tires. Bowling Green regional office staff also assisted with this cleanup. Two individuals were identified in Metcalfe County where another 1,000 PTEs were transported. Trucks assigned to the Columbia office and a rollback truck on loan from the RLA Branch was used in the project. Overall, nearly 6,500 tires were cleaned up and properly disposed of by field staff.
Columbia Regional Office Supervisor, John Rogers, loading tires from the
cleanup site in Monroe County onto a rollback truck provided by DWM
Recycling Center – photo by David Coomer, June 2015

36
UNDERGROUND STORAGE TANKS WASTE.KY.GOV/UST
The mission of the Underground Storage Tank Branch is to provide for the prevention, abatement and control of contaminants from regulated underground storage tanks (USTs) that may threaten human health, safety and the environment. The Underground Storage Tank Branch regulates the registration, compliance, closure, inspections and corrective actions of UST systems. Through cleanup, former UST sites become assets to their communities. Vacant UST properties in cities and towns are often on busy street corners and main roadways, making them potential opportunities for economic development, community development, and neighborhood revitalization. Figure 18
0
100
200
300
400
500
600
700
FY07 FY08 FY09 FY10 FY11 FY12 FY13 FY14 FY15
UST Cleanups Completed
UST Contractors and USTB staff conducting electrical resistivity testing -
photo by Brad Highley, August 2015

37
The chart in Figure 18 includes only sites that have received a No Further Action (NFA) letter from the Underground Storage Tank Branch. In FY15, 271 NFA letters were issued to UST sites. Regulatory changes in FY07 account, in part, for the spike in FY08 NFA letters. Kentucky is fortunate to have a funding mechanism that provides recurring financial assistance to eligible UST owners and operators for cleanup costs, and, in certain cases, the removal of old UST systems. This facilitates cleanups that may not otherwise take place since it helps UST owners who, in many cases, do not have the financial viability to self-fund the cost of removal and cleanup. The funds come from the Petroleum Storage Tank Environmental Assurance Fund (PSTEAF), which is funded by $0.014 assessed on each gallon of gasoline and special fuels received in Kentucky. As a direct result of changes in the regulatory process in 2006 and 2011, the total number of UST cleanups remaining has decreased substantially. At the end of FY15, there were 757 UST cleanups requiring further work before they receive NFA letters (Figure 19). Figure 19
While these charts reveal the clear success of the changes in the UST cleanup program and regulatory process, it should also be noted that USTs and piping will continue to leak. This means there will continue to be new UST releases and the need for a UST cleanup program. In fact, the number of new cases being added to the cleanup list has averaged roughly 280 UST sites per year for the last eight years; although, in FY15 only 192 sites were added. In time this may become a trend.
0
500
1,000
1,500
2,000
2,500
FY07 FY08 FY09 FY10 FY11 FY12 FY13 FY14 FY15
UST Cleanups Remaining
UST Cleanups Remaining

38
The Underground Storage Tank Branch publishes and maintains the UST Quarterly publication and the UST Branch website. These are focused on aiding UST owners, operators, contractors and companies with timely information regarding the regulatory aspects of owning and managing USTs and the cleanup of UST-related contamination.
The Kentucky Underground Storage Tank Operator Online Learning System (KYTOOLS) was officially started on May 30, 2013. Since that time, approximately 2,849 of Kentucky’s 3,311 active facilities have successfully designated a compliance manager and completed online training in order to satisfy state and federal mandated training requirements for UST personnel. Successful completion of the
training will be required on an annual basis. Assuming consistent and ongoing funding is maintained for the UST cleanup program, along with the expected advancements in release prevention and enhancements in the cleanup and reimbursement processes, the agency is hopeful that the number of cleanups completed will continue to outpace the number of cleanups added to the list in the years to come.
BRANCH HIGHLIGHT
Applying Technology and Maintaining Course By Edward J. Winner, Ph.D.
Over the past year, the UST Branch has continued to improve and refine its approach to UST site restoration, processing and controlling PSTEAF fund expenditures, and providing assistance to Kentucky’s UST owners and operators. Maintaining an emphasis upon these core duties of the program has continued to pay dividends. The number of UST sites being actively managed is around 700. PSTEAF fund expenditures are stable, and compliance rates are improving. Environmental restoration of UST sites continues to progress. Both the state’s project managers and the UST contractors continue to develop their skills and add to their experience in the use of new and refined technologies such as electrical resistivity, ultra-violet optical screening and various other site characterization technologies and innovative remedies. The successful application of new technologies has led to a significant shift in evaluating contamination, developing conceptual
Ahad Chowdury, Corrective Action Section supervisor, in the field - photo by
Brad Highley, April 2015

39
site models, and implementing real time remediation at historical and difficult to remediate sites. The regulated community is beginning to see the effectiveness of this effort as evident from significant increases in the application of UVOST/LIF, geophysics, and high pressure injection technologies. We believe that those UST contractors, primarily Kentucky companies, who thoroughly participate in employing such technologies, will gain skills that will allow them to become competitive nationwide. While this is not the intent of the program, it is an added bonus. The PSTEAF fund is meeting current needs. Over-obligations are being held to a manageable level, claims are paid in a timely manner, and applications are processed without delay. Staff is fully committed to moving work forward and properly accounting for the dollars spent. In the fall of 2016, they will be moving into a new accounting system that is anticipated to streamline tasks and to support expanded database queries. The compliance staff has been focused on building relations with the regulated community while continuing to support the field inspectors with data input into TEMPO. They continue to assist Designated Compliance Managers with KYTOOLS, the online compliance training program. Presently, 90% of Kentucky’s UST facilities have a person responsible for compliance that has taken the KYTOOLS online training. They are seeking additional ways to be of greater service to the regulated community by coordinating compliance awards with the Kentucky Petroleum Marketers Association and participating in Fuel Schools to educate the UST community on Underground Storage Tank regulations. Staff is looking forward to participating in compliance inspections with the field inspectors and gaining additional hands-on training for UST equipment.

40
SUPERFUND WASTE.KY.GOV/SFB
The Superfund Branch seeks to ensure that contaminated sites are evaluated and cleaned up in a timely manner to reduce risks to human health and the environment. In most cases this means overseeing companies or individuals who have taken responsibility for cleaning up contamination found on their property. In cases where a responsible party cannot be found or is unable to act, the Superfund Branch may take a direct role in cleaning up a site. The program handles oversight of cleanup of hazardous substance releases and non-UST petroleum releases across the commonwealth. The Superfund Branch must maintain a list of sites where waste is managed on-site through some form of engineering control, such as a cap or structure, or institutional control, such as an environmental covenant or deed restriction. There are currently 197 sites where waste is managed on-site. These sites require some form of reporting such as an annual report or five year review as established by statute. For sites that are being managed by using institutional and/or engineering controls, the obligations to continue to manage the releases are indefinite. Therefore, the numbers of total managed sites in Superfund will continue to increase as new sites are approved for closure under this option. The only way a site can be removed from the managed site list is if additional cleanup is performed to restore the site to safely allow for unrestricted residential use. Figure 20
0
5
10
15
20
25
30
35
40
45
Jul-1
4
Aug-
14
Sep-
14
Oct
-14
Nov
-14
Dec-
14
Jan-
15
Feb-
15
Mar
-15
Apr-
15
May
-15
Jun-
15
Superfund Sites Remediated and Characterized
Superfund Sites Remediated Superfund Sites Characterized

41
In FY15, the Superfund Branch remediated 171 sites, characterized 35 sites and registered 125 new sites. Three state-lead sites were remediated utilizing the Hazardous Waste Management Fund. There was one cleanup conducted under state oversight via the Voluntary Environmental Remediation Program.
Figure 21
There were also 44 sites with a release of petroleum or a petroleum product remediated from a source other than a petroleum storage tank, with none pending review. Brownfields Brownfields are abandoned, idled, or underutilized industrial and commercial facilities/sites where expansion or redevelopment is complicated by real or perceived environmental contamination. They can be in urban, suburban, or rural areas. The Brownfield redevelopment is a joint effort between the Division of Waste Management and the Division of Compliance Assistance.
• In FY15, there were six Targeted Brownfields Assessments conducted, and four awaiting
review. Multiple other sites have been reviewed and technical assistance was provided for recipients of various USEPA 128(a) Brownfields Grants.
• Also in FY15, there were 49 brownfield sites reviewed under KRS 224.1-415, 21 Notice of Eligibility letters issued, 36 Notification of Concurrence letters issued and no sites pending review at the end of the fiscal year.
0
5
10
15
20
25
Jul-1
4
Aug-
14
Sep-
14
Oct
-14
Nov
-14
Dec-
14
Jan-
15
Feb-
15
Mar
-15
Apr-
15
May
-15
Jun-
15
New Superfund Sites
New Superfund Sites
42
Methamphetamine Lab Cleanup In cases where homes are contaminated with meth waste, the Kentucky Division of Waste Management works in conjunction with law enforcement and health departments to remediate structures through the division’s Methamphetamine Lab Cleanup Program. Because meth waste is so toxic, especially to small children, and absorbs into home surfaces and structures, it must be remediated by certified contractors. In FY15, 160 contaminated residences were reported and 63 residences were decontaminated through the Methamphetamine Lab Cleanup Program. Future of the Hazardous Waste Management Fund The Hazardous Waste Management Fund (HWMF) is the sole source of funding for emergency response and state-lead remediation. Contaminated sites can range from large industrial site projects and dry cleaners to small projects such as roadside drums, orphan wastes and transformers. The HWMF is the commonwealth’s only fail-safe mechanism for addressing contaminated sites where there is commonly no responsible or viable party to take action. Failure to act at these sites could result in harm to human health and natural resources of the commonwealth. There are no other available funding sources to conduct emergency response, state-lead cleanup actions, or regulatory oversight. There are currently 24 known sites requiring remedial actions that will result in significant expenses to the HWMF. Over 700 additional sites have been identified as potential or likely state-lead site projects in addition to numerous annually reoccurring projects due to emergency releases and immediate removals will be required due to imminent threats to human health and the environment. Additionally, there are numerous sites where viable responsible parties are conducting cleanups and the HWMF supports the necessary regulatory oversight. The fastest growing encumbrance on the HWMF is dry cleaning facilities. This is due to the large number of facilities located across the commonwealth, remedial difficulties and lack of financially viable responsible parties. While dry cleaners themselves are a public and economic benefit, the use of dry cleaning solvents such as perchloroethylene (PCE), also known as “perc”, can present an environmental challenge. PCE groundwater contamination and vapor intrusion into homes and buildings are the primary routes leading to human health risks and natural resource damage in Kentucky. PCE contaminant plumes are much larger, more mobile, more persistent than other types of chemicals, and can remain in the ground for decades. PCE plume lengths average 1,933 feet with maximum plume lengths reaching 13,700 feet or more. This is ten times larger and longer than the average contamination plume from a gas station. Due to the density of PCE, plumes reach much deeper into the groundwater, may even infiltrate bedrock, and are more likely to affect present and future potable drinking water sources. Approximately 28 dry cleaner sites are being actively addressed by the cabinet. This represents only 8-10 percent of the registered dry cleaning businesses in Kentucky. There are currently over

43
282 existing and former dry cleaner facilities registered as hazardous waste handlers in the Kentucky RCRIS database and over 327 new and/or remaining active dry cleaners in the state of Kentucky. This makes for an estimate of 384 potential facilities in which a likely release of PCE has occurred. These facilities are not yet in the active Superfund universe. Dry cleaner facilities are registered in RCRIS due to their use of dry cleaning solvents. The vast majority of dry cleaning facilities have never been registered. A nationwide survey of insurers estimated that more than 70 percent of past and present dry cleaners accidentally or intentionally have released PCE into the soil or groundwater. Cleanup costs can range from tens of thousands of dollars to several million dollars, with an average of $500,000 per cleanup. Most dry cleaning operators do not have adequate assets or insurance to pay these cleanup costs and the cost for clean-up easily exceeds the equity in a retail center or property. Currently, 13 states have established a specific dry cleaning fund, five of which are in the same EPA region as Kentucky. As a result of the increased burden on the HWMF, the universe of known and likely dry-cleaner and non-dry cleaner sites without financially viable responsible parties, and decreases in receipts paid to the HWMF through exemptions, and decreases to general and federal funds available to the cabinet since 2008, the HWMF is increasingly unable to provide sufficient funds to adequately (a) respond to environmental emergencies, or (b) provide characterization and cleanup of contaminated properties. The available funding on an annual basis will continue to become increasingly insufficient to meet the baseline needs for the program moving forward, let alone the additional dry cleaner and other future superfund sites. Currently, the cabinet minimally operates characterization and cleanup activities on state-lead sites and emergency responses that arise in accordance with the balance of the HWMF and internal resources available. Unless there are modifications in the form of an increase of funding to the HWMF, it has become increasingly difficult for the cabinet to respond to emergencies and to cleanup sites where there is no viable responsible party. Cleanup of sites where there is no responsible party are particularly affected by the funding shortfalls. Some of these sites, which the cabinet cannot currently respond to, may present appreciable risk to human health and over time mount up to a significant backlog of environmental liability while continuing to damage or degrade Kentucky’s natural resources. This has a direct negative impact on the cabinet’s mandated omnibus to protect human health and the environment. The cabinet is continually formulating very limited options to best address the situation under the circumstances. However, increasing greater efficiency and resourcefulness can only offer so much before the continued decrease in available funding combined with the continued influx of contaminated properties and hazardous substance releases reach diminishing returns and make acquiring more funding and financial resources currently, if not immediately, crucial. Maxey Flats Project The Maxey Flats Project (MFP), formerly known as the Maxey Flats Nuclear Disposal Site, is a 55-acre commercial disposal facility for radioactive waste that operated from 1962-1977. During its operations, solid and liquid nuclear waste was buried in unlined earthen trenches. Upon the

44
discovery of nuclear materials in off-site groundwater, the facility was closed to alleviate the environmental threat and protect human health. In 1978, the Commonwealth of Kentucky purchased the facility to ensure immediate closure and proper remediation. The MFP was placed on the National Priorities List (NPL) by USEPA in 1986.
After many years of monitoring and remedial work, the Maxey Flats Project, located in Fleming County, was placed into the Final Closure Period in November of 2012. The final closure plan includes installation of a permanent vegetative cap, installation of permanent surface water control features and installation of surface monuments to identify concerns and location of buried waste.
Significant progress has been made on final closure activities during FY 2015 including: • The Walker Group, from Mt. Sterling was selected in September, 2014, as the construction
contractor for building the final cap;
• The final cap design was approved by USEPA in October, 2014;
• The contractor mobilized to the site in January, 2015 to begin the final cap construction;
• A public meeting was held in February, 2015 to inform the citizens and community of the construction project;
• Wooded areas were cleared and the haul road and drainage features were constructed from January through May, 2015
Aerial View of MFP before final closure activities - photo by Thomas Stewart, MFP

45
• Governor Beshear visited the site with Energy and Environment Cabinet Secretary Peters and other local officials on June 1, 2015, to place the first load of dirt on the cap which will serve to level the site for placement of the liner. Since June 1st, over 129,000 cubic yards of dirt have been hauled and placed for the cap; and
• In August, 2015 workers begin to place the geo-synthetic liner and geomembrane which make up part of the final cap. The liner will help prevent water from entering the waste disposal trenches. Over 3 acres of liner have been installed by mid-August.
Construction of the final cap is projected to be substantially completed by October, 2016. After the work is certified to be complete, the MFP will enter into an Institutional Control Period of 100 years which will include continued monitoring, maintenance and facility control.
Although the final closure activities are well underway much work is left to be done. The staff of the Maxey Flats Section will continue to play a key role in the successful implementation of the final closure work and will work closely with the contractors. The division’s Superfund Branch takes great pride in working as a team with all of the staff and contractors and looks forward to completing the final closure at Maxey Flats in a manner which is protective for all of the citizens of the commonwealth.
Aerial view of haul road construction - photo by Scott Wilburn, MFP, March 2015

46
Aerial view of cap construction looking north - photo by Scott Wilburn, MFP, June 2015
Aerial view of cap construction looking south - photo by Scott Wilburn, MFP, August 2015

47
BRANCH HIGHLIGHT
The Synergistic Programs of Superfund: Remediation, Brownfield Reuse, Greenfield Preservation & Economic Growth By Larry D. Hughes, P.G. The Commonwealth of Kentucky’s Superfund program is a program that does far more than its traditional name historically suggests. The original and primary purpose of the program still remains to oversee, implement and manage the clean-up of properties that are polluted by various toxic chemicals. However, when the person or entity responsible for the contamination is either unknown or not financially able to clean up the property, these numerous properties become “dead zones” and untouchable because no one wants to take on the liability and responsibility for the efforts. As a result, a number of these properties associated with Superfund remain in the program indefinitely due to the environmental liability and stigma associated with them. Developers have shied away from these sites as they have not wanted to take on the responsibility for cleaning up a property for which they were not the cause of the contamination. Therefore, these properties create corridors of abandoned buildings, lots and lands in key commercial and industrial areas across the commonwealth. As responsible parties dissolve or become unable to afford clean up, the commonwealth’s burden and costs for managing and cleaning up these sites continues to grow enormously.
The concept of reclaiming polluted sites in order to return them to an economically productive use and enhance property values in the vicinity is a noble one. However, methods used to date to encourage this, such as renaming the properties “brownfields”, did not rid them of the untouchable stigma or lingering liability. What is the solution for developers and the commonwealth to be able to work together for the benefit of all stakeholders? How can properties that have been sitting idle for years and decades be turned into redevelopment and reuse opportunities? Meager financial incentives have existed but none have managed to encourage developers in a large fashion. However, these small financial incentives have not typically been able to overcome the high and indefinite costs of time and monies required to perform remediation at such sites in order to make them attractive. Until 2012, no genuine or meaningful incentive existed that would energize and encourage stakeholders to become interested in these properties.
Entrance of the Old Taylor Distillery Project, Hillsboro, KY - photo by Shawn Cecil.

48
The passage and implementation of the Kentucky Brownfield Redevelopment Program (KRS 224.1-415), and the regulations that followed in 2014, have created the much needed incentive and synergism among stakeholders to reclamation and reuse these polluted sites in a meaningful way. The program focuses on the productive restoration and reuse of existing and potential Superfund brownfield sites and properties, protective interim management of the impacts to the site, while simultaneously preserving existing greenfields. The program provides a means for property owners and prospective owners, who can certify that they did not cause the contamination or have a relationship with those who did, an opportunity to develop a plan to reuse the property safely and receive the commonwealth’s assurance that they will not be held responsible for investigation or cleanup under Kentucky Superfund laws (KRS 224.1-400 and 224.1-405). This has allowed developers to voluntarily create and implement protective property management plans that best fit the property to meet both their and local economic needs and, in some cases, to perform purely voluntary clean-up efforts that happen to run correspondingly with their development plans. The new owner will be responsible for allowing access for necessary remediation by the responsible party(ies) and/or state-led clean-ups. Failure to allow access or adhere to their approved property management plan could result in a loss of protection under KRS 224.1-415.
The success of the Kentucky Brownfield Redevelopment Program has been and continues to be realized. Furthermore, the sites that are being developed under this newly implemented program are also achieving a desired regulatory outcome of protecting human health and the natural resources of Kentucky. The specter of developers being put on-the-hook as the responsible party just for choosing to redevelop is removed under this program. Voluntary clean up and layers of protective land management are now driven dynamically by the market for the property, without the liability and stigma. To date, there is a continued increase for commercial and industrial ventures through this program that have been using and developing existing and potential superfund sites, including many former commercial and industrial sites with recognized environmental concerns. In addition, the program is saving existing green space and money for the commonwealth as new commercial and industrial ventures redevelop and use former brownfield properties instead of new green space. Finally, under this program, greater protection of human health is provided as developers who come through the program voluntarily in the course of their land use development are actively considering exposures that may have existed due to lack of awareness on their part. The program brings attention to sites that would have been unknown to the division previously. Therefore, the program provides a collaborative and multilevel reciprocating goal approach to the reclamation of brownfields and former superfund sites.
Beneficial economic reuse and protection of human health and the environment need not be antagonist. With this critical concept and law in place, the threat of liability is removed from non-responsible parties, making a formerly “untouchable” site appealing. As a result, the Superfund program has managed the redevelopment of 83 properties in the commonwealth since 2012, with over 106 inquiries since the regulations became effective on February 2, 2014. The trend of the Superfund brownfield property redevelopment and reuse program continues to be on a steady rise. Thus far, the benefits of the program have been tremendous to the commonwealth. Protecting human health and our natural resources, incentivizing business development,

49
preserving green space, developing properties with existing infrastructure, beautifying the community, and raising the value of surrounding properties is beneficial to everyone.

50
PROGRAM PLANNING & ADMINISTRATION WASTE.KY.GOV/PPA
The mission of the Program Planning and Administration Branch (PPA) is to promote sound waste management programs by providing administrative and operational support to all branches in the division through efficient and effective financial administration, personnel management, and regulatory development. Budget The budget for DWM is very complex, covering a host of programs and activities as well as partially funding work charged by the Division of Enforcement and the Environmental Response Team in the Division of Environmental Program Support. The division is financially supported by general funds, federal grants, and restricted funds, which includes fees collected for permits and registration activities, the Petroleum Storage Tank Environmental Assurance Fund (PSTEAF), the waste tire fee, the environmental remediation fee, and an annual appropriation from the road fund. The division must utilize available funding sources in the most resourceful and equitable manner possible, while striving to achieve the cabinet’s environmental goals and division priorities. Figure 22
The division had the budget to employ 237 full-time permanent employees in 2015. The number of employees the division could fiscally maintain has decreased nearly 14 percent since 2009. This reduction in personnel continues to challenge the division programs to operate more efficiently and identify program priorities.
$0
$10
$20
$30
$40
$50
$60
$70
$80
2009 2010 2011 2012 2013 2014 2015
Mill
ions
Division of Waste Management Budget Analysis
General Funds Federal Funds Restricted Funds
PSTEAF (Fuel Acct) PSTEAF (Bond Acct)
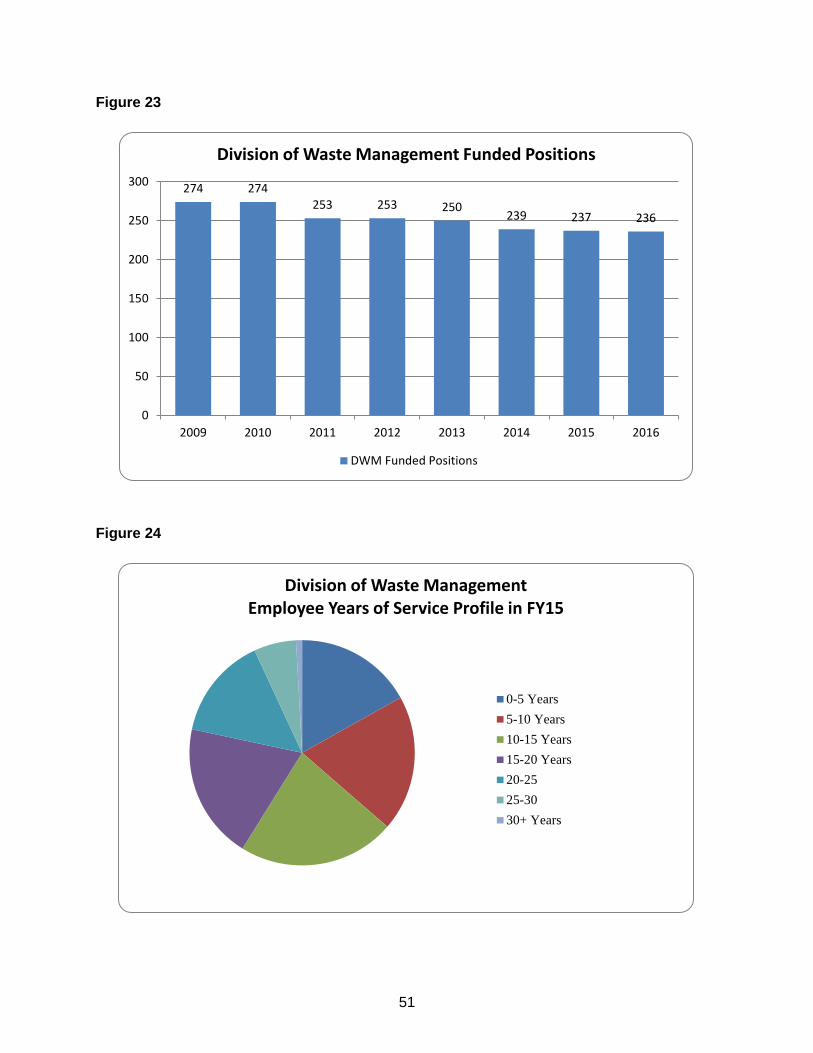
51
Figure 23
Figure 24
274 274 253 253 250
239 237 236
0
50
100
150
200
250
300
2009 2010 2011 2012 2013 2014 2015 2016
Division of Waste Management Funded Positions
DWM Funded Positions
Division of Waste Management Employee Years of Service Profile in FY15
0-5 Years5-10 Years10-15 Years15-20 Years20-2525-3030+ Years

52
Project Administration Section The Project Administration Section performs administration of purchasing, managing of grants received, memorandum of understanding and agreement by the division along with payments for major fee-supported programs. Due to the way the division is organized, some programs are completely federally funded, others are partially federally funded, and still some receive no federal funding. This makes a cut in federal funding levels extremely detrimental to programs that are solely federally funded, such as Brownfields, the Paducah Gaseous Diffusion Plant, and the chemical weapon demilitarization at the Bluegrass Army Depot. In FY15, DWM purchased several pieces of equipment to assist in the division’s environmental activities. They include: FROG-4000 - Portable Gas Chromatographer with Photoionization Detector – This equipment will be used to detect contaminates in the water, soil, and air. A portable GC system will give our staff the ability to economically analyze a large number of samples in a short period of time. This enables a more thorough and expeditious characterization of a site and environmental professionals obtain their results in the field in real time so that decisions can be made on the spot, preventing further pollution, impact, and contamination. Field Portable X-Ray Fluorescence Spectrometer – This spectrometer is capable of providing simultaneous real time analysis of multiple inorganic chemical elements in soil and other media, both in situ and ex situ. The instrument is programmed to detect and quantify in parts per million (at a minimum) the following: RCRA chemical elements; arsenic, barium, cadmium, chromium, lead, mercury, selenium, and silver; as well as antimony, manganese, iron, nickel, copper, zinc, strontium, cobalt, and titanium. Inflatable Pipe Plug Spill Prevention Kits – These will allow responders to plug drainage pipes during a spill event. These kits will assist with keeping the spill contained to a smaller area and not allowing the spill to continue downstream. Emergency Response Weather Station – The Emergency Response Weather Station will be used during incidents that require air monitoring. Responders need to be able to know what the weather conditions are in order to appropriately set-up a monitoring plan. This weather station will be mounted to a portable mast next to the ERT Mobile Command Post, as needed, during environmental emergencies.
Brent Cary, Federal Superfund Section, with new XRF Spectrometer – photo by Louanna
Aldridge, August 2015

53
AMS Gas Samplers - Soil gas vapor probes are used for collecting samples for volatile organic and inorganic compounds from in soils and beneath floor slabs. Sub-slab sampling and routine monitoring has become an integral part of vapor intrusion investigations, petroleum and dry cleaner contamination releases. The AMS Sub-Slab Gas Vapor Probe Kit provides a semi-permanent probe, designed to allow repeated sampling over time in order to assess the potential of contaminated vapor intrusion from beneath buildings and the ability to collect samples directly beneath the floor slab of a building. Cardboard Baler – A new cardboard baler was purchased for the Kentucky Government Recycling Center, replacing its 35 year old baler. The new baler is expected to increase the center’s efficiency and production of cardboard to be sold.
Cardboard Baler at Kentucky Government Recycling Center, Frankfort, KY - photo by Louanna Aldridge, August 2015
AMS Gas Sampler - photo by Louanna Aldridge, August 2015

54
International Box Truck – A new box truck was purchased for the Government Recycling Center replacing an aging truck in the center’s fleet. The truck will be used to assist with the collection of waste paper from state office buildings in Frankfort.
Personnel and Administrative Support Section The Personnel and Administrative Support Section performs support-related duties for the branch and division. These duties include the coordination and procurement of goods and services on state price contracts such as office supplies, equipment, furniture, uniforms, and boots for DWM-Central Office. The section provides support in identifying facility needs for division staff including workspace logistics and new phone hook-ups. Section staff includes the division’s wireless coordinator, tasked with the distribution and management of the division’s state-issued cellular devices and services, and the division’s Safety Officer, responsible for the evaluation and identification of the division’s safety needs and training. In addition, the Personnel and Administrative Support Section is tasked with the coordination of employee training and development along with in-state and out-of-state travel logistics and reimbursement. In FY15, division staff attended 448 trainings and career development opportunities; down from 708 in FY14. This was largely due to a decrease in the number of computer-related trainings available to employees. Previously, the divisions training history had been tracked in Kentucky’s Pathlore system; however, DWM has begun to implement the Kentucky Enterprise Learning Management System (KELMS). KELMS is intended to be an enterprise-wide system that can be used by and configured for all state entities. The new system is expected allow DWM to customize learning plans, track employee progress toward certification plans and programs, participate in eLearning delivery and automatic transcript reconciliation, and self-registration for agency instructor-led training. The system will continue as a single system for tracking training activities and will provide the division with extensive reporting capabilities.
Timmy Bryant standing with the new International Box Truck – photo by Louanna Aldridge, August
2015

55
The section also works closely with the Environmental Response Team (ERT) processing invoices and payments relating to emergency responses and cleanups. Furthermore, the section provides support in pursuing the recovery of response costs when a viable responsible party is available. In FY15, DWM was able to recover a total of $536,705 in emergency response costs. These funds are deposited back into the Hazardous Waste Management Fund, where they are again utilized for the remediation of environmental contaminations throughout Kentucky. Program Development Section The Program Development Section performs a variety of functions related to the division's future such as managing planning initiatives and development of regulations along with coordinating review of proposed bills during legislative session. Regulation Development - Administrative regulations for the Brownfield Redevelopment Program became effective in February 2014. Already proving successful, the division has issued over 60 letters of eligibility or concurrence to applicable sites. The division is currently drafting two regulatory packages to incorporate federal rulemakings. The Hazardous Waste Program’s administrative regulations are incorporating several federal rulings including the change to the definition of solid waste. These changes will then be incorporated into a new authorization package for EPA submittal. Regulations are also being developed for the Solid Waste Program to permit coal combustion residual facilities that are generating electricity in response to the federal ruling on April 17, 2015. Amendments to administrative regulations currently in progress within the division include revisions to the Recycling and Local Assistance Program (RLA) and the Underground Storage Tank (UST) Program. RLA amendments include the revisions to several forms to streamline the reporting process. UST amendments include additional requirements related to delivery prohibition in an effort to increase compliance. Legislation - The hazardous waste assessment fee established in KRS 224.46-580 was extended as a part of House Bill 417 until June 30, 2024 to provide funding to protect the health of the citizens and environment of the commonwealth from threats associated with releases of hazardous substances, pollutants and contaminants. The Waste Tire Working Group was established to review numerous aspects of the Kentucky waste tire program and to provide advice to the cabinet for proposed changes to applicable statutes and regulations in an effort to improve the program. Membership changes to the group include the new appointments of Scott Tussey, Madison County Solid Waste Coordinator, and Kelly Bowlin, Boone County Solid Waste Coordinator, and the reappointments of Mayor Martin Voiers, Judge James Townsend, and Joe Durkin. One legislative report was prepared in FY15. The Waste Tire Trust Fund Report discussed the history, expenditures, revenues, and current status of the Waste Tire Program in Kentucky.
56
Other reports prepared include the division’s Strategic Operational Plan and mid-year status updates of planning initiatives for 2015, and the division’s portion of the Quality Assurance Annual Report. In addition, the Program Development Section assisted in the preparation of the public hearing and meeting policy and procedural manual for the department.
57
ACKNOWLEDGMENTS
Commonwealth of Kentucky Governor Steve Beshear Energy and Environment Cabinet Secretary Leonard K. Peters Kentucky Department for Environmental Protection Commissioner R. Bruce Scott, P.E. Deputy Commissioner Aaron Keatley This annual report is intended to provide a concise set of facts and measurements to support environmental decision-making. We welcome your questions and comments to the contacts below: Kentucky Division of Waste Management 200 Fair Oaks Lane, 2nd floor Frankfort, KY 40601 Phone: 502-564-6716 Fax: 502-564-3492 waste.ky.gov Director Anthony R. Hatton, P.G. Assistant Director Jon Maybriar We acknowledge the contributions of the management and staff of the Division of Waste Management: Ed Winner, Ph.D. Larry Hughes, P.G. John Maddy Gary Logsdon Danny Anderson, P.G. April Webb, P.E. A. Bruce Rogers Dale Burton John Jump Bart Schneider
Heather Alexander Cliff Hall Sharon Gritton Nate Hancock Ron Lovitt Lori Berry Sherri Adkins Jim Kirby Jason Monarch Robin Green
Todd Hendricks Tammi Hudson R.T. Hendricks Lisa Evans Kitt Tuttle Brian Begley Brad Highley Thomas Stewart Scott Wilburn Shawn Cecil
Billy Hill Tom Heil Lisa Butler Donna Conway Chris Craig Ahad Chowdhury Lajuanda Maybriar John Rogers Brian Osterman David Coomer
Edited by: John Carlton and Louanna Aldridge
The Kentucky Division of Waste Management does not discriminate on the basis of race, color, religion, sex, national origin, sexual orientation or gender identity, ancestry, age, disability or veteran status. The division provides, on request, reasonable
accommodations necessary to afford an individual with a disability an equal opportunity to participate in all services, programs, and activities. Contact the division to request materials in an alternate format.
Printed with state funds on recycled paper/September 2015

Kentucky Division of Waste Management 200 Fair Oaks Lane, 2nd floor Frankfort, KY 40601
Report an Environmental Emergency, 24-hour: 502-564-2380 or 800-928-2380


