INL/EXT-16-39777 Revision 0 Fission Product Inventory and Burnup Evaluation by Gamma Spectrometry of the AGR-2 Irradiation Jason M. Harp, Paul A. Demkowicz, John D. Stempien September 2016 The INL is a U.S. Department of Energy National Laboratory operated by Battelle Energy Alliance Idaho National laboratory
Transcript
INL/EXT-16-39777Revision 0
Fission Product Inventory and Burnup Evaluation by Gamma Spectrometry of the AGR-2 Irradiation
Jason M. Harp, Paul A. Demkowicz, John D. Stempien
September 2016
The INL is aU.S. Department of EnergyNational Laboratoryoperated byBattelle Energy Alliance
Idaho Nationallaboratory
DISCLAIMERThis information was prepared as an account of work sponsored by an
agency of the U.S. Government. Neither the U.S. Government nor any agency thereof, nor any of their employees, makes any warranty, expressed or implied, or assumes any legal liability or responsibility for the accuracy, completeness, or usefulness, of any information, apparatus, product, or process disclosed, or represents that its use would not infringe privately owned rights. References herein to any specific commercial product, process, or service by trade name, trade mark, manufacturer, or otherwise, does not necessarily constitute or imply its endorsement, recommendation, or favoring by the U.S. Government or any agency thereof. The views and opinions of authors expressed herein do not necessarily state or reflect those of the U.S. Government or any agency thereof.
INL/EXT-16-39777Revision 0
Fission Product Inventory and Burnup Evaluation by Gamma Spectrometry of the AGR-2 Irradiation
Jason M. Harp, Paul A. Demkowicz, John D. Stempien
September 2016
Idaho National LaboratoryINL ART TDO Program
Idaho Falls, Idaho 83415
http://www.inl.gov
Prepared for theU.S. Department of EnergyOffice of Nuclear Energy
Under DOE Idaho Operations OfficeContract DE-AC07-05ID14517
INL ART TDO Program
Fission Product Inventory and Burnup Evaluation byGamma Spectrometry of the AGR-2 Irradiation
INL/EXT-16-39777Revision 0
September 2016
Preparer:
Jason IVr HarpNuclear Fuel Performance
Approved by:
9/29/2016
Date
oc,/2441)16John D. Stempien DateTRISO Fuels PIE.J.,
LE DPaul A. DemkowiczTRISO Fuels Director/Lead
...._ .7,4,-------444—
Travis R. Mitchell Date
91-2-1/1 GDate
ART INL Relationship Manager
i-N, A ,A,x..4...1, 91-Lti(ttsMichelk T. Sharp DateINL Quality Engineer
v
ABSTRACTGamma spectrometry has been used to evaluate the burnup and fission
product inventory of different components from the U.S. Advanced Gas Reactor(AGR) Fuel Development and Qualification Program’s second TRISO-coated particle fuel irradiation test (AGR-2). TRISO fuel in this irradiation included both uranium carbide / uranium oxide (UCO) kernels and uranium oxide (UO2)kernels. Four of the 6 capsules contained fuel from the U.S. Advanced Gas Reactor program, and only those capsules will be discussed in this work. The inventories of gamma-emitting fission products from the fuel compacts, graphite compact holders, graphite spacers and test capsule shell were evaluated. These data were used to measure the fractional release of fission products such as Cs-137, Cs-134, Eu-154, Ce-144, and Ag-110m from the compacts. The fraction of Ag-110m retained in the compacts ranged from 1.8% of the predicted inventory to approximately full retention. Additionally, the activities of the radioactive cesium isotopes (Cs-134 and Cs-137) have been used to evaluate the burnup of all U.S. TRISO fuel compacts in the irradiation. The experimental burnup evaluations compare favorably with burnups predicted from physics simulations. Predicted burnups for UCO compacts range from 7.26 to 13.15 % fission per initial metal atom (FIMA) and 9.01 to 10.69 % FIMA for UO2
compacts. Measured burnup ranged from 7.3 to 13.1 % FIMA for UCO compacts and 8.5 to 10.6 % FIMA for UO2 compacts. Results from gamma emission computed tomography performed on the graphite holders that reveal the distribution of different fission products in a component will also be discussed.Gamma tomography of graphite holders was also used to locate the position of TRISO fuel particles suspected of having silicon carbide layer failures that lead to in-pile cesium release.
vi
vii
ACKNOWLEDGMENTSThis work was supported by the U.S. Department of Energy, Office of
Nuclear Energy. Assistance with quantitative analysis of fission product inventories was provided by the Idaho National Laboratory Analytical Laboratory, and many hot cell activities were performed by staff of the Idaho National Laboratory Hot Fuel Examination Facility.
viii
ix
CONTENTS
ABSTRACT.................................................................................................................................................. v
ACRONYMS............................................................................................................................................... xi
FIGURESFigure 1. Major components of a representative AGR-2 capsule. ................................................................ 2
Figure 2. Compact numbering scheme for AGR-2 Compacts. ..................................................................... 2
Figure 3. Illustration of the off-axis scanning of AGR-2 graphite holders. .................................................. 4
Figure 4. Burnup evaluation of AGR-2 based on gamma spectrometry of AGR-2 compacts...................... 6
Figure 5. Decay-corrected, measured to predicted Ag-110m activity ratios for each US AGR-2capsule as a function of the TAVA irradiation temperatures calculated in Ref 13. ..................... 8
Figure 6. Off-axis distribution of different fission products detected in left and right side axial scans of Holders 2 and 3............................................................................................................... 9
Figure 7. Cs-134 distribution in Holder 2 Level 2 (left) and Cs-137 distribution in Holder 2Level 2 (right). ............................................................................................................................ 10
Figure 8. Eu-154 distribution in Holder 2 Level 2...................................................................................... 10
Figure 9. Ag-110m distribution in Holder 3 Level 2. ................................................................................. 10
Figure 10. Off-axis distribution of different fission products detected in left and right side axial scans of Holder 5. ....................................................................................................................... 11
Figure 11. Tomographic Cs-134 gamma scans from Levels 2 (left) and 3 (right) of AGR-2Holder 5. ..................................................................................................................................... 11
x
Figure 12. Off-axis distribution of Ag-110m detected in left and right side axial scans of Holder 6. ..................................................................................................................................... 12
Figure 13. Tomographic Cs-134 gamma scans from Levels 2 (left) and 3 (right) of AGR-2Holder 6. ..................................................................................................................................... 12
Figure 14. Inventory of Ag-110m in different capsule components compared to the predicted inventory for each capsule. ......................................................................................................... 14
TABLESTable 1. Predicted burnup (% FIMA) compared to measured burnup calculated by the ratio of
Cs-134 to Cs-137. The asterisk (*) in each compact ID number corresponds to the capsule number. ............................................................................................................................ 6
Table 2. Measured Ag-110m inventory as a percent of the predicted inventory for compacts from AGR-2 Capsules 2, 3, 5, and 6. The asterisk (*) in each compact ID number corresponds to the capsule number............................................................................................... 7
Table 3. Total activity in MBq of fission products present in each graphite holder. .................................. 13
Table 4. Fraction of total inventory in each graphite holder....................................................................... 13
xi
ACRONYMSAGR Advanced Gas Reactor
CEA Commissariat à l’énergie atomique
HFEF Hot Fuel Examination Facility
HPGe high purity germanium
FIMA fissions of initial metal atoms
INL Idaho National Laboratory
PBMR Pebble Bed Modular Reactor Ltd.
PGS Precision Gamma Scanner
PIE post-irradiation examination
TAVA time-average, volume-average
TRISO tristructural isotropic
UCO heterogeneous mixture of uranium carbide/uranium oxide
UO2 uranium oxide
xii
1
Fission Product Inventory and Burnup Evaluation by Gamma Spectrometry of the AGR-2 Irradiation
1. INTRODUCTIONThe Advanced Gas Reactor (AGR)-2 tristructural isotropic (TRISO) fuel irradiation was the second
test in a series of irradiations designed to qualify TRISO fuel for use in next generation reactors. The first irradiation, AGR-1, and its associated post-irradiation examination (PIE) and safety testing demonstrated the fuel performance of lab-scale-produced TRISO fuel [1,2]. The AGR-2 irradiation and its associated PIE was designed to demonstrate the performance of fuel compacts fabricated using TRISO particlesproduced on an engineering scale [3,4]. Additionally, while AGR-1 contained exclusively uranium oxide / uranium carbide (UCO) TRISO kernels, AGR-2 contained a capsule with uranium oxide (UO2) TRISO fuel [5].
The irradiation contained six separate capsules. Capsules 2, 3, 5, and 6 contained fuel fabricated in the U.S. and are the subject of this report. Capsules 2, 5, and 6 contained fuel compacts with UCO TRISO particles, while Capsule 3 contained compacts with UO2 particles. The AGR-2 UCO fuel consisted of nominally 425 μm diameter kernels with 14.0% 235U enrichment. UO2 fuel consisted of nominally 500 μm diameter fuel kernels with 9.6% 235U enrichment. The TRISO coatings on both types of kernels had nominal thickness of 100 μm (buffer), 40 μm, (inner and outer pyrolytic carbon), and 35 μm (SiC). The coated particles were formed into right cylindrical compacts approximately 12.3 mm in diameter and 25.1 mm in length. The particle packing fractions were 37% and 23% for the UCO and UO2 compacts, respectively [5].
Each of the six capsules was independently controlled for temperature and had dedicated sweep gas supply and monitoring for released fission gases [6,7]. The major components of the AGR-2 capsules are shown in [6,7] and include the fuel compacts, the graphite holder that supports the compacts, the graphite spacers, the capsule shell, and the gas exit lines. In each of the four AGR-2 capsules discussed in this work there were 12 compacts with 4 in each of the three stacks. The compact numbering scheme for AGR-2 is shown in Figure 2where compacts are numbered by capsule number, axial level, and stack number. Compact 5-2-3, for example, would be the compact from Capsule 5, Level 2, and Stack 3.
The AGR-2 irradiation was performed in the Idaho National Laboratory (INL) Advanced Test Reactor (ATR) for 12 cycles or 559.2 effective full power days and reached predicted calculated burnups ranging from 7.3 to 13.2 % fission per initial heavy-metal atom (FIMA) for UCO fuel and 9.0 to 10.7 % FIMA for UO2 fuel. The time-averaged volume-averaged temperature for UCO fuel ranged from 987°C to 1296°C for the irradiation and for UO2 fuel from 996°C to 1062°C for the irradiation [7].
Gamma spectrometry was used previously to evaluate the burnup of the AGR-1 TRISO fuel compacts[8] as well as the inventory of Ag-110m remaining in the compacts [9]. Additionally, gamma spectrometry of the graphite support structures in AGR-1 was able to identify compacts containing TRISO particles with failed SiC layers [10]. Gamma spectrometry was also utilized to create an inventory of gamma-emitting fission products of each of the capsules in AGR-1 [9]. This combined experience fromAGR-1 has been applied to the similar compacts and capsule components in AGR-2. This work will focus on gamma spectrometry results from the four U.S. fuel capsules.
2
Figure 1. Major components of a representative AGR-2 capsule.
Figure 2. Compact numbering scheme for AGR-2 Compacts.
StackNumber
Compact LoadingCode: XYZ
X= Capsule #Y= Position in
StackZ= Stack Number
Top Vlew
v 4
3
4
2
1
Bottom View
//////////////////////
CORE
AxialLevel
1
G
Fuel Compacts
raphite Holder
Capsule Shell
as Lines
raphite Spacers
3
2. EXPERIMENTGamma scanning was accomplished using the INL Hot Fuel Examination Facility (HFEF) Precision
Gamma Scanner (PGS). The PGS has three major components: the detector system, collimator, and stage.The detector system is a high purity germanium (HPGe) detector surrounded by a Compton suppression detector, and a digital multi-channel analyzer. The collimator is approximately 2.13 m long with an aperture that has a fixed width of 2.22 cm and a variable height of 0.254 to 0.00254 cm. The collimator can also be rotated 90° so that the fixed width of the aperture is vertical instead of horizontal. The stage suspends items before the collimator and moves them in a plane parallel to the face of the collimator. The stage can also rotate items about a central axis.
Compacts were suspended before the PGS collimator in a thin-walled aluminum tube and were individually encapsulated in an additional aluminum container. Calibration sources (Eu-152) packaged in equivalent containers and placed inside the same aluminum tube were scanned before the first compact and after the last compact to confirm the performance of the system. Each compact was typically scanned in 0.254 cm steps with the collimator height set to 0.254 cm for a live time of 30 minutes. The collected spectra were analyzed to evaluate the fission product content of each compact. Fission product inventories were decay corrected to one day after the end of the AGR-2 irradiation (October 17, 2013) and compared to the predicted fission product inventories from ECAR-2066 [11]. Burnup was calculated from both the measured Cs-137 activity and the measured Cs-134 to Cs-137 activity ratio and compared to the predicted compact-average burnup from ECAR-2066 [11]. Burnup determination follows the technique discussed in Reference 8. Burnup is derived from both the absolute Cs-137 decay-corrected activity measured in each compact and by the relative decay-corrected activity ratio of Cs-134 to Cs-137. Burnup derived from Cs-137 only can only be calculated as an average for the entire compact, since the starting inventory of fissile material is not known for the thin section of the compact characterized in each scan. The total activity for a compact is determined by summing the local activity from all the different measurements of a single compact. The total is then converted to burnup. The burnup determined by the ratio of Cs-134 to Cs-137 can either be determined over the entire compact based on total activities or locally for every spectrum collected from each compact. This local measurement of burnup reveals some significant burnup gradients in some compacts. The activity of several different gamma-emitting fission products present in the compacts was also quantified, including Zr-95, Ru-106, Ag-110m, Cs-134, Cs-137, Ce-144,and Eu-154. The quantification of Ag-110m was given special attention and some additional longer scans were performed on specific compacts to better quantify the Ag-110m content of the compacts.
4
In addition to the compacts, the graphite holders were also gamma scanned with the PGS. The goal of these scans is to estimate the inventory and distribution of fission products in the graphite. The distribution of different fission products can be used to infer the fuel performance of compacts during irradiation, and information about fission product release from compacts can be gathered. Graphite holders are scanned in two ways. Initially, they are scanned in two off-axis sweeps to identify axial levels of interest and to estimate the total activity of different isotopes in the holders. In the off-axis scans, the half of the holder that contained Stack 2 and half of Stack 3 is typically scanned first, and the half of the holder that contained Stack 1 and the other half of Stack 3 is scanned second. During irradiation, Stacks 1 and 2 faced the center of the ATR core, and Stack 3 faced away from the center of the ATR core. See Figure 3 for an illustration of the off-axis scanning. If an axial level of interest is identified (for example, by an indication of elevated fission product activity), a tomographic scan of that level is performed, during which the PGS collimator is rotated to a vertical orientation and the holder is turned about its axial centerline after the PGS scans across the holder at a particular level and angle. The scans from several angles are used to reconstruct an activity intensity map of a particular isotope in the graphite holder. Image reconstruction utilizes Gamma Emission Computed Tomography and produces isotope-specific tomograms [12]. The axial levels of interest are typically levels that contain Cs-134 and Cs-137 signals, which indicate that the compact from that location during the irradiation possibly had a TRISO particle with a failed SiC layer similar to what was seen in Reference 10.
Figure 3. Illustration of the off-axis scanning of AGR-2 graphite holders.
0.254 cm
T WWI
5
3. RESULTS3.1 Compact Gamma Spectrometry Results
Data from the gamma spectrometry of compacts have been processed into burnup estimates and compared to the predicted burnup from physics calculations [11]. This is shown in Figure 4 for all US capsules (2, 3, 5, and 6). The burnup based on the total Cs-137 activity in each compact is shown by the orange squares, and the local burnup determined from the ratio of Cs-134 to Cs-137 is shown by the blue diamonds. Burnup values are plotted in relation to the vertical displacement from ATR core centerline.This places 3 data points at the same horizontal position on the graph, since there are three compacts at each level, each in a different stack (Figure 2). Because of the geometry of the capsule in the ATR core(where compacts in Stacks 1 and 2 faced the core, and Stack 3 compacts faced away from the core), the compacts in Stack 1 and 2 were irradiated with roughly equivalent neutron fluence, and the data from Stack 1 and Stack 2 largely overlap. The compacts in Stack 3 were shielded from the core by the other stacks and saw a lower neutron fluence and thus a lower burnup. The numerical values from the prediction and those measured by the Cs-134 to Cs-137 ratio are provided in Table 1 (measured values in Table 1 are the averages determined for each compact from the individual scan data). The ratio-based burnup value is provided in Table 1 in favor of the burnup derived solely from Cs-137 activity because it is less susceptible to biases introduced when determining the absolute efficiency of the detector system.Local burnup can vary by 1 to 2% FIMA across a single compact, which is a statistically significant variation. Measured burnup ranged from 7.9 to 13.1 % FIMA for UCO compacts and 8.5 to 10.6 % FIMA for UO2 compacts. See Table 1 for more detail. Overall, the burnup values based on the ratio of Cs-134 to Cs-137 and the direct Cs-137 activity agree reasonably well with the predicted burnup (Table 1). This level of agreement is in line with AGR-1 [8].
In the Capsule 5 data, there is significantly more scatter in Stack 1 and 2 Cs ratio data than was typically seen in PGS scans of AGR-1 and in scans of the compacts from the other AGR-2 capsules. This is due to a statistically significant variability in the activity of Cs-137 and Cs-134 across the compacts from scan to scan, although the cause is unknown. The difference between measured and predicted burnup values in Stack 1 and Stack 2 (the higher-burnup stacks) in Capsule 6 is similar to what was seen in AGR-1 comparisons for Capsule 6, which was in a similar axial position relative to the core.[8]
6
Figure 4. Burnup evaluation of AGR-2 based on gamma spectrometry of AGR-2 compacts.
Table 1. Predicted burnup (% FIMA) compared to measured burnup calculated by the ratio of Cs-134 to Cs-137. The asterisk (*) in each compact ID number corresponds to the capsule number.
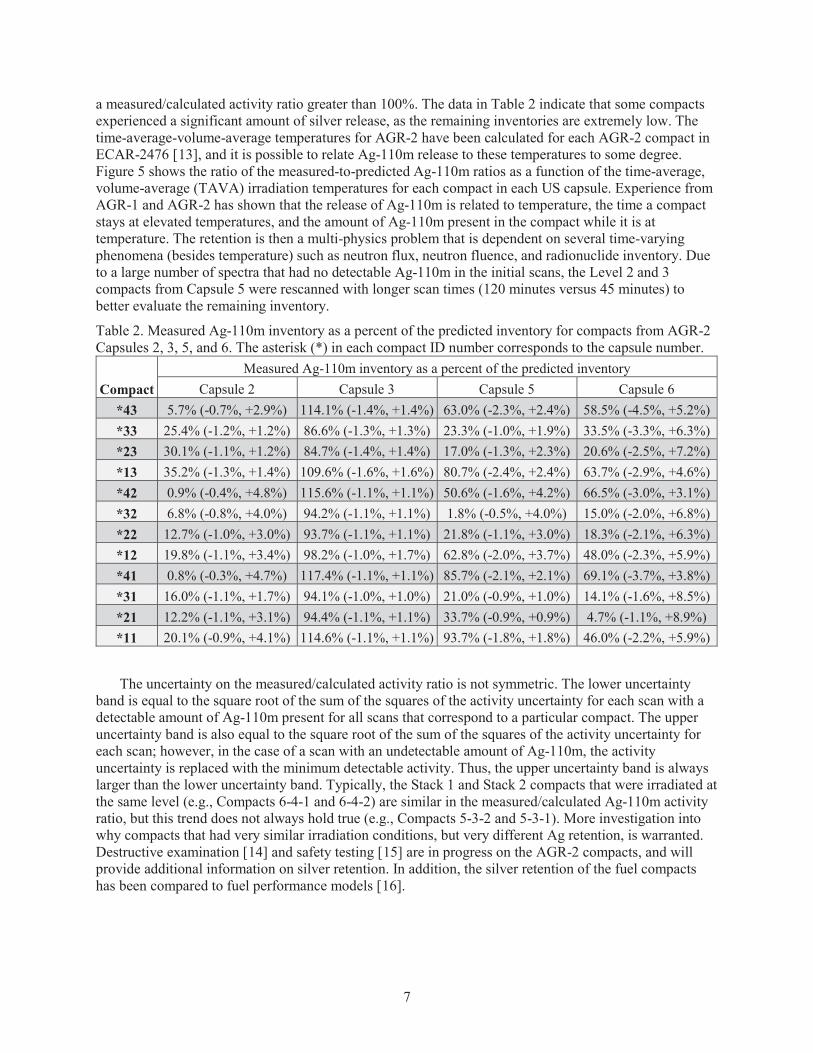
In addition to burnup, another key metric for fuel performance and subsequent PIE is the percentage of Ag-110m retained in each compact. This was estimated for each compact by dividing the decay-corrected measured Ag-110m inventory by the predicted inventory. The values are shown in Table 2 for the four U.S. capsules from AGR-2, expressed as a percentage of the predicted inventory that was measured in each compact. The calculated activity may be under-predicted in some compacts, resulting in
a measured/calculated activity ratio greater than 100%. The data in Table 2 indicate that some compacts experienced a significant amount of silver release, as the remaining inventories are extremely low. The time-average-volume-average temperatures for AGR-2 have been calculated for each AGR-2 compact inECAR-2476 [13], and it is possible to relate Ag-110m release to these temperatures to some degree.Figure 5 shows the ratio of the measured-to-predicted Ag-110m ratios as a function of the time-average, volume-average (TAVA) irradiation temperatures for each compact in each US capsule. Experience from AGR-1 and AGR-2 has shown that the release of Ag-110m is related to temperature, the time a compact stays at elevated temperatures, and the amount of Ag-110m present in the compact while it is at temperature. The retention is then a multi-physics problem that is dependent on several time-varying phenomena (besides temperature) such as neutron flux, neutron fluence, and radionuclide inventory. Due to a large number of spectra that had no detectable Ag-110m in the initial scans, the Level 2 and 3compacts from Capsule 5 were rescanned with longer scan times (120 minutes versus 45 minutes) to better evaluate the remaining inventory.
Table 2. Measured Ag-110m inventory as a percent of the predicted inventory for compacts from AGR-2Capsules 2, 3, 5, and 6. The asterisk (*) in each compact ID number corresponds to the capsule number.
CompactMeasured Ag-110m inventory as a percent of the predicted inventory
The uncertainty on the measured/calculated activity ratio is not symmetric. The lower uncertainty band is equal to the square root of the sum of the squares of the activity uncertainty for each scan with a detectable amount of Ag-110m present for all scans that correspond to a particular compact. The upper uncertainty band is also equal to the square root of the sum of the squares of the activity uncertainty for each scan; however, in the case of a scan with an undetectable amount of Ag-110m, the activity uncertainty is replaced with the minimum detectable activity. Thus, the upper uncertainty band is always larger than the lower uncertainty band. Typically, the Stack 1 and Stack 2 compacts that were irradiated atthe same level (e.g., Compacts 6-4-1 and 6-4-2) are similar in the measured/calculated Ag-110m activity ratio, but this trend does not always hold true (e.g., Compacts 5-3-2 and 5-3-1). More investigation into why compacts that had very similar irradiation conditions, but very different Ag retention, is warranted. Destructive examination [14] and safety testing [15] are in progress on the AGR-2 compacts, and will provide additional information on silver retention. In addition, the silver retention of the fuel compacts has been compared to fuel performance models [16].
8
Figure 5. Decay-corrected, measured to predicted Ag-110m activity ratios for each US AGR-2 capsule as a function of the TAVA irradiation temperatures calculated in Ref 13.
3.2 Holder Gamma Spectrometry ResultsThe off-axis scans for Capsules 2 and 3 for several fission products are shown in Figure 6. The scans
are plotted so that the left side scan that contains Stack 2 and half of Stack 3 is shown on the left of the plot and the right side scan containing Stack 1 and half of Stack 3 is shown on the right of the plot.Holder 2 axial scans detected the presence of Ag-110m, Eu-154, Cs-134, and Cs-137 in the graphite. Most notably, the scans contained a consistently strong Cs-134 and Cs-137 signal isolated about Level 2(location of the second level of compacts from the bottom, see Figure 2). Tomographic scans were able to identify that the cesium activity was predominantly located adjacent to the original location of Compact 2-2-3 in the graphite holder. The tomograms for Cs-134 and Cs-137 distribution at Level 2 of Holder 2are shown in Figure 7. This suggests that this compact may have contained one or more particles that experienced SiC layer failure, releasing relatively high fractions of cesium isotopes. Subsequent PIE showed that there were several TRISO particles that experienced SiC layer failure in AGR-2Compact 2-2-3.[14] Capsule 2 was run at relatively high temperatures (time-average, volume-average temperature for all compacts in the capsule was 1252°C) [13], which likely contributed to the release of Eu-154 into the holder. Eu-154 inventory measurable by gamma scanning was not observed in any of the AGR-1 capsules, none of which were operated at such high temperatures for long durations. Figure 6 and Figure 8 indicate that Eu-154 released locally to the graphite but did not migrate significantly.
The only significant fission product present in Holder 3 was Ag-110m, and it was only present atLevels 2 and 3 of the holder (see Figure 6). This is consistent with Capsule 3 compact measurements, which indicated elevated release of Ag-110m from the Level 2 and 3 compacts for all three stacks. Tomograms of Holder 3 Level 2 indicate Ag-110m is distributed locally near the compacts in the cool regions of the graphite near each stack as seen in Figure 9. Holder 3 contained no detectable Cs-134 or Cs-137, indicating TRISO particles with a failed SiC layer were unlikely to be present in this capsule.
Off-axis scans of Capsule 5 indicated large amounts of Ag-110m at Levels 2 and 3 in the holder (Figure 10). Small amounts of Cs-137 and Cs-134 were also located at Levels 2 and 3 of the holder. No other fission products were detected in the graphite holder. The Cs spikes centered around Levels 2 and 3
0.00
0.20
0.40
0.60
0.80
1.00
1.20
1.40
800 900 1000 1100 1200 1300 1400
Ag-1
10m
Mea
sure
d to
Pre
dict
ed R
atio
TAVA Irradiation Temperature (°C)
Capsule 2
Capsule 3
Capsule 5
Capsule 6
1 1
x
• 1■0 I •I AA
A X •
•
x •• x •
** x -W' • •
•
9
indicate that there may be one or more TRISO particles with a failed SiC layer in at least one of the compacts at these levels. Gamma tomography was performed on both of these levels. The Cs-134tomograms from this analysis are shown in Figure 11. These images indicate that the Cs activity is adjacent to the compact in Stack 3 at both levels, suggesting the possibility that Compact 5-2-3 and/or Compact 5-3-3 may contain TRISO particles with failed SiC layers.
Off-axis scans of AGR-2 Holder 6 were also performed. In the case of Holder 6, elevated levels of Ag-110m were detected at the axial ends of the holder (Figure 12). This is similar to what was seen in Holder 1 and Holder 6 in AGR-1. Radioactive Cs isotopes were found at very low levels at Levels 2 and 3of the holder and are also included in Figure 12. Tomographic scans that split Levels 2 and 3 of Holder 6again indicate Cs release from Stack 3 (see Figure 13). The data suggest that Compact 6-2-3 and/or Compact 6-3-3 may contain particles with failed SiC layers.
Figure 6. Off-axis distribution of different fission products detected in left and right side axial scans of Holders 2 and 3.
0
0.1
0.2
0.3
0.4
0.5
0.6
0.7
0.8
0.9
1
0
5
10
15
20
25
30
35
40
30 35 40 45 50 55Cs
Act
ivity
(MBq
)
Ag a
nd E
u Ac
tivity
(MBq
)
Axial position of activity in holder for off-axis scans (cm) (second scan shifted)
Figure 10. Off-axis distribution of different fission products detected in left and right side axial scans of Holder 5.
Figure 11. Tomographic Cs-134 gamma scans from Levels 2 (left) and 3 (right) of AGR-2 Holder 5.
0.00
0.10
0.20
0.30
0.40
0.50
0
5
10
15
20
25
30
30 35 40 45 50 55
Cs Is
otop
es A
ctiv
ity (M
Bq)
Ag-1
10m
Act
ivity
(MBq
)
Axial postion of activity in holder for off-axis scans (cm) (second scan shifted)
Ag-110m
Cs-134
Cs-137
1286
2.032
1.778
1.524
1.270
1.016
0.762
0508
0254
0 .00-0.254
-0.508
-0.762
-1.016
-1.270
-1.524
-1.778
-2.032
-2.236
7 ▪ 7 7;Km)
2.70
1.52.206
2 032
1_770 2.25
I 2 1.524
1_2701.80
1.010
0.9 0.762
0508 135
5254mnmE
mmE0.60000
P2 -0.254
6.*-0508
0.3-0.70 0.45
-1.016
0.0-1.270
-1.524 eord43211 0.00
-1.778
-1032
-2.28
r re. F46 6 d
▪ $X g
..`„.t 11 T xim,
W
12
Figure 12. Off-axis distribution of Ag-110m detected in left and right side axial scans of Holder 6.
Figure 13. Tomographic Cs-134 gamma scans from Levels 2 (left) and 3 (right) of AGR-2 Holder 6.
0
1
2
3
4
5
6
7
8
9
10
0.0
0.2
0.4
0.6
0.8
1.0
1.2
1.4
1.6
1.8
2.0
30 35 40 45 50 55
Ag-
110m
Act
ivity
(MB
q)
Cs
Act
ivity
(MB
q)
Axial postion of activity in holder for off-axis scans (cm) (second scan shifted)
Cs-134 Cs-137 Ag-110m
z7r
,;,̀ HP,A5Aten0
RiE I A7 7 7
13
3.3 Total Holder Inventories Based on PGS ExamsIt is possible to estimate the inventory of gamma-emitting fission products in the graphite holders by
summing the measured activity from each scan taken during the off-axis scans of the holders. The total activity from the off-axis scans is shown in Table 3 for the fission products that were detected in any of the holders. The confidence intervals for these activities are shown after the activities. The lower confidence interval is equal to the square root of the sum of the squares of the activity uncertainties from counting statistics. The upper bound is equal to the square root of the sum of the squares of the activity uncertainties for each scan. The uncertainty was determined from counting statistics for scans with detectable activity, and if no activity was detected the minimum detectable activity was taken to be the uncertainty for that spectrum. Thus the upper uncertainty on an activity is always larger than the lower uncertainty. If no activity was detected (for example Cs-134 in Holder 3), the square root of the sum of the squares of the minimum detectable activities in each scan was taken as the minimum detectable activity for the entire holder. This was the case for Cs-134 and Eu-154 in Holder 3 and Eu-154 in Holder 6. The detected activities for Cs-137 in Holder 3 and Eu-154 in Holder 5 are due to inconsistent detectable activity signals over several consecutive scans and may be spurious signals as indicated by their large uncertainties. Spurious signals may be caused by the peak fitting software forcing a peak fit inbackground counts. All the other signals are consistent over several scans and indicate areas of released fission products present in the holder. The corresponding fraction of inventory released to the graphite holder for a specific isotope is shown in Table 4. If no activity was detected, the root sum of squares for the minimum detectable activity of each scan is used to calculate the upper bound for fractional release to the holder.
Table 3. Total activity in MBq of fission products present in each graphite holder.Ag-110m (MBq) Cs-134 (MBq) Cs-137 (MBq) Eu-154 (MBq)
3.4 Silver in Additional Capsule ComponentsIn addition to scanning with PGS, capsule components were sent to the hot cells at the Analytical
Laboratory at the INL Materials and Fuels Complex for quantitative gamma spectrometry analysis of fission product inventories. The graphite spacers were gamma counted on an out-of-cell HPGe detector.The capsule shells were leached, and the leachate for each capsule shell was analyzed for gamma emitting fission products and Sr-90. Because negligible fission product activity was found in gas exit lines in AGR-1, the exit lines were not evaluated in the AGR-2 analysis.
The amount of decay-corrected Ag-110m detected in the compacts and in each capsule component was combined and compared to the expected value from simulations to create a total Ag-110m mass balance for each capsule, shown in Figure 14. The apparent over-recovery of Ag-110m in Capsule 5 and
14
Capsule 3 are likely due to under-prediction of the amount of Ag-110m in those capsules. A portion of the under-recovery of Ag-110m in Capsule 6 may be due to an over-prediction of the burnup in thesecapsules (especially Capsule 6, as shown in Figure 4) in addition to potential losses during chemical processing of the capsule components. This is especially true when large portions of the Ag-110m are found on the capsule hardware or capsule shells, as this measurement has high experimental uncertainties.Overall this agreement is acceptable and similar to what was seen in AGR-1. In AGR-1, the Ag-110m inventory balance for capsules with large amounts of Ag-110m on the capsule hardware was lower than when more was retained in the holders and the compacts [9].
Figure 14. Inventory of Ag-110m in different capsule components compared to the predicted inventory for each capsule.
4. CONCLUSIONSGamma spectrometry scans of the U.S. capsules from AGR-2 have been completed. The
gamma-emitting fission product inventory of each compact has been determined and compared to simulations of the irradiation test. The burnup of each compact from AGR-2 has been estimated using gamma spectrometry on both a whole-compact level by the direct Cs-137 inventory and axially along the compact length by the Cs-134 to Cs-137 ratio. The experimentally-measured burnup agrees well, within 0.7 % FIMA for capsule average values, with the predicted burnup.
The retention of Ag-110m in the compacts was also measured. The release of Ag-110m is a complex multi-physics phenomenon and this measurement will provide additional information to help evaluate the modeling of Ag-110m release. The retained fraction of Ag-110m from these measurements also helps to guide which compacts are chosen for further PIE such as destructive exams and safety testing that can provide additional data on the mechanisms of Ag-110m release.
Fission product distribution and inventory in the graphite holders was also examined. The axial distribution of fission products guides additional scanning that can be used to identify the location of
0.000
0.200
0.400
0.600
0.800
1.000
1.200
Capsule 6 Capsule 5 Capsule 3 Capsule 2
Ag-1
10m
Fra
ctio
n
Capsule Hardware
Spacers
Holders
Compact Total
67%
118% 113%
61%
15
TRISO particles that are potentially defective or failed. The inventory of Ag-110m in other capsule components was also evaluated and compared against the predicted inventory. These results show that a majority of the Ag-110m generated in the test has been accounted for in the experimental measurements.
5. GAMMA SPECTROMETRY DATA FROM CAPSULE 1 AND CAPSULE 4
Gamma spectrometry was also performed on Capsule 1 and Capsule 4 from AGR-2. The data from Capsule 1 which contained TRISO fuel compacts from Commissariat à l’énergie atomique (CEA) is documented in INL/LTD-16-39736 [17]. The data from Capsule 4 which contained TRISO fuel compacts from Pebble Bed Modular Reactor Ltd. (PBMR) is documented in INL/LTD-16-39729 [18].
6. REFERENCES
[1] Demkowicz, P. A., J. D. Hunn, S. A. Ploger, R. N. Morris, C. A. Baldwin, J. M. Harp, P. L. Winston, T. J. Gerczak, I. J. Van Rooyen, F. C. Montgomery, and C. M. Silva, “Irradiation Performance of AGR-1 High Temperature Reactor Fuel,” Nuclear Engineering and Design,Vol. 306, September 2016, pp. 2–13.
[2] Morris, R. N., C. A. Baldwin, P. A., Demkowicz, J. D. Hunn, and E. L. Reber, “Performance of AGR 1 High Temperature Reactor Fuel During Post Irradiation Heating Tests,” Proceedings of the 7th International Topical Meeting on High Temperature Reactor Technology (HTR2014), Weihai, China, October 27–31, 2014, Paper HTR2014 31135.
[3] Petti, D.A., et al., Technical Program Plan for the Advanced Gas Reactor Fuel Development and Qualification Program, Rev. 1, INL/EXT-05-00465, August 2005.
[4] Petti, D. A., J. Maki, J. D. Hunn, P. Pappano, C. Barnes, J. Saurwein, S. Nagley, J. Kendall, andR. Hobbins, “Overview and Status of the DOE Advanced Gas Reactor (AGR) Fuel Development and Qualification Program,” The Journal of The Minerals, Metals & Materials Society,September 2010, p. 62–66.
[5] PLN-3798, “AGR-2 Irradiation Experiment Test Plan,” Rev. 1, October 5, 2011.
[6] Grover, S. B. and D. A. Petti, “Status of the NGNP Fuel Experiment AGR-2 Irradiated in the Advanced Test Reactor,” Nuclear Engineering and Design, Vol. 271, May 2014, Pages 238–243, http://dx.doi.org/10.1016/j.nucengdes.2013.11.038.
[7] Collin, B. P., AGR-2 Irradiation Test Final As-Run Report, Idaho National Laboratory, INL/EXT-14-32277 Rev. 2, October 8, 2014.
[8] Harp, J. M., P. A. Demkowicz, P. L. Winston, and J. W. Sterbentz, “An analysis of Nuclear Fuel Burnup in the AGR-1 TRISO Fuel Experiment Using Gamma Spectrometry, Mass Spectrometry, and Computational Simulation Techniques,” Nuclear Engineering and Design, Vol. 278,October 2014, pp. 395–405.
[9] Demkowicz, P. A., J. M. Harp, P. L. Winston, and S. A. Ploger, Analysis of Fission Products on the AGR-1 Capsule Components, INL/EXT-13-28483, March 28, 2013.
[10] Hunn, J. D., C. A. Baldwin, T. J. Gerczak, F. C. Montgomery, R. N. Morris, C. M. Silva,P. A. Demkowicz, J. M. Harp, and S. A. Ploger, “Detection and Analysis of Particles with Failed SiC in AGR-1 Fuel Compacts,” Nuclear Engineering and Design, Vol. 306, September 2016, pp. 36–46.
[11] Sterbentz, J. W., “Preliminary JMOCUP As-Run Daily Depletion Calculation for the AGR-2Experiment in ATR B-12 Position,” ECAR-2066, Idaho National Laboratory, 2014.
16
[12] Harp, J. M. and P. A. Demkowicz, “Investigation of the Feasibility of Utilizing Gamma Emission Computed Tomography in Evaluating Fission Product Migration in Irradiated TRISO Fuel Experiments,” Proceedings of HTR 2014, Weihai, China, October 27–31 2014.
[13] Hawkes, G. L., “AGR-2 Daily As-Run Thermal Analyses,” ECAR-2476, Rev. 1, Idaho National Laboratory, 2014.
[14] Hunn, J. D., C. A. Baldwin, F. C. Montgomery, T. J. Gerczak, R. N. Morris, G. W. Helmreich, P. A. Demkowicz, J. M. Harp, and J. D. Stempien, “Initial Examination of Fuel Compacts and TRISO Particles from the US AGR-2 Irradiation Test,” Proceedings of 8th International Topical Meeting on High Temperature Reactor Technology (HTR2016), Las Vegas, Nevada, USA, November 6–10, 2016, Paper 18443.
[15] Morris, R. N., C. A. Baldwin, J. D. Hunn, and P. A. Demkowicz, “Initial Results from Safety Testing of U.S. AGR-2 Irradiation Test Fuel,” Proceedings of 8th International Topical Meeting on High Temperature Reactor Technology (HTR2016), Las Vegas, Nevada, November 6–10, 2016,Paper 18574.
[16] Collins, B. P., P. A. Denkowicz, C. A. Baldwin, J. D. Hunn, and J.M. Harp, “Comparison of Silver Release Predictions Using PARFUME with Results from the AGR-2 Irradiation Experiment,” Proceedings of 8th International Topical Meeting on High Temperature Reactor Technology(HTR2016), Las Vegas, Nevada, November 6–10, 2016, Paper 18579.
[17] Harp, J. M., Gamma Scanning of AGR-2 Compacts and Graphite Holders from Capsule 1, Idaho National Laboratory Report, INL/LTD-16-39736.
[18] Harp, J. M., Gamma Scanning of AGR-2 Compacts and Graphite Holders from Capsule 4, Idaho National Laboratory Report, INL/LTD-16-39729.