FLAME HEIGHTS AND HEAT TRANSFER FROM GASEOUS, LIQUID AND SOLID FUELS FOR BURN PATTERN REPEATABILITY RESEARCH Daniel Madrzykowski National Institute of Standards and Technology, Gaithersburg, MD 20899, USA Charles Fleischmann, PhD Department of Civil and Natural Resources Engineering University of Canterbury Christchurch, NZ ABSTRACT In 2009, the National Research Council of the National Academies (U.S) published a report identifying the research needs of the forensic science community. In the field of fire investigation, one of the specific needs identified was research on the natural variability of burn patterns. A multi- year study to examine the repeatability of burn patterns has been started. This presentation will provide the results from the initial phase of the study in which fires from three different fuels were characterized. These fires will serve as the source fires for the residential scale, pre-flashover fire pattern repeatability experiments. Experiments were conducted with three different fuels: natural gas, gasoline and polyurethane foam. Replicate experiments were conducted with each of the fuels, in order to examine the repeatability of the fires. Heat release rate, temperatures in the plume, and a heat flux measurement along the centerline of the plume were measured. Flame movement and height was recorded with photographs and videos. Years of fire research have provided many methods, ranging from simple algorithms to computational fluid dynamics models for predicting flame characteristics such as median flame height, plume temperatures, and radiant heat flux. Popular algorithms that have been identified for use in fire investigations or fire hazard analysis have been applied to the three different fuels and the predictions compared with the results of the fire experiments. INTRODUCTION According to the United States Fire Administration, in 2006, the third highest cause of residential structure fires in the United States were intentional (incendiary or suspicious) fires. The leading cause of civilian deaths in residential structure fires were intentional fires, which accounted for 11.7% of the fatalities. These intentional structure fires are also the leading cause of property loss, at more than 8% 1 . According to the National Fire Protection Association, there are approximately 316,610 intentional fires set annually in the United States. The average civilian casualty rates during the period 2003 through 2006, were 437 civilian deaths and 1,404 civilian injuries. In 2006, 10 fire fighters died and 7,200 on duty, at scene fire fighter, were injured at intentionally set fires. More than $1.1 billion dollars (U.S.) was lost due to direct property damage. Only an estimated 28,000 intentional fires involved residential structures. However these residential fires accounted for more than 80% of the
Transcript
FLAME HEIGHTS AND HEAT TRANSFER FROM GASEOUS, LIQUID AND SOLID FUELS FOR BURN
PATTERN REPEATABILITY RESEARCH
Daniel Madrzykowski National Institute of Standards and Technology,
Gaithersburg, MD 20899, USA
Charles Fleischmann, PhD Department of Civil and Natural Resources Engineering
University of Canterbury Christchurch, NZ
ABSTRACT In 2009, the National Research Council of the National Academies (U.S) published a report identifying the research needs of the forensic science community. In the field of fire investigation, one of the specific needs identified was research on the natural variability of burn patterns. A multi-year study to examine the repeatability of burn patterns has been started. This presentation will provide the results from the initial phase of the study in which fires from three different fuels were characterized. These fires will serve as the source fires for the residential scale, pre-flashover fire pattern repeatability experiments.
Experiments were conducted with three different fuels: natural gas, gasoline and polyurethane foam. Replicate experiments were conducted with each of the fuels, in order to examine the repeatability of the fires. Heat release rate, temperatures in the plume, and a heat flux measurement along the centerline of the plume were measured. Flame movement and height was recorded with photographs and videos.
Years of fire research have provided many methods, ranging from simple algorithms to computational fluid dynamics models for predicting flame characteristics such as median flame height, plume temperatures, and radiant heat flux. Popular algorithms that have been identified for use in fire investigations or fire hazard analysis have been applied to the three different fuels and the predictions compared with the results of the fire experiments. INTRODUCTION According to the United States Fire Administration, in 2006, the third highest cause of residential structure fires in the United States were intentional (incendiary or suspicious) fires. The leading cause of civilian deaths in residential structure fires were intentional fires, which accounted for 11.7% of the fatalities. These intentional structure fires are also the leading cause of property loss, at more than 8% 1.
According to the National Fire Protection Association, there are approximately 316,610 intentional fires set annually in the United States. The average civilian casualty rates during the period 2003 through 2006, were 437 civilian deaths and 1,404 civilian injuries. In 2006, 10 fire fighters died and 7,200 on duty, at scene fire fighter, were injured at intentionally set fires. More than $1.1 billion dollars (U.S.) was lost due to direct property damage. Only an estimated 28,000 intentional fires involved residential structures. However these residential fires accounted for more than 80% of the
civilian deaths and injuries and more than 60% of the direct property damage from all intentional fires 2 .
The national clearance rate of arson fire cases is less than 20 percent with a conviction rate of approximately 5-7%. Arson is a challenging crime to solve because typically there are no witnesses present at the time of the crime. According to the data that Flynn has analyzed, nearly 2/3 of intentional structure fires were either confined or limited to the object of origin 2.
Fires are investigated in order to determine the “origin and cause” of the fire and in some cases there is an effort to determine who was responsible for setting the fire. The fire investigation process must follow the scientific method as documented in NFPA 921, Guide for Fire and Explosion Investigations 3. There are numerous textbooks on the subject of conducting a fire investigation 4-9. The NFPA guide and the texts provide information to a fire investigator collecting data from the scene, analyzing the data, and developing a hypothesis about the fire.
Patterns produced by the fire are in many cases a significant portion of the data collected at the scene. One of the basic methods of documenting the fire scene is to photograph fire patterns. As noted by Icove and DeHaan, “the ability to document and interpret fire patterns accurately is essential to investigators reconstructing fire scenes…” 7. A fire pattern is defined in NFPA 921 as, “the visible or measurable physical change, or identifiable shapes, formed by a fire effect or group of fire effects” 3. Various types of fire patterns, such as; “V-shaped”, “hour-glass”, and “inverted cone”, have come from common observation at actual fire scenes. As a result, the observations are typically qualitative in nature.
Previous fire pattern research by the National Institute of Justice (NIJ), the National Institute of Standards and Technology (NIST), and the United States Fire Administration (USFA) has shown that fire patterns provide data useful for the determination of fire origin. The reports noted the impact of ventilation on the development of the burn patterns 10-11. A large number of other factors affect the formation of these patterns: burn time, heat release rate of the fire source, fire exposure, target fuel composition, adjacent fuel(s) and compartmentation, to name a few. Given the limited number of experiments in the literature and the large number of variables involved, it has been difficult to fully understand a cause and effect relationship between the fire scenarios and the resulting patterns.
In 2009, the National Research Council of the National Academies (U.S) published a report identifying the research needs of the forensic science community. In the field of fire investigation, one of the specific needs identified was “…much more research is needed on the natural variability of burn patterns and damage characteristics and how they are affected by the presence of various accelerants” 12. Previously, the Fire Protection Research Foundation convened a Research Advisory Council on Post-fire Analysis in 2002. Recommendations for research and developments in their white paper included, “advance the capabilities of computational fluid dynamics fire modeling, particularly as applied to fire ignition scenarios and fire pattern development and interpretation” 13.
Fire models are another tool that may be used by a fire investigation team to gain insight into the growth and development of a fire and to test the investigator’s hypothesis on origin and cause14. However for fire models to be demonstrated as reliable and suitable for use in court, validation and verification studies are needed to provide the scientific basis for the use of fire models for re-construction without the need for a significant amount of fire testing to support the model.
These results will enable fire investigation teams to have a better understanding of the fire scene and enable improved analysis of their hypothesis on the area of origin. Improved measurements and documented repeatability of burn patterns combined with validation and verification of FDS/Smokeview’s capability to model burn patterns will lead to improved investigations ultimately resulting in a reduction in intentional fires and a decrease in the loss of life and property 15-17.
A multi-year study to examine the repeatability of burn patterns has been started. In order to examine the repeatability of the burn patterns, the repeatability of the initial fires which cause the damage must be well characterized. This paper will focus on the initial phase of the study in which fires from different fuels were characterized. These fires will serve as the source fires for the pre-flashover fire pattern repeatability experiments.
TECHNICAL APPROACH
A series of experiments were conducted to characterize a range of representative pre-flashover fires that can be expected from intentional and accidental fires. A fixed fire source footprint, 0.305 m (1 ft) square was chosen for this study and a range of common fuels were selected. The fires were burned under an oxygen consumption calorimetry hood to determine the heat release rate. Heat release rate, mass loss of the fuel, temperatures in the plume, and a heat flux profile along the centerline of the plume were measured. Flame movement and height was recorded with photographs and videos. Given the focus on residential fires, small source fires were desired so that the burn pattern would be limited to less than 2.4 m (8 ft) in height. Replicate experiments were conducted with each of the fuels, in order to examine the repeatability of the fires and to quantify the variability in the flames.
Fuels
It was desirable to use fuels of different types in this study. Experiments were conducted with a natural gas fueled burner, a liquid fueled pan fire, and a solid fuel. Natural gas was chosen as a fuel because it is used for calibrating the oxygen consumption calorimeters in NIST’s Large Fire Laboratory. Therefore the heat content of the gas was monitored and mass flow controlled to provide a heat release rate based on fuel flow for comparison with the heat release rate values measured with the calorimeter. The gas burner arrangement provides the most idealized fire, in that it can be ignited and brought up to a near steady state heat release rate within a few seconds and then be shut down just as quickly. This is important in future phases of the study for determining the amount of energy transferred to the exposed surface.
Gasoline is the fuel of choice for the liquid fueled pan fire. Although gasoline is not an ideal fuel to use in experiments due to the many components and additives which are specific to manufacturers, change from season to season, and vary based on requirements or restrictions of the locality. Gasoline is a real fuel and fire incident data shows that gasoline was the first item ignited in majority of intentional fires where flammable or combustible liquids were used 18. In addition, data from forensic laboratories, collected by Babrauskas and others, indicates that gasoline is the most prevalent accelerant found as part of the analysis of fire debris samples 19, 20.
Polyurethane foam was chosen as the solid fuel. According to the Polyurethane Foam Association, flexible polyurethane foam is the most widely used cushioning material in upholstered furnishing and mattresses. More than 1.7 billion pounds are produced in the U.S. every year 21,22. In Rohr’s study, “Products First Ignited in U.S. Home Fires”, upholstered furniture and mattresses and bedding were the first items ignited in 33% of the fatal fires in the U.S. based on averaged data from 1999 through 2002 23.
Instrumentation
The experiments were conducted in the NIST Large Fire Research Laboratory’s 3 m by 3 m oxygen depletion calorimeter. The expanded uncertainty of this device has been estimated as ± 11 % on the measured heat release rate. Details on the operation and uncertainty in measurements associated with the oxygen depletion calorimeter were documented by Bryant et.al. 24. The data was recorded at intervals of 1 s on a computer based data acquisition system.
Water cooled, Schmidt-Boelter total heat flux gauges were used to measure the heat flux. The sensing surface of the heat flux gauges were located 0.95 m (3.1 ft) from the center of the burner/fuel and 0.50 m (1.5 ft) above the top of the burner/pan lip/fuel surface. The manufacturer reports a ± 3 % calibration expanded uncertainty for these devices 25. Results from an international study on total heat flux gauge calibration and response demonstrated that the uncertainty of a Schmidt-Boelter gauge is typically ± 8 % 26. The gauges were mounted to uprights of the steel instrumentation support frame on opposite sides of the fire.
The fires were centered under the hood of the calorimeter on a non-combustible platform measuring 0.91 m (3.0 ft) x 1.2 m (4.0 ft) x 12 mm (0.5 in ) thick supported by the load cell. The load cell had a resolution of a 0.001 kg (0.002 lbs) 27. The expanded uncertainty is estimated to be ± 5 %.
Gas temperatures were measured with exposed-bead, Chromel-Alumel (type K) thermocouples, with a 1.0 mm (0.04 in) nominal diameter. Starting from the exposed bead, the thermocouple wire was sheathed in a 3.2 mm (0.13 in) diameter inconel shield, 0.76 m (2.5 ft) in length. The standard uncertainty in temperature of the thermocouple wire itself is ± 2.2 °C at 277 °C and increases to ± 9.5 °C at 871 °C as determined by the wire manufacturer 28. The variation of the temperature in the environment surrounding the thermocouple is known to be much greater than that of the wire uncertainty 29, 30. Small diameter thermocouples were used to limit the impact of radiative heating and cooling. The estimated total expanded uncertainty for temperature in these experiments is ± 15 %.
The thermocouples were mounted on a steel frame. The frame enabled the thermocouples to be installed at 0.10 m (0.33 ft) intervals beginning at 0.10 m (0.33 ft) to 1.2 m (4.0 ft) above the burner/pan lip/ fuel surface. At each 0.10 m (0.33 ft), there were 5 thermocouples: 1 centered in the burner/fuel surface and 1 centered on each edge of the burner/fuel surface, for a total of 70 thermocouples.
The natural gas burner was .305 m (1 ft) on a side and top surface of the burner was 76 mm (3 in) above the floor. The shell of the burner was made from steel and filled with “pea sized” gravel with an average diameter of 6 mm (0.25 in). A steady state heat release rate of approximately 80 kW was used for the experiments.
The gasoline pan fire used 500 mL of unleaded gasoline with an 87 octane rating. The pan was constructed from 6 mm (0.25 in) thick steel. The inner dimension of the pan was 0.305 m (1 ft) on a side and 19 mm (0.75 in) high. The pan was elevated in order to bring the pan lip height up to 76 mm (3 in) above the floor. The 500 mL of gasoline gave a fuel depth of 5.5 mm (~0.25 in) and provided a burn time of approximately 5 minutes.
The solid fuel was composed of polyurethane foam, with a density of approximately 23 kg/m3. Each block of foam was 0.305 m (1 ft) on a side and was 76 mm (3 in) thick. The bottom and sides of the foam block were wrapped in aluminum foil to prevent the fuel from moving or spreading as it burned. Replicate experiments were conducted with each of the fuels.
RESULTS
Flame Heights
Each of the experiments was photographed with a digital SLR camera, fixed on a tripod, with a capability of capturing at least 5 images per second. Located adjacent to the camera was a video camera recording images at approximately 30 frames per second. In this paper, the mean flame height for each fuel was determined from the still photographic images. Examples of the types of images are presented in Figures 1 and 2 shown below. Figure 1 presents a photograph of the natural gas flame taken during a period of “steady state” burning at approximately 80 kW and a photograph of the polyurethane foam taken near its peak heat release rate of approximately 60 kW. Figure 2 presents
two photographs of the same gasoline fueled fire when it was burning near its peak heat release rate of 100 kW. The two photographs, taken 0.2 s apart, represent the range of the observed flame heights one of the gasoline experiments from 0.65 m (2.1 ft) and 1.0 m (3.3 ft), respectively.
Figure 1a and 1b. Photographs showing a natural gas flame (left) and a polyurethane foam fueled experiment under the oxygen depletion calorimeter.
Figure 2a and 2b. Photograph showing a gasoline fueled experiment with a flame height of 0.65 m (left) and a photograph taken approximately 0.2 seconds later with a flame height of 1.0 m.
Heat Release Rate
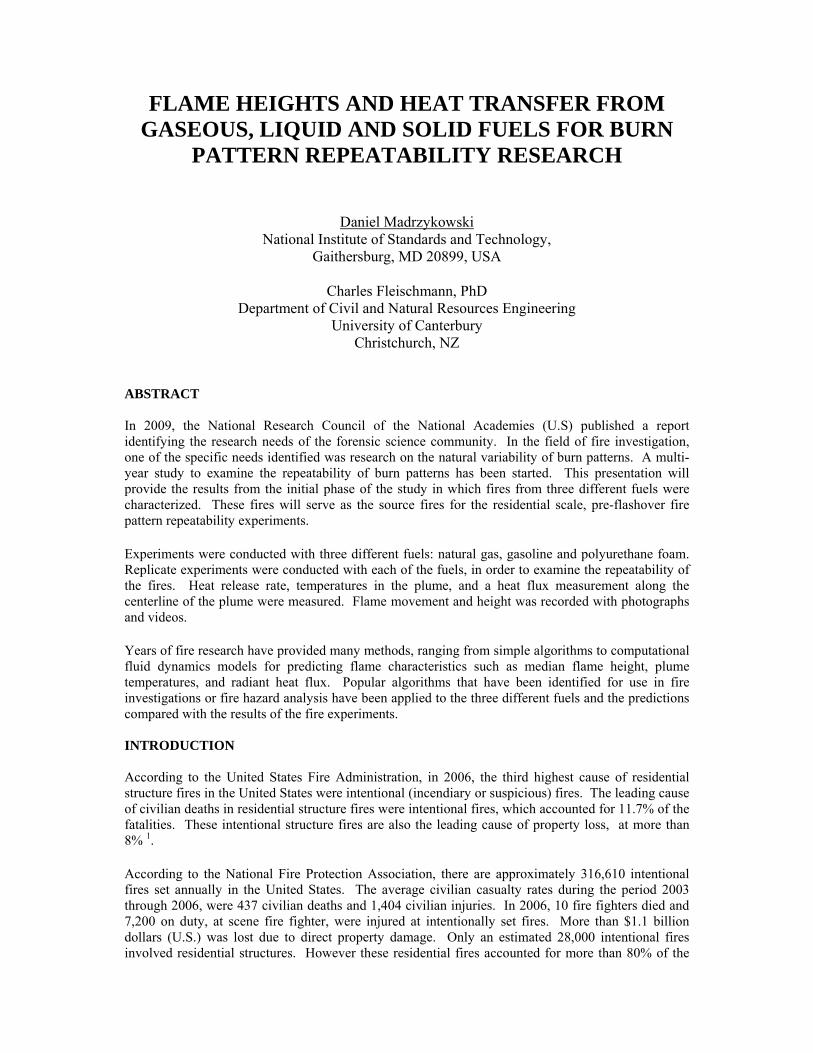
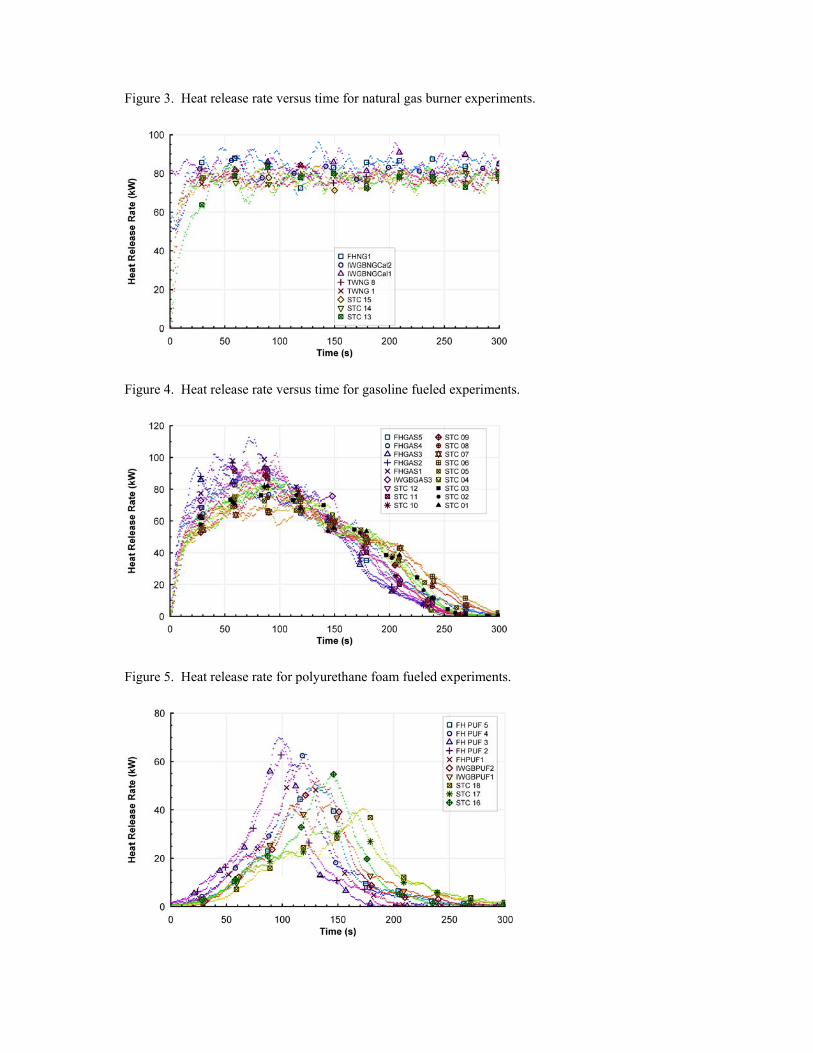
Figures 3 through 5 are graphs showing heat release rate versus time for the natural gas, gasoline and polyurethane foam fueled fires. Each experiment has a unique label and symbol. In each graph, the
Figure 3. Heat release rate versus time for natural gas burner experiments.
Figure 4. Heat release rate versus time for gasoline fueled experiments.
Figure 5. Heat release rate for polyurethane foam fueled experiments.
replicate heat release time histories are overlaid to give a sense of the repeatability for each fuel. The results support the premise of why these fuels were chosen. The natural gas burner provided the most repeatable results, with an average steady state heat release rate of approximately 80 kW with an average total heat release of 23.3 MJ over the 300 second period after ignition. The gasoline, based on an average of the 18 experiments, had a peak heat release rate of approximately 80 kW sustained from 50 seconds to 100 seconds after ignition, yielding 13.6 MJ of total heat release over 300 second period after ignition. The polyurethane foam demonstrated the largest variability of the three fuels in terms of peak heat release rate and time to peak heat release. Averaging the ten experiments yielded an average peak heat release rate of approximately 45 kW at 105 s, with a total heat release of 4.3 MJ over a 260 second period after ignition.
Total Heat Flux
The repeatability of the total heat flux values varied in a manner similar to the heat release rates. The average peak total heat flux for the natural gas fires were approximately 2.3 kW/m2. The average peak values for the gasoline and polyurethane foam were approximately 3.5 kW/m2 and 2.5 kW/m2 respectively. The values are only presented for the experiments which had two heat flux gauges installed as described in the instrumentation section above.
Figure 6. Heat flux versus time for natural gas burner experiments.
Figure 7. Heat flux versus time for gasoline fueled experiments.
Figure 8. Heat flux versus time for polyurethane foam fueled experiments.
ANALYSIS
Years of fire research have provided many methods, ranging from simple algorithms to computational fluid dynamics models, for predicting flame characteristics such as median height, plume temperatures, and radiant heat flux 31-34. A few algorithms have been presented as initial calculations or screening methods for use in fire investigations or fire hazard analysis 7, 32-35. Two of these algorithms; one for estimating the mean flame height and other for estimating the heat flux to a target have been applied using the heat release rate results from the three different fuels and the predictions compared with the results of the fire experiments.
Flame Height Calculation
Heskestad, developed an empirical method for calculating the mean visible flame height for fuels which do not have substantial in-depth combustion. Appropriate fuels would “include liquid pool fires and other horizontal surface fires” 32, 35.
DQfH 02.15/2235.0 −= & [1]
Hf = Flame Height (m)
Q& = Heat Release Rate (kW)
D = Diameter of burner (m)
Given that the fuel configurations are square, a conversion of the fuel surface area to the effective diameter is required in order to use Heskestad’s flame height equation directly. Setting the area of the fuel surface, 0.093 m2, equal to π D2/4 and then solving for D yields an effective diameter of 0.344 m
Calculating the flame heights with the average peak heat release rates measured from the three fuels yields 1.0 m (3.3 ft), 1.0 m (3.3 ft), and 0.73 m (2.4 ft) for natural gas, gasoline, and polyurethane foam respectively. Taking the uncertainty of the measurements used to determine the heat release rate (±11%) into account generates a range of values. The range of calculated values are compared with the mean flame height and range for flame heights based on photographic analysis for each of the fuels in Table 1. For each experiment at least 5 to 10 s of photographs (30 to 60 images) taken during the observed peak flame heights were examined to determine the height of the continuous flame for each image. The values were then averaged to determine the mean flame height. Based on the photo analysis of this limited data set, the calculated values for mean visible flame height are close to the observed average peak values. It should be noted that the coefficient, 0.235, is dependent on the ratio of the heat of combustion to the actual mass stoichiometric ratio of air to volatiles of the fuel. For many liquid and gaseous fuels this coefficient is representative, Heskestad points out, however, that some common fuels, such as gasoline, deviate from the cited range. For gasoline a coefficient value of 0.2 should be used 32.
Table 1. Comparison of the calculated mean visible flame height with the averaged mean visible flame height and averaged range of visible flame heights for each of the fuels during peak heat release rate.
Fuel Calculated Mean Hf (m)
Mean Hf Photographs (m)
Range Hf Photographs (m)
Natural Gas 0.94 - 1.1 0.70 0.50 to 0.98 Gasoline (0.235) 0.94 – 1.1 0.84 0.52 to 1.1 Gasoline (0.2) 0.75 – 0.85 0.84 0.52 to 1.1 Polyurethane Foam 0.68 – 0.77 0.46 0.30 to 0.78
Heat Flux to a Target Surface
Another common value to approximate from heat release rate data is the heat flux to a target 7, 33-35. Equation 2 assumes that the shape of the flame is a point source and that all of the radiant energy emitted from the point source is uniformly distributed over the surface area of a sphere with radius, R. The radius should be greater than twice the flame height to achieve the best predictions with this method 7, 33-35. In these experiments, the total heat flux gauges were located about 1 flame length away in order to optimize the magnitudes of the measured heat flux.
24 RQq r
πχ &
& =′′ [2]
q ′′& = Heat Flux (kW/m2)
rχ = Radiant Energy Fraction
R = distance from center of flame to target surface
The radiant energy fraction multiplied by the total heat release rate provides the radiative energy output from the flame. There are several means of estimating this value as a function of the pool fire diameter, and based on the fuel type 33-35. The typically cited range of radiant energy fractions is 0.15 to 0.60 7, 35. Fuels with a low soot fraction such as methane would be on the lower end of the range while fuels with a high soot fraction such as gasoline and polyurethane foam would be on the higher end of the range. Available radiant fraction data is limited. As stated before, the radiant fraction is
dependent on fuel and fire diameter, therefore heat flux values were calculated for each fuel with two different radiant fraction values which gives the expected bounds for the radiative fraction for each fuel. Natural gas is composed mainly of methane, although it does contain other gases such as propane and butane, a radiant fraction of 0.15 was chosen as the lower bound and 0.3 (twice the lower bound) was chosen as the upper bound. Gasoline and polyurethane were observed to be significantly sootier fuels than the natural gas, so the upper bound was chosen as 0.6 and 0.4 was chosen as lower bound. The calculated heat flux range for each fuel is based on the uncertainty range of the heat release rate results. The average measured peak total heat flux for each fuel is shown along with the estimated measurement uncertainty.
Table 2. Comparison of calculated heat flux range based on heat release rate uncertainty with the measured heat flux. Two different values of radiant heat fraction are used for calculating the heat flux from each fuel.
Fuel Calculated Heat Flux Range (kW/m2) Measured Heat Flux (kW/m2) Natural Gas (χr = 0.15 ) 0.94 to 1.2 2.3 ± 0.2 Natural Gas (χr = 0.30 ) 1.9 to 2.3 2.3 ± 0.2 Gasoline (χr = 0.4 ) 2.5 to 3.1 3.5 ± 0.3 Gasoline (χr = 0.6) 3.8 to 4.7 3.5 ± 0.3 Polyurethane (χr = 0.4) 1.4 to 1.8 2.5 ± 0.2 Polyurethane (χr = 0.6 ) 2.1 to 2.6 2.5 ± 0.2
SUMMARY
A series of experiments were conducted to characterize and examine the repeatability of fires with a common fuel surface area, but with three different fuels; natural gas, gasoline, and polyurethane foam. The heat release rate, flame height, and heat flux results are presented. The data show that variability in the flame is greater for more complex fuels.
Screening algorithms utilizing the heat release rate results were employed to estimate the flame height and heat flux to a target surface. These calculated values were compared to the measured results from “real fuels” and provided reasonable results. Ranges of values were calculated in order to address the uncertainty in the heat release rate measurements. Other uncertainties, such as lack of knowledge on the exact fuel composition need to be addressed, as this may well be the case in a real fire investigation. Even accounting for uncertainties in heat release rate measurement, the flame height estimates tended to be better aligned with the peak flame height than the median flame height. A specific coefficient for “gasoline” was used in Heskestad’s equation which resulted in the measured median flame height being within the range of the predictions. The heat flux estimations were calculated with a range of radiant heat fractions, with the intent of the “actual” value being in that range. With the exception of gasoline, the estimated heat flux values tended to under predict the measured results. Given the limitations of the data, the algorithms provided reasonable estimates of the mean flame height and the heat flux. These algorithms are tools which can be used to provide insight into a problem, but not an accurate single value answer.
FUTURE RESEARCH
Further analysis will be conducted with the data sets described in this paper in order to further characterize the exposing flame for the burn pattern experiments. Flame heights will be examined using plume temperature criteria and time averaging analysis of the video images using image processing software. Heat flux will be examined using solid flame models and field models to examine improvements in prediction. However uncertainties that will typically exist with composite fuels, such as gasoline as opposed to using something like technical grade heptanes, may limit the improvements in accuracy.
The fires characterized in this paper will then be used in a series of burn pattern repeatability experiments where the fire will be placed adjacent to painted gypsum board walls to examine the pre-flashover fire damage to the wall. The key measurements for repeatability of the fire patterns on the gypsum board will be height, maximum width, shape, and area. Direct measurement and photographic image analysis will be used. The final step in this research program will be to use FDS and Smokeview to examine the ability to reproduce the source fires and the resulting damage patterns to the gypsum wallboard.
REFERENCES
1. Causes of Residential Fires: 2006 Partial NFIRS Data, http://www.usfa.dhs.gov/downloads/xls/2006_Causes100506.xls. U.S. Fire Administration, Emmitsburg, MD., Downloaded 10/21/08. 2. Flynn, Jennifer, D., Intentional Fires. National Fire Protection Association, Quincy, MA., May 2009. 3. NFPA 921, Guide for Fire and Explosion Investigations, NFPA, Quincy, MA, 2008 Edition. 4. Almirall, José R. and Furton, Kenneth G., Editors, Analysis and Interpretation of Fire Scene Evidence, CRC Press, Boca Raton, 2004 5. Daeid, Niamh Nic, Editor, Fire Investigation, Boca Raton, CRC Press, 2004 6. DeHaan, John D., Kirk’s Fire Investigation, Sixth Edition, Pearson Prentice Hall, Upper Saddle River, NJ., 2007. 7. Icove, David J., and DeHaan, John D., Forensic Fire Scene Reconstruction, Second Edition, Pearson Prentice Hall, Upper Saddle River, NJ., 2009. 8. Lentini, John J., Scientific Protocols for Fire Investigation, CRC Press, Taylor & Francis Group, Boca Raton, FL., 2006. 9. Noon, Randall, Engineering Analysis of Fires and Explosions, CRC Press, Boca Raton, FL., 1995. 10. Shanley, James H., “USFA Study of Fire Patterns.” U.S. Fire Administration, Emittsburg, MD., 1998. 11. Putorti, A.D., “Full Scale Room Burn Pattern Study.” National Institute of Justice, Washington D.C., NIJ Report 601-97, December 1997. 12. Strengthening Forensic Science in the United States, A Path Forward. National Research Council of the National Academies. The National Academies Press, Washington D.C., 2009. 13. Fire Protection Research Foundation, Recommendations of The Research Advisory Council on Post-fire Analysis, Quincy MA, February 2002. 14. Sutula, Jason, “Practical Applications of The Fire Dynamics Simulator in Fire Protection Engineering Consulting.” Fire Protection Engineering Magazine, Number 15, p 27-31. 15. McGrattan, Kevin; Baum, Howard.R.; Rehm, Ronald.G.; Mell, William; McDermott, Randall; Hostikka, Simo; and Floyd, Jason. “Fire Dynamics Simulator (Version 5): Technical Reference Guide.” National Institute of Standards and Technology, Gaithersburg, MD., NIST SP 1018-5, April 6, 2010. 16. MCGrattan, Kevin; McDermott, Randall; Hositikka, Simo; and Floyd, Jason. “Fire Dynamics Simulator (Version 5): User’s Guide.” National Institute of Standards and Technology, Gaithersburg, MD., NIST SP 1019-5, April 14, 2010. 17. Forney, Glenn, P., “User’s Guide for Smokeview Version 5: A Tool for Visualizing Fire Dynamics Simulation Data.” National Institute of Standards and Technology, Gaithersburg, MD, NIST-SP 1017-1, April 26, 2010. 18. Rohr, Kimberly, D., “The U.S. Home Product Report, Forms and Types of Materials First Ignited in Fires: Flammable or Combustible Liquids.” National Fire Protection Association, Quincy, MA., December 2001. 19. Babrauskas, Vytenis, Ignition Handbook. Fire Science Publishers, Issaquah, WA 2003. page 683.
20. Chasteen, Carl. Division of the State Fire Marshal, State of Florida, personal communication, April 2010. 21. Flexible Polyurethane Foam: Industry at a Glance. Polyurethane Foam Assn, Inc Knoxville, TN., 2007. 22. In Touch, Information on Flexible Polyurethane Foam. Polyurethane Foam Assn, Inc. Wayne, NJ., Vol. 2, No. 3., 1992. 23. Rohr, Kimberly D., Products First Ignited in U.S. Home Fires. National Fire Protection Association, Quincy, MA, April 2005. 24. Bryant, R.A., Ohlemiller, T.J., Johnsson, E.L., Hamins, A.H., Grove, B.S., Guthrie, W.F., Maranghides, A., and Mulholland, G.W., The NIST 3 MW Quantitative Heat Release Rate Facility: Description and Procedures, National Institute of Standards and Technology, Gaithersburg, MD, NISTIR 7052, September 2004. 25. Medtherm Corporation Bulletin 118, “64 Series Heat Flux Transducers”, Medtherm Corporation, Huntsville, AL. August 2003. 26. Pitts, William, M., Annageri V. Murthy, John L. de Ris, Jean-Rémy Filtz, , Kjell Nygard, Debbie Smith, and Ingrid Wetterlund. Round robin study of total flux gauge calibration at fire laboratories, Fire Safety Journal 41, 2006, pp 459-475. 27. National Type Evaluation Program, Certificate Number 00-075A1, Model K-series, Mettler-
Toledo, Worthington, OH., December 27, 2002 28. Omega Engineering Inc., The Temperature Handbook, Vol. MM, pages Z-39-40, Stamford,
CT., 2004. 29. Blevins, L.G., "Behavior of Bare and Aspirated Thermocouples in Compartment Fires",
National Heat Transfer Conference, 33rd Proceedings. HTD99-280. August 15-17, 1999, Albuquerque, NM, 1999.
30. Pitts, W.M., E. Braun, R.D. Peacock, H.E. Mitler, E. L. Johnsson, P.A. Reneke, and L.G.Blevins, "Temperature Uncertainties for Bare-Bead and Aspirated Thermocouple Measurements in Fire Environments," Thermal Measurements: The Foundation of Fire Standards. American Society for Testing and Materials (ASTM). Proceedings. ASTM STP 1427. December 3, 2001, Dallas, TX.
31. Beyler, C., “Fire Plumes and Ceiling Jets.” Fire Safety Journal, Vol. 11, pp 53-75 32. Heskestad. G, “Fire Plumes, Flame Height and Air Entrainment”, Ch 2-1, Section 2. SFPE Handbook of Fire Protection Engineering 4th ed. DiNenno, P.J.; Drysdale, D.; Beyler, C.L.; Walton, W.D.; Custer, R.L.; Hall, J.R.; Watts, J.M.,.editors., Society of Fire Protection Engineers, Bethesda, MD., 2/1-20p., 2008. 33. Assael, Marc, J., and Kakosimos, Konstantinos, E., Fires, Explosions, and Toxic Gas Dispersions: Effects Calculations and Risk Analysis 34. Beyler, Craig, L., “Fire Hazard Calculations for Large, Open Hydrocarbon Fires”, Ch 3-10, Section 3. SFPE Handbook of Fire Protection Engineering 4th ed. DiNenno, P.J.; Drysdale, D.; Beyler, C.L.; Walton, W.D.; Custer, R.L.; Hall, J.R.; Watts, J.M.,.editors., Society of Fire Protection Engineers, Bethesda, MD., 3/271-319p., 2008. 35. Quintiere, James G., Principles of Fire Behavior, Delmar Publishers, Albany, N.Y., 1997.