28
1 1 Flexibility and Control of Power Generation in Coal Plants: Solutions from the Dispatch Floor

1 1
Flexibility and Control of Power Generation in Coal Plants:
Solutions from the Dispatch Floor

2
AGENDA
• Xcel Energy: An Introduction • Loads & Resources: The Problem • Coal as a Flexible Resource: A
Solution
2
Keith Parks Senior Trading Analyst Xcel Energy 1800 Larimer Street Suite 1000 Denver CO 80202 USA W: +1 303 571 2831 C: +1 303 859 2280 E: [email protected]
Please contact me w/ questions & commentary

X C E L E N E R G Y

4
XCEL ENERGY
4
Northern States Power
Southwestern Public Service
Company
Public Service Company of
Colorado
• No. 1 utility wind provider • Top-ten utility for solar
capacity • Leader in emission
reductions • Nationally recognized in
energy efficiency • Member of the Dow Jones
Sustainability Index

5
0
1,000
2,000
3,000
4,000
5,000
6,000
7,000
8,000
2006 2007 2008 2009 2010 2011 2012 2013 2014 2015 2016
Cap
acity
MW
Xcel Energy Wind Generation Growth (current)PSCo (2343) NSP (1867) SPS (1527)
5
XCEL ENERGY
Ave Capacity Factor: 38%
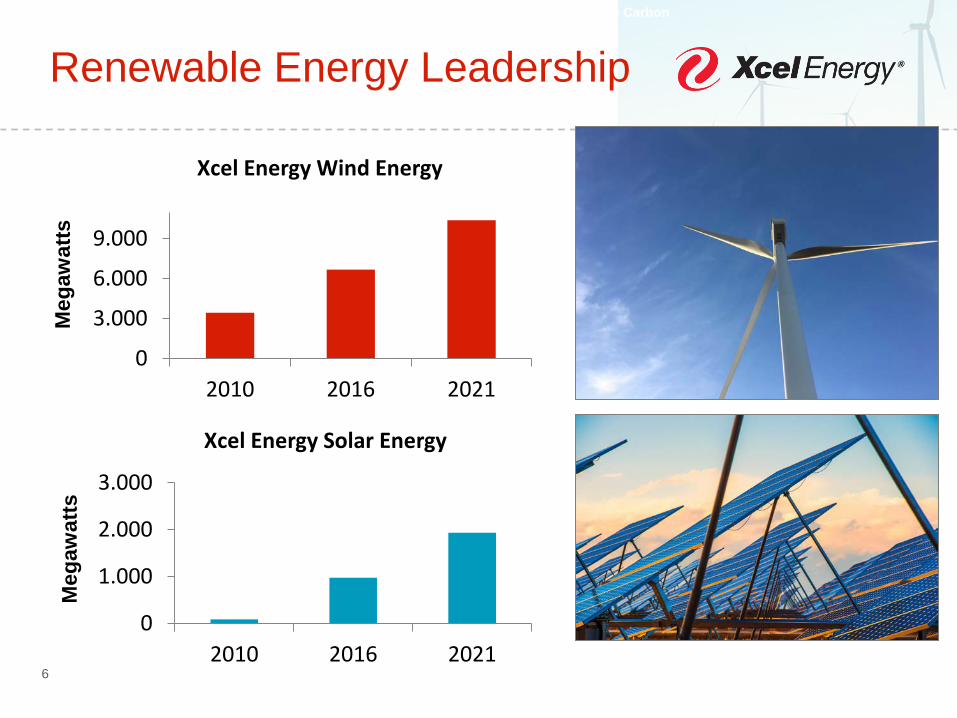
Renewable Energy Leadership Reduce Carbon
6
0
3.000
6.000
9.000
2010 2016 2021
Meg
awat
ts
Xcel Energy Wind Energy
0
1.000
2.000
3.000
2010 2016 2021
Meg
awat
ts
Xcel Energy Solar Energy

Our Changing Energy Mix
7
37%
25%
13%
19%
6%
56% 23%
12%
3% 6%
35%
12% 12%
34%
7%
Coal Natural Gas Nuclear Wind Other Renewable
2021 2005 2016
Reduce Carbon
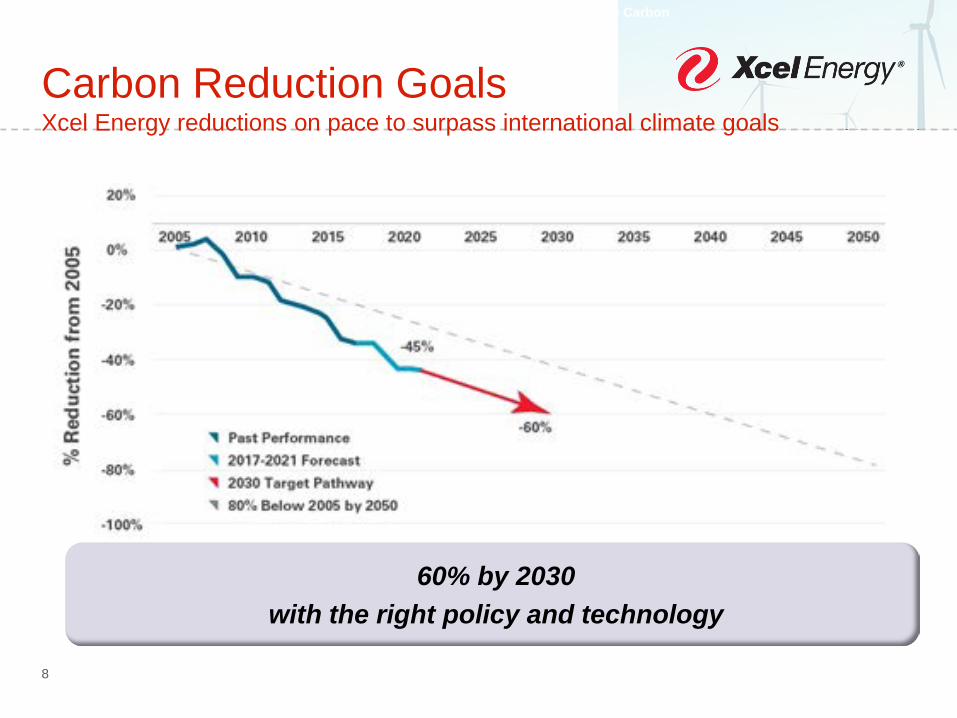
Carbon Reduction Goals Xcel Energy reductions on pace to surpass international climate goals
Reduce Carbon
8
60% by 2030 with the right policy and technology

L O A D S & R E S O U R C E S

LOADS AND RESOURCES
• Obligations and resources are maintained in balance at all times
0
1000
2000
3000
4000
5000
6000
7000
1 25 49 73 97 121 145
MW
0
1000
2000
3000
4000
5000
6000
7000
1 25 49 73 97 121 145
MW
Traditional Utility Paradigm
Mid-Merit
Baseload
Peakers

LOADS AND RESOURCES (APR/OCT)
• Expand focus to all hours of the year to manage uncertainty (Apr/Oct).
Traditional Utility Paradigm
Mid-Merit
Baseload
Peakers Renewables
0
1000
2000
3000
4000
5000
6000
7000
1 25 49 73 97 121 145
MW
0
1000
2000
3000
4000
5000
6000
7000
1 25 49 73 97 121 145
MW

LOADS AND RESOURCES (2017)
0
1000
2000
3000
4000
5000
6000
7000
1 25 49 73 97 121 145
MW
0
1000
2000
3000
4000
5000
6000
7000
1 25 49 73 97 121 145
MW
Traditional Utility Paradigm
Mid-Merit
Baseload
Peakers Renewables
• Spread between daily high/low loads increase. Timing of ramps uncertain.

LOADS AND RESOURCES (2024)
0
1000
2000
3000
4000
5000
6000
7000
1 25 49 73 97 121 145
MW
0
1000
2000
3000
4000
5000
6000
7000
1 25 49 73 97 121 145
MW
High Penetration Portfolio
Balance Portfolio
Variable
• New paradigm: Flexible and Informed Grid
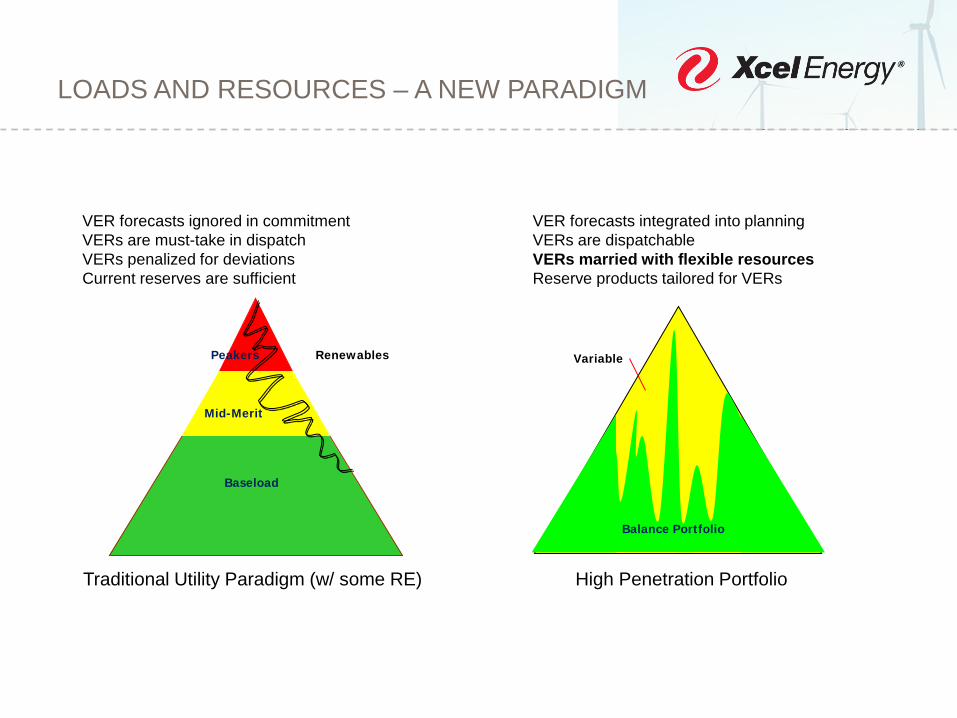
LOADS AND RESOURCES – A NEW PARADIGM
High Penetration Portfolio
Balance Portfolio
Variable
Traditional Utility Paradigm (w/ some RE)
Mid-Merit
Baseload
Peakers Renewables
VER forecasts ignored in commitment VERs are must-take in dispatch VERs penalized for deviations Current reserves are sufficient
VER forecasts integrated into planning VERs are dispatchable VERs married with flexible resources Reserve products tailored for VERs
C O A L A S A F L E X I B L E R E S O U R C E

16
PAWNEE POWER PLANT
• 1 x 500MW Capacity • Year Built: 1981 • Subbituminous Coal (aka brown
coal; black lignite) • 6 coal mills • NOx and SO2 emission controls
I use the Pawnee Power Plant as an example. Though, the following slides are indicative of ALL our coal facilities.

17
PAWNEE – TYPICAL DUTY
The duty of our coal plants has changed significantly from pure baseload generation to heavy load following

18
PAWNEE – TYPICAL DUTY
The duty of our coal plants has changed significantly from pure baseload generation to heavy load following

19
PAWNEE – TYPICAL DUTY
AGC – Regulation
Econ Max
Econ Min
• Pawnee has three primary modes of operation – ECON MAX – AGC – Economic Dispatch – ECON MIN

20
PAWNEE – TYPICAL DUTY
Econ Max
• Traditional model of operation • Requires 5 of 6 mills to be in operation

21
PAWNEE – TYPICAL DUTY
AGC - Regulation
• Dispatch signal sent electronically every 4-seconds from EMS • Dynamic econ max/min and ramp rate limits • Economically dispatched relative to peers • Variable speed coal feeders and some overpressure enables dispatch
STEPS 1. EMS calculates economic set-point based on a set of peers (peers selected by
operator) 2. Set-point honors ramp rates and economic limits set by the power plant 3. Set-point sent automatically and electronically

22
PAWNEE – TYPICAL DUTY
Econ Min
• Coal mills dynamically decommitted (3 to 4 mills in operation) • 30 minutes to remove a mill; 20 minutes to replace • Enables lower loads without decommitment • Working to enable AGC through economic min operation
STEPS 1. Shut off coal feeder 2. Grind out coal in mill 3. Shut down mill 4. Close slide gates in air duct 5. Reverse to commit coal mill
23
IMPACTS
• Thermal Stresses on the Boiler Tubes – Load Following has minor long-term impact – Decommitment can have major cost implications
long-term. • Coal Mill Cycling
– Roller makes contact with the coal mill table during the grind out process. Increases wear and tear.
• Flame Stability – Can be a concern at low loads. Streaming of natural
gas into the flame helps provide stability. • Emission Controls
– NOx removal can be compromised at low loads as the temperature of the flue gas is reduced.
– SO2 removal requires greater management of ammonia concentration.
23

24
WIND PLANT ON AGC
24
• 70% of Xcel Energy wind capacity is AGC capable – All wind farms with SCADA systems post-2007 are enabled
• Allows for real-time curtailment with incredible precision • Wind farms provide the fastest ramping capability of all XE
resources
25
CONCLUSION
• Coordinated system dispatch via Automatic Generation Control (or other automatic econ dispatch system) enables huge efficiencies
• Coal plants are able to respond in real-time. • Lower loads are possible through coal mill cycling. • Coal plants are able to dispatch with variable speed
feeders and moderate use of boiler over-pressure (within strict limits)
• Wind plants are capable of fast and precise generation control.
25


27
PSCO WIND PENETRATION PERCENT OF OBLIGATION LOAD
27

28
APRIL - COLORADO
28


![Han Hengchao Liu Weijun University of Shanghai for … `1 `so2` `naoh` [7] 1.4 `so2` `70 98 `2 ` `90 [8] 1.5 (lifac)[8 10] `1` caco3 `cao` `so2` caso4 caso3 `3 lifac` `cao` `so2 `75](https://static.documents.pub/doc/80x56/5abdb14c7f8b9ab02d8bf119/han-hengchao-liu-weijun-university-of-shanghai-for-1-so2-naoh-7-14-so2.jpg)


