+ All Categories
Home > Documents > Flood Preparedness and GIS

Flood Preparedness and GIS

Date post: 06-Apr-2018
Category:
Upload: mohammed-islam
View: 222 times
Download: 0 times
Share this document with a friend
55
Term Paper Challenges and limitations of Present Practices of flood preparedness system, and their solution: A Case Study of Gowainghat Upazilla Course Teachers Ahmed Shahnewaz Chowdhury Submitted by Shah Jamal Akhlaque Student ID : 1130719 Fall 2011 School of Environmental Science and Management, INDEPENDENT University Table of contents:
Transcript

8/3/2019 Flood Preparedness and GIS

http://slidepdf.com/reader/full/flood-preparedness-and-gis 1/55

Term Paper

Challenges and limitations of Present Practices of flood preparedness system, and their

solution: A Case Study of Gowainghat Upazilla

Course Teachers

Ahmed Shahnewaz Chowdhury

Submitted by

Shah Jamal Akhlaque

Student ID : 1130719

Fall 2011

School of Environmental Science and Management,

INDEPENDENT University

Table of contents:

8/3/2019 Flood Preparedness and GIS

http://slidepdf.com/reader/full/flood-preparedness-and-gis 2/55

Acknowledgement……………………………………………………………………04

Abstract………………………………………………………………………………05

Chapter# 01 Introduction…………………………………………………………….06

1.1 Background of the study………………………………………………06

1.2 Objective of the study…………………………………………………06

1.3 Research question……………………………………………………..06

1.4 Methodology…………………………………………………………..07

1.5 Quality consideration………………………………………………….08

1.6 Study area……………………………………………………………..09

1.7 Literature review………………………………………………………12

Chapter#02 Flood in Bangladesh and Gowainghat………………………………..…17

2.1 Disaster in Bangladesh………………………………………………...17

2.2 Floods in Bangladesh………………………………………………….18

2.3 Risk profile of Gowainghat……………………………………………25

2.4 Risk map of Gowainghat………………………………………………33

Chapter# 03 Present Practices of Flood Preparedness in the Study Area…………………..36

Chapter# 04 Limitations and Challenges of Present Practices of flood Preparedness……..42

4.1 At Different Stages of flood Preparedness…………………………..…42

4.2 Challenges at Different Stages of Flood Preparedness………………...43

4.3 Assessment of Need for Improvement…………………………………45

Chapter#05 Proposals for Improvement and Conclusion…………………………………….50

Chapter#06 References……………………………………………………………………….54

2 | P a g e

8/3/2019 Flood Preparedness and GIS

http://slidepdf.com/reader/full/flood-preparedness-and-gis 3/55

List of charts, tables and pictures

List of Charts

1. Outline of the research methodology………………………………………………08

2. Yearwise coverage of flooded area during 1954-2008………………………………...19

3. Flood forecasting and warning in Bangladesh…………………………………………36

4. Analysis of challenges………………………………………………………………….44

5. Analysis from the perspective of ideal situation………………………………………..48

6. Feasibility of using technology………………………………………………………....49

List of tables

1. Quality considerations……………………………………………………………..08

2. Comparative elevation status of different physical components………………………26

3. Water level of some rivers during the flood of 1988 and 1998………………………..28

4. Types of households and population…………………………………………………..29

5. Types of households and population in Gowainghat………………………………….31

6. Household structure wise population in Gowainghat upazilla………………………...31

7. Age and gender wise population in Gowainghat upazilla……………………………..32

8. Analysis from the perspective of failure……………………………………………….47

List of pictures

1. Administrative map of Gowainghat upazilla………………………………………10

2. Causes of floods in Bangladesh……………………………………………………22

3. Disasters in Bangladsh…………………………………………………………….23

4. Digital map of google earth showing maximum elevation of haors/ beels………..25

5. Google earth showing maximum elevation of households………………………..26

6. Google earth digital image measuring elevation of vital facilities………………..27

7. Households and roads of Gowainghat submerged in the flood water……….……28

8. Flood map of 2007…………………………………………………….…………..34

9. Risk map of Gowainghat upazilla…………………………………………………35

10.Flood in 2004 in Gowainghat…………………………………………………..…40

3 | P a g e

8/3/2019 Flood Preparedness and GIS

http://slidepdf.com/reader/full/flood-preparedness-and-gis 4/55

Acknowledgement

This term paper has been prepared as a mandatory requirement for Master of 

Science in Natural Resources and Disaster Management from the School of 

Environmental Science and Management under Independent University.

The study has started in September 2011, and ended in December 2011.

Most of the information of this study has been collected through secondary

sources though some of the information has been collected through visits to the

study area, observation during visit and informal interview with concerned people

and experience of the reporter during his assignment in the study area.

Ahmed Shahnewaz Chowdhury, Assistant Professor, SESM, Independent

University has given his invaluable time for this study. This could never be

 possible without his guidance.

Shah Jamal Akhlaque

Student ID# 1130719

School of Environmental Science and Management ,

Independent University, Dhaka

4 | P a g e

8/3/2019 Flood Preparedness and GIS

http://slidepdf.com/reader/full/flood-preparedness-and-gis 5/55

Abstract

Bangladesh is a densely populated country so every disaster has significant

impact on it. Due to economic inability or limitation it is not possible for the

country to wait for the disaster to happen, and take corrective measure after that.

So preparedness and disaster risk reduction has always been the most feasible

means for the country against all types of disaster including floods.

It is needless to mention that flood is the most frequent and most

influential disaster in Bangladesh as most of the area of this country belongs to

flood plain. Due to its geographical location and topological attributes,

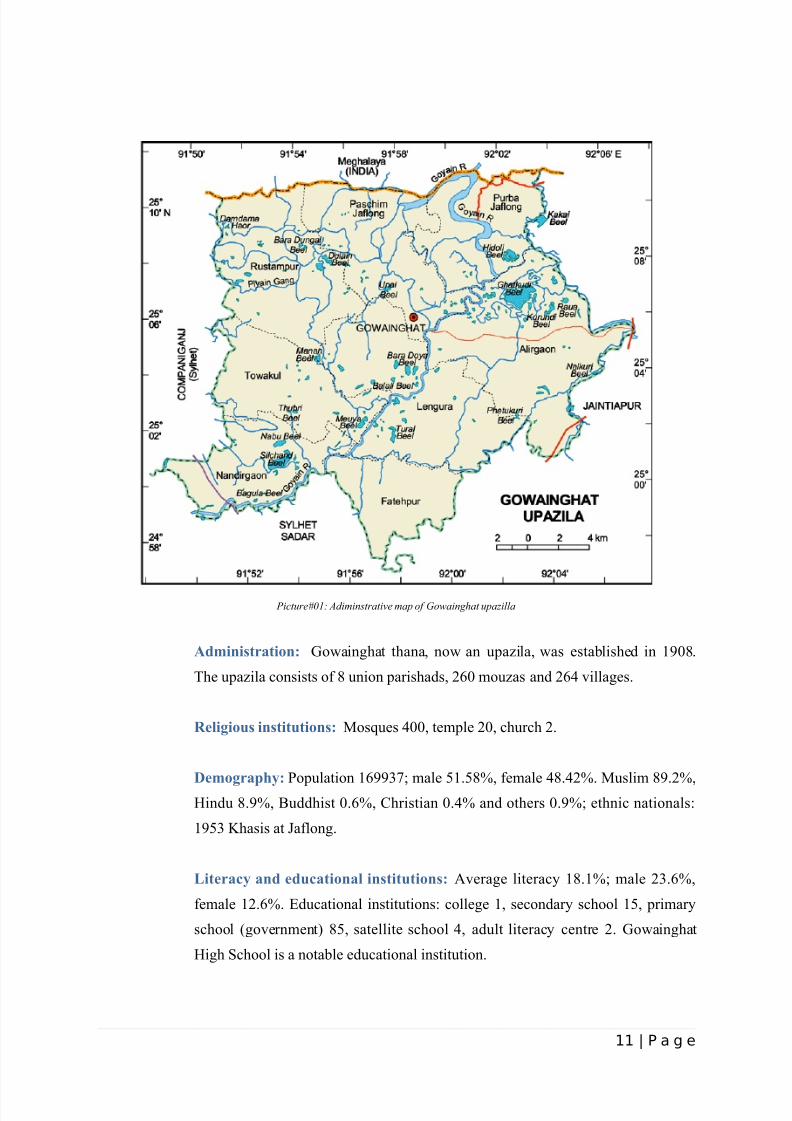
Gowainghat upazilla of Sylhet district is considered as one of the most vulnerable

upazillas of the country to flood. This upazilla has been taken as study area

mainly for three reasons (1) It is one of the most flood prone areas of the country

(2) Findings of this upazilla can be applicable to other upazillas of the country

including some of those in India, Sri Lanks, Myanmar, Vietnam and some other 

 parts of the world, and (3) The reporter of this study has worked in the area for more than five years and much familiar with disaster related activities in the area.

Present practices of flood preparedness are mostly manual with minimum

use of cutting edge technology and innovation. This dependence on human

interactions often gets stagnant due to widespread bureaucracy in the country as a

result people as well as the economy suffers. This study has collected

vulnerability related data from web-based GIS software like google earth and

secondary sources like Bangladesh Bureau of Statistics. It has collected data on

  present practices of flood preparedness through documents of Bangladesh

Disaster Management Bureau, news paper cuttings, field visits, informal

interview with people and government and non-government officials. Collected

data has been analyzed through different analysis techniques names Critical Path

Method (CPM), Failure Mode Effect and Criticality Analysis (FMECA), Concept

Fan, Technology and People Analysis etc.

The final outcome of this study is a set of recommendations based on the

drawbacks of present practices of flood preparedness. For better understanding of 

5 | P a g e

8/3/2019 Flood Preparedness and GIS

http://slidepdf.com/reader/full/flood-preparedness-and-gis 6/55

the recommendations a conceptual frame has also been discussed briefly at the

end of this report.

6 | P a g e

8/3/2019 Flood Preparedness and GIS

http://slidepdf.com/reader/full/flood-preparedness-and-gis 7/55

Chapter# 1: Introduction

1.1 Background of the study

A disaster is defined as a serious disruption of the functioning of a community or a

society causing widespread human, material, economic or environmental losses which

exceed the ability of the affected community or society to cope using its own

resources. The natural disasters have become fast recurring phenomena all over the

world causing huge loss of human lives and crumbling impact on the economy of a

country. The importance of uncertainty in natural hazard risk management has

received recent attention. On an average 4,888 people are killed and 59 million

getting affected annually from various types of disasters.

Of all the natural hazards, floods occur most often and are the most widespread in

scope and severity in Bangladesh. It is observed that there is a fourfold rise during

last fifty years. High magnitude floods during the monsoon season are considered to

 be Bangladesh’s recurring and leading natural disaster (Vishwas et al., 1994).

The study will focus on the development of an effective flood preparedness system in

Gowainghat upazilla of Sylhet district.

1.2 Objective of the study:

• Propose recommendations for an effective flood preparedness mechanism

 based on drawbacks of present practices for the same.

1.3 Research question:

How challenges and limitations of present practices of flood preparedness in

Gowainghat upazilla can be addressed?

7 | P a g e

8/3/2019 Flood Preparedness and GIS

http://slidepdf.com/reader/full/flood-preparedness-and-gis 8/55

1.4 Methodology

Based on the research question, three independent variable has been identified, which

are physical vulnerability of the upazilla to flood, present practices for flood

  preparedness and challenges and limitations of present practices of flood

 preparedness. The only dependent variable for this study is “GIS based measures to

 be taken”.

Internet based GIS maps, data collected from Bangladesh Bureau of Statistics,visit to the upazilla and discussion with concerned officilas were ways to collect

information related to the physical vulnueability of the upazilla to flood. On the

otherhand, present guideline of Disaster Management Bureau, standing order for 

disaster and other policy guidelines has been used to identify ideal practices, and

 practical experience of the author in the same upazilla and discussion with concerned

upazilla officials have been used to identify present practices for flood preparedness.

Lastly, reports of the NGOs, which worked in the upazilla during the flood of 2004,

comments of the upazilla Nirbahi Officer and some other upazilla level governmentand NGO officials, and visits to the affected upazilla during flood and discussion with

affected people have helped in collecting information related to the challenges and

limitatons of present flood preparedness activity.

Data collected from all the above sources have been sorted in tables, charts and

maps, and used for mapping and analysis. Knowledge on the subject matter learnt

through the courses of PPDM, INDEPENDENT University, and experience of 

working in the study area for more than five years has been used to analyze data.

Exploration of possibility of using GIS in addressing identified challenges and

limitations has been done based on research reports on flood preparedness and use of 

GIS identifying practices of GIS based flood preparedness in other parts of the world,

and name of the research have been mentioned in the literature review part of this

report.

8 | P a g e

8/3/2019 Flood Preparedness and GIS

http://slidepdf.com/reader/full/flood-preparedness-and-gis 9/55

The methodology for the study can be summarized as follows-

Chart#01: Outline of the research methodology

1.5 Quality Considerations

Standard Measures

Truth value Structure of the study has been designed as per reports on similar types of 

research done in Bangladesh, India, Netherlands and Costa Rica. Names of 

these researches have been mentioned on the literature review, methodology and

reference section of this report.

Applicabilit

y

The recommendation of this study will be applicable to highly flood prone area,

 particularly areas with peninsular attributes having hills and highlands around it.

One of the reason for this applicability is that the study has been designed basedon the study of similar types of areas.

9 | P a g e

8/3/2019 Flood Preparedness and GIS

http://slidepdf.com/reader/full/flood-preparedness-and-gis 10/55

Consistency Data has been collected from most reliable sources like disaster management

 bureau, Bangladesh Bureau of statistics, ITC, Google earth and other 

organization with similar credibility. Recommendations have been made based

on academically accepted analysis methods and well documented experience

and practices in other countries.

  Neutrality As data has been collected from trusted and well acceptable secondary sources

there will be negligible scope of potential biases or interference of the

researcher out of the process.

Table# 01: Quality consideration

1.6 Study Area:

Gowainghat Upazila (sylhet  district) with an area of 486.10 sq km, is bounded by

Meghalay state of India on the north, sylhet sadar  and jaintiapur upazilas on the south,

Jaintiapur upazila on the east, companiganj (Sylhet) upazila on the west. Main rivers are

Sari, Goyain, piyain, Ichamati, Kapna, and dauki; Nainda, Tilgulli, Lenguda, Kurshanti

are main haors; Chatla, Shildikuri, Harinmara are main water bodies. Jafflong is an

important tourist spot. Tamabil land port is used for importing coal and other goods from

India.

Gowainghat (Town) consists of 2 mouzas. It has an area of 3.51 sq km. It has a

 population of 4111; male 52.44%, female 47.56%; density of population is 1171 per sq

km. Literacy rate among town people is 22.7%.

10 | P a g e

8/3/2019 Flood Preparedness and GIS

http://slidepdf.com/reader/full/flood-preparedness-and-gis 11/55

 Picture#01: Adiminstrative map of Gowainghat upazilla

Administration: Gowainghat thana, now an upazila, was established in 1908.

The upazila consists of 8 union parishads, 260 mouzas and 264 villages.

Religious institutions: Mosques 400, temple 20, church 2.

Demography: Population 169937; male 51.58%, female 48.42%. Muslim 89.2%,Hindu 8.9%, Buddhist 0.6%, Christian 0.4% and others 0.9%; ethnic nationals:

1953 Khasis at Jaflong.

Literacy and educational institutions: Average literacy 18.1%; male 23.6%,

female 12.6%. Educational institutions: college 1, secondary school 15, primary

school (government) 85, satellite school 4, adult literacy centre 2. Gowainghat

High School is a notable educational institution.

11 | P a g e

8/3/2019 Flood Preparedness and GIS

http://slidepdf.com/reader/full/flood-preparedness-and-gis 12/55

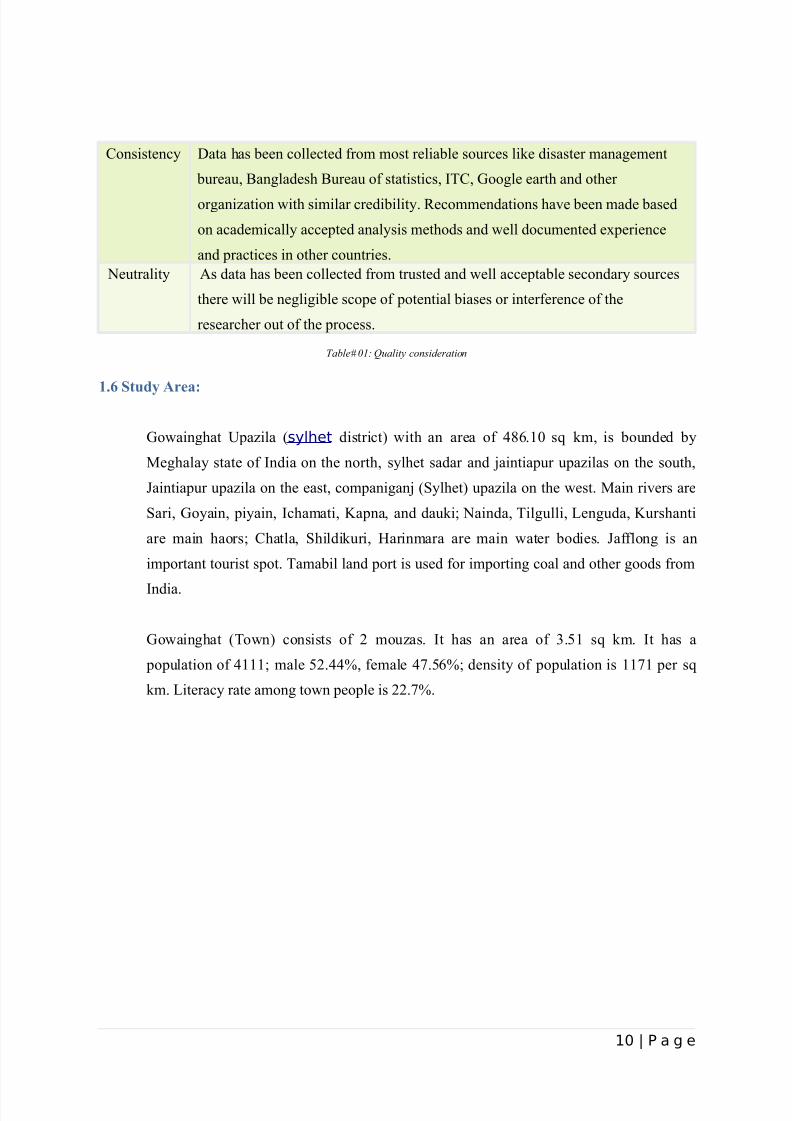
Main occupations: Agriculture 50.16%, fishing 2.36%, agricultural labourer 

17.64%, wage labourer 9.43%, commerce 6.53%, service 3.09%, others 10.79%.

Land: Usable land 26639.01 hectares; fallow land 9199.11 hectares, khash land

1020.39 hectares; single crop 46.90%, double crop 50.68% and triple crop land

2.42%. Land controls among the peasant, 23.43% are landless, 43.16% marginal,

27.00% intermediate, and 6.41% rich. Value of land Market value of the first

grade agricultural land is about Tk 85000 per 0.01 hectare.

Main crops: Paddy, mustard seed, tea, betel leaf.

Extinct and nearly extinct crops: Tisi (linseed), Til,(sesame), cassia leaf are

entirely extinct; Taykar and Satkara are nearly extinct.

Other sectors: Fisheries, dairies, poultries Fishery 8, dairy 2 and poultry 15.

Manufactories Stone crushing plant 25, rice mill 30, brick field 3, tea processing

factory 1, saw mill 2. Cottage industries Mats, popularly known as Shital Paty, are

made from Murta (one kind of cane). Different kinds of household goods are

made from bamboo and cane. Hats, bazars and fairs Hats and bazars are 20, most

noted of which are Gowainghat, Radhanagar, Jaflong, Ballaghat, Hadarpar,

Salutikar.

Communication facilities: Roads: pucca 49.24 km and mud road 361.4 km.

Traditional transport Palanquin and bullock cart. These means of transport are

extinct or nearly extinct.

NGO activities:  brac, grameen bank , Concern, caritas, CARE, FIVDB, Hunger.Health centres Upazila health centre 1, rural health centre 11, family welfare

centre 5, charitable dispensary 1.

12 | P a g e

8/3/2019 Flood Preparedness and GIS

http://slidepdf.com/reader/full/flood-preparedness-and-gis 13/55

1.7 Literature Review

As a high tech and cost effective solution for flood preparedness, this study has given

much emphasis on Geographic Information System (GIS). A good percentage of 

literatures reviewed for this study were on GIS, use of GIS as tools for disaster 

 preparedness as well as for flood preparedness.

1.7.1 Geographical Information Systems

A GIS is a system for capturing, storing, checking, integrating, manipulating, analyzing,

and displaying data which are spatially referenced to the Earth," (Department of theEnvironment, 1987). Remote Sensing involves the use of aircraft or satellites to collect

 photographs or scanned images of the Earth's surface. High resolution remote sensing

data may produce the best results; however, they are typically expensive. It is one of the

objectives of this study to assess methodologies for rapidly producing regional (1:250,000

to 1:50,000 scale) geo-hazard risk maps and deriving information from free or low cost

remotely sensed imagery. Landsat Thematic Mapper data (TM) and Enhanced Thematic

Mapper (ETM+) multi-spectral imagery are used, along with Shuttle Radar Topography

Mission (SRTM) derived elevation data. Landsat and SRTM datasets are free, easily

accessible, and have almost total global coverage (Teeuw et al., 2005). GIS have had a

slower uptake in less developed countries due to lack of hardware, resources, and human

capital (Andrews Deller, 2007). Satellite 24 Journal of Maps Student Edition, 2008, 23-38

Morris, N. remote sensing is usually the most up to date source of data and information

for earth resources. It is synoptic, and it allows regional studies to be undertaken

relatively cheaply and quickly. With the use of GIS and remote sensing, the possible

impacts of natural phenomena (such as oods, droughts, earthquakes, landslides, and

volcanic eruptions) on buildings, populations, and infrastructure can be modeled and

visualized. GIS and remote sensing are powerful tools for analyzing hazards,

vulnerability, and risks, and then producing direct disaster scenarios which in turn help

disaster managers. Simple, low cost GIS systems can allow local authorities to more

effectively manage areas impacted by hazards, incorporate local knowledge, and ensure

community participation.

1.7.2 GIS as a tool for disaster preparedness

GIS is a computer based system capable of assembling, storing, manipulating, and

displaying geographically referenced information. However, the definition by NASA

13 | P a g e

8/3/2019 Flood Preparedness and GIS

http://slidepdf.com/reader/full/flood-preparedness-and-gis 14/55

seems to cover all aspects which state that GIS is an integrated system of computer 

hardware, software and trained personnel linking topographic, demographic, utility,

facility, image and other resource data that is geographically referenced. GIS technology

supports spatial data handling and analysis efficiently and can be used to create an

integrated geo-database on biological (agriculture), meteorological (rainfall), hydrological

(water resources), socio-economic (population) indicators, etc. for their subsequent use in

modeling the simple/ complex disaster related indices to reflect the vulnerability of an

area to the disaster.

GIS based system can be used as an integrated administrative and decision support

system to respond to the immediate humanitarian and disaster relief operation during and

after the event. Disaster management techniques are based on the economic status of the

country and hence mapping and information acquisition is vital for disaster management.

GIS supports all aspects of disaster management. Disaster planning, response, mitigation,

and recovery all become more efficient through the use of GIS (Suresh et al.,

2005).Government of Bangladesh constituted a High Powered Committee for the efficient

implementation of disaster management strategy, according to which about thirty

disasters have been categorized into five sub groups. They are as follows:

Water and climate related hazards

Geologically related hazards

Chemical, Industrial and Nuclear related disasters

Accident related disasters

Biologically related disasters.

Further, GIS for disaster management helps in the following activities:

-Visualization of spatial distribution of events during the occurrence of a

disaster.

- Identification of location of various service centers in the affected area.

- Maintenance of critical communication linkages between affected areas

with rest of the world.

- Facilitate continuous monitoring of the situation and feedback response.

14 | P a g e

8/3/2019 Flood Preparedness and GIS

http://slidepdf.com/reader/full/flood-preparedness-and-gis 15/55

- Help modeling of different disaster situations and identify corresponding

vulnerable areas and risk zones.

Emergency management poses significant challenges for data collection, data

management, discovery, translation, integration, visualization and communication.

Emergency management can be managed well through spatial planning and one requires a

GIS for such a management. Effective emergency management requires the thorough use

and understanding of the semantics of the heterogeneous information sources with their 

many differences:

1.7.3 GIS for flood preparedness:

Geographic Information System (GIS) is an extremely powerful tool for the management

of flood regardless topological attributes of the area being covered. It is equally effective

in all the phases of flood preparedness. Its use in mapping topological flood risk and flood

forecasting is immense. It plays, also, a crucial role in flood monitoring through mapping

of inundated area using remote sensing.

1.7.4 Literature used for the study

Following documents were reviewed during preparation of this study-

1. Disaster Preparedness using IT Tools: Case Studies on the use of ICT

and GIS Derived tools for Micro-Level Drought Preparedness. Sreedhar

Ganapuram#1, R Nagarajan*2, V Ramnaresh Kumar #3, N Lavanya #4,Asil Gerard Sylvester #5 , V. Balaji #6 #ICRISAT, Patancheru 502 324:

Some ideas taken from this study has been recommended for flood

 preparedness in this study.

2. FLOOD EMERGENCY PLANNING: World Meteorological

Department: Some tools of this report has been used for analysis.

3. GIS based Flood Management-Case study of Allahabad City: Syed

Hasan Abbas, Research Scholar ,Research Scholar, Department of civil

15 | P a g e

8/3/2019 Flood Preparedness and GIS

http://slidepdf.com/reader/full/flood-preparedness-and-gis 16/55

Engineering MNNIT Allahabad : This study report has been used in

designing the structure of this study.

4. Ideal location for food shelter: a geographic information systemapproach

J. Sanyal1 and X.X. Lu2 1 Department of Geography, Taki Government

College, Taki, West Bengal, India 2 Department of Geography, National

University of Singapore, Singapore: Some ideas of this study has been

used for analysis.

5. Realtime web-based remote sensing and GIS for flood management

 jointly done by ministry of planning, Khulna University and Bangladesh

University of Engineering and Technology: Ideas of this report has been

used to collected and analyze data. Some recommendations were also

extracted from here.

6. GIS Technology for Disaster and Emergency Management: by Russ

Johnson. Published by ESRI: This literature has been studied for better 

understanding of GIS and its use in disaster management particularly for flood

 preparedness.

7. Challenges for GIS in Emergency preparedness and Response. Published

by ESRI: This report has been used to assess the effectiveness and feasibility

of GIS technology in flood preparedness.

8. Application of GIS in flood hazard mapping: A case study of Gangetic

West Bengal, India: This study has guided in analyzing the flood hazard of 

Gowainghat.

9. Low-cost remote sensing and GIS for regional disaster risk reduction,

North West Costa Rica by Naomi Morris: Ideas of this report has been used

to collected and analyze data. Some recommendations were also extracted

from here.

10.GIS as a tool in emergency management process by Leonid V. Stoimenov, Member, IAENG , Aleksandar Lj. Milosavljević, and Aleksandar S.

Stanimirović: This paper has showed how GIS could be used to supportdecision making in emergency risk management.

16 | P a g e

8/3/2019 Flood Preparedness and GIS

http://slidepdf.com/reader/full/flood-preparedness-and-gis 17/55

11.GIS based natural disaster mapping: A case study by O. Avsar a,*, Z.

Duran a, D. Z. Seker a, M. Hisir a, M. Shrestha b : Guided to assess the

flood hazard of Gowainghat upazilla.

12.Bangladesh: Flood Management: This study was very useful Information is provided about the approach and long-year experience on flood managementin that country, with strategies that have seen continuous change after anumber of disastrous floods. This was particularly useful in understanding thedynamics of flood preparedness in Bangladesh.

13.The use of GIS as disaster preparedness and response tool: The Universityof West Indies: Guided to explore possible GIS based solution for flood preparedness.

14.Geo-Informaton for Disaster Management by Peter Van Oosterom andothers: This literature guided on the ways to collecting and analyzing GISdata.

15.Role of remote sensing in disaster management: Nirupama, PhD: Thisinformation literature covered all the ways of using remote sensingtechnology and disaster management. Ideas of this book have been focus onflood related preparedness in this study.

17 | P a g e

8/3/2019 Flood Preparedness and GIS

http://slidepdf.com/reader/full/flood-preparedness-and-gis 18/55

Chapter# 2.0: Flood in Bangladesh and Gowainghat

2.1 Disaster in Bangladesh

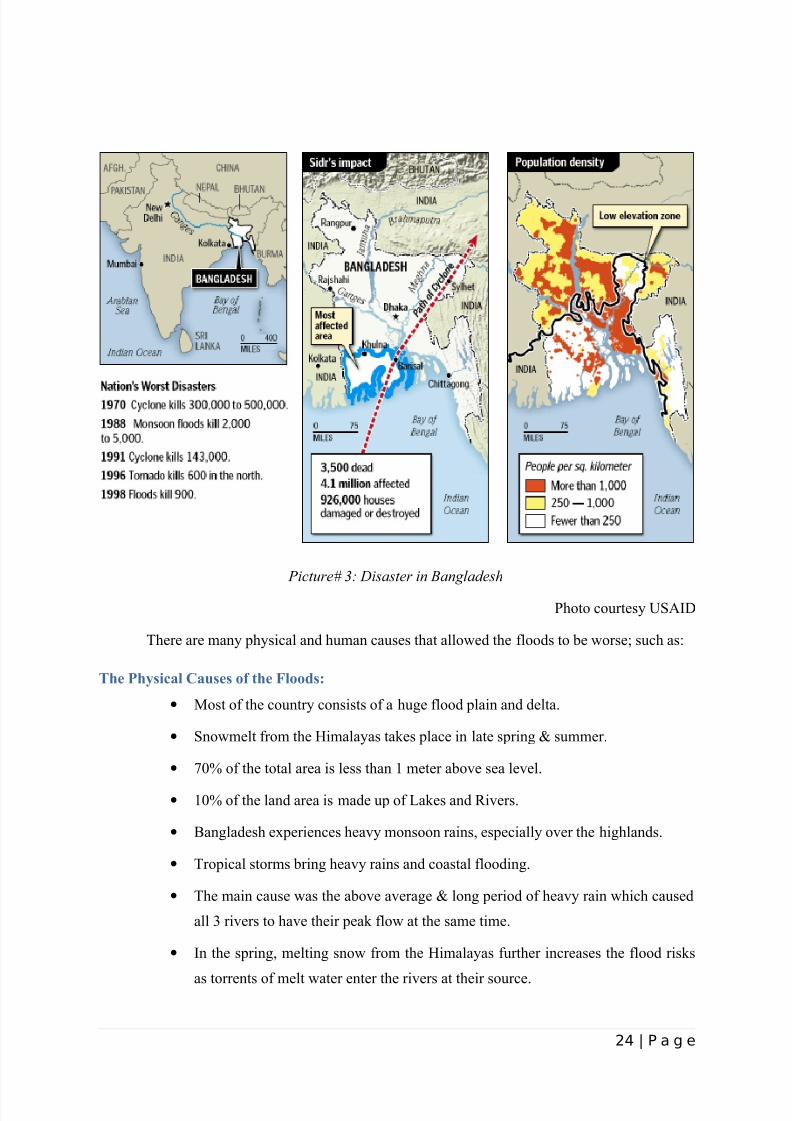
Bangladesh being situated in a region of the floodplains of the mighty rivers the

Ganges-Padma, Brahmaputra-Jamuna and the Meghna commonly known as G-B-M

is predominantly a flat terrain except for the fringes along the north, north-eastern and

the eastern regions along with the pleistocene terraces of Barind tract and the

Modhupur tract. The Bay of Bengal bounds the country's 750 km coastline in the

south. The funnel shaped size of the Bay of Bengal and the low elevation of the

coastal region induces the cyclones hit Bangladesh with more vigour than usual. The

major trans-boundary rivers, G-B-M, drain all its water from about 88% of its

catchment area lying outside the country. This along with the heavy rainfall area

outside makes the country vulnerable to flash floods, high floods and at times

 prolonged floods.

The cyclones formed in the Bay of Bengal often leave trails of devastation along

the coastal region of Bangladesh. It damages the lives and properties including crops

and infrastructure in the area. These cyclones (March-May & Oct-November) are

  being monitored through the satellites taking images several times a day. The

cyclones generate surges up to a height of several meters which sweep through the

flat coastal region killing people, animals and destroy other fauna and flora. The surge

height can also be estimated from the satellite analysis. Tornadoes often formed atdifferent placed, however are difficult to be located ahead of occurrence because of 

their small size and short duration.

The monsoon clouds (July-October) are being traced from the satellite images and the

rainfall is being predicted in and around the country. The high downstream flow of 

the major rivers from the catchment area during monsoon adds to the misery of the

 people by causing flood. At times there are heavy downpours along the hilly region

and the sudden onrush of water causes flash flood. The coincidence of high

downstream flow in all the three major rivers along with the local (in-country) rainfall

causes devastating floods. Droughts cause delay in agricultural processes and

18 | P a g e

8/3/2019 Flood Preparedness and GIS

http://slidepdf.com/reader/full/flood-preparedness-and-gis 19/55

sometimes inflict heavy loss of production. The floods and the droughts are somehow

related to the El- Nino La- Nina situations.

Erosion is another disaster that prevails much in Bangladesh. About 75 rivers are

continuously eroding banks and depositing silt and sand along their courses. The river 

erosion play havoc in certain areas where dwelling houses, fertile agricultural lands

and infrastructure are all taken into the river. This renders the affected people to

absolute destitution. Remote sensing techniques are being applied to monitor the

vulnerable areas for erosion and predictions are also being made. These erosions

occur predominantly along the major rivers and the coastal region of Bangladesh.

Landslide is another event that causes lives and damages properties particularly

during the monsoon. The hilly regions are often cleared of their vegetation and forest

for economic reasons. Inconsiderate cutting down of the hills causes landslides in the

Sylhet and Chittagong region of the country. These activities can also be monitored

from temporal analysis of satellite data. The environmental changes thus caused by

human actions, deforestation, land use changes in Bangladesh which hinders

agricultural productions.

Earth quakes in minor forms have been happening in the hilly regions particularly

in the Chittagong area that threatens Bangladesh of an impending disaster. The

Government of Bangladesh have been extremely alert and actions are being taken to

establish sysmological stations at different places in the country. Forest fire has not

yet posed serious problems here except for the Magurcherra incident.

2.2 Floods in Bangladesh:

Bangladesh is one of most flood prone areas of the world. The South-Asian country of 

Bangladesh is prone to the natural disaster of  flooding due to being situated on the

Ganges Delta and the many tributaries flowing into the Bay of Bengal. The coastal

flooding twinned with the bursting of Bangladesh's river banks is common and severely

affects the landscape and Bangladeshi society. 75% of Bangladesh is less than 10m above

sea level and 80% is flood plain, therefore rendering Bangladesh a nation very much at

risk of further widespread damage despite its development, especially as its present flood

defenses are unsustainable and somewhat amateur. Flooding normally occurs during the

monsoon season from June to September during the monsoon. The convectional rainfall

19 | P a g e

8/3/2019 Flood Preparedness and GIS

http://slidepdf.com/reader/full/flood-preparedness-and-gis 20/55

of the monsoon is added to by relief rainfall caused by the Himalayas. Meltwater from the

Himalayas is also a significant input and flood every year.

Each year in Bangladesh about 26,000 km2, (around 18%) of the country is flooded, so far 

killing over 5000 people and destroying 7 million homes. During severe floods the

affected area may exceed 75% of the country, as was seen in 1998. This volume is 95%

of the total annual inflow. By comparison only about 187,000 million m3, of streamflow

is generated by rainfall inside the country during the same period. The floods have caused

devastation in Bangladesh throughout history, especially during the years 1966, 1987, 

1998 and 1988. The 2007 South Asian floods also affected a large portion of Bangladesh.

Small scale flooding in Bangladesh is required to sustain the agricultural industry, as

sediment deposited by floodwaters fertilises fields. The water is required to grow rice, so

natural flooding replaces the requirement of arteficial irrigation, which is time consuming

and costly to build. Salt deposited on fields from high rates of evaporation is removed

during floods, preventing the land from becoming infertile. The benefits of flooding are

clear in El  Niño years when the monsoon is interrupted. As El Nino becomes increasingly

frequent, and flood events appear to become more extreme, the previously relaiable

monsoon may be succeeded by years of drought or devastating floods. Also some 3

thousand people were left homeless or killed.

Chart#02:: Year-wise coverage of flooded area during 1954-2008

Source: Bangladesh Water Development Board 

BWDB has calculated the flooded area of Bangladesh every year from 1954 and until

2008. For an area to be included in the flooded area it needs only to be flooded at one

20 | P a g e

8/3/2019 Flood Preparedness and GIS

http://slidepdf.com/reader/full/flood-preparedness-and-gis 21/55

incidence during the considered monsoon season, i.e. the areas contributing to the flooded

area was not necessarily flooded at the same time. There were e.g. six separate floods

within the 1987 rainy season and three in 1988. The flooded area calculated by BWDB is

mostly related to some kind of damage, it may be damage to crops, houses, escape of fish

stocks etc. BWDB divide flood into severe, moderate and normal flood, where normal

means no damage. If a Thana is severely flooded then BWDB assumes as a thumbs rule

that 35-40% of the Thana is flooded, but the percentage is increased as water level

increases based on human judgment. During the stressing 1988- and 1998-flood the

 percentage was increased considerably as water levels were far above danger level.

Approximately 18% of Bangladesh is river, lake or other water bodies and this area is in

general not included in the given flood area. As should be clear from the above

explanation the informed flood area by BWDB is not a very precise number. Presently

FFWC is working on producing flood maps on the basis of satellite pictures. It will enable

the centre to give consistent, precise and instantaneously information on flooded area.

2.2.1 Categories

In Bangladesh following types of floods are normally encountered.

Flash floods in the eastern and northern rivers are characterized by a sharp risefollowed by a relatively rapid recession, often causing high flow velocities that

damage crops and property.

Local floods due to high localized rainfall of long duration in the monsoon season

often generate water volumes in excess of the local drainage capacity, causing

localized floods due to drainage congestion.

Monsoon floods from the major rivers generally rise slowly and the period of rise

and fall may extend from 10 to 20 days or more. Spilling through distributaries

and over the banks of the major rivers causes the most extensive flood damage,

 particularly when the three major rivers rise simultaneously.

Floods due to storm surges in the coastal areas of Bangladesh, which are

generated by tropical cyclone, cause extensive damage to life and property. These

cyclones are predominant during the post-monsoon (October and November) and

 pre-monsoon (April to June) period.

21 | P a g e

8/3/2019 Flood Preparedness and GIS

http://slidepdf.com/reader/full/flood-preparedness-and-gis 22/55

2.2.2 Flood history

In the 19th century, six major floods were recorded in 1842, 1858, 1871, 1875, 

1885 and 1892. Eighteen major floods occurred in the 20th century. Those of 

1987, 1988 and 1955 were of catastrophic consequence. More recent floods

include 2004 and 2010.

The catastrophic flood of 1987 occurred throughout July and August and affected

57,300 km2 of land, (about 40% of the total area of the country) and was

estimated as a once in 30-70 year event. The flood's main cause was the creation

of Erranticophrus (top soil wash away reaction) from the inhabitants of the

Himalayas irrigating their mountains vertically. The seriously affected regions

were on the western side of the Brahmaputra, the area below the confluence of the

Ganges and the Brahmaputra and considerable areas north of Khulna.

The flood of  1988, which was also of catastrophic consequence, occurred

throughout August and September. The waters inundated about 82,000 km2 of 

land, (about 60% of the area) and its return period was estimated at 50–100 years.

Rainfall together with synchronisation of very high flows of all the three major 

rivers of the country in only three days aggravated the flood. Dhaka, the capital of 

Bangladesh, was severely affected. The flood lasted 15 to 20 days.

In 1998, over 75% of the total area of the country was flooded. It was similar to

the catastrophic flood of 1988 in terms of the extent of the flooding. A

combination of heavy rainfall within and outside the country and synchronization

of peak flows of the major rivers contributed to the river.

The 2004 flood was very similar to the 1988 and 1998 floods with two thirds of 

the country under water. The capital city of Dhaka was literally swimming in

sewage like rats.

Dozens of villages were inundated when rain pushed the rivers of northwestern

Bangladesh over their banks in early October 2005. The Moderate Resolution

Imaging Spectroradiometer on Terra satellite captured the top image of the

flooded Ghaghat and Atrai Rivers on October 12, 2005. The deep blue of the

rivers is spread across the countryside in the flood image.

22 | P a g e

8/3/2019 Flood Preparedness and GIS

http://slidepdf.com/reader/full/flood-preparedness-and-gis 23/55

 Picture# 02: Causes of floods in Bangladesh has been visualized through above illustration

2.2.3 Causes of floods in Bangladesh

Bangladesh is one of the world most densely populated country and one of the

most susceptible countries to flood disasters. It also has one of the three most

 powerful rivers passing though it Ganges, Meghna and Brahmaputra. About one

half of the land area in Bangladesh is at an elevation of less than 8 meters above

sea level. Up to 30% of the country has been covered with flood waters. In 1991

more 200,000 deaths resulted from flooding and associated tropical cyclones.

23 | P a g e

8/3/2019 Flood Preparedness and GIS

http://slidepdf.com/reader/full/flood-preparedness-and-gis 24/55

 Picture# 3: Disaster in Bangladesh

Photo courtesy USAID

There are many physical and human causes that allowed the floods to be worse; such as:

The Physical Causes of the Floods:

• Most of the country consists of a huge flood plain and delta.

• Snowmelt from the Himalayas takes place in late spring & summer.

• 70% of the total area is less than 1 meter above sea level.

• 10% of the land area is made up of Lakes and Rivers.

• Bangladesh experiences heavy monsoon rains, especially over the highlands.

• Tropical storms bring heavy rains and coastal flooding.

• The main cause was the above average & long period of heavy rain which caused

all 3 rivers to have their peak flow at the same time.

• In the spring, melting snow from the Himalayas further increases the flood risks

as torrents of melt water enter the rivers at their source.

24 | P a g e

8/3/2019 Flood Preparedness and GIS

http://slidepdf.com/reader/full/flood-preparedness-and-gis 25/55

The Human Causes of the Floods:• Deforestation in Nepal and the Himalayas increases run off and add to deposition

and flooding downstream.

• Urbanization of the flood plain has increased magnitude & frequency of floods.

• Global warming is blamed for sea level rise, increased snow melt & increased

rainfall in the region.

• The building of dams in India has increased the problem of sedimentation in

Bangladesh.

• Poorly maintained embankments (levees) leak & collapse in times of high

discharge.

• Increasing population pressure in Bangladesh itself has resulted in the sinking of 

many new wells resulting in the lowering of the water table and the subsequent

subsidence of land making it even more prone to flooding.

2.2.4 Effect of flooding in Bangladesh:

2.2.4.1 Economy

Economic loss

○ The flooding in Jiangxi of China in 1998 caused great damage. The economic loss

was HK$156 billion, 400 buildings surrounding the lake were inundated, leaving

more than 1 million people homeless.

Resources used in reconstruction

○ After flooding, government has to input many resources for aiding or 

reconstruction, e.g., police force, fire control, aid worker, resources used for 

resisting flood, etc. This also brings loss to society.

2.2.4.2 Environment

Traffic

○ Flooding will lead to the damages of roads, collapse of bridges or traffic

congestion, which may affect the daily operation.

25 | P a g e

8/3/2019 Flood Preparedness and GIS

http://slidepdf.com/reader/full/flood-preparedness-and-gis 26/55

Damaging the farmland

○ Flooding brings too much water which will cause damage to farmland.

2.2.4.3 Human Beings

People died and lose their homes

○ Flooding will cause death and injuries. In year 1998, 0.23 billion of people were

affected in the flooding of Xian, including 3 thousands people dead, 1 million of 

 people lost their homes. In 1996, the monsoon flood in India affected more than

five million people in the northern and eastern part of the country. Severe floods

have also killed some 200 people in India and Bangladesh and left millions

homeless and starvation.

2.2.4.5 Disease

Flooding usually brings infectious diseases, e.g. military fever, pneumonic plague,

dermatopathia, dysentery, common cold (type A), breakbone fever, etc. And for those

areas which have no electric supply due to flooding, food poisoning may occur as

food may not be properly frozen.

2.3 Risk Profile of Gowainghat:

Different studies (as referred in the literature review section of this report) suggested to

consider elevation, geographic location, infrastructure, types of households and economy

as a whole to assess the physical vulnerability of any area to flood.

26 | P a g e

8/3/2019 Flood Preparedness and GIS

http://slidepdf.com/reader/full/flood-preparedness-and-gis 27/55

2.3.1 Physical Vulnerability:

 Picture# 04: Digital map of google earth showing maximum elevation of haor/ beel areas

As per the data presented in table#02, Gowainghat upazilla is a low elevation area as a

whole. Average elevation of the area is 47.5ft from the sea level whereas average

elevation of all the rivers in the area is 36ft from the sea level. On the other hand average

elevation of the roads in the upazilla is also only 39.5 ft from the sea level, which is only

3.5 ft high from the average river level. Average elevation of households is only 11.5 ft

high from the river level though minimum elevation of households is 1ft lower than

minimum river elevation, and 11 ft lower than the maximum elevation of river elevation.

Sl Type Lowestelevation

in flfrom sea

level

Highestelevationin fl fromsea level

Averageelevationin fl fromsea level

Coverage Possibility of  being

affected

1 Haor and beels

39 44 41.5 7890.63 acres Very high

2 Households 30 65 47.5 34133 High

3 River 31 41 36 - -

4 Vital facilitiesand towns

37 61 49 Around Salutikar  and upazillaheadquarter 

Low

5 Roads 32 47 39.5 Kacha-203 km,Pakka-26 km

Medium

6 Tea gardens 56 94 75 4 gardens Very low

7 Total area 30 65 47.5 486.10 sq km in flfrom sea level

Medium

Table#02: Comparative elevation status of different physical components*1

27 | P a g e

Haor/ beel

Showing elevation

8/3/2019 Flood Preparedness and GIS

http://slidepdf.com/reader/full/flood-preparedness-and-gis 28/55

 Picture#05: Google earth image is showing the maximum elevation of households

1

 Picture#05: Google earth digital image mueasuring elevation of vital facilities

Flood level of this upazilla is influenced by water level of some rivers which is flowing in

the upazilla or around it.Bangladesh as well as the upazilla experienced severe flood in

1 Source: Population Census-2001, Zilla Series, Zilla: Sylhet

28 | P a g e

8/3/2019 Flood Preparedness and GIS

http://slidepdf.com/reader/full/flood-preparedness-and-gis 29/55

1988 and 1998. Comparative status of water flow in these rivers during that time can be

summarized as follows-

River StationRecorded

Maximum

Danger Level

(m)

Peak of the Year (m) Days above Danger Level 

1998 1988 1998 1988

Jamuna Bahadurabad 20.62  19.50  20.37 20.62 66 27

Jamuna Serajganj 15.12  13.35  14.76 15.12 48 44

Old

Brahmaputra

Jamalpur 18.00  17.00  17.47 17.83 31 8

Old

Brahmaputra

Mymensingh 14.02  12.50  13.04 13.69 33 10

Surma Kanaighat 15.26  13.20  15.00 15.10 73 75

Surma Sylhet 11.95  11.25  11.72 11.95 14 21

Surma Sunamganj 9.46  8.25  8.90 9.30 56 62

Kushiyara Amalshid 18.28  15.85  17.61 17.50 54 65

Kushiyara Sheola 14.33  13.50  14.14 14.09 37 80

Manu Manu Rly Br 19.39  17.07  18.63 18.95 6 66

Manu Moulvi Bazar 13.25  11.75  11.68 13.01 NA 25

Khowai Habiganj 11.55  9.50  11.44 11.00 8 14

Upper Meghna Bhairab Bazar 7.66  6.25  7.33 7.66 68 68

Gumti Comilla 13.56  11.75  12.90 12.79 11 17

Table#03: Water level in some rivers during the floods of 1988 and 1998

If we analyze data of the above table in light of the elevation presented earlier in this

section we will find that most of the households, roads, vital facilities went under water in

 both occasions. Flood of 2004 was less severe than those in 1998 and 1988, but this

upazilla could not survive due to its low elevation. Following picture taken during the

flood in 2004 shows how households and roads are submerging to flood water.

29 | P a g e

8/3/2019 Flood Preparedness and GIS

http://slidepdf.com/reader/full/flood-preparedness-and-gis 30/55

 Picture#07: Households and roads of Gowainghat were submerged to flood water during the flood of 2004

2.3.2 Infrastructure:

Gowainghat is considered as one of the poorest upazillas of the country, which is well

reflected in its infrastructure present in the table below. 79.90% of the total households

are kutcha, and 97.967% of total households are not pucka meaning 202219 out of 

207170 people, which means 97.61% of total population are living in unprotected

households, which do not have capacity withstand high velocity flood water.

Locality and typesof structures All structures Jhupri Kutcha Semi-Pucka Pucka

ALL AREA 34133 2970 27274 3195 694

Population 207170 16410 164051 21758 4951

Dwelling 33635 2904 26954 3141 636

Population 204521 16085 162409 21464 4563

Institution 142 16 65 22 39

Population 975 95 438 167 275

Urban 818 25 564 164 65

Population 4568 145 3251 808 364

Rural 33315 2945 26710 3031 629

Population 202602 16265 160800 20950 4587

Table#04: Types of households and population associated with it *22

2 Source: Population Census-2001, Zilla Series, Zilla: Sylhet

30 | P a g e

8/3/2019 Flood Preparedness and GIS

http://slidepdf.com/reader/full/flood-preparedness-and-gis 31/55

This upazilla has only 26km of pucka road against 203 kms of kutcha road. In most of the

cases, these roads went through haors and beels having vast water body around it since

these roads are mostly kutcha, and becomes completely damaged due to water force fromall the four directions.

As per above table, only 39 out of 142 institutions have pucka structures, and this is not a

good sign as institutions are nearly used for shelter, flood response and providing vital

facilities. If these institutions are made of kutcha structures and collapsed during flood,

overall flood management becomes jeopardized.

2.3.3 Economical Vulnerability

People of Gowainghat upazilla are highly dependent on agriculture and related industry.

As we can see in the table on the following page, 56.48% of total population and 56.98%of rural population is directly related to agriculture. On the other hand 3.6% of total

 population and 3.55% of rural population are involved in wage/ salary, rent, remittance

and other types of profession, which may not

31 | P a g e

8/3/2019 Flood Preparedness and GIS

http://slidepdf.com/reader/full/flood-preparedness-and-gis 32/55

Locality Total Agri/Forestry/Livestock 

Fishing/Pisciculture

Agri-Labor

Non-Agrilabor

Weaver Industryworker

Businessshop

Hawker Transport/Commu.

Construction Religiousservice

Salary/Wage

Rent Remittacne Others

All area 33635 11278 983 7720 4857 33 151 3157 65 227 165 142 793 12 403 3649100 33.53 2.92 22.95 14.44 0.10 0.45 9.39 0.19 0.67 0.49 0.42 2.36 0.04 1.20 10.85

Urban 794 179 55 109 83 0 0 147 2 0 5 3 117 1 1 92100 22.54 6.93 13.73 10.45 0 0 18.51 0.25 0 0.63 0.38 14.74 0.13 0.13 11.59

Rural 32841 11099 928 7611 4774 33 151 3010 63 227 160 139 676 11 402 3557100 33.80 2.83 23.18 14.54 0.10 0.46 9.17 0.19 0.69 0.49 0.42 2.06 0.03 1.22 10.83100 36.51 2.82 23.51 12.57 0.09 0.40 9.38 0.16 0.63 0.46 0.40 2.10 0.03 1.42 9.53

Basti 906 301 26 169 213 2 8 80 0 0 3 2 7 0 3 92100 36.41 3.24 19.15 19.86 0.21 0.87 9 0 0 0.29 0.14 0.85 0 0.23 9.74

Table#05: Dwelling households and percentage of population by main source of income

Source: Population Census- 2001, Zilla Series, Zilla: Sylhet

32 | P a g e

8/3/2019 Flood Preparedness and GIS

http://slidepdf.com/reader/full/flood-preparedness-and-gis 33/55

 be affected by flood. This statistics signifies the fact that profession of more than 96%

 population of this upazilla are influenced by flood. So flood can affect the economy of 

this upazilla significantly.

As observed in the field and digital map collected through web-based GIS software, most

areas of this upazilla is covered either by haors and by beels. Only a part of the north-eastern region is covered by tea garden. It means that whole land area of the upazilla is

exposed to flood hazar except its north- eastern part.

2.3.4 Population related Vulnerability

Population is the most vulnerable component to disasters like flood. It is the people who

often pay much in all the cases because all the other components like infrastructure,

economy and geography and direct as well as indirect relation with people.

In case of Gowainghat as shown in the following table, only 4951 out of 207170 (2.38% )

  people live in pucka households. Most of the non-pucka households are made of 

temporary nature of materials. These households are also situated amidst low a lying land,which stays under water during flood. Flood water with high velocity hits these

households from all the four sides creating much damage. These people are poor and

literary hand to mouth often losing their living before, during and after flood. Their 

 properties, valuables, livestock etc are often lost during the phenomena. Furthermore,

they suffer from communicable diseases during and after floods. People in urban areas are

less exposed in comparison to those in rural areas.

Locality and typesof structures All structures Jhupri Kutcha Semi-Pucka Pucka

ALL AREA 207170 16410 164051 21758 4951

Dwelling 33635 2904 26954 3141 636

Institution 975 95 438 167 275

Urban 4568 145 3251 808 364

Rural 202602 16265 160800 20950 4587

Table#06: Household- structure wise population in Gowainghat upazilla3

3 Population Census- 2001, Zilla Series, Zilla: Sylhet

33 | P a g e

8/3/2019 Flood Preparedness and GIS

http://slidepdf.com/reader/full/flood-preparedness-and-gis 34/55

Sl

#

Upazila Population Total

0-11 month 12-23 month 2-4 year 5-14 year 15-49 year 50+ year  

Male Femal

e

Male Femal

e

Male Female Male Female Male Female Male Female Male Female Total

1 Gowainghat 4,476 4,221 5,481 5,409 13,442 13,692 29,945 28,978 53,562 51,076 8,998 9,000 115,904 112,376 228,280

Table#07: Agewise and gender wise population of Gowainghat upazilla

34 | P a g e

8/3/2019 Flood Preparedness and GIS

http://slidepdf.com/reader/full/flood-preparedness-and-gis 35/55

2.4 Risk Map

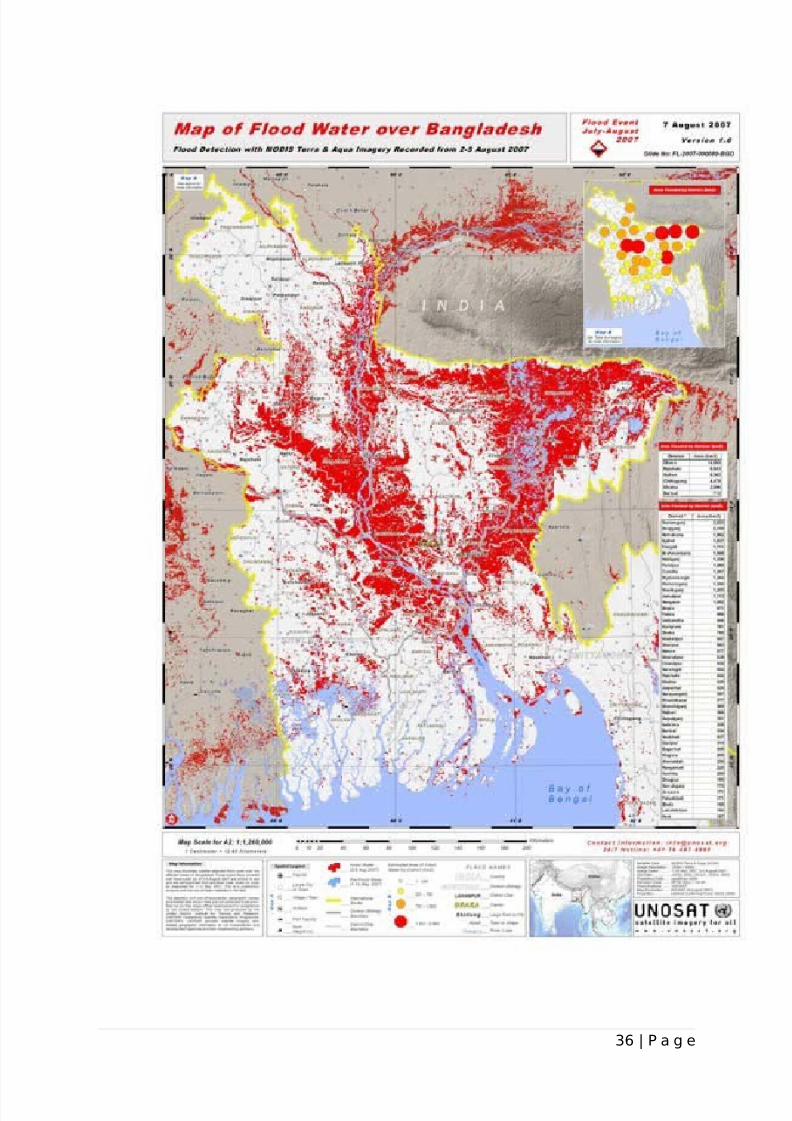
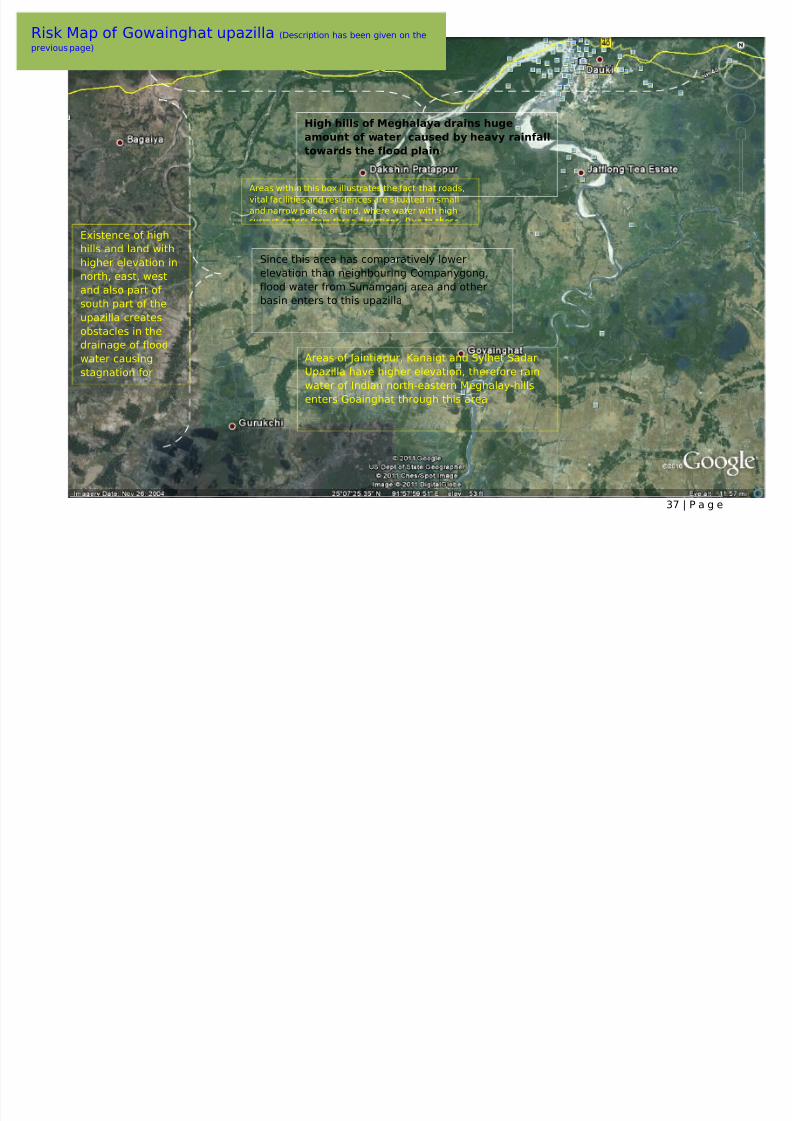
There are many established techniques to analyse vulnerability of any area. In case of assessing flood risk for Gowainghat upazilla, a map of the upazilla has been prepared

using web based GIS software, Google Map, and the same map has been used for analysis

of physical risk to flood.

As we can see picture#09, Gowainghat upazilla is composed of approximately ten beels,

haors, agricultural land and four tea gardens on the high lands. It has Himalayan

Mountains of Meghalaya province of India at its north. Hilly upazilla of Sylhet district,

Jaintiapur, covers the north-eastern, eastern and part of southern part of the upazilla. Its

south is covered by high parts of Sylhet sadar upazilla. Flood prone another upazilla of 

Sylhet district, Companiganj, is situated at the west and north-western part of the upazilla.

Due to having lands with high elevation around all the four parts of the upazilla, flood

water approaches to the mass of this upazilla from three directions- north, west and east.

Also due to higher elevation, it is not easy for flood water to be drained. And this creates

stagnation of water in this upazilla round the year. And for the same reason it is one of the

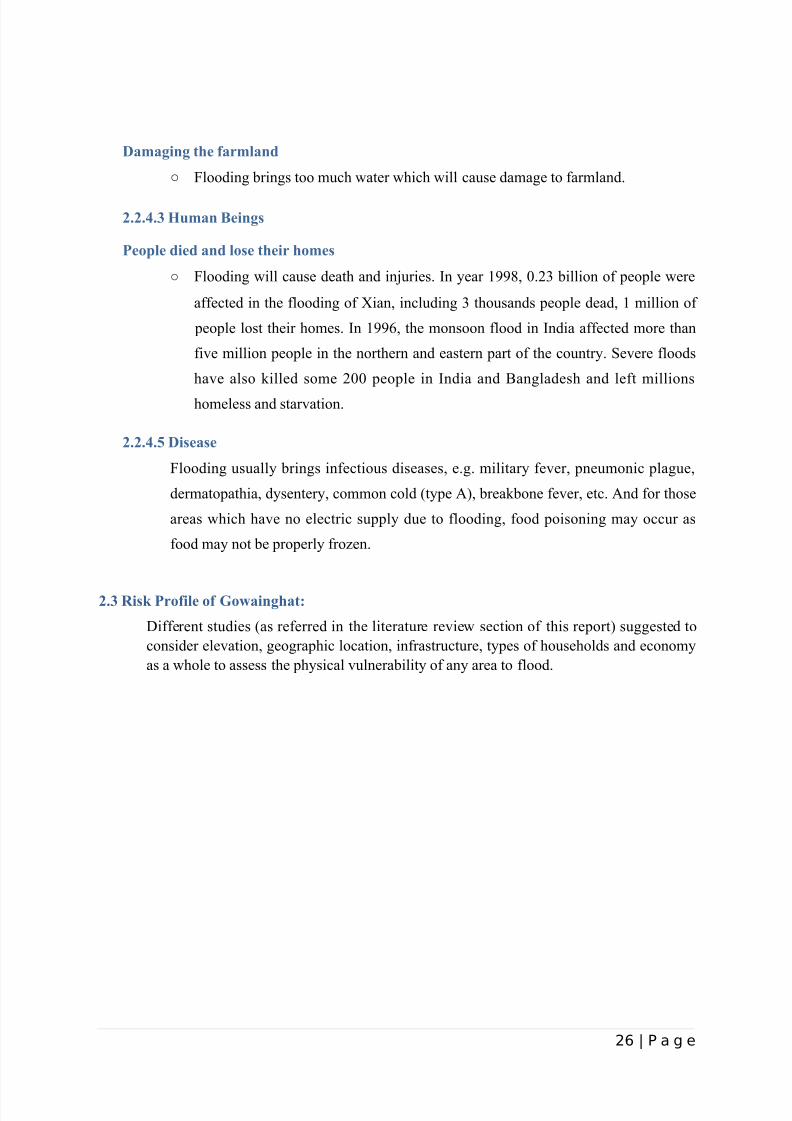
most flood prone upazillas of the country. The map on the previous page is showing the

flood status of 2007, and supported the fact, with red color, that water of this upazilla

 becomes stagnant due to high elevation around it.

According to the map on the following page, houses in this upazilla are constructed either 

on the banks of rivers or in a thin row within vast body of water. Most of this houses, as

shown in figure#12 are of temporary type and made of tin/ bamboo on earthen base. Since

water enters this area from nearby high hills and mountains, it has high velocity, which is

extremely dangerous for household and transportation on water bodies. This invreases

damage and interrupts response work during the floods.

As shown on the map on figure#19 there is ten strategic location which influences overall

flood level of the upazilla. If water levels in these locations are high it creates a huge

flood in the upazilla. On the otherhand, if water flow in these locations can be controlled,

flood in this upazilla can be controlled.

35 | P a g e

8/3/2019 Flood Preparedness and GIS

http://slidepdf.com/reader/full/flood-preparedness-and-gis 36/55

36 | P a g e

8/3/2019 Flood Preparedness and GIS

http://slidepdf.com/reader/full/flood-preparedness-and-gis 37/55

37 | P a g e

Risk Map of Gowainghat upazilla (Description has been given on the

previous page)

Areas of Jaintiapur, Kanaigt and Sylhet Sadar

Upazilla have higher elevation, therefore rain

water of Indian north-eastern Meghalay-hills

enters Goainghat through this area

Areas within this box illustrates the fact that roads,

vital facilities and residences are situated in small

and narrow peices of land, where water with high

Existence of high

hills and land with

higher elevation in

north, east, west

and also part of 

south part of the

upazilla creates

obstacles in the

drainage of flood

water causing

stagnation for

Since this area has comparatively lower

elevation than neighbouring Companygong,

flood water from Sunamganj area and other

basin enters to this upazilla

High hills of Meghalaya drains huge

amount of water caused by heavy rainfall

towards the flood plain

8/3/2019 Flood Preparedness and GIS

http://slidepdf.com/reader/full/flood-preparedness-and-gis 38/55

Chapter# 3.0 Present practices of flood preparedness in the study area

Flood preparedness is composed of five basic steps, which are as follows-

1. Forecasting

2. Warning

3. Evacuation

4. Flood fighing, and

5. Food stockpiling and medical supplies

Present activities in each stage has been briefed as follows-

3.1 Preparedness related to forecasting:

In Bangladesh, Bangladesh Water Development Board and Department of Meteorology

are primarily responsible for flood forecasting. Some other departments like those

working on water modelling and geographic information system provides valuable

support to them.

Chart#03: Flood forecasting and warning in Bangladesh

38 | P a g e

8/3/2019 Flood Preparedness and GIS

http://slidepdf.com/reader/full/flood-preparedness-and-gis 39/55

As illustrated in diagram present on the previous page, Bangladesh Water Development

Board collects data on the water level of different rivers at different strategic locations of 

the country. These locations has been shown in the figure #19 Beside collecting these

data, they also collect data on water in-flow from neighbouring countries. They interpret

these data using different types of computer software and analysis techniques. Once

realized the possibility of flood, they communicate these messages to concerned

authorities for dissemination of warning signals.

On the other hand, Bangladesh Department of Meteorology and other departments with

similar functions collect data on rainfall in the country as well as neighbouring countries.

Besides collecting data at their own, they collected relevant data from neighbouring

countries and countries in Asia Pacific region. They use satellite images and other tools to

accurately predict Flood. If they assume possibility of flood, they communicate the

message to the concerned authority for warning. In most cases they give these messages

to Bangladesh Disaster Management Bureau, electronic and new media as well as to the

office of the Prime Minister.

In case of sub-national level activities, forecasting related activities are generally done at

the districts. District level offices of Bangladesh Water Development Board, Bangladesh

Disaster Management Bureau, District Administration, Pourashava/ City Corporation

administration and media are generally the primary recipient of these messages, anddisseminate warning messages to the mass population in a coordinated way.

At the forecasting phase there is no special mechasin for Gowainghat upazilla. Everything

is being done at the national and district level. In case of this upazilla, there are ten

strategic river points in Gowainghat, Chattak and Jaintapur upazilla that are very crucial

to assess the possibility and extent of flooding in this upazilla. These strategic points are

shown in the figure#19. 

According to present practices, it takes approximately few hours to convey forecasted

messages to the concerned authority, and around 24 hours to send it to the upazilla level.

If the upazilla/ district wants to collect/ forecast themselves it takes around three to four 

days to collected information related to water level and other related information due to

use of backdated technology.

3.2 Preparedness related to warning:

Media plays a vital role is dissemination of warning messages in Bangladesh, be it

national, sub-national and grass-root level. Beside these mobile phone, land telephone,

fax, VHF, HF, internet etc are used for the purpose.

39 | P a g e

8/3/2019 Flood Preparedness and GIS

http://slidepdf.com/reader/full/flood-preparedness-and-gis 40/55

District level organizatons like office of the Deputy Commissioner, Department of health,

Departments related to utility services like electricity, sanitatation etc are informed by

national level and district level offices of meteorological department, and disseminate

warning messages to upazilla and below level through different channels. Mass media

like Bangadesh Betar, Bangladesh Television and newspapers also play a very important

role in this regard.

Gowainghat upazilla is composed of eight unions and each union is divided into nine

administrative wards. Upazilla Nirbahi Officer (UNO) receives warning messages from

the district level and communicated to different department at the upazilla level. S/he

 passes the warning messages to union level through mobile phone, land telephone, VHF

radio set and/ or through messenger.

After receiving information from the upazilla level, union chairmen passes these warning

messages to the ward members, union disaster management committee members and

volunteers for miking and door to door message dissemination. They also take

 preparatory measure to evacuate people to flood shelter and for flood fighting.

3.3 Preparation for evacuation:

Presently there is no systematic mechanism for emergency evacuation. There are

volunteers at the union and subsequently at ward level with inadequate training and

logistic. Affected people are generally responsible for their own evacuation. No plan or 

arrangement for evacuation of physically and psychologically challenged people, children

and livestock. Everything is being done extemporarily.

As per the Standing Order for Disaster (SOD), every union, upazila and district should

have disaster management plan, and act according during disaster. In most cases this is

not materialized due to lack of skilled human resource and institutional inability. At union

level, there are volunteers who are specifically designated work for evacuation.

There is no specialized flood shelter or cyclone shelter or any type of shelter, which can

 be used as shelter of evacuee. Primary and high schools, colleges, union parisad buildings

(there are eight in Gowainghat upazilla) and high lands are used as flood shelter during

floods.

20 institutions are marked as flood shelters to accommodate 207170 people from 274

villages. Four big flood shelters can accommodate on average 1500 people, whereas all

other shelters can accommodate approximately 200 people. So, all the flood shelters of 

this upazilla can accommodate approximately 9200 people during flood.

40 | P a g e

8/3/2019 Flood Preparedness and GIS

http://slidepdf.com/reader/full/flood-preparedness-and-gis 41/55

Some evacuation related activities are as follows, which are generally undertaken

immediately before floods-

• Give short briefing to the volunteers

• Make coordination with agencies who generally work for evacuation

• Liaison with water vessels owners’ association and truck-bus owners’

association for their support during evacuation.

• Coordination with Gram Police and law enforcing agencies for the

security of people and their properties during and after evacuation.

• Coordination with heads of the educational institutions and public

representatives so that they can allow people to use their premise as flood

shelters.

• Appeal to rich people in the society so that they can provide support in

feeding the evacuated people.

• Coordination with the health department for supply of ORS and other 

necessary supplies so that they can be provided to the affected people.

3.4 Preparation for flood fighting:Office of the Upazilla Nirbahi Officer and upazilla level office of the Department of 

Public health and Engineering play an imporatant role for flood fighting. Upazilla level

stores of public health department generally stores sufficient quantity of pipes for raising

tubewells, slabs and rings for raising the bases of sanitary latrines and bleaching powders

for disinfection of tubewells and sanitation facilities.

Water Development Board and Department of Roads (WDB), Power Development Board

(PDB) and Department of Road and Highways do not have any representive at the

upazilla level, officials from district comes and works with the facilitation of Upazilla

 Nirbahi Officer. Project Implementaion Officer (PIO) coordinates with all the agencies

and union level under the guidance of District Relief and Rehabilitation Officer (DRRO)

and Upazilla Nirbari Officer (UNO). Representatives of PWD, WDB, PDB etc works to

safe guard roads, facilities related to electricity supplies etc.

Agriculture department has representative at the upazilla nd union level plays a crucial

role in guiding farmers and general people in taking protective measure to save their 

crops, livestocks and households.

41 | P a g e

8/3/2019 Flood Preparedness and GIS

http://slidepdf.com/reader/full/flood-preparedness-and-gis 42/55

Beside all these, public representives like union parisad chairmen, members, choukidars

and volunteers of Bangladesh red crescent go door to door to guide mass people on

different protective measures.

On top of all, people take measures to fight flood as per their own understanding andexperience.

 Picture#10: Flood in 2004. Lengura union, Gowainghat 

3.5 Preparation related to food stock piling and medical supplies:

Department of food is primarily responsible for storing of food for flood. In this

connection, they maintain one big warehouse at the district level, which is situated in

Sylhet. They also have some other warehouses in strategic locations of the district.

Fortunately one of the warehouse for storing of food in situated in Nandirgaon union of 

the upazilla though its size is inadequate in comparison the population size of the

upazilla.

Gowainghat Health Complex, the only hospital in the upazilla, has provision of storing

medicine and related medical supplies for flood though the principal warehouse is called

DRS, which is situauted at the district headquarter in Sylhet. This health complex stores

ORS, vaccines, water purification tablets, medicines of skin diseses and different types of 

water borne diseases.

42 | P a g e

8/3/2019 Flood Preparedness and GIS

http://slidepdf.com/reader/full/flood-preparedness-and-gis 43/55

Chapter# 4 Limitations and Challenges of present practices in flood:

This report has already discussed different stages of flood preparedness and related

activities. This section will focus the limitations and challenges of present practices in

flood preparedness, which is mostly human induced and less dependent on technology

like GIS. A popular analysis method named Critical Path Method (CPM) has been used to

assess the challenges.

Information related to this chapter has been collected through discussion with the affected

 people of Gowainghat, NGO workers and government officials who are working in the

same area.

4.1 Limitations of present practices at different stages of flood preparedness

Present practices of flood preparedness have many limitations. Some of those are as

follows-

4.1.1 Forecasting:

• Due to the human dimension in our forecasting mechanism, and less

use of cutting age technological equipment, our forecasting is time

consuming and less reliable.

• Due to lack of relevant technology and coordination with

neighbouring countries, we are not getting messages within due time.

• Lack of experts for analysis and interpretation of forecasting signals

and messages.

• Lack of coordinaton between departments responsible for forecasting

and dissemination of warning messages.

4.1.2 Warning:

• Delay in receiving forecast

• Delay in disseminating warning messages

• Lack of proper technology in dissemination of warning messages.

• People often fails to understand the warning messages, and decididetheir course of action.

• Flow for dissemination of warning messages is not same at all level,

and reduces lead time for prepation for the flood.

4.1.3 Evacuation:

• There is no specific plan or mechanism for evacuation during flood.

• Efforts made during the flood are generally inadequate in comparison

the population.

•  No arrangement or actin for livestocks.

 No mechanism to safeguard left properties of the evacuees.

43 | P a g e

8/3/2019 Flood Preparedness and GIS

http://slidepdf.com/reader/full/flood-preparedness-and-gis 44/55

• Importance of evacuation related preparation is often ignored in flood

 preparedness as well as disaster management related planning.

4.1.4 Flood fighting:

• Lack of coordination between different agencies.

• Most of the flood fighting related activities is done by governmentdepartments like health, public health, LGED, road and highways etc

department. Negligible amount of effort are being given to saveguard

 people and their properties including crops and livestocks.

• Very poor volunter management. Some volunteers has left long time

 before. No body knows about this. No replacement. No training and

logistics.

4.1.5 Food stockpiling and medical supplies:

• Location of the warehouse in Nandirgaon is not strategic. It is located

at one corner of the upazilla. Affected areas are far from it, which may

create problem in transportation of food during the time of need.

• The warehouse is not situated in high land as a result there is a

 possibility that the warehouse may go under water duing flood.

• As floods come generally after long interval, medicines and drugs

 purchased after or during one disaster expires before another disaster.

People responsibile for maintenance of these stocks seldom checks the

expiry dates.

4.2 Challenges at different stages of flood

Challenges of present practices can be analyzed using a simple flow chart visualizing

critical success factors in each stages of flood preparedness as illustrated through a flow

chart on the following page, each stage has some challenges, and success of that stage

depends on how the challenges are overcome.

The analytical flow chart on the following page has shown all the challenges through a

separate dimension titling critical path. Despite having many challenges no point has been

shown against the forecasting stage since preparedness begins with forecasting, and all

the challenges of later stages are based on the initiative taken at this stage.

Disseminating warning messages to mass population and critical people in a way so that

they can realize the situation, and know exactly what to do- the challenge is at the

warning stage. Due to bureaucracy, lack of accountability and inability of understanding

the severity of the hazard, warning messages are not, generally, disseminated on time.

This is partly due to use of backward technology. On the other hand it is also important to

ensure that managers of vital facilities like those of road and highways, health, electricity,

water, public health etc. departments, and those who are maintaining large installations

involving a huge number of employees gets the warning message at the early stage so that

they can get sufficient time to take action.

44 | P a g e

8/3/2019 Flood Preparedness and GIS

http://slidepdf.com/reader/full/flood-preparedness-and-gis 45/55

Evacuation is one of the most challenging part of flood preparedness. There should be a

specific plan for evacuation with projected estimate of the areas to be affected with

number of population in the coverage area. Accordingly shelter should be prepared with

 provision for livestock. Security of leftout households should also be considered. Total

number of evacuee should be matching with the total capacity of available flood shelters.

Success of this stage largely depends on getting forecast on time, and quick estimation of coverage area and population.

Chart#04: Analysis of challenges of present practices using Critical Path Method (CPM)4

Flood fighting is one of the most crucial stages in flood preparedness. Success of this

stage depends largely on the correct interpretation of the warning message, and also

getting it with sufficient time in hand. Understanding of responsibility is also very crucial.

This steps often suffers from the dielemma of who is to do what? Considering that it mind

steps should be taken to avoid role conflict during preparation in non-flood time. Service

4 Solve That Problem. Edited by Steve Smith. Published by KOGAN PAGE

45 | P a g e

8/3/2019 Flood Preparedness and GIS

http://slidepdf.com/reader/full/flood-preparedness-and-gis 46/55

 providers should have clear understanding about their role at this stage, and same way

mass communication activities should be undertaken to make people realize their role

during this time. Mass population do not have the idea on measure to do to fight flood.

Different types of measures should be taken to educate people on this issue much ahead

of the flood season so that time is not wasted during or at the beginning of the flood

trying to teach them on this issue.

Flood stock piling and medical services is a very important step in terms of saving lives.

Departments like food, public health and engineering, health etc should have sufficient

 preparation to provide food and other related support to the population in and outside the

flood shelter. Like preparatory activities for evacuation, correct estimate of affected or to

 be affected area should be prepared, and logistics and supplies should be procured and

stored accordingly. It is often seen that stock procured once is not checked later on for 

expiry as a result these cannot be used during the time, when they are expected to be

used.

4.3 Assessment of need for improvement in present practices:

Analysis in this section has been done in three perspective- possibility of failure, what to

do to reach an ideal situation? and feasibility of using technology.

4.3.1 Analysis from the perspective of failure:

As mentioned earlier in this section, the purpose of this analysis is to identify gaps

of present system, if these are any, and search for possible causes of those gaps.

Again it looked for the root causes. Final outcomes of this analysis are

recommendations to overcome present limitations based on the field observations,

interviews, newspaper cuttings and own experience of the reporter in the study

area.

If we look the table#08, we will find that “Evacuation” is the weakest stage of 

flood preparedness having an RPN rating of 384. Second weakest area is

“Warning” with a RPN rating of 250. Present practices of flood preparedness are

so far better in flood preparedness. Possibility of system failure is high in

“warning” and “Food stock piling and medical services” stage. Severity of failure

is high in Forecasting and evacuation stages.

As far as recommendation is concerned, use of GIS and mass communication are

the best remedies so far.

4.3.2 Analysis from the perspective of ideal situation

What needs to be done to achieve an ideal situation in flood preparedness is the

central idea of this analysis. As per the chart#05, effective flood preparedness

should have three broad objectives namely reducing the damage to the economy,

reducing damage to the infrastructure and reducing loss of lives, livestock and

 properties.

46 | P a g e

8/3/2019 Flood Preparedness and GIS

http://slidepdf.com/reader/full/flood-preparedness-and-gis 47/55

In case of reducing damages to the economy, protection agriculture and keeping

economic activities operational are two key specific objectives. Use of GIS and

computerized database can contribute a lot in fulfilling these objectives.

On the other hand, early warning for flood fighting, relocation of economic

institutions, finding ways to redirect and drain flood water are crucial for reducing

damage to the infrastructure. And GIS can be an answer to all these.

Reduction of losses to lives, livestock and properties is dependent on factors like

early warning for flood fighting, mass communication for mass awareness, mass

education on mass flood preparedness, effective evacuation system, effective

management of food and medical supplied before, during and after flood. Mass

communication, computerized database and GIS can be contributory in these

cases.

4.3.3 Analysis to assess the feasibility of using technology

Purpose of this analysis is to identify best mix of people and technology through

illustration of four different situations combining people and technology. If we

analyse chart#06, we will find four scenarios. In the best possible scenario is the

use of technology where most of the activities are fully automated or not

dependent on human interactions. On the other hand, the worst possible scenario

is the one, which completely manual depending highly on human interactions.

47 | P a g e

8/3/2019 Flood Preparedness and GIS

http://slidepdf.com/reader/full/flood-preparedness-and-gis 48/55

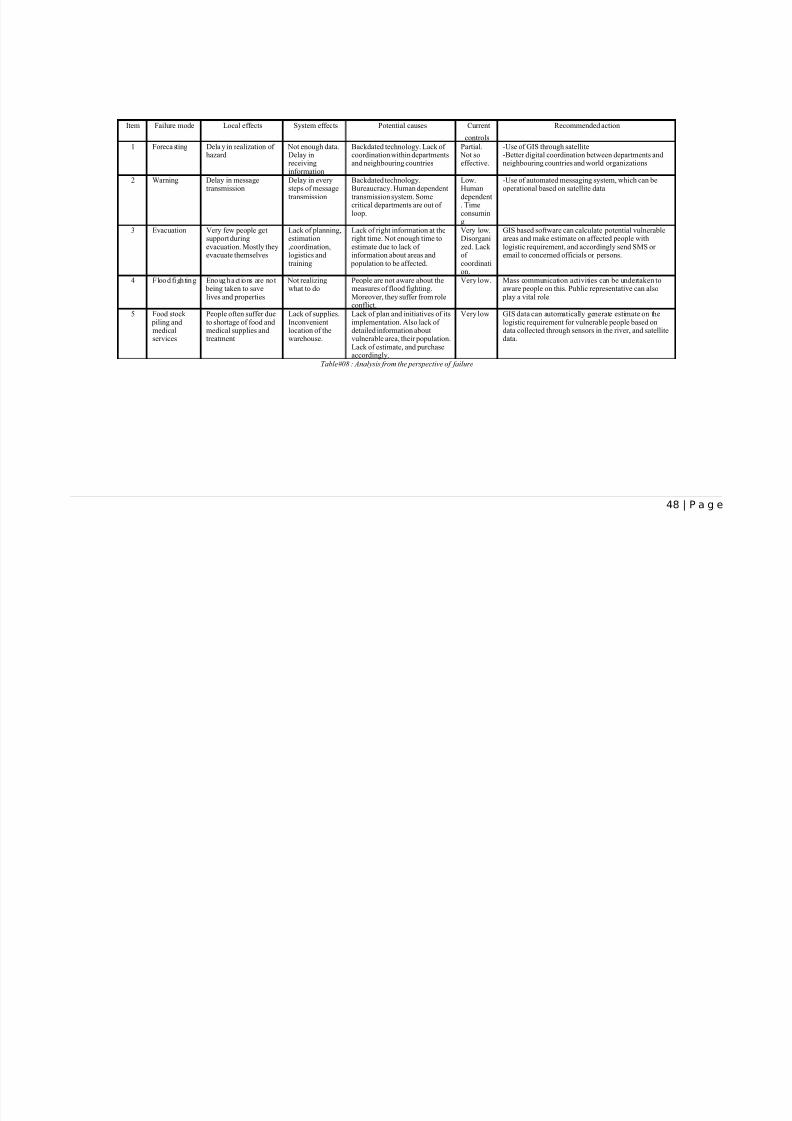
Item Failure mode Local effects System effects Potential causes Current

controls

Recommended action

1 Foreca sting Dela y in realization of  hazard

 Not enough data.Delay inreceivinginformation

Backdated technology. Lack of coordination within departmentsand neighbouring countries

Partial. Not soeffective.

-Use of GIS through satellite-Better digital coordination between departments andneighbouring countries and world organizations

2 Warning Delay in messagetransmission

Delay in everysteps of message

transmission

Backdated technology.Bureaucracy. Human dependent

transmission system. Somecritical departments are out of loop.

Low.Human

dependent. Timeconsuming

-Use of automated messaging system, which can beoperational based on satellite data

3 Evacuation Very few people getsupport duringevacuation. Mostly theyevacuate themselves

Lack of planning,estimation,coordination,logistics andtraining

Lack of right information at theright time. Not enough time toestimate due to lack of information about areas and

 population to be affected.

Very low.Disorganized. Lack of coordination.

GIS based software can calculate potential vulnerableareas and make estimate on affected people withlogistic requirement, and accordingly send SMS or email to concerned officials or persons.

4 Flood figh ting Enough a ct ions are no t being taken to savelives and properties

 Not realizingwhat to do

People are not aware about themeasures of flood fighting.Moreover, they suffer from roleconflict.

Very low. Mass communication activities can be undertaken toaware people on this. Public representative can also

 play a vital role.

5 Food stock   piling andmedicalservices

People often suffer dueto shortage of food andmedical supplies andtreatment

Lack of supplies.Inconvenientlocation of thewarehouse.

Lack of plan and initiatives of itsimplementation. Also lack of detailed information aboutvulnerable area, their population.Lack of estimate, and purchaseaccordingly.

Very low GIS data can automatically generate estimate on thelogistic requirement for vulnerable people based ondata collected through sensors in the river, and satellitedata.

Table#08 : Analysis from the perspective of failure

48 | P a g e

8/3/2019 Flood Preparedness and GIS

http://slidepdf.com/reader/full/flood-preparedness-and-gis 49/55

Chart#5: Analysis from the perspective of an ideal situation

49 | P a g e

8/3/2019 Flood Preparedness and GIS

http://slidepdf.com/reader/full/flood-preparedness-and-gis 50/55

Human induced forecasting systemHuman induced warning, and its transmission

Manual assessment of potential damage and estimation

Fully automated warning systemSensor based assessment of water levels in rivers

Software simulated forecastingGIS data based assessmentGIS data based estimateSMS based guidance on flood fightingSynchronization of GIS server with those in other countri

 Partially computerized forecasting system.Partially automated transmission of warning messages.

Partially automated assessment of damagePartially automated management of food stock and mediPartially automated estimation.

 Human induced forecasting, and manual transmission of  Too much dependence on face to face message dissemin

Chart#6:Analysis of the feasibility of using technology in flood preparedness

50 | P a g e

R

ight

W

rong

W

rong

R

ight

8/3/2019 Flood Preparedness and GIS

http://slidepdf.com/reader/full/flood-preparedness-and-gis 51/55

Chapter# 5: Proposals for improvement and Conclusion:

5.1 Proposals for improvement of flood preparedness:

Since flood affects everybody regardless their identity, flood preparedness is the responsibility of 

everybody. Different types of people have different role to play. Mass population has the major 

role to play by being more aware on the issue and doing their part. On the other hand

administrative and cultural communities as well as the state have certain roles and

responsibilities, which no one else can play. Proposals of this report did not aim to distinguish

their roles, it has rather tried to identify activities to be done. Some of those are-

5.1.1 Activities for reduction of homestead related vulnerabilities:

• Advance plan for prevention of flood related risks

• Selection and training of appropriate volunteers at the community level• Formation and training of community search and rescue team

• Establishment of village level information and warning system

• Organize mass education campaign for awareness on flood related issues

• Ensure immunization and vitamin –A coverage in flood prone area

• Make raised platforms in houses

• Avoid mud-walls while building houses

• Surround the houses and homestead with strongly rooted trees and plants

to prevent/ reduce effect of flood

• Ensure stock of ORS, bleaching powder, water purification tablets, alum,

vitamin A capsules and other essential medicine for simple treatment atcommunity level or village.

• Stock dry food

• Protect drinking water sources

• Train women and family members on the treatment of contaminated water 

5.1.2 Activities for reduction of agriculture related vulnerabilities:

• Protect embankments

• Keep water drainage system better 

• Keep seeds in a safe place

• Plant seedlings in highest possible grounds

• Acquire storage container for keeping seeds

• Acquire late verities of rice

• Store enough rice for two replanting of rice

• Have equipment to remove engines and pumps, and take to a safe place

• Leave rice un-husked in paddy form

• Planting of flood resistant/ deep water crops.

• Stockpiling of fertilizer to use as soon as the flood goes down.

• Consider use of different possible cropping patters which will avoid crop

damage at floods.

• Keep seeds in water tight container 

• Save engine and water pump by removing it to a safe place and cover the

well casing to stop entering of silt

51 | P a g e

8/3/2019 Flood Preparedness and GIS

http://slidepdf.com/reader/full/flood-preparedness-and-gis 52/55

• Prepare soil, collect polythene bags for seedlings, prepare floating or 

hanging seed beds

5.1.3 Activities for reduction of livestock related vulnerabilities:

• Make certain that high ground is found or is built of raised earth where the

animals can be taken in floods• Learn how to recognize and treat diseases which cattles’ may get during

flood. Store related medicine.

• Convince the veterinary specialist in the area to make special arrangements to

visit animals during the flood.

• Sale, if possible, animals before the flood season to get better price and

minimize losses.

• Encourage villagers to produce and stock pile sufficient animal fodder 

• Train village volunteers in poultry and livestock vaccination and vaccinate

every animal regularly.

Ensure materials for vaccination• Make portable cages for poultry

• Encourage duck rearing

• If deep flood apprehended, attempt to move animals to higher ground as soon

as possible

• Build temporary flood shelter for animals

• Assemble a stock of animal foods and grass

• Assemble medicine for animals

• Arrange floating fodder 

5.1.4 Activities to reduce vulnerabilities of homesteads:

• Move to high ground

• Take special precaution to assist children, women and elderly

 persons. Prevent children from swimming.

• Ensure safe drinking water for all the members of the family

• Turn electric switches off 

• Keep carbolic acid to avoid snake biting

• Raise tube-wells and opening of ring-wells

• Use water purification tablets or boil water before drinking

• Arrange early detection , prevention and treatment of water related

diseases

• Keep sufficient stock of ORS• Immediate take children/ babies to nearby health service providing

outlets in case of their breathing problem

• Assist sick and injured people

• Maintain education campaign on breast feeding, sanitation and

 personal hygiene- especially hand washing

• Ensure sanitation facilities like latrines

• Ensure food for pregnant, lactating mothers and under five

children

• Cut banana trees and bamboos and use them as rafts for 

emergency evacuation

52 | P a g e

8/3/2019 Flood Preparedness and GIS

http://slidepdf.com/reader/full/flood-preparedness-and-gis 53/55

5.1.5 Activities to reduce vulnerabilities of agriculture:

• Survey the level of the water as frequently as possible

• Carry seeds to relatively higher ground

• Leave a family member to guard properties, house, fields etcwithout exposing themselves to any threat

• Raise seedlings of rice in small pots at high densities, and raise

vegetable seedlings in floating seed beds or polythene bags

• Arrange agricultural credit with the local banks/ NGOs to replant

crops.

5.1.6 Activities to reduce vulnerabilities of livestock:

• Ensure safe water and safe place for grazing

• Poultry can be evacuated greater distance if floodwaters continues

to raise

• Check the animals for water borne diseases

• Isolate the animals with contagious diseases from other animals

• Contact the livestock department

• Feed stock on floating vegetation.

• Keep animals on mounds of water hyacinth and banana steps- wet

 but high

5.1.7 Integration of GIS Technology

A GIS based server can operate at the district level, which will be connected to the main

server at the national level. Other end of this server will be connected with sensors in ten

strategic location of Gowainghat upazilla and some part of Jaintiapur, Sylhet Sadar and

Chattak upazilla as shown in figure# 19.

This server will have detailed digital map incorporating data like

 –  Elevation of each of 72 wards (1 upazilla X 8 union X9 wards)

 –  Detailed demographic information with statistics on women, children,

elderly and physically challenged people.

 – Agricultural data including number of livestock.

 –  Location of houses, roads, ponds, rivers etc.

Based on the data collected from other countries through the central database at Dhaka,

and water level of the rivers collected from 10 sensors points, GIS software will be able

to analyze which area is going to be affected at what extent. Accordingly the GIS server 

will broadcast SMS through mobile to different agencies, line ministries, public

representative the volunteers and others at the upazilla and union level with the

 possibilities covering suggested course of action. This server will also be able to generate

53 | P a g e

8/3/2019 Flood Preparedness and GIS

http://slidepdf.com/reader/full/flood-preparedness-and-gis 54/55

a prescription for flood fighting, evacuation and estimate for stock piling and emergency

medicine.

Though estimation of overall cost for this initiative is beyond scope of this report, it can

 be safely said that it will be much cost effective in comparison to the benefit it may

generate reducing losses to the economy, infrastructure, people and their properties.

5.2 Conclusion

GIS is a very popular technology for the management of disaster. It can also be used for flood

 preparedness. Different countries of the world including Costa Rica, West Indies, India (on

experiment), Guatemala, Netherlands etc are using it successfully.

Bangladesh is a poor country and densely populated. Even minor a hazard can create a

major disaster anytime. This country do not have the capacity to afford the losses caused by

disasters, floods in most cases, that is why it is more reasonable for the people and policy makers

of the country to invest more on preparedness so that risk can be reduced beforehand.

There are many challenges and limitations in present practices of flood preparedness. If 

GIS technology can be used for this purpose, many of the present limitations can be eliminated

resulting reduced damage to the people, their properties, infrastructure and economy as whole.

54 | P a g e

8/3/2019 Flood Preparedness and GIS

http://slidepdf.com/reader/full/flood-preparedness-and-gis 55/55

Chapter#6: References

1 Ideal locationfor£ood shelter: a geographic information systemapproach J.Sanyal1 and X.X. Lu2 1 Department of Geography, Taki Government College,Taki, West Bengal, India 2 Department of Geography, National University of Singapore, Singapore

2 Realtime web-based remote sensing and GIS for flood management jointly done by ministry of planning, Khulna University and Bangladesh University of Engineering and Technology.

3 GIS Technology for Disaster and Emergency Management: by Russ Johnson.Published by ESRI

4 Challenges for GIS in Emergency preparedness and Response. Published byESRI.5 Application of GIS in flood hazard mapping: A case study of Gangetic West

Bengal, India

6 Low-cost remote sensing and GIS for regional disaster risk reduction, North West

Costa Rica by Naomi Morris

7 GIS as a tool in emergency management process by Leonid V. Stoimenov,

Member, IAENG, Aleksandar Lj. Milosavljević, and Aleksandar S. Stanimirović

8 GIS based natural disaster mapping: A case study by O. Avsar a,*, Z. Duran a, D.

Z. Seker a, M. Hisir a, M. Shrestha b

9 Application of GIS in flood hazard mapping: A case study of Gangetic West

Bengal, India, Joy Sanyal and Xi Xi Lu, Department of Geography, National

University of Singapore

10 Tools for Success: A Managers’ Guide by Dr. Sussane Turner 

11 Solve That Problem by edited by Steve Smith

12 Population Census- 2001, Zilla Series, Zilla: Sylhet

13 Population Census- 2001, Community Series, Zilla: Sylhet


Recommended