HAL Id: hal-02429400 https://hal.univ-antilles.fr/hal-02429400 Submitted on 6 Jan 2020 HAL is a multi-disciplinary open access archive for the deposit and dissemination of sci- entific research documents, whether they are pub- lished or not. The documents may come from teaching and research institutions in France or abroad, or from public or private research centers. L’archive ouverte pluridisciplinaire HAL, est destinée au dépôt et à la diffusion de documents scientifiques de niveau recherche, publiés ou non, émanant des établissements d’enseignement et de recherche français ou étrangers, des laboratoires publics ou privés. Fluorine: Characteristics, Chemistry and Applications Controlled fluorination using atomic fluorine Marc Dubois, Nicolas Batisse, Katia Guérin, Philippe Thomas To cite this version: Marc Dubois, Nicolas Batisse, Katia Guérin, Philippe Thomas. Fluorine: Characteristics, Chem- istry and Applications Controlled fluorination using atomic fluorine. Chemical Elements (Fluorine, Rhodium and Rubidium): Properties, Synthesis and Applications, 2018, 978-1-53614-017-0. hal- 02429400
Transcript
HAL Id: hal-02429400https://hal.univ-antilles.fr/hal-02429400
Submitted on 6 Jan 2020
HAL is a multi-disciplinary open accessarchive for the deposit and dissemination of sci-entific research documents, whether they are pub-lished or not. The documents may come fromteaching and research institutions in France orabroad, or from public or private research centers.
L’archive ouverte pluridisciplinaire HAL, estdestinée au dépôt et à la diffusion de documentsscientifiques de niveau recherche, publiés ou non,émanant des établissements d’enseignement et derecherche français ou étrangers, des laboratoirespublics ou privés.
Fluorine: Characteristics, Chemistry and ApplicationsControlled fluorination using atomic fluorineMarc Dubois, Nicolas Batisse, Katia Guérin, Philippe Thomas
To cite this version:Marc Dubois, Nicolas Batisse, Katia Guérin, Philippe Thomas. Fluorine: Characteristics, Chem-istry and Applications Controlled fluorination using atomic fluorine. Chemical Elements (Fluorine,Rhodium and Rubidium): Properties, Synthesis and Applications, 2018, 978-1-53614-017-0. �hal-02429400�
Fluorine: Characteristics, Chemistry and Applications
Controlled fluorination using atomic fluorine
Marc Dubois1, Nicolas Batisse
1, Katia Guérin
1, Philippe Thomas
2
1Université Clermont Auvergne, CNRS, Institut de Chimie de Clermont-Ferrand (ICCF) 24
avenue Blaise Pascal, 63178, Aubière, France 2Université des Antilles, Groupe de Technologie des Surfaces et Interfaces, Faculté des
Sciences Exactes et naturelles, 97157, Pointe-à-Pitre, France
Introduction
Among covalent chemistry of carbonaceous nanomaterials (0D carbon blacks, 1D nanotubes,
2D graphene), fluorination is one of the most studied and important ways. Not only is
fluorination a good starting point for further covalent sidewall modification of CNTs
(alkylation, hydroxylation, amino-functionalization, ...) but fluorinated nanocarbons (nanoC)
also exhibit a large range of possible applications themselves. Fluorination allows dispersion
of nanoC in alcoholic solvents and potential applications include electric storage as cathodes
in lithium batteries, in supercapacitor electrodes, sensors, and solid lubricants. Direct
fluorination using pure fluorine gas F2 remains the most useful method to obtain fluorinated
carbon materials thanks to the high reactivity of molecular fluorine. However, this latter
becomes a disadvantage when a F/C fluorine content lower than one is required or when the
starting material exhibits high specific surface area and/or amorphous character.
In this chapter, we focus on an alternative fluorination way using fluorinating agents (FA),
called controlled fluorination. The fluorinating agents such as terbium tetrafluoride TbF4 and
xenon difluoride XeF2 are useful due to their thermal decomposition which produces atomic F
and/or molecular F2. This makes possible to progressively release a definite quantity upon the
fluorination duration and thus to control both the reactivity with fluorine and the fluorine
level. Whatever the dimensionality (0D carbon blacks, 1D nanotubes, 2D nanodiscs) and the
number of walls for nanotubes (SWCNT, MWCNT), a higher homogeneity of the materials
was obtained by this controlled process by comparison with the direct fluorination by fluorine
gas. In other words, fluorinated and non-fluorinated part are homogenously dispersed. That
can be explained by the low kinetic of decomposition of FA which allows a continuous
addition of fluorine to carbon matrix and a more progressive fluorination. The maintaining of
a consequent fraction of residual non-fluorinated nanocarbon allows electrochemical
performances to be enhanced as it could allow an increase of the electrical conductivity and as
a consequence higher available current densities. The tribological properties were also
improved when atomic F• is used instead of F2.
Fluorination with FA is also efficient to prepare carbide derived carbon (CDC) using silicon
carbide as precursor, to modify the surface chemistry of many electrochemical materials such
as Li4Ti5O12 LTO or to change physicalchemical properties (gaz barrier, printability) of
commercial polymers (polyethylene).
1. Release of atomic fluorine : thermodynamic aspects
2. Fluorination of carbon nanotubes: control of the fluorine dispersion
1.1 1D from SWCNTs to carbon nanofibres
XeF2 thermal decomposition results in atomic fluorine F•. With DFT, F• addition to the
nanotube was simulated1; no addition barrier was found with a F• binding energy of 54.88
kcal/mol. As a consequence, fluorine atom addition is spontaneous, and fluorine distribution
on the nanotube surface is simply controlled by the electrostatic repulsion between an
incoming fluorine atom and any fluorine already present on the nanotube surface. F• addition
to SWCNTs is then homogenously distributed. For the case of reaction with F2, catalytic
effect of HF molecules must be considered2. HF molecules are only present on the nanotube
surface in the presence of pre-existing fluorinated regions, and hence will only be able to
catalyze further tube fluorination through F2 addition in these regions. The fluorination
mechanism with F2 tends to aggregate fluorine atoms on the surface of SWCNTs with the
formation of bands of fluorine atoms (Fig. 1a)1,3
.
Solid state NMR was performed to confirm those different distributions of F atoms along the
tubes according to the reactive species (Fig. 1b). In the case of fluorination with XeF2, two
types of C-F bonds coexist with 19
F chemical shift of -163 and -152 ppm. -163 ppm is
significantly lower than that of covalent graphite fluorides, since the nanotubes are only
fluorinated on their external surface, which coupled with local curvature effects prevents
formation of fully tetrahedral sp3 C. Such an effect has been experimentally found for highly
fluorinated flullerenes and derivates, regarding their 19
F chemical shifts4,5
. The residual sp2
character results in a weakening of the overlapping of the hybridized lobes of carbon and the
fluorine atomic orbitals. The -163 ppm value for both samples is explained by this main effect
and represents high surface density fluorination. Only SWCNTs fluorinated with XeF2 show
the second line at -152 ppm. Because fluorine atoms are homogenously dispersed over the
tube surface, C−F bonds are separated by non-fluorinated carbon atoms for compositions
lower than CF0.5. Hyperconjugation may occur, and coupled with mechanical lattice resistance
to formation of fully sp3 C results in a further weakening of the covalence
6. This explains the
19F chemical shift increase from -163 to -152 ppm.
Fluorination of SWCNTs strongly affects the intensity but not the absolute shift of the
resonant Raman radial breathing modes (RBM) peaks (Fig. 1c). The treatment induces a band
gap opening corresponding to a progressive increase of the transition energies. A strong
decrease of the overall intensity of these bands compared to the pristine SWCNTs is
observed1. In the case of fluorination with F2, the Raman spectrum at low fluorine contents is
very similar to that of raw nanotubes with intense modes at around 250 cm-1
. This is attributed
to a non-homogeneous fluorination of the nanotube surfaces by this method. Indeed, if
SWCNTs are not functionalized, or a large part of their surface is not functionalized, their
Raman signal will be similar to the signal of the pristine SWCNTs. Nanotubes located in the
outer part of the bundles may be more fluorinated than in the inner part, who may be less
affected. When SWCNTs are fluorinated with XeF2 the changes in the RBM features at 514.5
nm are progressive in accordance with a homogenous distribution of F atoms along the tubes
but also within the bundles contrary to the process with F2. At higher concentrations, there are
no differences between the two methods because of a large coverage of the nanotube’s surface
by the fluorine atoms.
Fig. 1: a) Structures from the DFT calculations for infinitely repeating (8,8) nanotube length
consisting of alternating bands of pristine nanotube segment (C160) and C2F segment
(C160F80); b) 19
F MAS NMR spectra (at spinning speed of 20 kHz) of the SWCNTs fluorinated
with F2 and XeF2. (*) marks spinning sidebands; c) and d) Comparison of Raman spectra at
514.5 nm between raw SWCNTs, SWCNT treated with XeF2 (F/C = 0.05 and 0.32) and
SWCNTs fluorinated with F2 (F/C = 0.04 and 0.37). RBM massif in raw nanotubes. Arrow
indicates the position of the main RBM massif in raw nanotubes.
When atomic fluorine is used, the fluorine atoms are homogeneously dispersed on the walls of
the nanotubes, whatever their position in the bundle, as shown by NMR and Raman results.
On the contrary, the reaction with F2 probably starts on the defects of SWCNTs and the
fluorination process then proceeds only via HF catalysis neighboring these regions, resulting
in fluorinated domains less homogeneous both in the bundles and along the tubes. Such
comparison evidences the higher diffusion ability within the bundles of atomic fluorine than
F2. The study of the fluorination of carbon nanofibres (CNFs) shows that the diffusion is also
efficient between the tubes. CNFs can be described as MWCNTs with a high number of walls.
Moreover, they are obtained by chemical vapour deposition (CVD) and heat treated at 1800
°C in an argon atmosphere to enhance their crystallinity. Because of this crystalline order,
fluorination must be performed at high temperature as for graphite. The thermal
decomposition of TbF4 was used to release atomic fluorine rather than the one of XeF2
because it occurs at high temperature (in the 400-500°C range). The operating conditions have
been optimized for TbF4 and F2 in order to reach similar fluorine content x in CFx, i.e. F/C
atomic ratio. The fluorine contents x in CFx, after fluorination, were obtained by weight
uptake and 19
F NMR data. The fluorination level increases regularly with the fluorination
Temperature. Amongst the different samples, the highly fluorinated CNF was obtained at 500
°C for the case of TbF4 with a corresponding fluorination level of 0.87–0.917. The fluorine
content were close whatever the fluorination temperature. Such agreement between the two
methods is an indirect proof of both the homogeneity of the fluorinated samples and the
absence of decomposition of some fluorinated parts during the fluorination. Indeed, in the
case of the direct fluorination of CNFs (F2)8, increased reactivity of fluorine gas at high
temperatures (T > 450 °C) with CNFs, leads to a competition between the fluorination and the
decomposition of some fluorinated parts into volatile alkyl fluorides such as CF4, C2F6,...
Such duality results in an arbitrary weight loss and a high discrepancy between F/C content
evaluated by NMR and the one estimated by weight uptake. This discrepancy increased with
the fluorination temperature.
Scanning electron microscopy reveals differences in the morphology according to the
fluorination route (Fig. 2a and b). The raw CNFs consist of a tangle of fibres with quite
narrow diameter distribution, included between 80 and 350 nm. The average diameter (<Ø>)
is estimated equal to 150 nm from TEM observations of various parts of the raw sample7,8
.
The fluorination results in a swelling of the fibres, moderated and uniformly located in the
fibres in the case of the process with TbF4 (atomic fluorine) (480 °C) (Fig. 2a) whereas the
swelling appears larger on the raw fibre tips for CNFs fluorinate with F2 at 480°C (Fig. 2b).
Moreover, a partial exfoliation is also underlined for this later case by the presence of fibres
exhibiting a drastic increase of the diameter and cracks due to the expansion. The amount of
fluorine atoms into the reactor is kinetically controlled using a fluorinating agent such as
TbF4. First, the kinetic of the thermal decomposition of TbF4 into TbF3 could allow a
progressive release of either atomic F or molecular F2 fluorine. Secondly, through this
decomposition, the following equilibrium is established: 2F <-> F2. Atomic F is known to
be more reactive than F2 and we believe that atomic fluorine is the main fluorinating agent
rather than F2. So, atomic F is consumed during the fluorination of carbons and the
equilibrium is displaced towards the formation of atomic F. The fluorination occurs more
progressively, i.e. ‘‘sheet by sheet’’ with low structural defects amounts.
TEM bright field images of CNFs fluorinated at 420 °C with TbF4, shown in Fig. 2, underline
that the layered structure is maintained even for high temperature and high fluorine level
(0.65–0.70). However, in small domains, due to the accommodation of fluorine atoms within
the graphene layers (Fig. 1c and d), the interlayer distance increases from the one of raw
CNFs (0.34 nm, up to the classical value of (CF)n-type graphite fluoride structure (d-spacing
equal to 0.60 nm9). The less ordered layers, which are more spatially separated due to the
accommodation of fluorine atoms, are uniformly dispersed using the fluorination at 480 °C by
TbF4 (Fig. 2d). In the case of the direct reaction with F2, such disordered layers dispersion has
not been observed at 480 °C but some exfoliation occurs. Moreover, for the lower fluorination
temperature, at 420 °C for the direct (F/C = 0.39)8 and fluorination with atomic F (Fig. 2 c
and d) the distorted layers were located near the nanofibre surface8. This TEM study reveals
at the nanoscale the first difference between the two fluorination routes.
TEM underlines also that the nanofibres length decreases at the higher temperatures, i.e. 480
and 500 °C, contrary to the low fluorination temperature (420 °C)7,8
. A breaking of the
nanofibres occurs in addition to their swelling; the average diameter increases from 150 nm
for the raw CNFs to 153, 184 and 225 nm for the fluorinated samples at 420, 480 and 500 °C,
respectively (these values are estimated taking into account at least 40 measurements on TEM
images). TEM images of the CNFs treated with TbF4 underline the change in the structural
order during the accommodation of fluorine atoms by showing the presence of graphitic
layers (Fig. 2c and d). The quantitative analysis of TEM images was performed in reciprocal
space7,8
. Any peak is observed in the two-dimensional power spectral density function (PSD)
function of the fluorinated part in Fig. 2e (curve 2a in Fig. 2). A Bragg peak at about 0.34 nm
in the corresponding PSD curve underlines the well-defined periodicity of the layers (Fig. 2e).
The usual graphene layer periodicity found for the untreated sample graphitic structure is
maintained for fluorination at 420 °C and in small amount at 480 °C. On the other hand, the
PSD functions (Fig. 2 curves 2a and 3) corresponding to the entire TEM image, do not display
an additional broad peak, expected with a maximum at about 1.5–2.0 nm-1
, which is related to
the fluorinated parts although they are shown by TEM bright field images (Fig. 2c and d).
This indicates that, due to the high fluorination level obtained in the experimental conditions,
i.e. (CF)n structural type, the fluorination results in a high local structural defect uniformly
distributed in the whole nanofibre volume. As it does within the SWCNTs bundles, atomic
fluorine may diffuse in the carbon lattice to result in homogenous dispersion of fluorine
atoms. Direct fluorination with a flux of F2 gas does not allow to reach such distribution, F
atoms being concentrated near the surface for low fluorine content; then fluorination
progresses from the surface towards the core8. It is to note that the C-F bonding is the same
whatever the fluorination route, i.e. covalent, as revealed by NMR and FTIR7,8
.
Fig. 2: SEM images of the nanofibres fluorinated with TbF4 (a) and F2 (b) both at 480°C;
TEM images of CNFs treated with TbF4 at 420°C (c) and 480°C (d); (e) Power spectral
density (PSD) functions calculated for the TEM images: pristine carbon nanofibres (1),
fluorinated sample treated at 420 °C (2a and b) and at 480 °C (3). The curves 2a and 2b
correspond, respectively, to the fluorinated part only and to entire image 2d. The curves are
offset vertically for clarity. The dotted line indicates the periodicity of graphitic layers.
At this step it is important to know if the homogenous dispersion of fluorinated parts into the
carbon lattice can be reached whatever the dimensionality of the carbon precursor;
Fluorination of 2D carbon nanodiscs and 0D carbon black has been also investigated.
2.1 2D (nanodiscs) and 0D (carbon blacks)
The carbon nanocones and nanodiscs were produced by pyrolysis of heavy oil using the
Kvaerner carbon black and hydrogen process (CBH)10
. The CBH is an emission-free
industrial process that decomposes hydrocarbons directly into carbon and H2, based on a
specially designed plasma torch, with a plasma temperature above 2000 °C. The solid output
was found to consist of a significant amount of opened carbon nanocones (20 wt.%), as well
as a large number of flat carbon discs (70 wt.%), and the rest being carbon black. Details
about the sample may be found in ref 11
. The sample is denoted CNDs. The fluorine contents
x in CFx, after fluorination, obtained by weight uptake, were 0.70, 0.95, 0.78 and 0.96 for
CNDs fluorinated at 500 and 550°C with TbF4 and 480 and 500°C with F2, respectively. The
resulting samples are called C-500, C-550, D-480 and D-500 (C and D refer to controlled and
direct fluorination). Increase of the reaction temperature to 520 °C with F2 during the direct
fluorination results in partial exfoliation of the sample, which is already visible by the
macroscopic volume expansion and confirmed at the nanoscale by SEM. The volume
expansion due to hyperfluorination and gas evolution of volatile species such as CF4, and
C2F6 results in cracks and swelling on the sheet edges. This observation underlines the
efficient reaction temperature range for the direct fluorination, up to 500 °C. SEM images
(Fig. 3 a and b) underline the maintaining of the geometry for both fluorinations with F2 and
F, whatever the reaction temperature. Nevertheless, the disc and cone edges are more irregular
in the case of 500°C with F2. Moreover, a nanocarbon swelling occurred due to the
accommodation of the fluorine atoms. This swelling differs after the direct and controlled
processes as revealed by atomic force microscopy. AFM was performed in tapping mode.
Topography and error images show a clear difference in the surface morphology (Fig. 3c and
d). The accommodation of the fluorine atoms occurs by a swelling, which is more pronounced
on the edges for the sample treated with F2 (Fig. 3c); the maximum extent of swelling is
observed in the overall perimeter. The edge seems then to be the preferential area for the
direct fluorination. On the contrary, the swelling is homogenous for CNDs treated with TbF4
at 550°C and the accommodation of fluorine atoms results in small cracks homogenously
dispersed on the disc surface. The fluorination progressively changes the structure as a
function of the fluorination temperature (TF). The XRD patterns of the fluorinated CNDs are
compared in Fig. 3e. The pristine CND pattern is similar to graphite. The main peaks
correspond to the graphite structure (002), (100), (101) and (004) diffraction lines for 2h
values of 26.4° (interlayer distance d = 0.337 nm), 42.9° (0.211 nm), 44.8° (0.202 nm) and
54.4° (0.169 nm). CNDs exhibit a high structural organization thanks to the post treatment at
2700 °C (coherence length along the c axis, Lc = 39 and 2 nm for post-treated and raw CND,
respectively). For CNDs treated with TbF4 a new phase appears with corresponding peaks at
2h values centred at 14.8° and 40.9° attributed to the (001) and (100) peaks of a
fluorographite matrix in an hexagonal system. The corresponding interlayer spacing of 0.60
nm is characteristic of (CF)n-type structure. On the contrary, an intermediate phase is deduced
for D-480 and D-500. Because of the coexistence of (C2F)n and (CF)n phases, the value d
equal to 0.68 nm is measured instead of 0.81–0.82 nm and 0.6 nm for (C2F)n and (CF)n
structural types, respectively. Moreover, because of this coexistence of phases, the full width
at half maximum is larger for D-480 and D-500 ( = 3.7°) than for C-500 and C-550 ( =
2.7°). The reactive species, atomic or molecular fluorine, acts also on the structural properties,
C-F bonding being similar (covalent). Atomic fluorine at high temperature allows the (CF)n
type to be reached whatever the F/C ratio.
Fig. 3: SEM (a) images of the CNDs plus the highest fluorine content, i.e. C-550 (F/C
= 0.95) and D-480 (F/C = 0.96); AFM images of D-500 (a), and C-500; XRD
diagrams of C-500, C-550, D-480 and D-500.
Nano-sized graphitic carbon black materials (GCBs) have been developed by Superior
Graphite, Chicago, Illinois and are produced by hydrocarbons pyrolysis. This commercial
product is synthesized from carbon blacks by a high temperature graphitization treatment
between 1500 and 3000 °C. This treatment results in the almost total elimination of the
impurities (volatile species, sulfur, ash) present in the carbon black precursor and the
graphitization of the carbon nanoparticles. Taking into account the particles size with an
averaged value of 40 nm, the coherence length along the c-axis (Lc) is limited to 7 nm
although the graphitization treatment. The commercial products differ from other types of
carbon blacks12
. Two types of fluorinated GCBs were studied for comparison. The first one
was obtained by direct fluorination under pure fluorine gas, for temperatures ranging between
380 and 440 °C (The duration of each experiment was of 3 h). The same conclusion about the
structural phase than for CNDs can be extract from XRD and electron diffraction. The
interlayer spacing indicate that the structure is (CF)n only, with atomic fluorine, or a mixture
of (CF)n or (C2F)n with F2. TEM reveals the morphology and the structure of nanoparticles
such as fluorinated GCBs and also to investigate the mechanisms of fluorination with F2 and
TbF4. Numerous TEM images were recorded and the ones presented here are representative of
the whole studied samples. TEM images recorded on initial GCBs and on the different
fluorinated derivatives obtained with direct (F2) fluorination are presented in Fig. 4. Images
collected on initial GCB (Fig. 4a) clearly point out their graphitic structure with measured
inter reticular distances of 0.34 nm corresponding to graphene interlayer distances in graphite
(see electron diffraction pattern on Fig. 4b). GCBs appear as faceted nanoparticles resulting
from their structure constituted of well ordered nano-domains joined by faulted regions of
very small spatial extension needed to accommodate the quasi spherical shape of the
nanoparticles. The faulted regions present also a high curvature of the carbon layers subjected
to be more reactive with F2 than the well organized and flat domains. As for fullerenes and
derivatives (nanotubes), the curvature results in a few percentage of sp3 hybridization in
addition to sp2 one. That decreases the stability of the carbon lattice and the reactivity toward
fluorine increases13
. As an example, C60 fullerenes and single-walled nanotubes may be
fluorinated event at room temperature. Once opened during the fluorination process, they may
play a role of access zones to fluorine atoms. Once fluorinated using the F2 method, the first
images recorded at low magnification (Fig. 4c, e, g) present swelled materials due to the
inclusion of fluorine atoms. Moreover, the first sheets on the image of Fig. 4c exhibits a
structural evolution caused by the fluorination14
. The sheets are corrugated and have an
interlayer distance of about 0.48 nm, which is characteristic of fluorocarbon stacking. When
the fluorination level increases, fluorinated areas progress toward the core of the material. The
highly fluorinated angular portions are opened when the fluorination level increases, creating
by this way an opening for the insertion of fluorine atoms (Fig. 4g). The accommodation of
fluorine atoms on the periphery of the particles leads to the destructuration of the
fluorocarbon sheets (Fig. 4g). In the case of the controlled fluorination method, the diffusion
of the atomic fluorine differs. Indeed, for similar F/C (≈0.3) the extension of the fluorinated
region (corrugated layers with enhanced interlayer distances) is greater for compounds
obtained with controlled fluorination (Fig. 4d and f) than with direct fluorination (Fig. 4c and
e)14
. For higher fluorination levels, fluorinated particles obtained with controlled method do
not exhibit significant structural differences with those obtained with direct method. The
fluorinated parts are homogeneously distributed on the whole volume of the particles (Fig.
5h). Contrarily to the direct fluorination using fluorine gas, the controlled process is
monitored by the kinetic of decomposition of TbF4 fluorinating agent, which allows a
continuous addition of fluorine to carbon matrix and a more progressive fluorination without
damaging the carbonaceous lattice. The diffusion of fluorine radicals more deeply in the
nanoparticles reduces the accumulation of fluorine in the outer shell layers preserving them
from damaging up to high fluorination rate (F/C ≈ 0.83).
Fig. 4 : TEM images and electron diffraction pattern of GCBs, raw (a, b), fluorinated by F2 (c,
e, g) and TbF4 (d, f, h)14
.
The fluorination route acts on the thermal stability. For a similar fluorination level, thermal
stability of GCBs fluorinated with TbF4 is greater than the sample treated with F2. Indeed,
with a high F/C (around 0.8), GCBs fluorinated by F2 are stable up to 500 °C; on the contrary,
when they are functionalized using atomic fluroine, the material is stable up to 565 °C. These
differences in terms of thermal stability can be explained using TEM analyses discussed
previously. Indeed, a high degree of fluorination obtained using a direct fluorination leads, as
shown in the images in Fig. 4g, to the formation of fragile particles, partially divided, or
delamination of the external perfluorinated layers. In the case of a fluorination controlled with
TbF4, the mechanism involving more easy diffusive F species in the carbon structure leads to
more homogeneous fluorinated materials and results in the formation of stable fluorinated
particles, which are not or slightly damaged (Fig. 4h). Due to their greater density of
nanometric scale defaults in their structure, the GCB fluorinated by F2 present, when they are
heated at high temperature, a higher decomposition kinetic than GCB fluorinated by the
controlled process, probably due to the easier diffusion of gaseous fluorinated species (CF4
and C2F6) and oxygen, through the highly faulted regions.
The fluorination route either with atomic or molecular fluorine results in different fluorine
atom distributions within the carbon lattice, different structure and thermal stability. The
applicative properties may be tailored or enhanced thanks to those facts.
3. Enhancement of the applicative properties
3.1. Power density in primary lithium battery with fluorinated nanofibers as
cathode
3.3 Tribological properties of fluorinated carbon blacks
The tribological properties of the compounds were evaluated using a ball-on-plane tribometer
consisting of an AISI 52100 steel ball describing an alternative motion on a static AISI 52100
steel plane on which the tested material was deposited. A normal load Fn of 10 N was applied,
leading to a contact diameter of 140 m (Hertz’ s theory) and a mean contact pressure of 0.65
GPa. The sliding speed was 6 mm.s-1
. The measurement of the lateral force Ft allowed us to
calculate the friction coefficient, expressed as = Ft/Fn.
The balls were used as delivered whereas the surface of the planes were abraded in order to
generate multidirectional scratches to improve the adherence of powdery materials. After
balls and planes cleaning in ultrasonic baths in acetone and ethanol, few milligrams of GCBs
were deposited on the plane surface. Then a drop of pentane (boiling point 36°C) was added
after ball on plane contact in order to improve the particle feeding of the sliding contact and
accelerate the establishment of the tribofilm.
The intrinsic tribologic properties of the tested materials in air (relative humidity: 50 5%)
were obtained after total pentane evaporation (occuring after few cycles). One friction cycle
corresponds to one reciprocal travel of the ball on the plane.
The friction properties of three fluorinated GCBs obtained from direct fluorination and three
compounds resulting from controlled fluorination were evaluated. The corresponding fluorine
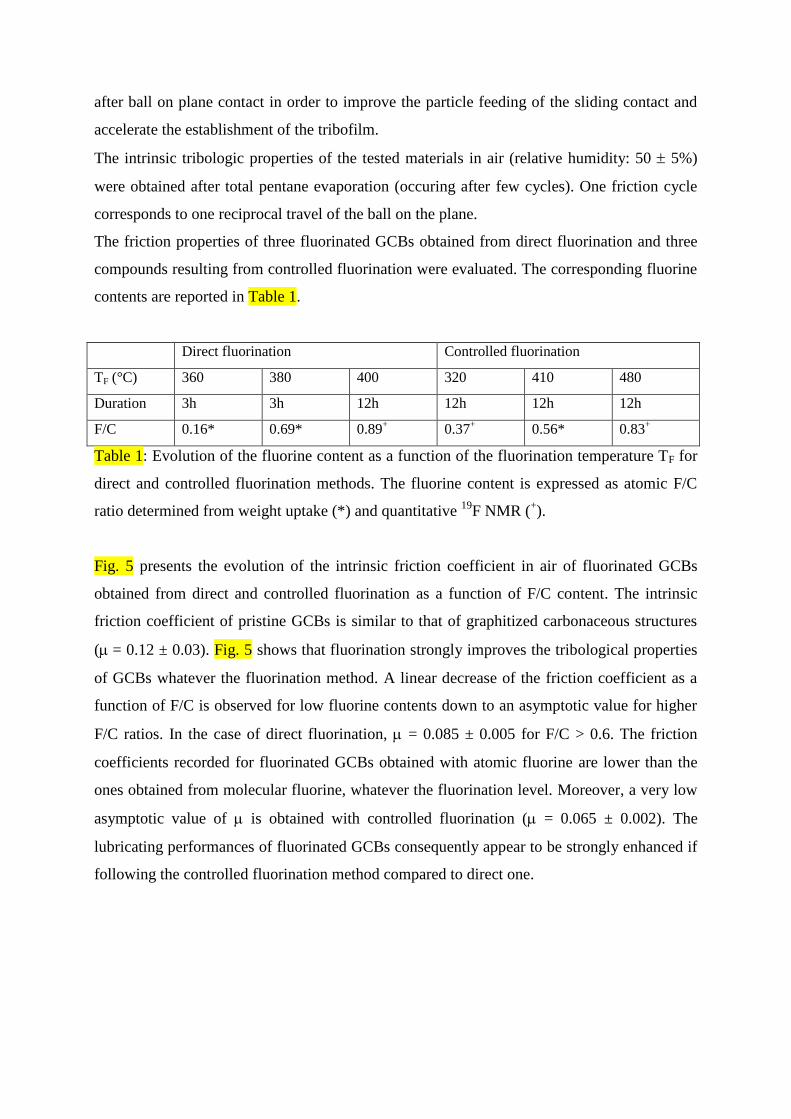
contents are reported in Table 1.
Direct fluorination Controlled fluorination
TF (°C) 360 380 400 320 410 480
Duration 3h 3h 12h 12h 12h 12h
F/C 0.16* 0.69* 0.89+ 0.37
+ 0.56* 0.83
+
Table 1: Evolution of the fluorine content as a function of the fluorination temperature TF for
direct and controlled fluorination methods. The fluorine content is expressed as atomic F/C
ratio determined from weight uptake (*) and quantitative 19
F NMR (+).
Fig. 5 presents the evolution of the intrinsic friction coefficient in air of fluorinated GCBs
obtained from direct and controlled fluorination as a function of F/C content. The intrinsic
friction coefficient of pristine GCBs is similar to that of graphitized carbonaceous structures
(= 0.12 ± 0.03). Fig. 5 shows that fluorination strongly improves the tribological properties
of GCBs whatever the fluorination method. A linear decrease of the friction coefficient as a
function of F/C is observed for low fluorine contents down to an asymptotic value for higher
F/C ratios. In the case of direct fluorination, = 0.085 ± 0.005 for F/C > 0.6. The friction
coefficients recorded for fluorinated GCBs obtained with atomic fluorine are lower than the
ones obtained from molecular fluorine, whatever the fluorination level. Moreover, a very low
asymptotic value of is obtained with controlled fluorination ( = 0.065 ± 0.002). The
lubricating performances of fluorinated GCBs consequently appear to be strongly enhanced if
following the controlled fluorination method compared to direct one.
Fig. 5: Evolution of intrinsic friction coefficient in air (recorded at 3 cycles after pentane
evaporation) as a function of F/C ratio for fluorinated GCBs obtained from direct and
controlled fluorination.
As already described in the case of other carbon compounds15
, the friction reduction
mechanisms are attributed to surface effects, i.e. to interparticles interactions. Indeed,
fluorinated particles present lower surface energy than pristine ones leading to lower friction
coefficient values. During the fluorination process, the thickening of the fluorinated region
(see Fig. 4) lowers the surface energy of GCBs resulting in a decrease of the friction
coefficient. When the fluorinated region is thick enough to stabilize the surface energy of
fluorinated GCBs, the interparticles interactions do not evolve any more, leading to a
stabilization of the friction coefficient. A fluorinated shell thickness, determined from TEM
images, close to 10 nm is needed to stabilize the friction coefficient14
.
The improvement of the tribological behavior of fluorinated GCBs observed with controlled
fluorination can be explained considering TEM characterization of the compounds. For
similar F/C contents, the extension of the fluorinated layers is greater for compounds obtained
with controlled fluorination (see Fig. 4) compared to direct fluorination. For low fluorine
contents, the interparticles interactions are consequently lowered with controlled fluorination,
resulting in lower friction coefficients. In the case of high fluorination levels, the friction
0
0.05
0.10
0.15
0.20
0 0.20 0.40 0.60 0.80 1
Direct fluorination
Controlled fluorination
Fri
ctio
n c
oef
fici
ent
F/C ratio
coefficient values are higher with direct fluorination than with controlled fluorination. This is
probably due to the fluorination process: direct fluorination induces damaging of the particles
contrarily to controlled fluorination for which the initial spherical shape of the particles is
maintained.
In order to evaluate the influence of the friction process on the tribological properties of
fluorinated GCBs obtained from controlled fluorination, long-term friction experiments were
performed. Fig. 6 shows the evolution of the friction coefficient, as a function of fluorination
content, recorded after 1000 cycles of friction, in comparison with the intrinsic ones.
Fig. 6: Evolution of the friction coefficient recorded at 3 cycles (intrinsic friction coefficient)
and at 1000 cycles after pentane evaporation as a function of F/C ratio for fluorinated GCBs
obtained from controlled fluorination.
Fig. 6 shows a decrease of the friction coefficient during the friction process down to a value
close to 0.06 for high fluorine contents. During the friction process, particles are broken and
partially defluorinated and the structure of the tribofilm, composed of fluorinated carbon
phases dispersed in a graphitic matrix, is established after 200 cycles15
. If surface effects are
involved in the friction reduction mechanisms at the beginning of the friction tests, the bulk
0
0.05
0.10
0.15
0.20
0 0.20 0.40 0.60 0.80 1
Intrinsic1000 cycles
Fri
ctio
n c
oef
fici
ent
F/C ratio
properties of the tribofilms seem to ensure the good lubricating performances of fluorinated
GCBs, obtained from controlled fluorination, for long-term experiments.
Fluorinated GCBs obtained from controlled fluorination appear as interesting candidates to be
used as new friction reduction nano-additives for lubricants. In addition to good intrinsic
properties, the size and morphology of the particles are well adapted for a good feeding of the
sliding interface and the possibility to obtain stable dispersions in gel or liquid lubricants.
4. A general route efficient for…
4.1 for polymers
XeF2 is easily decomposed on the polymer surface even at room temperature. Nevertheless,
the temperature was increased in order to enhance its vapour pressure and the reactions take
place. XeF2 and polymer films were deposited in the reactor in a glove box under argon
atmosphere. Then, a closed reactor under Ar was stored at a constant temperature of 60 °C for
48 h. The direct fluorination using molecular fluorine F2 was carried out at room temperature.
Open reactor with continuous F2 flow at ambient pressure was used. In a typical experiment,
LDPE samples were placed inside reaction Nickel vessel in an alumina cylindrical support.
The sample is denoted F_LDPE_DF (DF for direct fluorination, when a number is indicated it
corresponds to the treatment duration). The PE treated with XeF2 is called F_LDPE_XeF2.
The two fluorination routes exhibited different reactivity, the processes being clearly different
due to the use of different fluorine reactant, molecular (F2) and atomic (F). As for
carbonaceous nanomaterials, the reactivity directly depended on the diffusion kinetics of the
fluorine species on the surface or in the treated polymer bulk. For the sample treated at direct
fluorination conditions (F2), an upper fluorinated layer consisted mainly of specific
fluorinated groups like -CF2-. Some polar groups have been also detected. Several sources
could explain this fact during the treatment process or after the reaction during exposure to
air. Some C-H and C-C bonds could be broken during the fluorination processes, forming
dangling bonds, which could react either with the oxygen and moisture from air or O2
admixtures in F2 or O2 and H2O absorbed on the surface and in the bulk. For the process
performed with XeF2, where atomic F is the main fluorinating species, specific groups (-
CHF-) were detected not only on the polymer surface but also in the bulk. The final CHF/CF2
ratio depended on the fluorination route. F resulted in a prevailing formation of -CHF-
groups in bulk whereas F2 formed mainly -CF2- groups. The relative content of those groups
were extracted from both infrared spectroscopy and solid state NMR16
. Fluorinated polymers
surface composition and the CHF/CF2 ratio have been also derived from the C1s core peaks
represented in Fig. 5a. The sample surface was oxygenated and its content depended on the
fluorination route nature. From the quantitative analyses, 14% of oxygen were detected for the
direct fluorination with F2 routes and XeF2 routes. We have to note that the pristine polymer
contained 3% of oxygen atom due to the oxidation processes during fabrication and storage.
The binding energy was clearly shifted towards the high values after fluorination process
(+1.0 eV). Two components have been identified, one located at 532.5 eV was assigned to
C=O environments and another at 533.8 eV was attributed to oxygen atoms C-O-C
environment. Pristine and fluorinated LDPE C1s core peaks exhibited five to six components
depending on the fluorine route. In agreement with literature17
(see tables in Fig. 5). For the
case of dynamic fluorination process, an important increase of the carbon component at 290.5
eV assigned to the CF-CF2 environment was recognized, with the fluorination time and with a
smaller input of the component at 292.8 eV attributed to CF2-CF2 environment. For the
samples fluorinated with XeF2, most of the groups detected were attributed mainly to –CHF-.
It is important to keep in mind that this analysis was performed on the utmost surface layer
thinner than 5 nm.
Those two kinds of processes have been revealed two different mechanisms which could be
devoted to different macroscopic properties, both on surface or in the bulk such as tribological
properties or gas permeability.
Polar (Polar) and dispersive (Dispersive) components as well as a total surface energy allow the
printability to be quantified. Water and formamide were used to measure total surface energy
and polar and dispersion components in the frame of conventional Owens–Wendt methods.
Fig. 5b, c and d depict the contact angles of the two liquids measured just after experiments
on the fluorinated surface treated in dynamic conditions (flux of F2) and with XeF2. It was
recognized that the total surface energy and its polar and dispersive components depended
mainly on the type of fluorination routes18
. These three parameters have been markedly
increased in the case of the samples fluorinated in dynamic conditions (F_LDPE_DF).
Usually, surface tended to become more hydrophilic after fluorination treatment. The
dispersive component increased from 17.3 (Pristine LDPE) to 41.7 mN/m (F_LDPE_DF020,
20 means 20 min). It is well known that the surface energy of fluorinated polymers is
increased after direct fluorination processes using molecular fluorine as a reactant, also
adhesion and printability properties should be enhanced19
. First, the polar component have
been increased due to the formation of specific polar groups such as -(C=O)OH, -CHF- and -
FC=O, on the polymer surface in dynamic conditions. Oxygen played also a key role on this
increase; several sources could be described during the process or after the reaction during the
exposure to air. Some C-H and C-C bonds could be broken during the fluorination processes,
forming dangling bonds, which reacted with oxygen and moisture from air. Oxygen
containing bonds could be formed in the course of fluorination due to a technologic admixture
of oxygen in used fluorine or O2 and H2O absorbed on a polymer surface and reactor walls.
Also the surface roughness was increased under fluorination which also resulted in a surface
energy increase. For the process using the specific fluorinating agent XeF2, polar component
has been increased and exhibited that the surface has been covered with different polar groups
defined by the previous analyses. Finally, it is also important to note that the fluorination
increased the roughness of the polymer surface. On the contrary, the gaseous flux resulted in
an excess of F2 gas at the surface resulted in higher density of dangling bonds, which react
with oxygen, and higher roughness due to the hyperfluorination and possible polymer chains
scission20
. Influence of storage duration on the surface parameters was also studied for
F_LDPE_DF020 and F_LDPE_XeF2 (Fig. 5). The surface of the sample treated in dynamic
conditions and with XeF2 exhibited the tendency to become more hydrophilic for a defined
period (≈10 days). This behaviour indicated that on optimum time could be followed in order
to identify the maximum printability.
Fig. 5: (a) C1s core XPS spectra of pristine and fluorinated LDPE (F2 for 1, 5, 20 and 60 min
and XeF2); Evolution of the polar (b), dispersive (c) components and total surface energy (d)
vs storage duration of fluorinated LDPE treated in F2 dynamic conditions () and with XeF2
().
4.2 Synthesis of fluorinated monolayer graphene
Absence of the gap in the band-structure of graphene results in significant limitation in its use
in electronics. One direction to overcome this drawback is functionalization of graphene with
suitable elements, such a s hydrogen and fluorine. A planar crystal structure is then obtained,
with bonds between the sp2 carbon atoms, into a three-dimensional structure with sp
3 bonding
between them. Theoretical predictions show that hydrogen and fluorine are good candidates to
play such a role; band gaps of 3.8 eV and 4.2 eV is expected for 100% functionalization,
respectively21
. Nowadays, three types of synthesis methods are mainly employed to obtain
fluorinated graphene; all require mild conditions as follows: i) Fluorographene or fluorinated
graphene have been synthesized by exposing graphene in XeF2 or diluted F2 atmosphere22
.
Even if this method can prepare high-quality fluorinated graphene, the higher cost and the
needed control of the reaction do not permit the large-scale production of this material. ii)
Very recently, fluorinated graphene has been prepared by fluorination of graphene oxide with
fluorhydric acid HF23
20 or F224
. However, FG sheets obtained by this approach show an
irregular atomic arrangement compared to the theoretical crystal structure of fluorographene.
The total substitution of oxygen atoms by fluorine ones is difficult and the resulting samples
appear as graphene oxifluoride rather than fluorographene. It is clear that all aforementioned
methods have their respective inadequacies; iii) Exfoliation of (highly) fluorinated graphite is
also efficient. Liquid-phase exfoliation methods have also been carried out in organic solvents
such as chloroform25
or N-methyl-2-pyrrolidone26
. This method possesses two main
drawbacks: the solvent used is often toxic, and the process needs a considerable period of
sonication to be efficient. In addition, some studies concerning the exfoliation using ionic
liquids as an intercalated species under ambient conditions was utilized to obtain fluorinated
graphene27
, but the problem lies in the difficulty to eliminate efficiently the traces of residual
solvent. Mechanical exfoliation from the fluorinated graphite may be performed onto
conventional Si/SiO2 substrates. For this way, the distribution of fluorine atoms in the carbon
lattice is of primary importance. Homogenous dispersion favors the mechanical exfoliation.
Fully fluorinated highly oriented pyrolytic graphites (CF)n were prepared by fluorination with
F2 at 530 and 600°C as a starting materials for exfoliation. On the other hand, flakes of natural
graphite was treated with XeF2 (120 °C for 48 h). The resulting F/C ratios were 0.86, 1 and
0.28 (and 0.24), respectively. After mechanical exfoliation, AFM evidences multilayers with
height of 10 nm for CF1 and 0.86, 6.1 nm for CF0.28. On the contrary, monolayer was obtained
when XeF2 was used as fluorinating agent. To obtain more information on the structure of the
exfoliated samples, Raman spectra were measured (Fig. 6a). In addition to the analysis of D/G
ratio in relation the presence of defects and residual fluorine atoms on the surface, both
position and shape of the 2D band were analyzed to evidence the presence of graphene layers
in the exfoliated sample and their stacking. Both the presence of fluorine atoms and the
increase of the amount of defects formed during the mechanical exfoliation contribute to the
high intensity of the D-band. D’ band, characteristic of few layer graphene sheets, appeared as
a shoulder of the G band28
. Concerning the 2D band, it may be a direct indicator for a
graphene-like sheets with few layers29
. Fit of 2D peak by a single Lorentzian function (fwhm
30-45 cm-1
) underlines monolayer only for the sample prepared with XeF230
. The homogenous
dispersion of the F atoms obtained with atomic fluorine plays a key role.
Fig. 6: Raman spectra of raw and exfoliated graphite fluoride prepared with XeF2, (a) and
exfoliated samples synthesized with F2 (b)
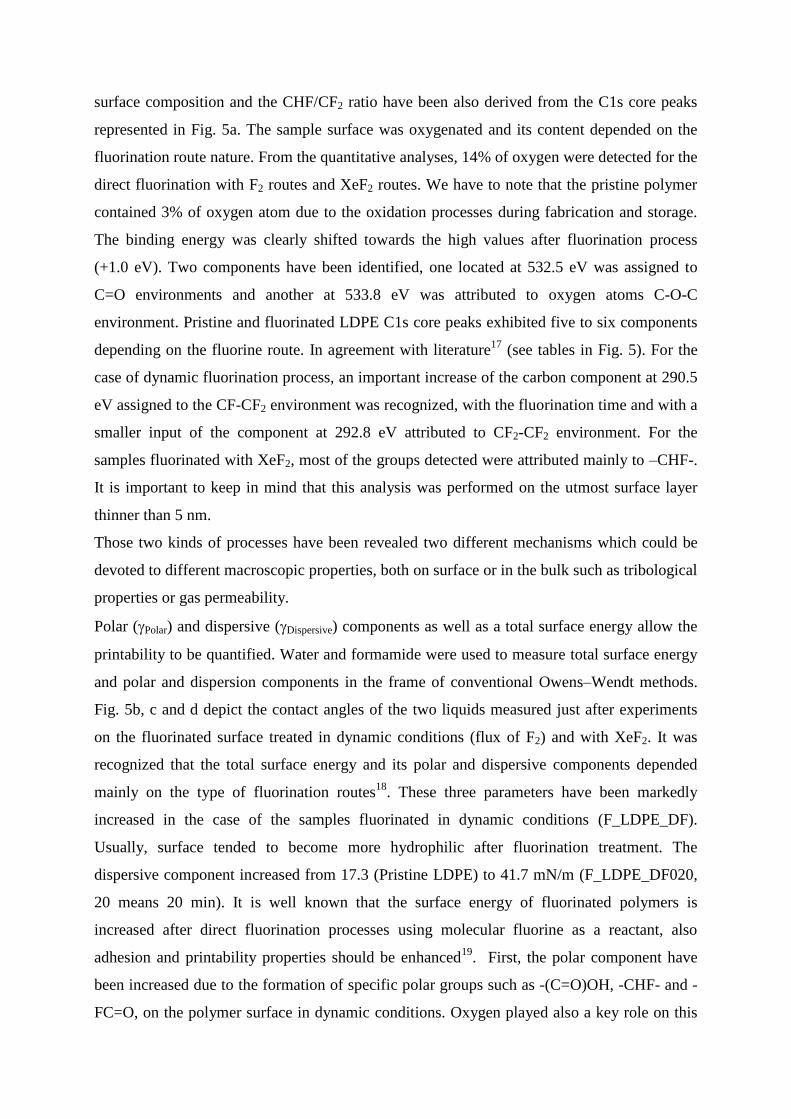
4.3 Synthesis of carbide derived carbon (CDC)
Unusual thin films with bimodal dispersion of layers, i.e. both SiC and carbide derived carbon
CDC-SiC, can be prepared using XeF2 decomposition. Atomic fluorine reacts preferentially
with silicon atoms and is evolved to the gas phase. FTIR spectra of samples fluorinated by
XeF2 (Fig. 7f) indicate that only carbon vibrations appear whatever the SiC/XeF2 ratio. The
two bands at 1450 and 1620 cm-1
are assigned to sp2 C-C and C=C, respectively
31. No
carbon-fluorine bonds are formed contrary to fluorination with fluorine gas although the
synthesis temperatures are approximately the same (120-130°C). Moreover, partial etching is
possible when SiC/XeF2 ratio is controlled; a SiC/CDC composite can be then prepared. For
higher molar ratio, silicon is totally etched and higher carbon level is obtained. Such a way
allows the fluorination to be controlled contrary to the direct process using molecular fluorine.
Moreover, the release of SiF4 allows a progressive cleaning of the thin films surface and this
species is easily removed from the surface. The formed carbons rearrange themselves to form
a real nanostructured carbon film, which is composed of graphite nanocrystallites (see SEM
image in figure 7b and c). On the contrary, after fluorination with F2, an absorption band
appears at 1180 cm-1
in addition to the ones at 1450 and 1620 cm-1
. The new band is attributed
to covalent carbon fluorine bonds such as in covalent graphite fluorides32
. Whatever the
fluorination method the fluorination mechanism is similar with XeF2 and F2 as evidenced by
SEM images (Fig. 7); silicon atoms are extracted from the amorphous silicon carbide matrix
which has a columnar-like structure. This results in a formation of a new thin film where
carbonaceous columns represent a matrix surrounded with porous columns (Fig. 7). The
porous columns are about 20 nm in diameter and allows the diffusion of both fluorine and
silicon fluoride formed during the reaction. The high reactivity and excess of molecular
fluorine used for direct fluorination lead to a reorganization of the porous structure which
destroys the carbonaceous matrix and provokes some wrenches and folds in the thin films
(Fig. 7d and e). By treatment with XeF2, the reorganisation of the porous structure is avoided
and CDC thin film surface is homogeneous. So, fluorination with atomic can be used for the
synthesis of carbon thin films on carbide surfaces at lower temperatures than for the case of
chlorination (the conventional method), i.e. 30-130°C. For thermodynamic simulations made
for the SiC/Cl2 system33
, the thermodynamic probability of the carbon formation increases
with the reaction temperature. If one mole of silicon carbide reacts with more than two moles
of chlorine, a temperature as high as 900°C is required.
Fig. 7: SEM images of SiC carbide before fluorination (a), after fluorination under
decomposition of XeF2 (b,c) and after fluorination under F2, (d,e); FTIR spectra of SiC
carbide before fluorination, after fluorination with F2 and XeF2 (f).
4.4 Electrochemical materials such as Li4Ti5O12
5. Conclusion
1 . hang, . onnet, Dubois, C. . wels, . u rin, E. Petit,
J.-Y. Mevellec, L. Vidal, D. A. Ivanov, A. Hamwi, Comparative Study of SWCNT
Fluorination by Atomic and Molecular Fluorine Chem. ater. 2012, 24, 1744−1751 2 Osuna, S.; Torrent-Sucarrat, M.; Sola, M.; Geerlings, P.; Ewels, C. P.; Van Lier, G. J. Phys.
Chem. C 2010, 114, 3340.
3 (a) Van Lier, G.; Ewels, C. P.; Zuliani, F.; De Vita, A.; Charlier, J.-C. J. Phys. Chem. B
2005, 109, 6153 ; (b) Kelly, K. F.; Chiang, I. W.; Mickelson, E. T.; Hauge, R. H.; Margrave,
J. L.; Wang, X.; Scuseria, G. E.; Radloff, C.; Halas, N. J. Chem. Phys. Lett. 1999, 313, 445. 4 Boltalina, O. V. J. Fluorine Chem. 2000, 101, 273.
7 W Zhang, Katia Guérin, M. Dubois, Z. El Fawal, D. A. Ivanov, L. Vidal, A. Hamwi Carbon
nanofibres fluorinated using TbF4 as fluorinating agent. Part I: Structural properties, Carbon
46 (2008) 1010 –1016 8 Chamssedine F, Dubois M, Guérin K, Giraudet J, Masin F, Ivanov DA, et al. Reactivity of
carbon nanofibres with fluorine gas. Chem Mater 2007;19:161–72. 9 Nakajima T, Watanabe N. Graphite fluorides and carbon–fluorine compounds. Boston: CRC