14
Chapter 13 Chapter 13 - Managing for - Managing for Shareholder Value Shareholder Value 2005, Pearson Prentice Hall
| Date post: | 14-Jul-2015 |
| Category: |
Business |
| Upload: | institute-of-cost-and-management-accountant-pakistan |
| View: | 249 times |
| Download: | 0 times |
Chapter 13Chapter 13 - Managing for - Managing for Shareholder ValueShareholder Value
2005, Pearson Prentice Hall
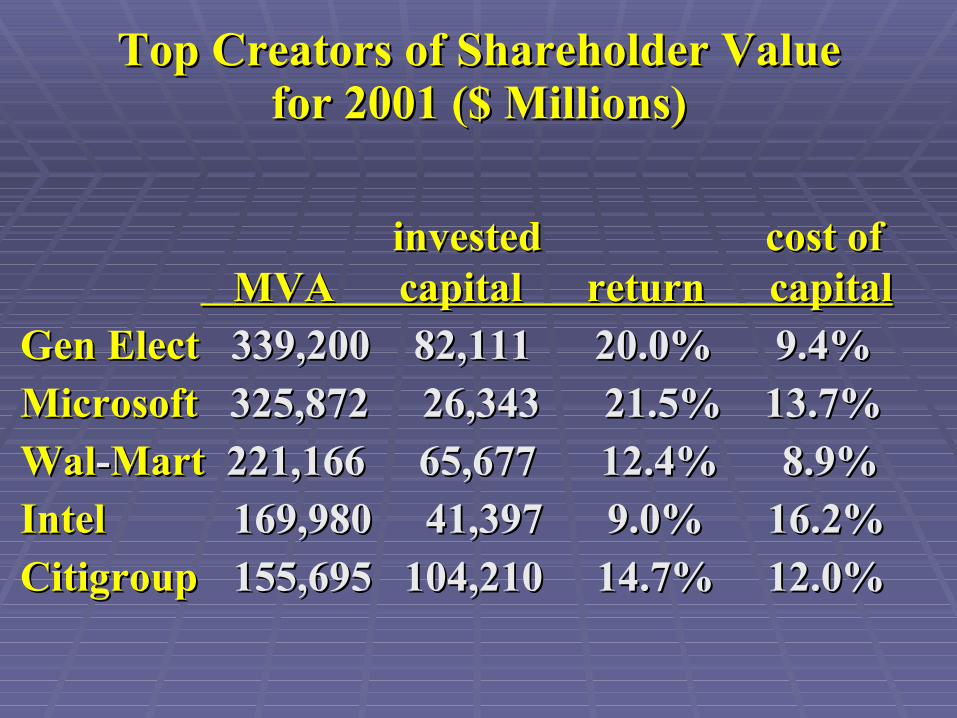
Top Creators of Shareholder ValueTop Creators of Shareholder Valuefor 2001 ($ Millions)for 2001 ($ Millions)
invested invested cost of cost of MVA capital return capitalMVA capital return capital
GenGen ElectElect 339,200 339,200 82,111 82,111 20.0% 20.0% 9.4%9.4%
MicrosoftMicrosoft 325,872 26,343 21.5% 13.7% 325,872 26,343 21.5% 13.7%
WalWal--MartMart 221,166 65,677 12.4% 8.9% 221,166 65,677 12.4% 8.9%
IntelIntel 169,980 41,397 9.0% 16.2% 169,980 41,397 9.0% 16.2%
CitigroupCitigroup 155,695 104,210 14.7% 12.0% 155,695 104,210 14.7% 12.0%
Market Value AddedMarket Value Added
MVAMVA = Firm Value - Invested Capital = Firm Value - Invested Capital
FirmFirm valuevalue = market value of the firm’s = market value of the firm’s outstanding debt and equity securities.outstanding debt and equity securities.
InvestedInvested CapitalCapital = the sum total of the = the sum total of the funds that have been invested in the firm.funds that have been invested in the firm.
Value CreationValue Creation
The combination of The combination of opportunityopportunity and and executionexecution..
Opportunities must be recognized.Opportunities must be recognized.
Employees must be ready, willing, and able Employees must be ready, willing, and able to take advantage of the opportunities.to take advantage of the opportunities.
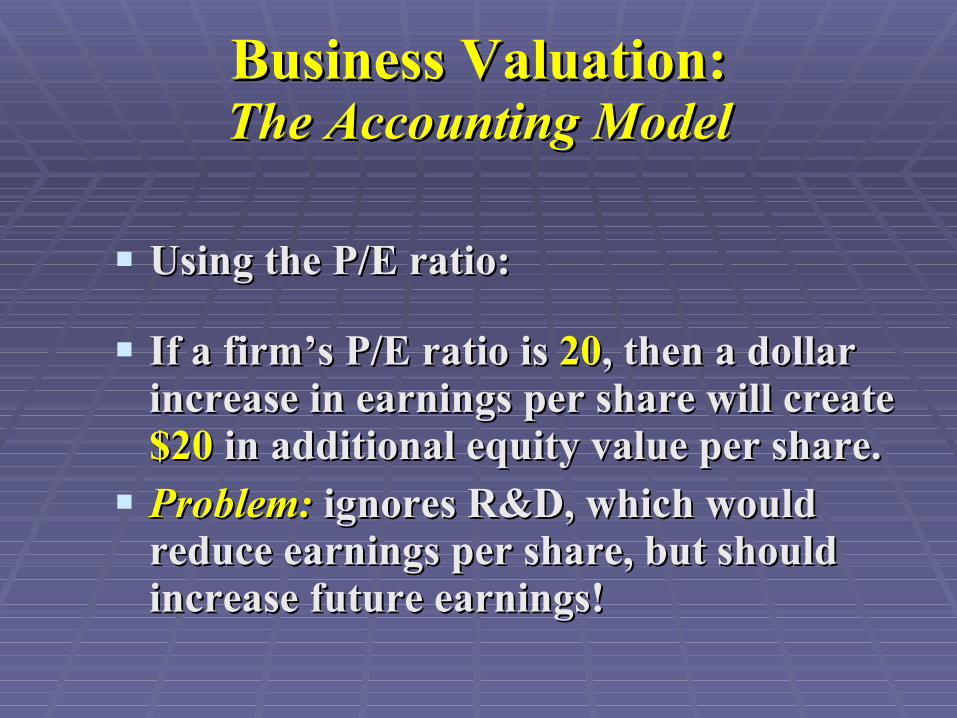
Business Valuation:Business Valuation:The Accounting ModelThe Accounting Model
Using the P/E ratio:Using the P/E ratio:
If a firm’s P/E ratio is If a firm’s P/E ratio is 2020, then a dollar , then a dollar increase in earnings per share will create increase in earnings per share will create $20$20 in additional equity value per share. in additional equity value per share.
Problem:Problem: ignores R&D, which would ignores R&D, which would reduce earnings per share, but should reduce earnings per share, but should increase future earnings!increase future earnings!
Business Valuation:Business Valuation:Free Cash Flow Valuation ModelFree Cash Flow Valuation Model
Value = the PV of the firm’s projected free cash Value = the PV of the firm’s projected free cash flows for all future years.flows for all future years.
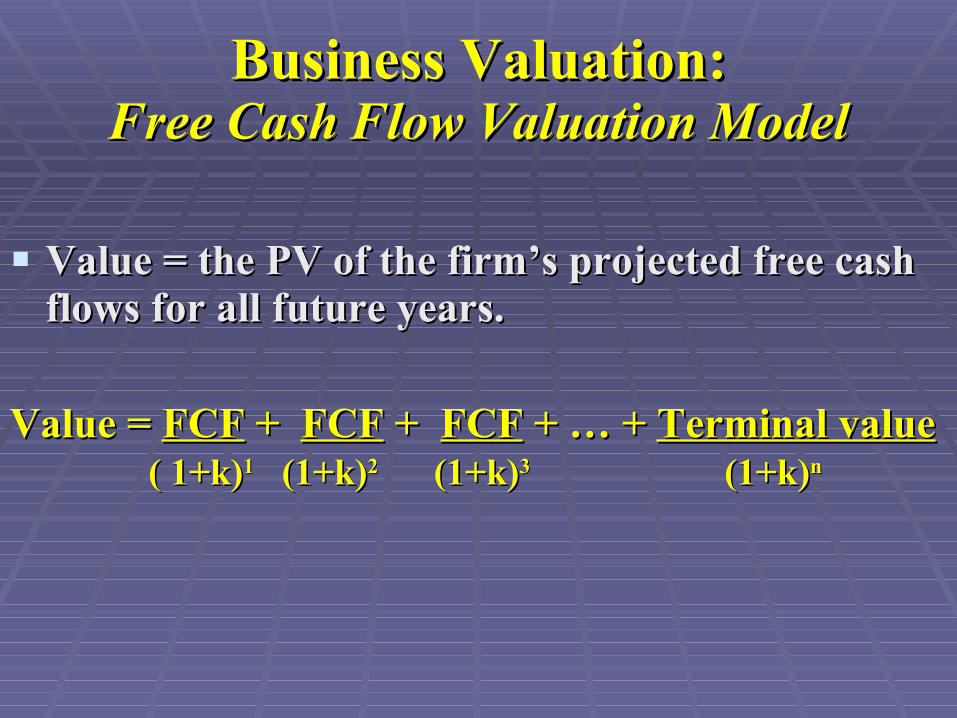
Business Valuation:Business Valuation:Free Cash Flow Valuation ModelFree Cash Flow Valuation Model
Value = the PV of the firm’s projected free cash Value = the PV of the firm’s projected free cash flows for all future years.flows for all future years.
Value = Value = FCFFCF + + FCFFCF + + FCFFCF + … + + … + Terminal valueTerminal value ( 1+k)( 1+k)11 (1+k) (1+k)22 (1+k) (1+k)33 (1+k) (1+k)nn
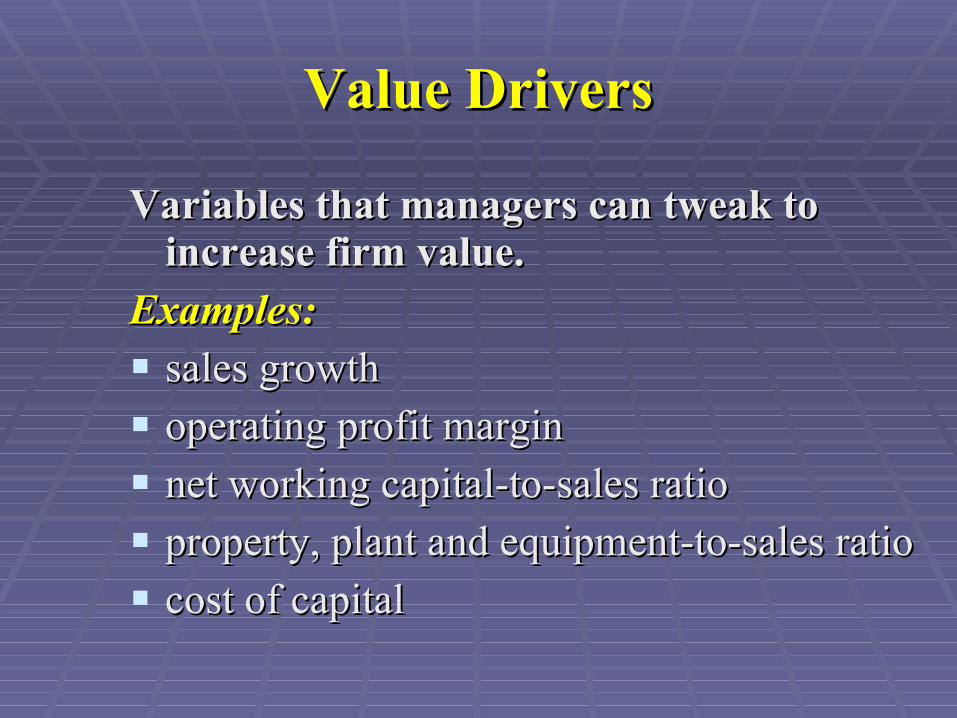
Value DriversValue Drivers
Variables that managers can tweak to Variables that managers can tweak to increase firm value.increase firm value.
Examples:Examples:
sales growthsales growth
operating profit marginoperating profit margin
net working capital-to-sales rationet working capital-to-sales ratio
property, plant and equipment-to-sales ratioproperty, plant and equipment-to-sales ratio
cost of capitalcost of capital

Economic Value AddedEconomic Value Added
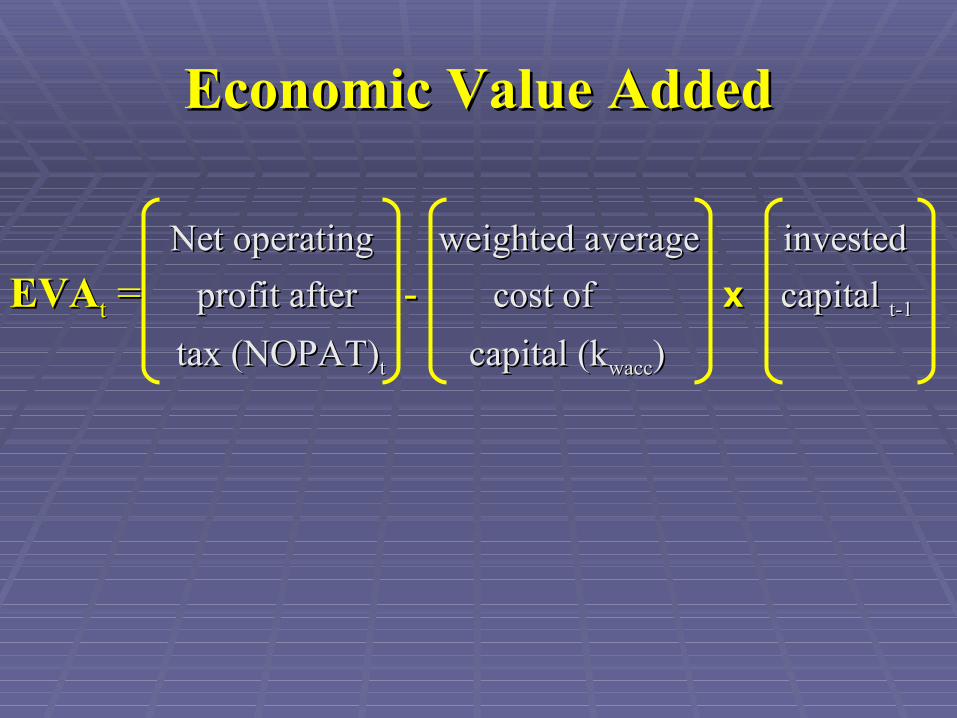
Economic Value AddedEconomic Value Added
Net operating weighted average investedNet operating weighted average invested
EVAEVAtt = = profit after profit after - - cost of cost of xx capital capital t-1t-1
tax (NOPAT)tax (NOPAT)tt capital (k capital (kwaccwacc) )
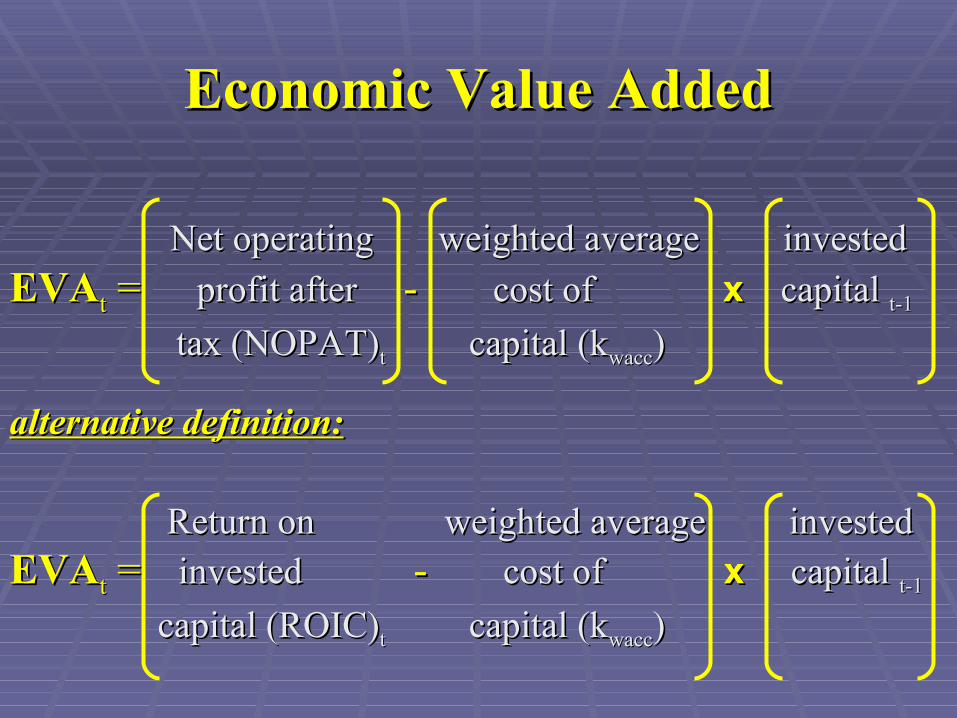
Economic Value AddedEconomic Value Added
Net operating weighted average investedNet operating weighted average invested
EVAEVAtt = = profit after profit after - - cost of cost of xx capital capital t-1t-1
tax (NOPAT)tax (NOPAT)tt capital (k capital (kwaccwacc) )
alternative definition:alternative definition:
Return on weighted average investedReturn on weighted average invested
EVAEVAtt = = invested invested - - cost of cost of xx capital capital t-1t-1
capital (ROIC)capital (ROIC)tt capital (k capital (kwaccwacc) )
Paying for PerformancePaying for Performance
Shareholder and manager interests are Shareholder and manager interests are aligned when:aligned when:
contributions of individuals and groups contributions of individuals and groups toward creation of shareholder value are toward creation of shareholder value are measured using EVA, andmeasured using EVA, and
rewards are structured accordingly.rewards are structured accordingly.
Components of a Firm’s Components of a Firm’s Compensation PolicyCompensation Policy
base paybase pay
bonus: quarterly, semi-annual, or bonus: quarterly, semi-annual, or annualannual
long-term compensation: options, long-term compensation: options, grantsgrants
Designing a Compensation ProgramDesigning a Compensation Program
1) How much to pay?1) How much to pay?
2) Base pay versus at-risk or incentive 2) Base pay versus at-risk or incentive compensationcompensation
3) Linking incentive compensation to 3) Linking incentive compensation to performanceperformance
4) Paying with a cash bonus versus equity4) Paying with a cash bonus versus equity


