93
FMEA F AILURE MODE AND EFFECTS ANALYSIS
| Date post: | 09-Jan-2017 |
| Category: |
Engineering |
| Upload: | monchito-del-mundo |
| View: | 2,251 times |
| Download: | 3 times |

FMEAFAILURE MODE AND EFFECTS ANALYSISFAILURE MODE AND EFFECTS ANALYSIS

OUTLINE
�Failure Mode and Effects Analysis� Learning Objectives� What is FMEA?� History� Motivation� Types � FMEA Steps
LEARNING OBJECTIVES
�To understand the use of Failure Modes Effect Analysis (FMEA)
�To learn the steps to developing FMEAs
�To summarize the different types of FMEAs
3
�To summarize the different types of FMEAs
�To learn how to link the FMEA to other Process tools

WHAT IS FMEA?
� A Failure Mode and Effects Analysis is a systemized group of activities intended to:� recognize and evaluate potential failure and its effects� identify actions which will reduce or eliminate the chance of
failure� document analysis findings
• PFMEA = Process F ailure M ode and E ffects A nalysis
• PFMEA is a tool intended to document the entire process
– Recognize and evaluate the potential failures of a process
– Assess the effects of each potential failure (Identify Risk)
– Identify potential process causes and identify proc ess
DEFINITION OF PFMEA
– Identify potential process causes and identify proc ess variables on which to focus controls
– Identify actions (Control Plan ) that could eliminate or reduce the chance of the failure occurring (Mitigate Risk)
5
HISTORY OF FMEA
�First used in the 1960’s in the Aerospace industry during the Apollo missions
� In 1974, the Navy developed MIL-STD-1629 regarding the use of FMEA
Examples
regarding the use of FMEA� In the late 1970’s, the automotive industry
was driven by liability costs to use FMEA�Later, the automotive industry saw the
advantages of using this tool to reduce risks related to poor quality
MOTIVATION FOR CONDUCTING A FMEA
� Improves design by discovering unanticipated failures
� Highlights the impact of the failures
� Potentially helpful during legal actions
Provides a method to characterize product safety� Provides a method to characterize product safety
� Often required (e.g. FDA and DOD procurement)
4TH EDITION KEY EMPHASIS POINTS
• Severity, Occurrence, Detection ranking tables– Improved ranking tables so that they are more meaningful to real
world analysis and usage.
• Role of management and its sanction– For resources and monitoring
• Incorrect interpretation and reliance on RPN in the evaluation of risk
8
• Incorrect interpretation and reliance on RPN in the evaluation of risk priorities and improvement actions– Inappropriate use of RPN to obtain an arbitrary threshold
• Improve the understanding of the role of the FMEA process throughout the APQP phases– Including continual improvement during production– FMEA is more than a static document necessary only for PPAP
approval
• Confusion between cause & effect
• Too few causes identified
• Lack of repeatability in risk assessment
• FMEA done only by the FMEA moderator the night before a customer
visit, an audit, initial sample presentation…
COMMON MISTAKES OFTEN SEEN
visit, an audit, initial sample presentation…
• Actions not relevant or not validated
• Detection assessed too low for a visual inspection
• Changing the severity index after action on the process
• Confusion between Design, process and machine FMEA
9Source : Joe Yap of GM
• Can’t eliminate all human errors• Only single event initiators of the problem identified• Examination of external influences limited• Results are dependent on the quality of input!
PFMEA assumptions
LIMITATIONS OF PFMEA
PFMEA assumptions
• You have to assume material is to spec• You have to assume Design is robust
10
TYPES OF FMEAS
�Design� Analyzes product design before release to
production, with a focus on product function� Analyzes systems and subsystems in early concept
and design stages
Process�Process� Used to analyze manufacturing and assembly
processes after they are implemented
11
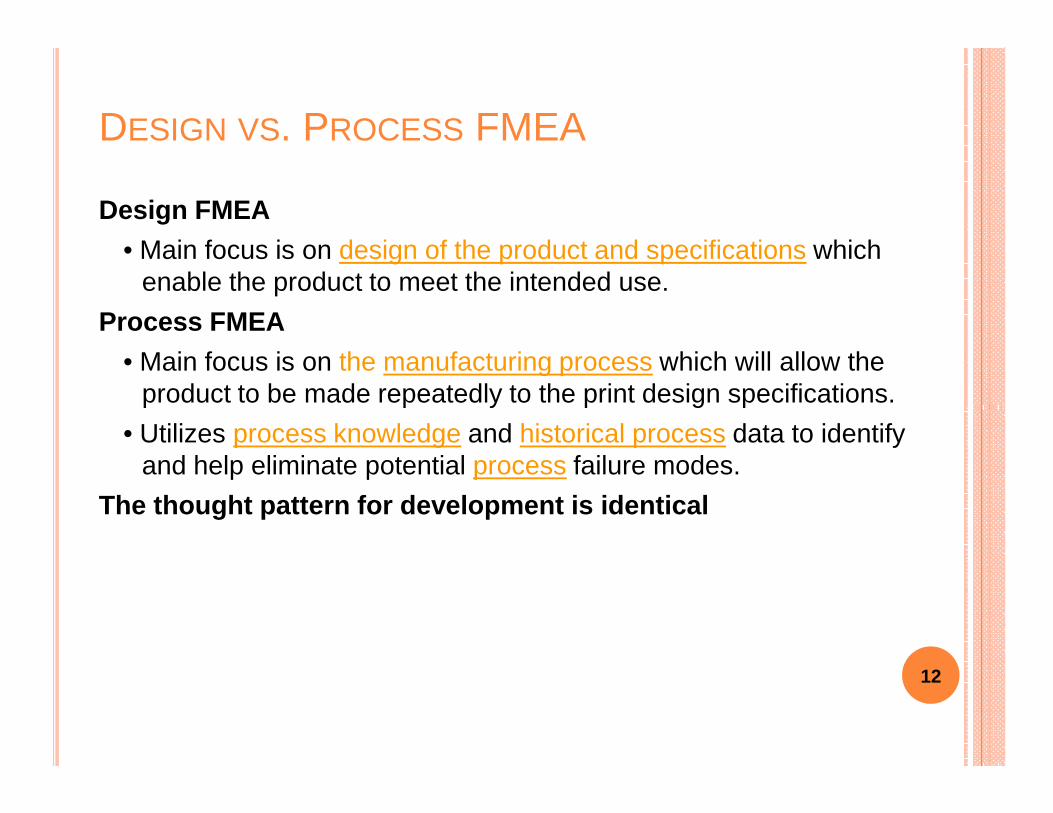
Design FMEA
• Main focus is on design of the product and specifications which enable the product to meet the intended use.
Process FMEA
• Main focus is on the manufacturing process which will allow the product to be made repeatedly to the print design specifications.
DESIGN VS. PROCESS FMEA
product to be made repeatedly to the print design specifications.
• Utilizes process knowledge and historical process data to identify and help eliminate potential process failure modes.
The thought pattern for development is identical
12
DESIGN FMEA (DFMEA)
� The Design FMEA is used to analyze products before they are released to production.
� It focuses on potential failure modes of products caused by design deficiencies.deficiencies.
� Design FMEAs are normally done at three levels – system, subsystem, and component levels
� This type of FMEA is used to analyze hardware, functions or a combination
13
PROCESS FMEA (PFMEA)
� The Process FMEA is normally used to analyze manufacturing and assembly processes at the system, subsystem or component levels.
� This type of FMEA focuses on potential failure � This type of FMEA focuses on potential failure modes of the process that are caused by manufacturing or assembly process deficiencies.
14
• The risk analysis must be driven by multifunctional teams.
• Is a LIVING document that represents the current process or product.
PROCESS FMEA
If it is correctly used, it WILL eliminate failures on products and process.
15
• 25% of our Spills were driven by change
-Process
-Product
-New Model Year Launches
-Tool Moves
LESSONS LEARNED
16
All quality spills could have been avoided
if defined processes had been followed
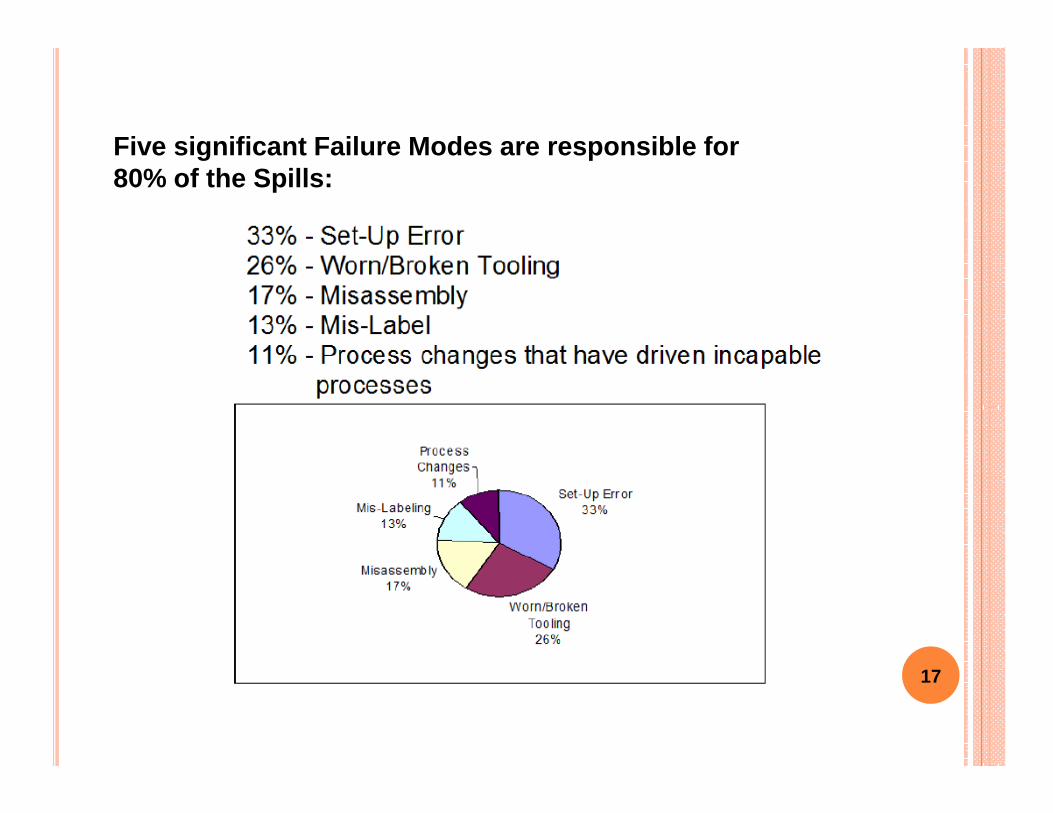
Five significant Failure Modes are responsible for 80% of the Spills:
17
WHY DO FMEA?Failures: unavoidable? Or are they?
• Manufacturing is a complex environment
• The potential for many things to go wrong, or fail, is high
• A failure is any change or any manufacturing error that renders a
component, assembly, or system incapable of performing its
18
component, assembly, or system incapable of performing its
intended function
• Process failures result in defects, defects result in waste
• Undetected defects could result in spills, customer dissatisfaction,
and hence huge cost (REACTIVE)
• Need to recognize risks – work on reduction (PREVENTIVE)

WHY DO FMEA?
• Target oriented, early determination of risks at product development and
process planning.
• Evaluation and minimization of risks
• Increase products reliability and process capability;
• Warranty safety and better ergonomics.
Prevention instead of correction
19
• Warranty safety and better ergonomics.
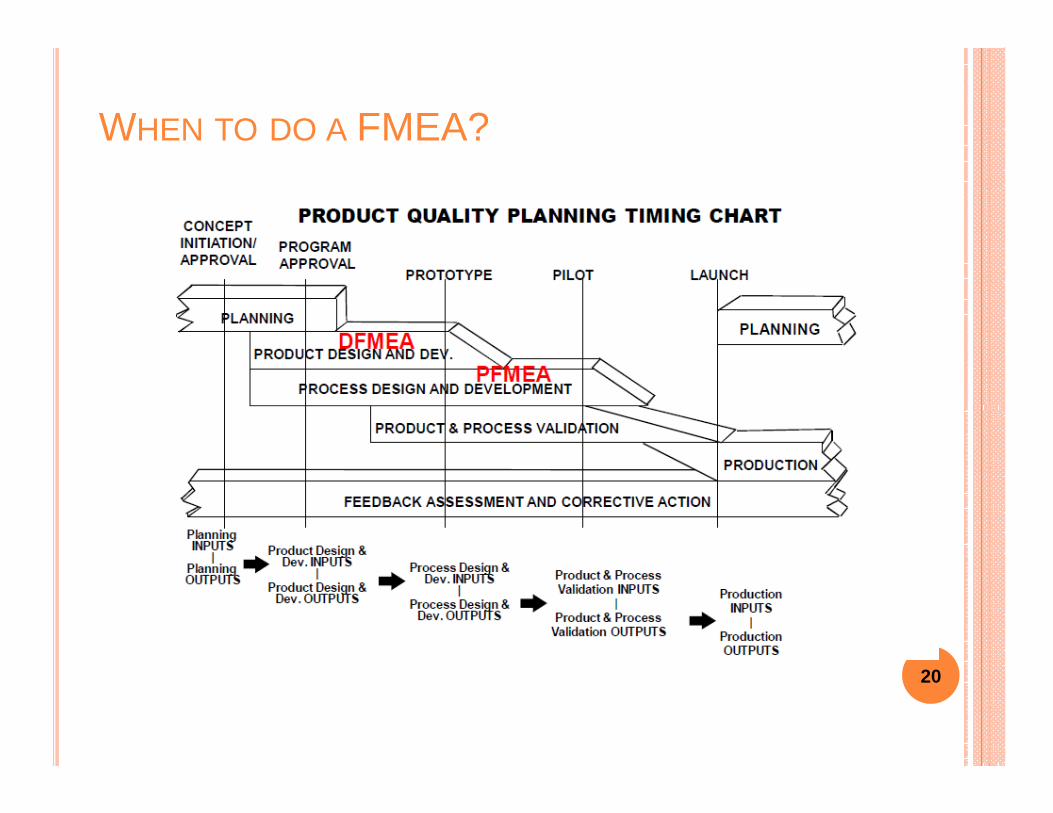
WHEN TO DO A FMEA?
20
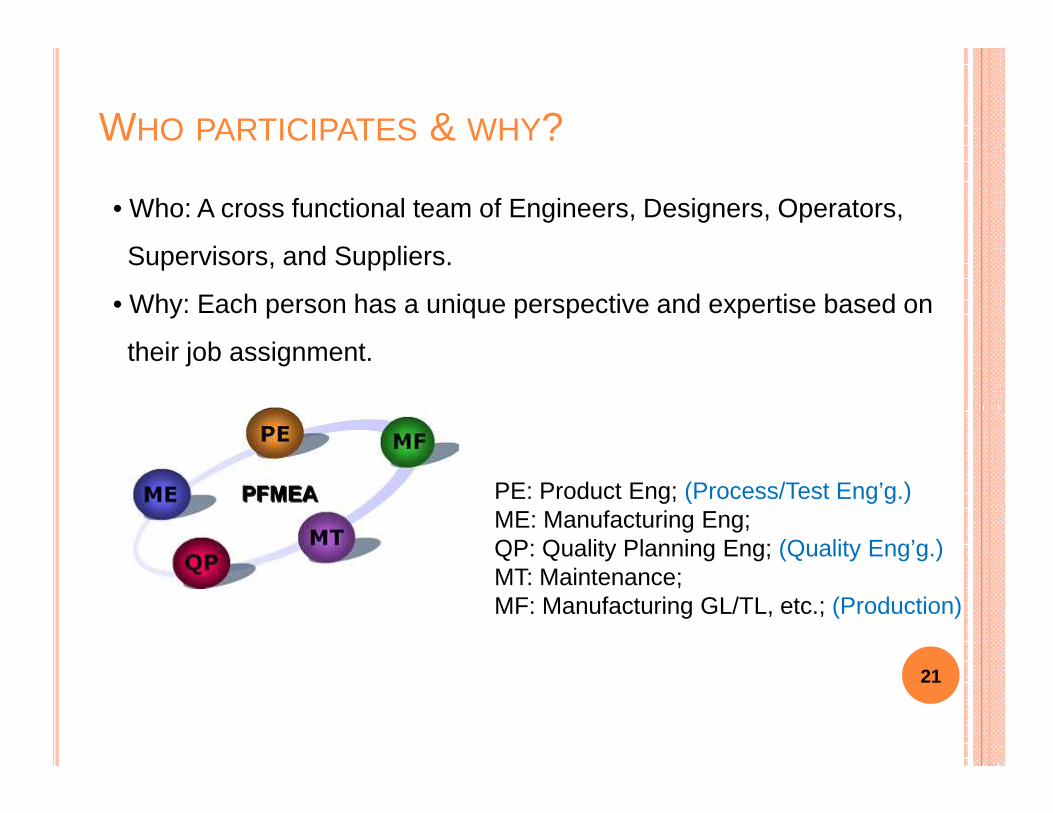
WHO PARTICIPATES & WHY?
• Who: A cross functional team of Engineers, Designers, Operators,
Supervisors, and Suppliers.
• Why: Each person has a unique perspective and expertise based on
their job assignment.
21
PE: Product Eng; (Process/Test Eng’g.)ME: Manufacturing Eng; QP: Quality Planning Eng; (Quality Eng’g.)MT: Maintenance;MF: Manufacturing GL/TL, etc.; (Production)
FMEA: A TEAM TOOL
�A team approach is necessary.
�Team should be led by the Process Owner who is the responsible manufacturing engineer or technical person, or other similar individual familiar with FMEA.FMEA.
�The following should be considered for team members:– Design Engineers – Operators– Process Engineers – Reliability– Materials Suppliers – Suppliers– Customers
22
IMPORTANCE OF FLOW DIAGRAMS
• Usually the First “Picture” of a Process
• Provides a logical pictorial which represents the
Flow of the Process
• Used as the Foundation for PFMEAs, Control Plans,
23
• Used as the Foundation for PFMEAs, Control Plans,
Tooling Layouts, Work Station Layouts, Etc…
• All Operations should be shown, including Inspection,
Gauging Operations and Rework and Scrap Areas.
FLOW DIAGRAM QUICK CHECKLIST
Recommended Base Requirements of a Process Flow Dia gram:
• Manufacturing Process Title
• Numbering/Lettering Scheme – Standard format
• Include ALL Operations
– Gauging & key process control related operations
24
– Rework areas
– Scrap areas
– Labeling
– Shipping
• Key for Symbols; consistent use
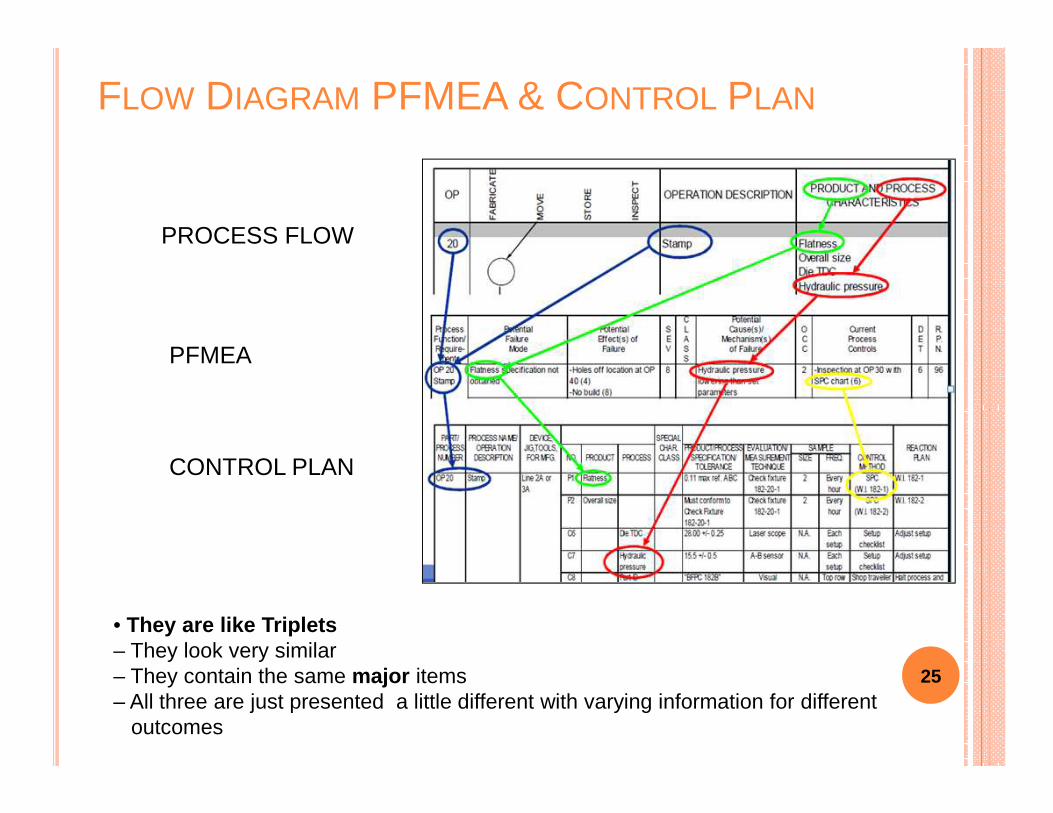
FLOW DIAGRAM PFMEA & CONTROL PLAN
PROCESS FLOW
PFMEA
25
• They are like Triplets– They look very similar– They contain the same major items– All three are just presented a little different with varying information for different
outcomes
CONTROL PLAN
WHEN TO USE FMEA
� FMEA is designed to prevent failures from occurring or from getting to internal and external customers.
� Therefore, FMEA is essential for situations where failures might occur and the effects of those failures occurring are might occur and the effects of those failures occurring are potentially serious.
� FMEA can be used on all Six Sigma projects. It serves as an overall control document for the process.
26
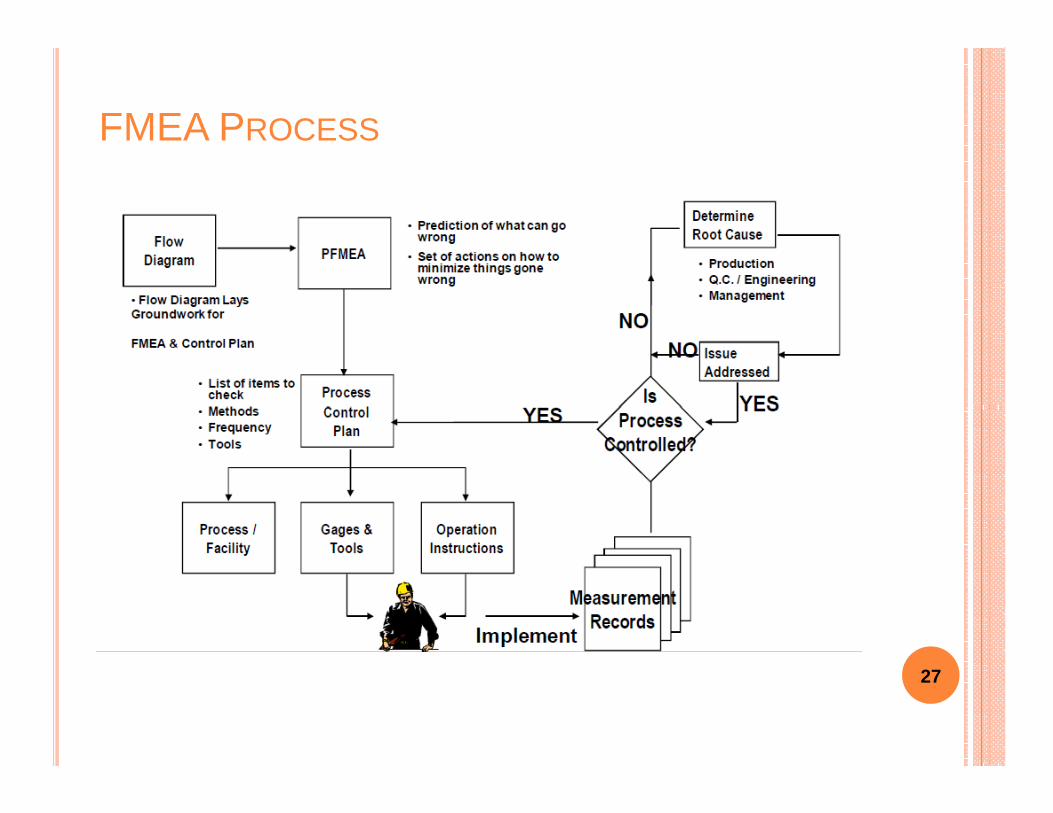
FMEA PROCESS
27
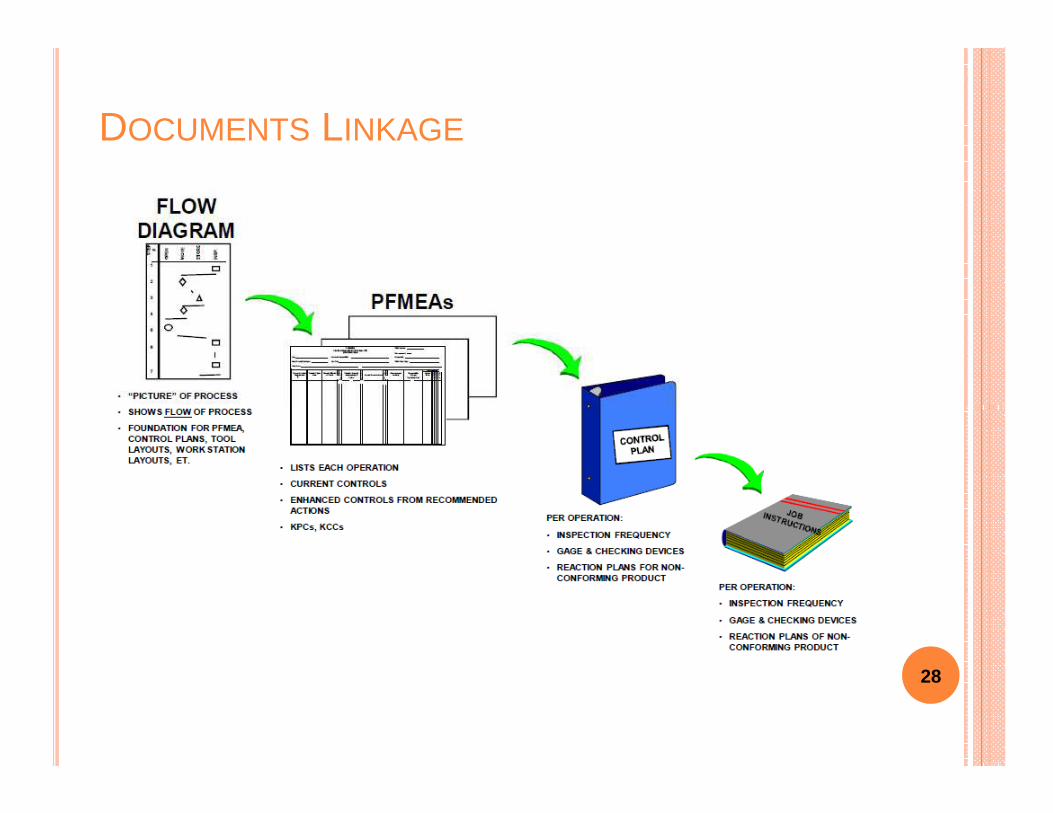
DOCUMENTS LINKAGE
28
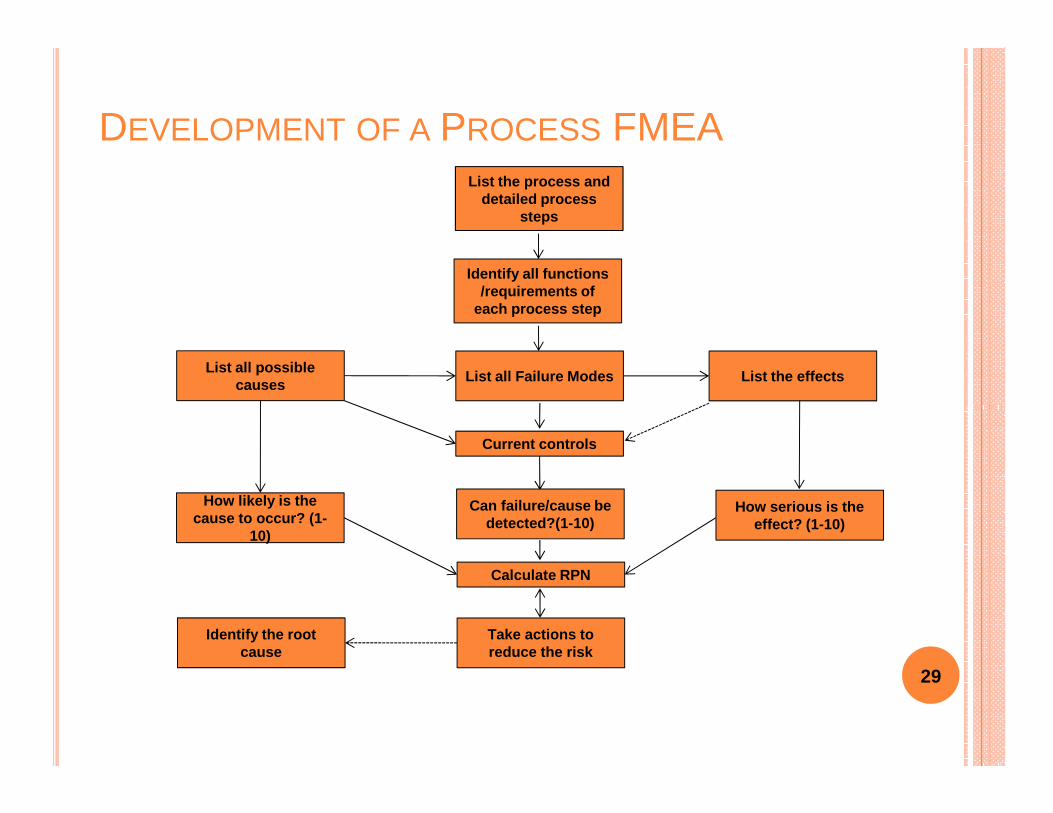
DEVELOPMENT OF A PROCESS FMEAList the process and
detailed process steps
Identify all functions /requirements of
each process step
List all Failure Modes List the effects List all possible
causes
29
How likely is the cause to occur? (1-
10)
How serious is the effect? (1-10)
Current controls
Can failure/cause be detected?(1-10)
Calculate RPN
Take actions to reduce the risk
Identify the root cause
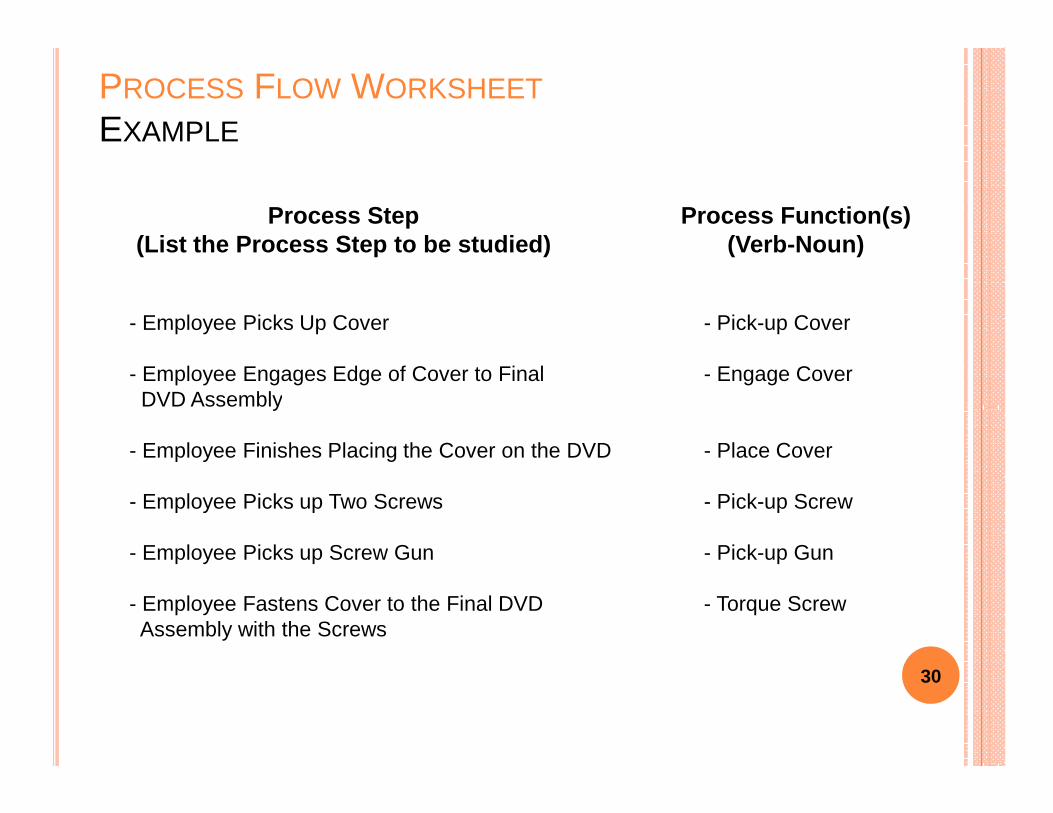
PROCESS FLOW WORKSHEET
EXAMPLE
- Employee Picks Up Cover - Pick-up Cover
- Employee Engages Edge of Cover to Final - Engage CoverDVD Assembly
Process Step(List the Process Step to be studied)
Process Function(s)(Verb-Noun)
30
DVD Assembly
- Employee Finishes Placing the Cover on the DVD - Place Cover
- Employee Picks up Two Screws - Pick-up Screw
- Employee Picks up Screw Gun - Pick-up Gun
- Employee Fastens Cover to the Final DVD - Torque ScrewAssembly with the Screws
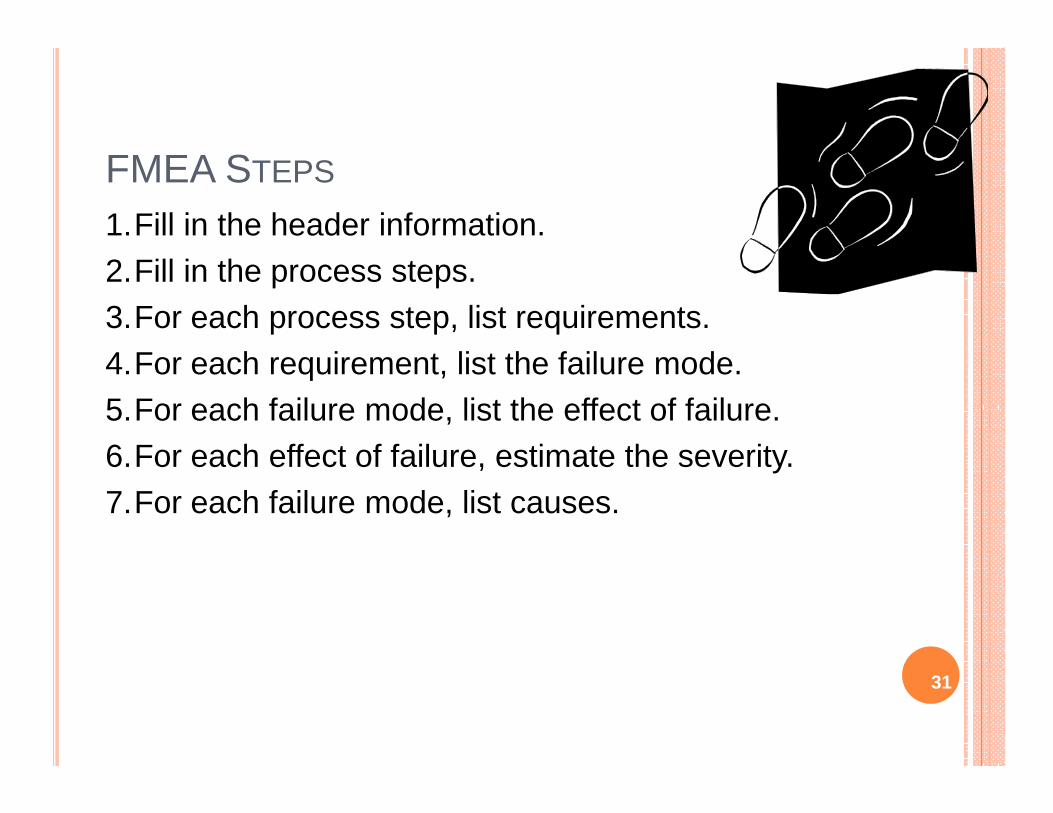
FMEA STEPS
1.Fill in the header information.
2.Fill in the process steps.
3.For each process step, list requirements.
4.For each requirement, list the failure mode.
5.For each failure mode, list the effect of failure.5.For each failure mode, list the effect of failure.
6.For each effect of failure, estimate the severity.
7.For each failure mode, list causes.
31

FMEA STEPS (CONT.)
8. For each cause of failure, estimatethe likelihood of occurrence.
9. For each cause of failure, list the current process controls.
10. For each process control, estimate the detection.10. For each process control, estimate the detection.
11. For each cause of failure, calculate the Risk Priority Number.
12. For high priority causes of failure and/or failure modes, develop recommended actions.
32
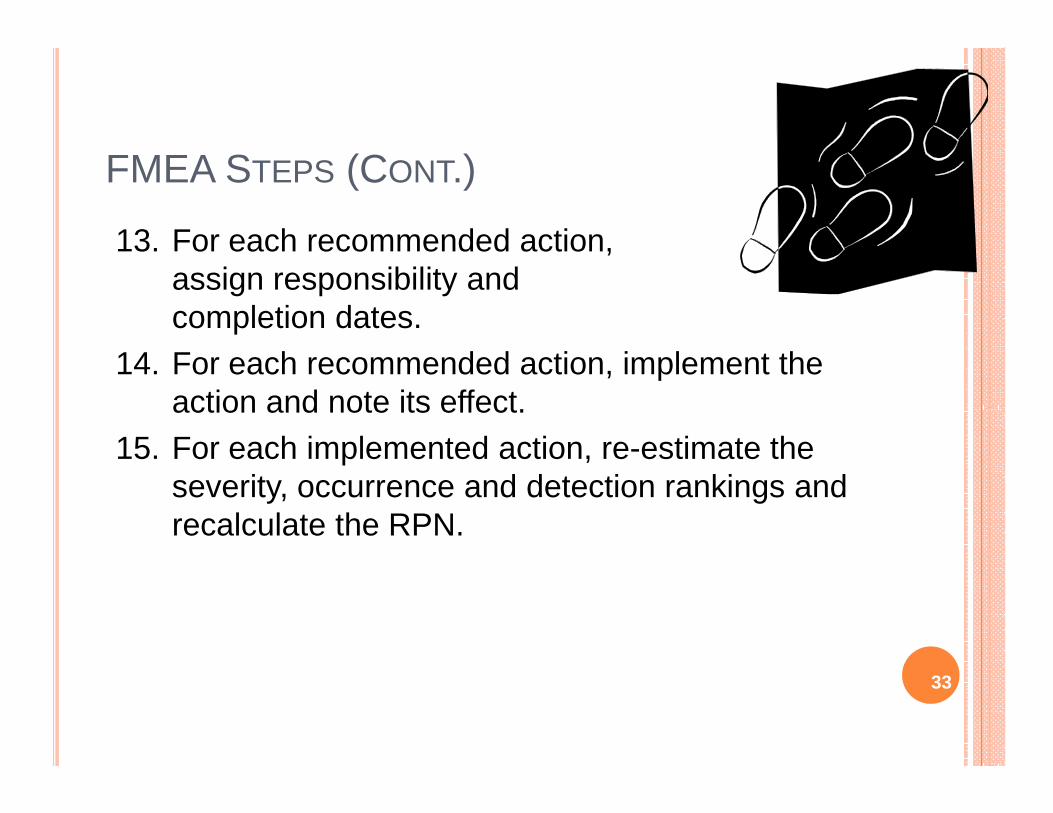
FMEA STEPS (CONT.)
13. For each recommended action, assign responsibility and completion dates.
14. For each recommended action, implement the action and note its effect.action and note its effect.
15. For each implemented action, re-estimate the severity, occurrence and detection rankings and recalculate the RPN.
33
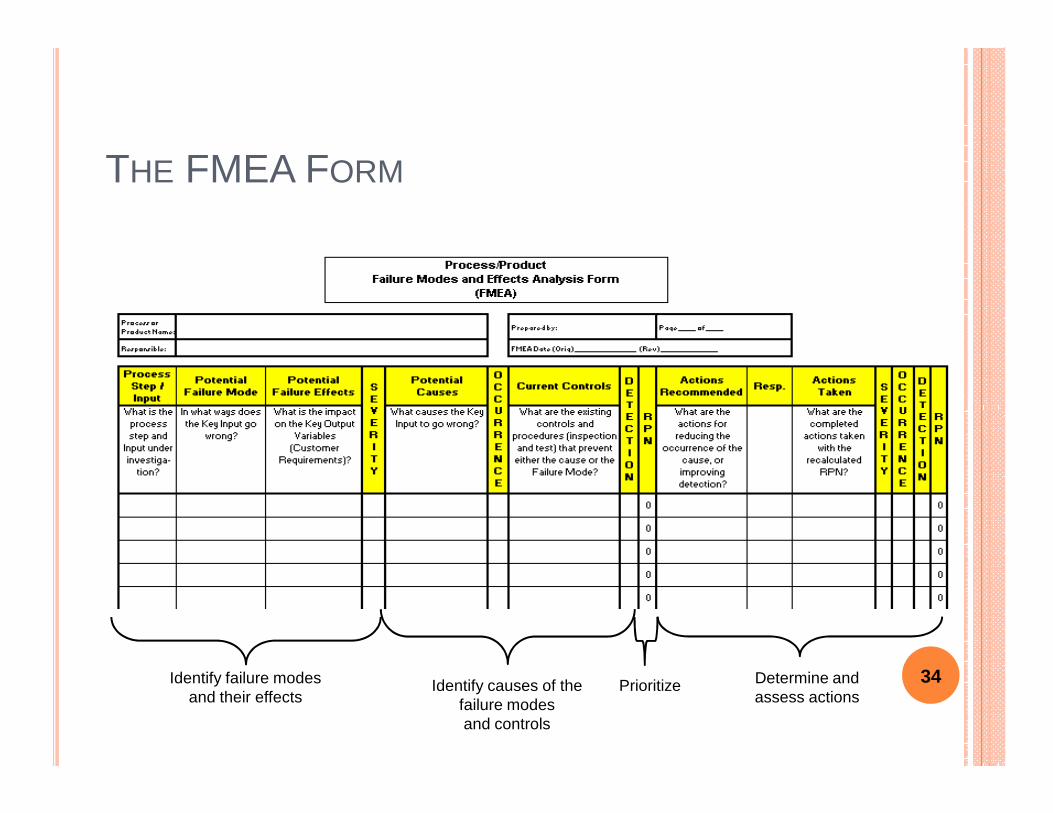
THE FMEA FORM
34
Identify failure modes and their effects
Identify causes of the failure modesand controls
Prioritize Determine and assess actions
34
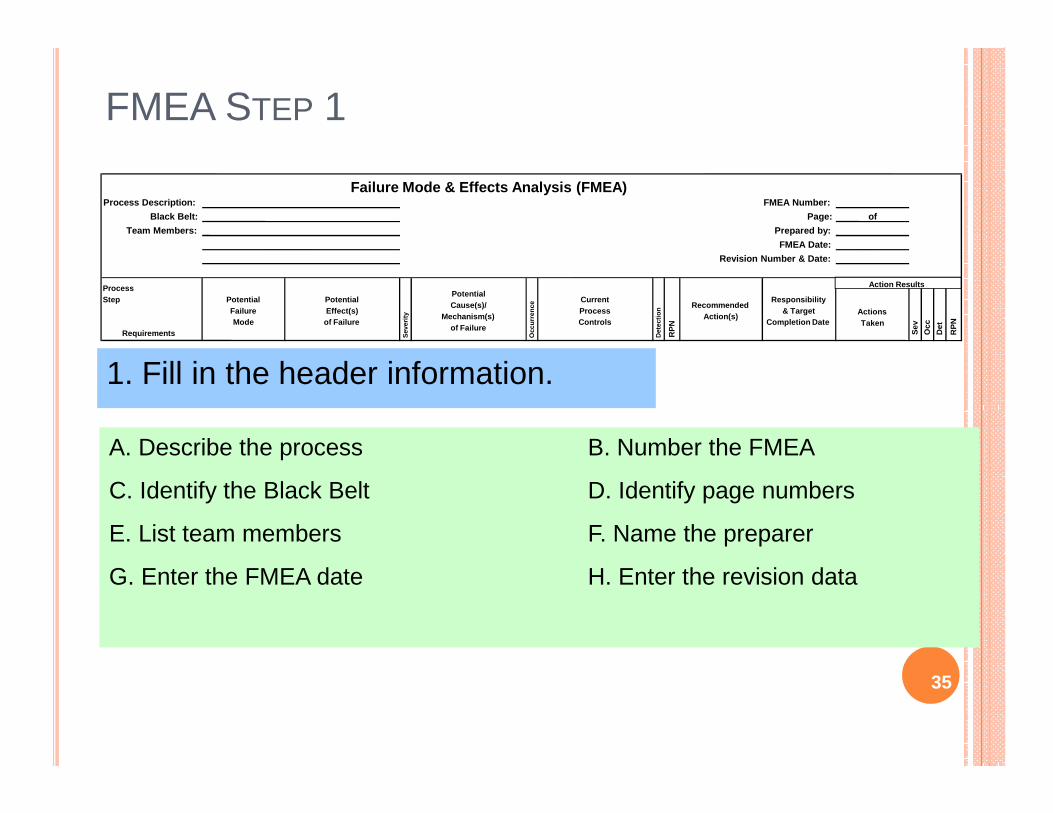
FMEA STEP 1
1. Fill in the header information.
Failure Mode & Effects Analysis (FMEA)Process Description: FMEA Number:
Black Belt: Page: of
Team Members: Prepared by:
FMEA Date:
Revision Number & Date:
ProcessStep
Requirements
PotentialFailureMode
PotentialEffect(s)
of Failure
Sev
erity
PotentialCause(s)/
Mechanism(s)of Failure
Occ
urre
nce
CurrentProcessControls
Det
ectio
n
RP
N
RecommendedAction(s)
Responsibility& Target
Completion DateActionsTaken
Sev
Occ
Det
RP
N
Action Results
A. Describe the process B. Number the FMEA
C. Identify the Black Belt D. Identify page numbers
E. List team members F. Name the preparer
G. Enter the FMEA date H. Enter the revision data
35
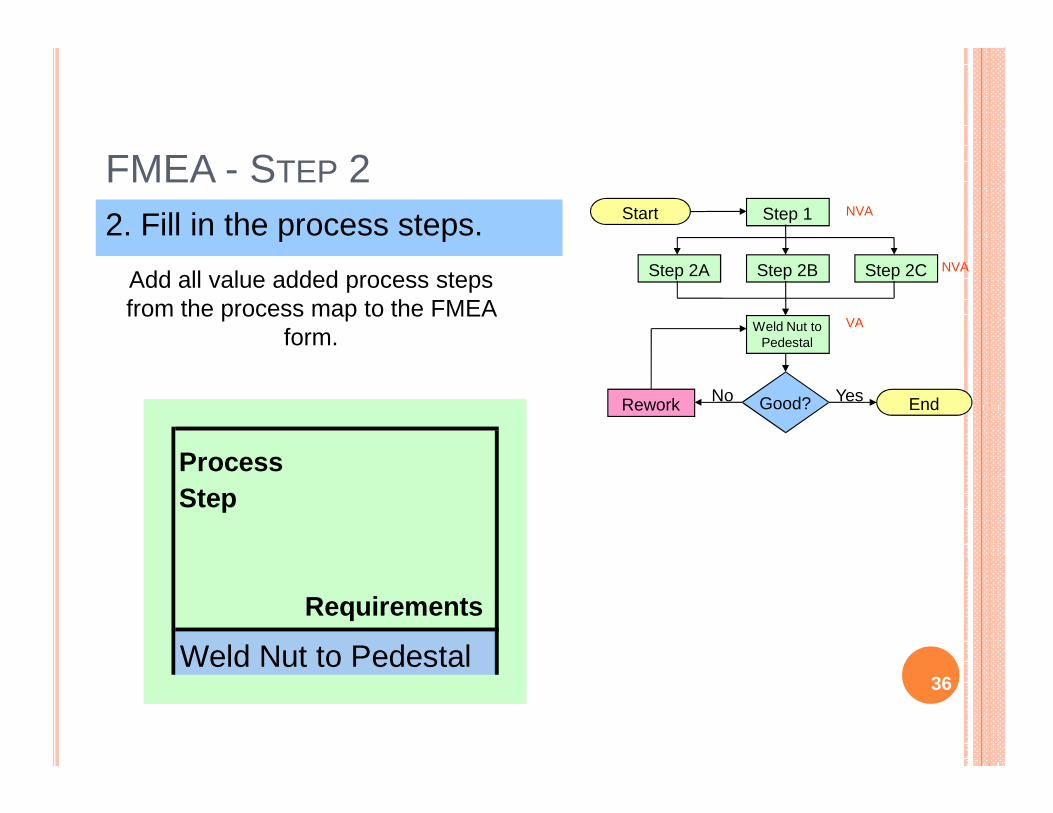
FMEA - STEP 22. Fill in the process steps.
Add all value added process steps from the process map to the FMEA
form.
Start
End
Step 2A Step 2B Step 2C
Step 1
Weld Nut toPedestal
Good?Rework YesNo
VA
NVA
NVA
EndGood?Rework
ProcessStep
Requirements
Weld Nut to Pedestal36

- A simple description of the process or operation be ing analyzed.
- Purpose or intent of a particular process.
- All functions are written in verb-noun (action-obje ct) format.
PFMEA TERMS AND DESCRIPTION
FUNCTION
37
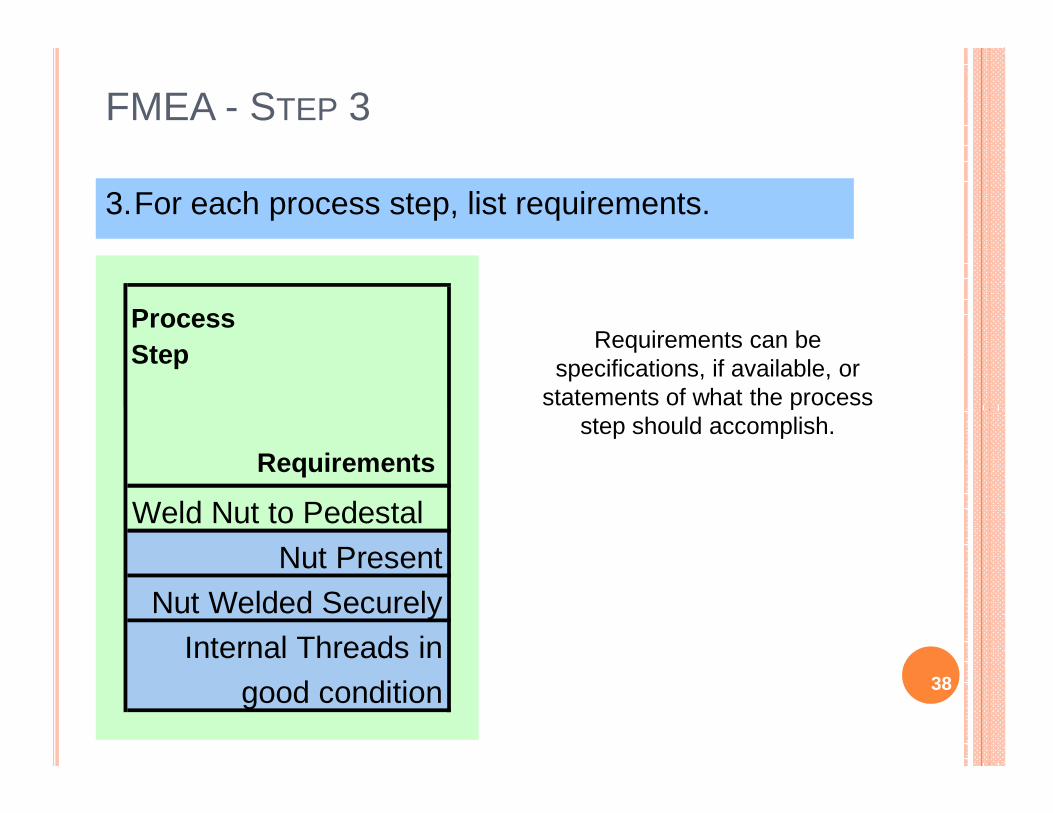
FMEA - STEP 3
3.For each process step, list requirements.
Requirements can be specifications, if available, or
statements of what the process
ProcessStep
statements of what the process step should accomplish.
Requirements
Weld Nut to Pedestal
Nut Present
Nut Welded Securely
Internal Threads in
good condition 38
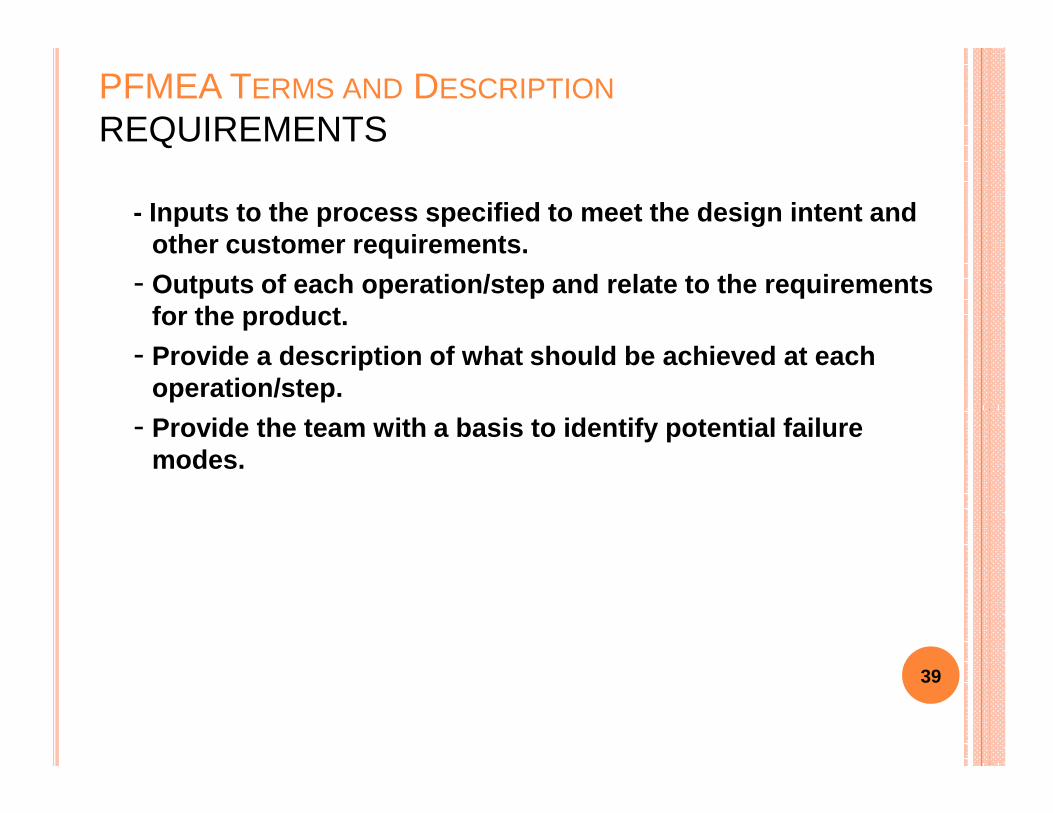
- Inputs to the process specified to meet the design intent and other customer requirements.
- Outputs of each operation/step and relate to the re quirements for the product.
- Provide a description of what should be achieved at each operation/step.
PFMEA TERMS AND DESCRIPTION
REQUIREMENTS
- Provide the team with a basis to identify potential failure modes.
39

FMEA - STEP 4
4.For each requirement, list the failure mode.
ProcessStep
Requirements
PotentialFailureMode
Weld Nut to PedestalWeld Nut to Pedestal
Nut Present Nut not present
Nut Welded Securely Nut welded
insecurely
Internal Threads in Internal threadsgood condition damaged
40

FMEA TIPS ABOUT STEP 4
4.For each requirement, list the failure mode.
Tips about Step 4:
� Failure modes are negative statements of requirements.
� Failure modes are not causes. “Operator fails to load weld nut” is not a failure mode. It is a cause of the failure mode, “Nut not present.”failure mode. It is a cause of the failure mode, “Nut not present.”
� This column is easy - if you avoid discussing causes! Just wait. Everyone can discuss causes in step 7.
41
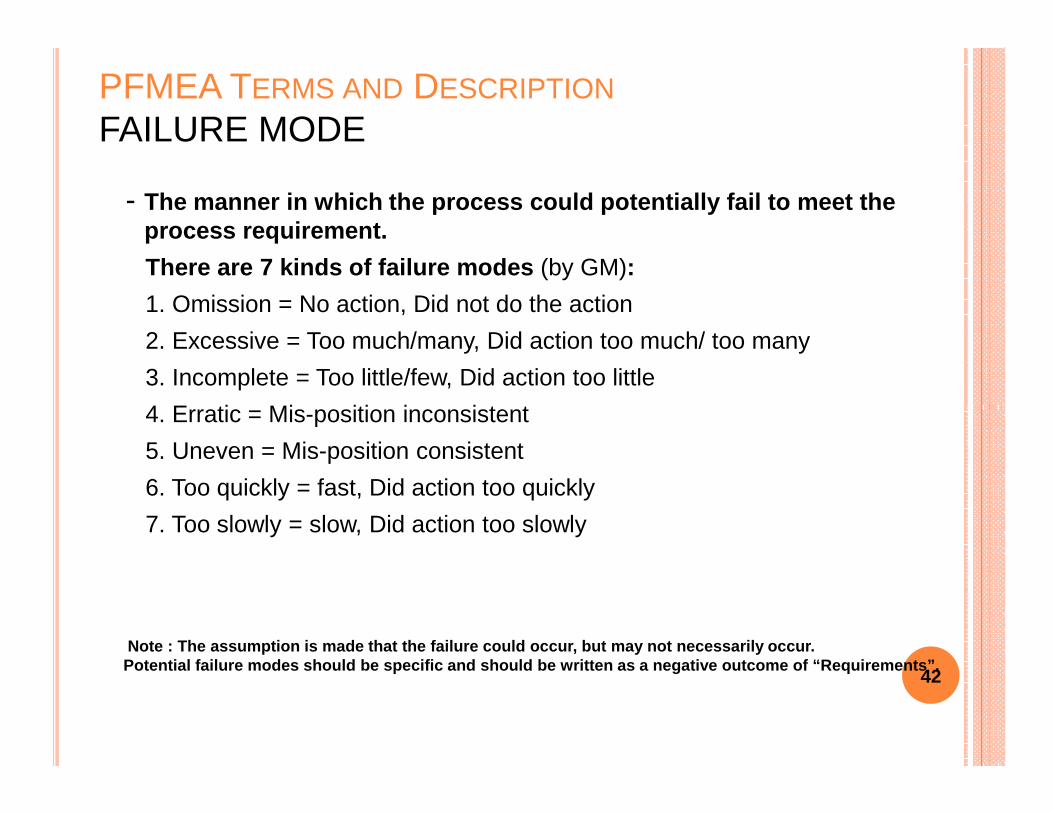
- The manner in which the process could potentially f ail to meet the process requirement.
There are 7 kinds of failure modes (by GM):
1. Omission = No action, Did not do the action
2. Excessive = Too much/many, Did action too much/ too many
3. Incomplete = Too little/few, Did action too little
4. Erratic = Mis-position inconsistent
PFMEA TERMS AND DESCRIPTION
FAILURE MODE
4. Erratic = Mis-position inconsistent
5. Uneven = Mis-position consistent
6. Too quickly = fast, Did action too quickly
7. Too slowly = slow, Did action too slowly
42
Note : The assumption is made that the failure coul d occur, but may not necessarily occur. Potential failure modes should be specific and shou ld be written as a negative outcome of “Requirements ”.
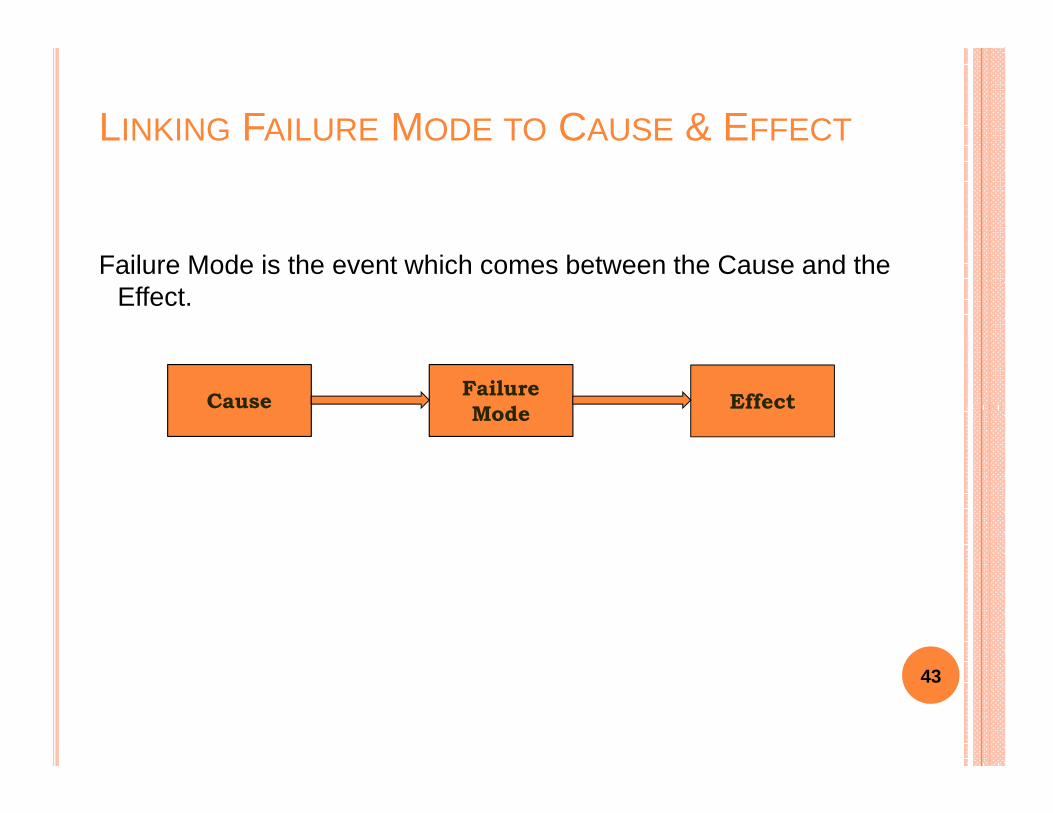
Failure Mode is the event which comes between the Cause and the Effect.
LINKING FAILURE MODE TO CAUSE & EFFECT
CauseFailure
ModeEffect
43
CauseMode
Effect
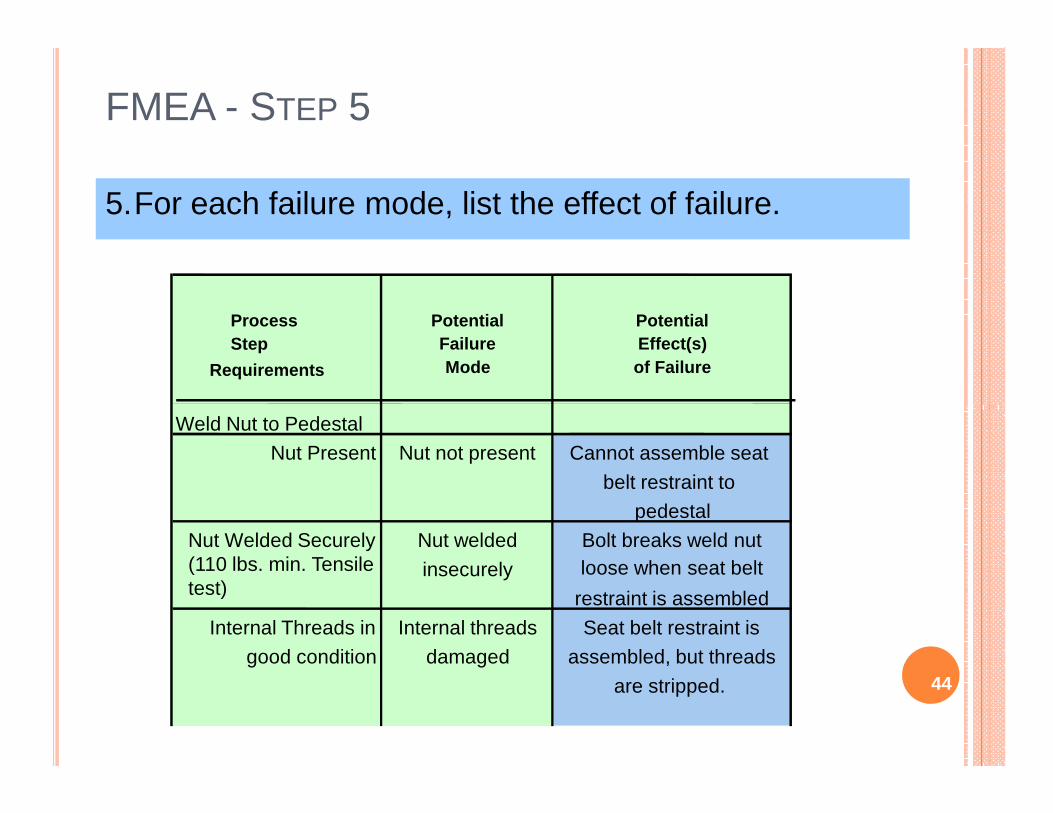
FMEA - STEP 5
5.For each failure mode, list the effect of failure.
ProcessStep
Requirements
PotentialFailureMode
PotentialEffect(s)of Failure
Weld Nut to Pedestal
Nut Present Nut not present Cannot assemble seat
belt restraint to
pedestal
Nut Welded Securely(110 lbs. min. Tensile test)
Nut welded Bolt breaks weld nut
insecurely loose when seat belt
restraint is assembled
Internal Threads in Internal threads Seat belt restraint is
good condition damaged assembled, but threads
are stripped. 44
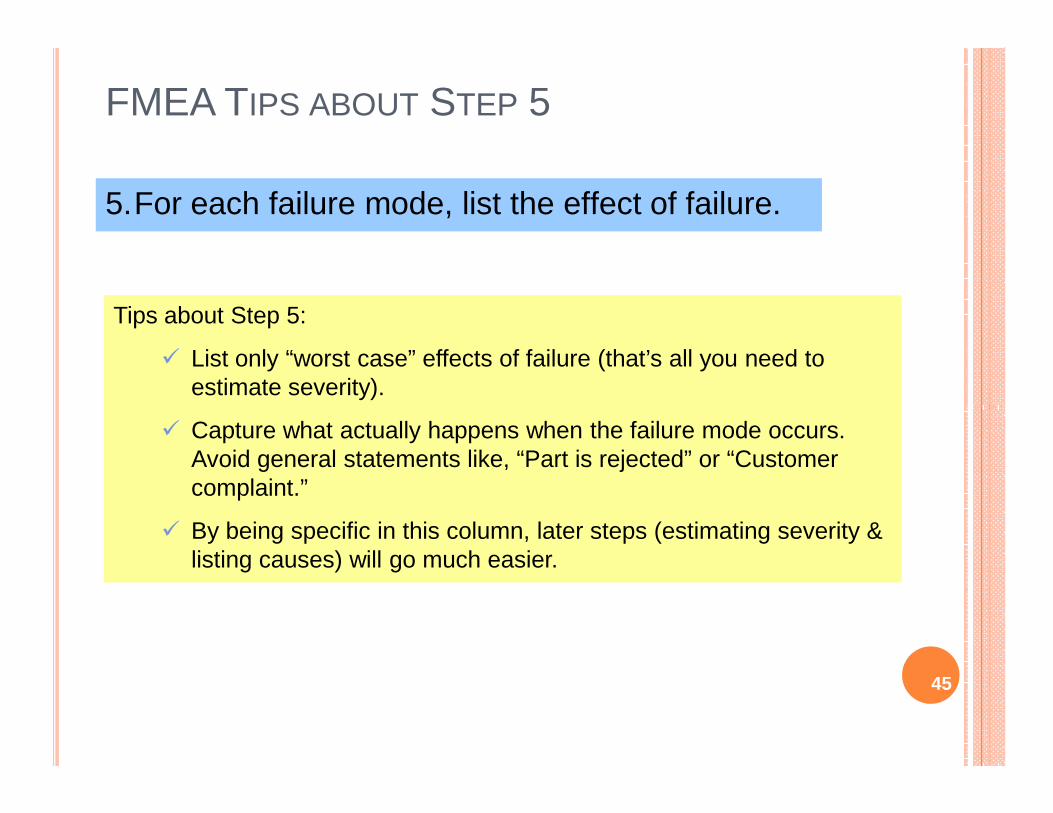
FMEA TIPS ABOUT STEP 5
5.For each failure mode, list the effect of failure.
Tips about Step 5:
� List only “worst case” effects of failure (that’s all you need to estimate severity).
� Capture what actually happens when the failure mode occurs. Avoid general statements like, “Part is rejected” or “Customer complaint.”
� By being specific in this column, later steps (estimating severity & listing causes) will go much easier.
45

- It is the impact or downstream consequence of the failure mode on the customer.
• Describe the effect of the failure mode in terms of what the customer will notice or experience.
• Customer may be an internal customer as well as the ultimate end user. Each must be considered when as sessing
PFMEA TERMS AND DESCRIPTION
EFFECT
ultimate end user. Each must be considered when as sessing the potential effect of a failure.
46

FMEA - STEP 6
6.For each effect of failure, estimate the severity
ProcessStep
Requirements
PotentialFailureMode
PotentialEffect(s)of Failure
Sev
erity
Weld Nut to PedestalWeld Nut to Pedestal
Nut Present Nut not present Cannot assemble seat 5
belt restraint to
pedestal
Nut Welded Securely Nut welded Bolt breaks weld nut 6
insecurely loose when seat belt
restraint is assembled
Internal Threads in Internal threads Seat belt restraint is 9
good condition damaged assembled, but threads
are stripped.
Assembly is weak.47

- An assessment of the seriousness of the effect of a failure mode.
• Severity applies to the effect only. It is associa ted with the most serious effect of a given failure mode.
• Severity rankings should be identical for identical Potential Effects.
• A reduction in the severity ranking can be effected through a
PFMEA TERMS AND DESCRIPTION
SEVERITY (S)
• A reduction in the severity ranking can be effected through a design change to the system, subsystem or component , or a design of the process.
48

FMEA - STEP 6: AIAG* SEVERITY GUIDELINES
SEVERITY SCALE
Criteria : This ranking results when a potential failure mode results in a final customer and/or a manufacturing/assembly plant defect. The final customer should always be considered first. If both occur, use the higher of the two severities.
10 Hazardous - w/o warning Very high severity ranking when a potential failure mode affects safe vehicle operation and/or involves noncompliance with government regulation without warning
9 Hazardous - w/ warning Very high severity ranking when a potential failure mode affects safe vehicle operation and/or involves noncompliance with government regulation with warning
8 Very High Vehicle/item inoperable, with loss of primary function.
7 High Vehicle/item inoperable, but at a reduced level of performance. Customer very dissatisfied.
Or product may have to be sorted and a portion, (less than 100%) repaired in repair department with a repair time between a half-hour
Criteria : This ranking results when a potential failure mode results in a final customer and/or a manufacturing/assembly plant defect. The final customer should always be considered first. If both occur, use the higher of the two severities.
Or may endanger operator (machinery assembly) without warning.
Or may endanger operator (machinery assembly) with warning.
Or 100% of product may have to be scrapped, or vehicle/item repaired in repair department with a repair time greater than one hour.
* Note: AIAG is the Automotive Industry Action Group, which currently compiles the FMEA standards for the North American Auto Industry.
6 Moderate Vehicle/item operable, but comfort/convenience inoperable. Customer dissatisfied.
5 Low Vehicle/item operable, but comfort/convenience operable at a reduced level of performance. Customer somewhat dissatisfied.
4 Very Low Fit and Finish/Squeaks and Rattle item does not conform. Defect noticed by most Customers. (greater than 75%)
3 Minor Fit and Finish/Squeaks and Rattle item does not conform. Defect noticed by 50% Customers.
2 Very Minor Fit and Finish/Squeaks and Rattle item does not conform. Defect noticed by discriminating Customers. (less than 25%)
1 None No discernible effect
and an hour.
Or a portion (less than 100%) of the product may have to be scrapped with no sorting, or vehicle/item repaired in the repair department with a repair time less than a half-hour.
Or 100% of product may have to be reworked, or vehicle/item repaired off-line but does not go to repair department.
Or the product may have to be sorted, with no scrap, and a portion (less than 100%) reworked.
Or a portion (less than 100%) of the product may have, with no scrap, on-line but out-of-station.
Or a portion (less than 100%) of the product may have, with no scrap, on-line but in-station.
Or slight inconvenience to operation or operator, or no effect. 49
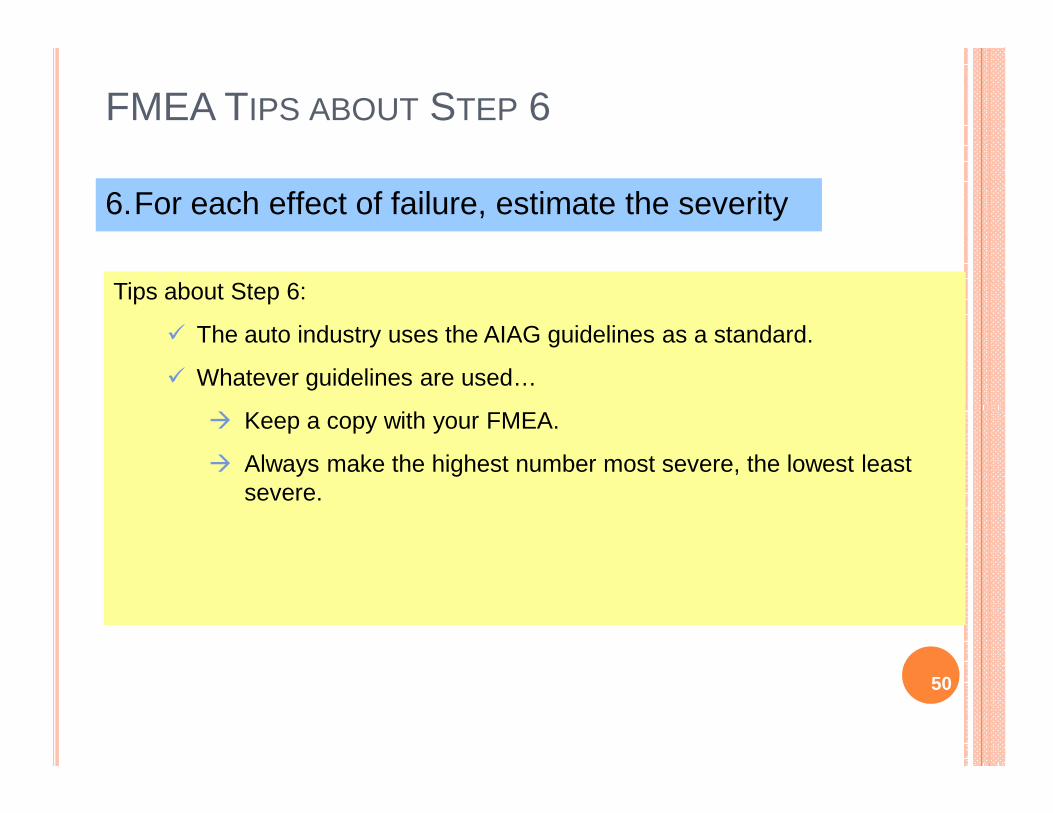
FMEA TIPS ABOUT STEP 6
6.For each effect of failure, estimate the severity
Tips about Step 6:
� The auto industry uses the AIAG guidelines as a standard.
� Whatever guidelines are used…
� Keep a copy with your FMEA.
� Always make the highest number most severe, the lowest least severe.
50
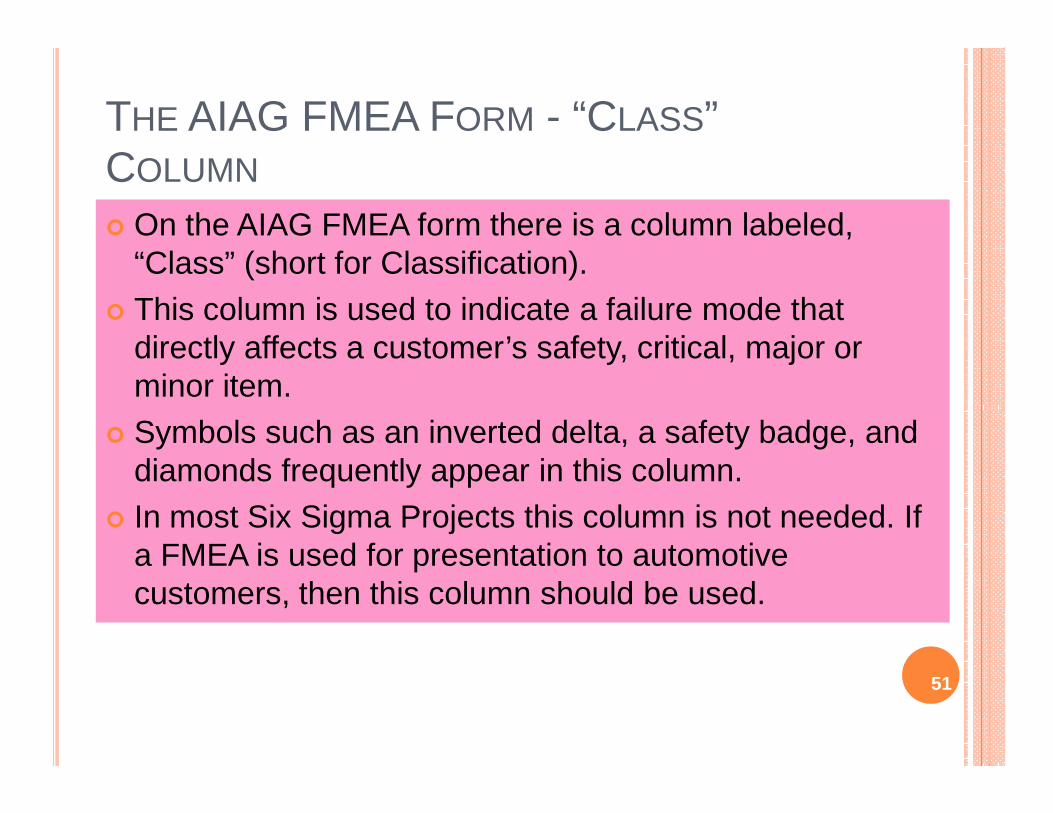
THE AIAG FMEA FORM - “CLASS” COLUMN
� On the AIAG FMEA form there is a column labeled, “Class” (short for Classification).
� This column is used to indicate a failure mode that directly affects a customer’s safety, critical, major or minor item.
� Symbols such as an inverted delta, a safety badge, and diamonds frequently appear in this column.
� In most Six Sigma Projects this column is not needed. If a FMEA is used for presentation to automotive customers, then this column should be used.
51

- Used to highlight high priority failure modes or c auses that may require additional engineering assessment.
- Classify any special product or process characteri stic (e.g., critical, key, major, significant) for components, subsystems , or systems that may require additional process controls.
• Customer specific requirements may identify special product or process characteristic symbols and their usage.
•
PFMEA TERMS AND DESCRIPTION
CLASSIFICATION (CLASS)
• The following internal characteristics are consider ed:
* W – an important product or process characteristic whose execution to specification is of special importance to the operation of the product or its further processing.
* D – indicate a product or process characteristics, which requires archived documentation.
52
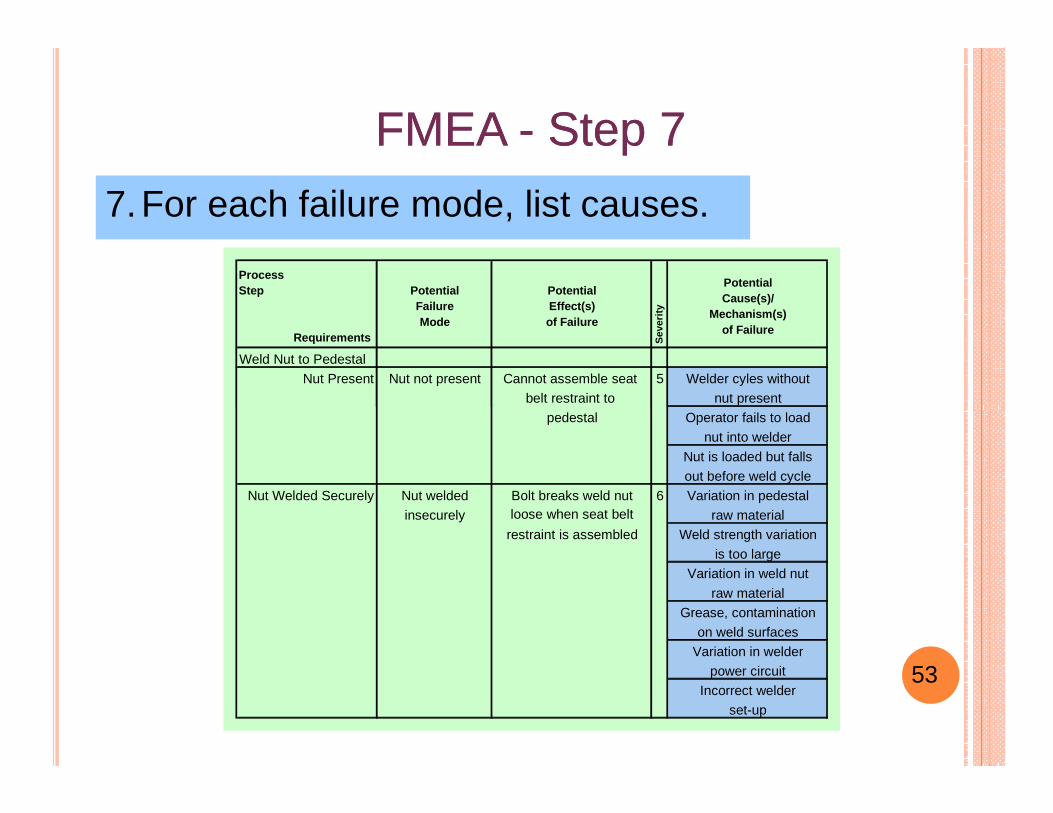
FMEA FMEA -- Step 7Step 7
7.For each failure mode, list causes.
ProcessStep
Requirements
PotentialFailureMode
PotentialEffect(s)of Failure
Sev
erity
PotentialCause(s)/
Mechanism(s)of Failure
Weld Nut to Pedestal
Nut Present Nut not present Cannot assemble seat 5 Welder cyles without
belt restraint to nut present
pedestal Operator fails to load
nut into welder
Nut is loaded but falls
out before weld cycle
Nut Welded Securely Nut welded Bolt breaks weld nut 6 Variation in pedestal
insecurely loose when seat belt raw material
restraint is assembled Weld strength variation
is too large
Variation in weld nut
raw material
Grease, contamination
on weld surfaces
Variation in welder
power circuit
Incorrect welder
set-up
53
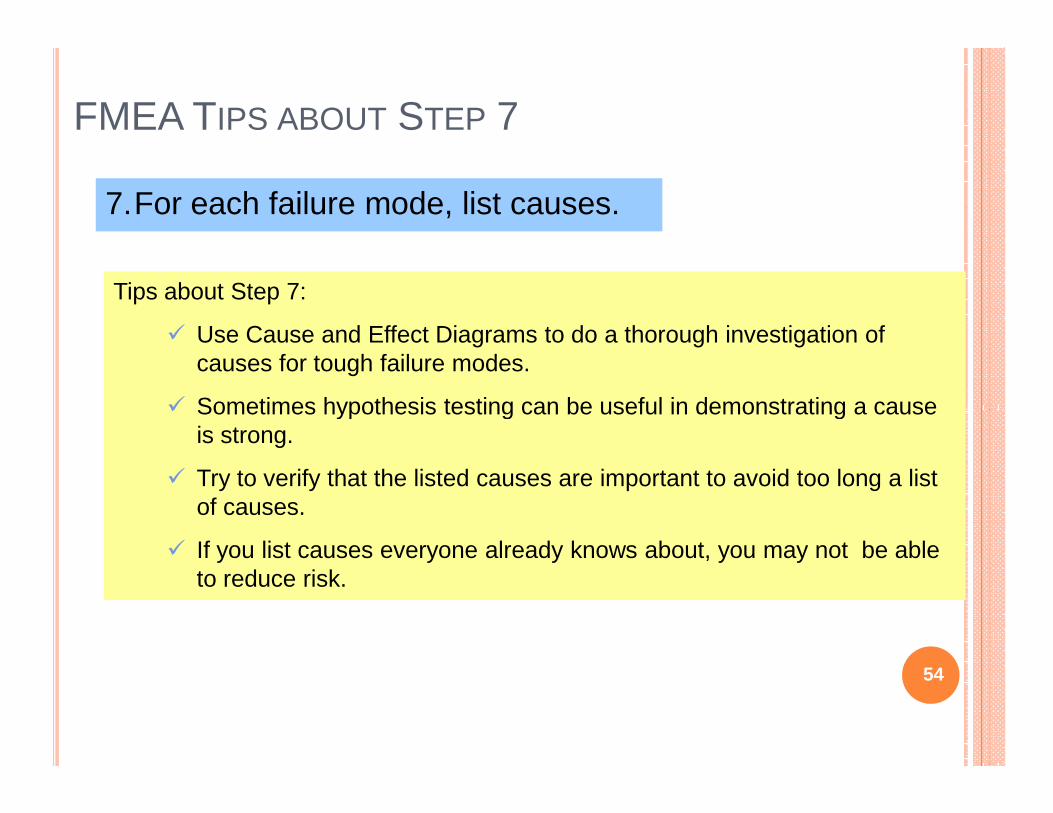
FMEA TIPS ABOUT STEP 7
7.For each failure mode, list causes.
Tips about Step 7:
� Use Cause and Effect Diagrams to do a thorough investigation of causes for tough failure modes.
� Sometimes hypothesis testing can be useful in demonstrating a cause
54
� Sometimes hypothesis testing can be useful in demonstrating a cause is strong.
� Try to verify that the listed causes are important to avoid too long a list of causes.
� If you list causes everyone already knows about, you may not be able to reduce risk.
54
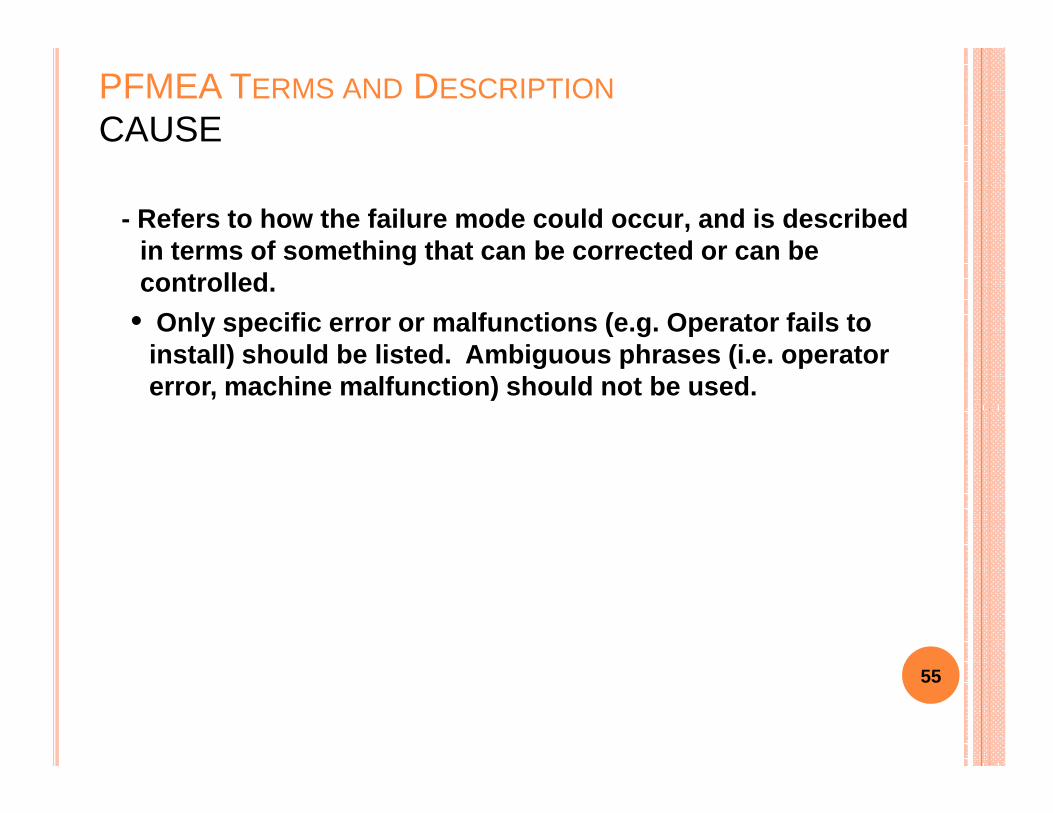
- Refers to how the failure mode could occur, and is described in terms of something that can be corrected or can be controlled.
• Only specific error or malfunctions (e.g. Operator fails to install) should be listed. Ambiguous phrases (i.e. operator error, machine malfunction) should not be used.
PFMEA TERMS AND DESCRIPTION
CAUSE
55

USE THE C & E DIAGRAM
Process Step/Requirements
PotentialFailure Mode
Potential Effects of Failure Severity
PotentialCauses of
Failure
FMEA
Causes
Effect
56
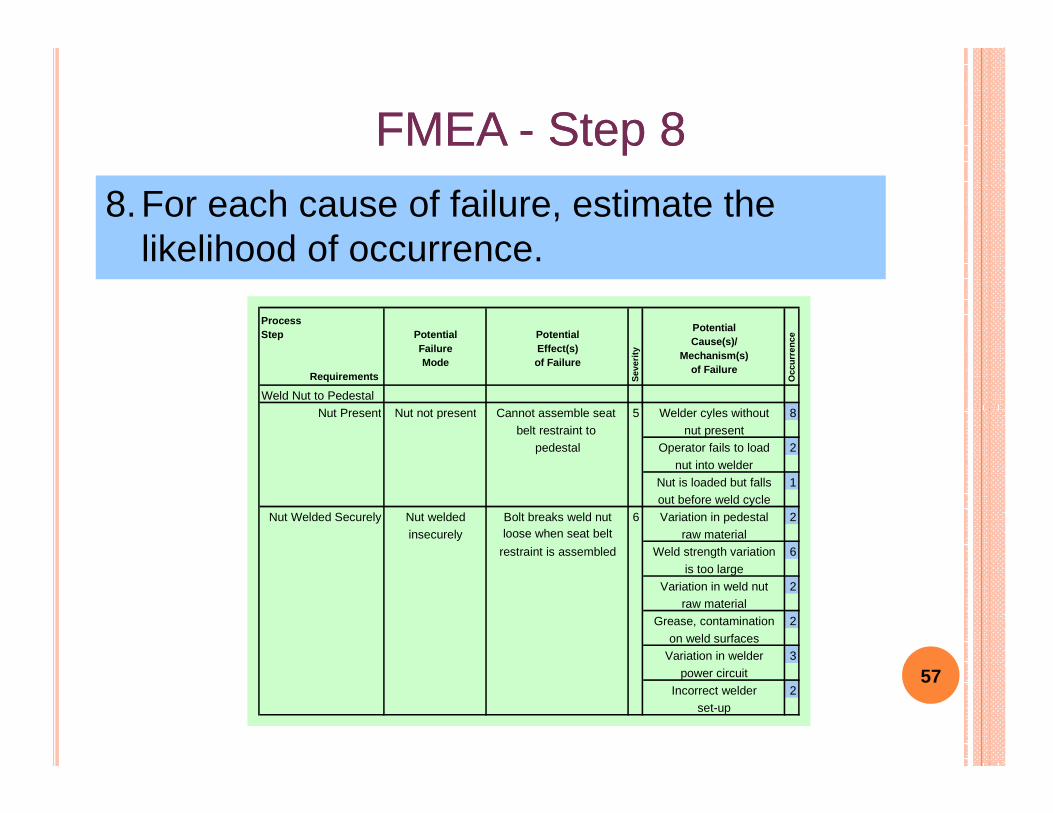
FMEA FMEA -- Step 8Step 8
8.For each cause of failure, estimate the likelihood of occurrence.
ProcessStep
Requirements
PotentialFailureMode
PotentialEffect(s)of Failure
Sev
erity
PotentialCause(s)/
Mechanism(s)of Failure
Occ
urre
nce
Weld Nut to Pedestal
Nut Present Nut not present Cannot assemble seat 5 Welder cyles without 8
57
Nut Present Nut not present Cannot assemble seat 5 Welder cyles without 8
belt restraint to nut presentpedestal Operator fails to load 2
nut into welder
Nut is loaded but falls 1out before weld cycle
Nut Welded Securely Nut welded Bolt breaks weld nut 6 Variation in pedestal 2
insecurely loose when seat belt raw materialrestraint is assembled Weld strength variation 6
is too large
Variation in weld nut 2raw material
Grease, contamination 2
on weld surfacesVariation in welder 3
power circuit
Incorrect welder 2set-up
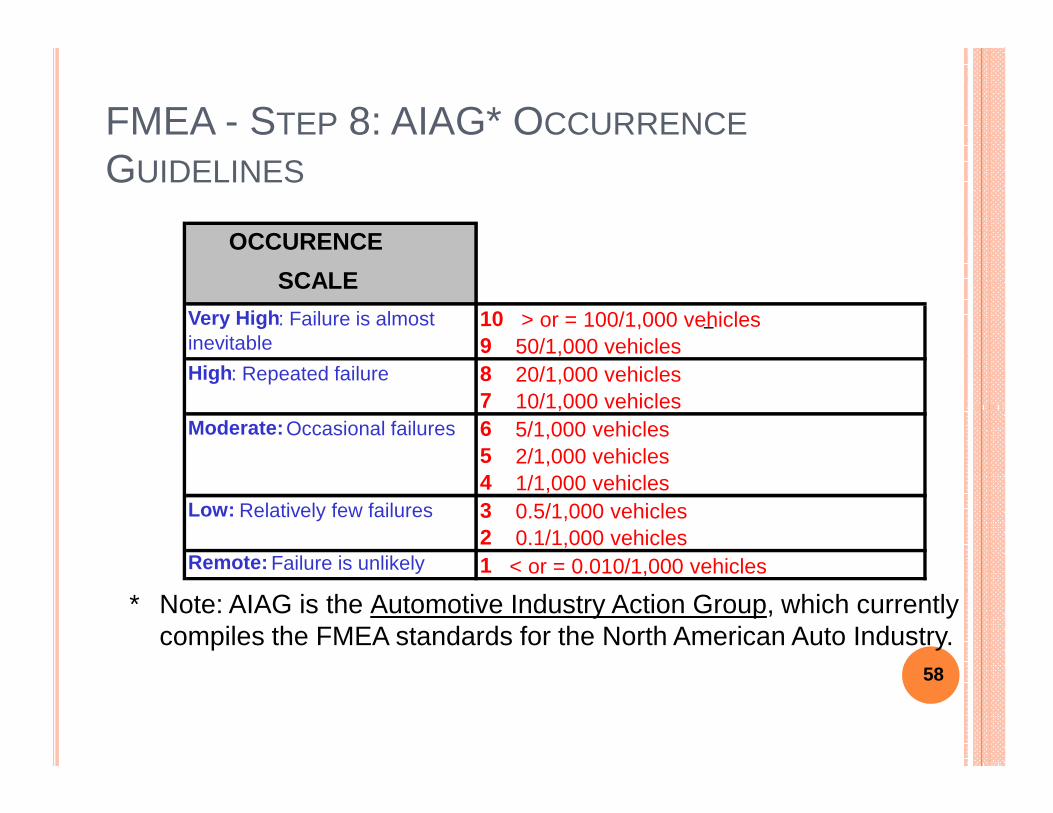
FMEA - STEP 8: AIAG* OCCURRENCE
GUIDELINES
OCCURENCE
SCALE OCCURENCE SCALE
10 > or = 100/1,000 vehicles9 50/1,000 vehicles8 20/1,000 vehicles7 10/1,000 vehicles
Very High : Failure is almost inevitable
High : Repeated failure
* Note: AIAG is the Automotive Industry Action Group, which currently compiles the FMEA standards for the North American Auto Industry.
7 10/1,000 vehicles6 5/1,000 vehicles5 2/1,000 vehicles4 1/1,000 vehicles3 0.5/1,000 vehicles2 0.1/1,000 vehicles
Remote: Failure is unlikely 1 < or = 0.010/1,000 vehicles
Moderate: Occasional failures
Low: Relatively few failures
58
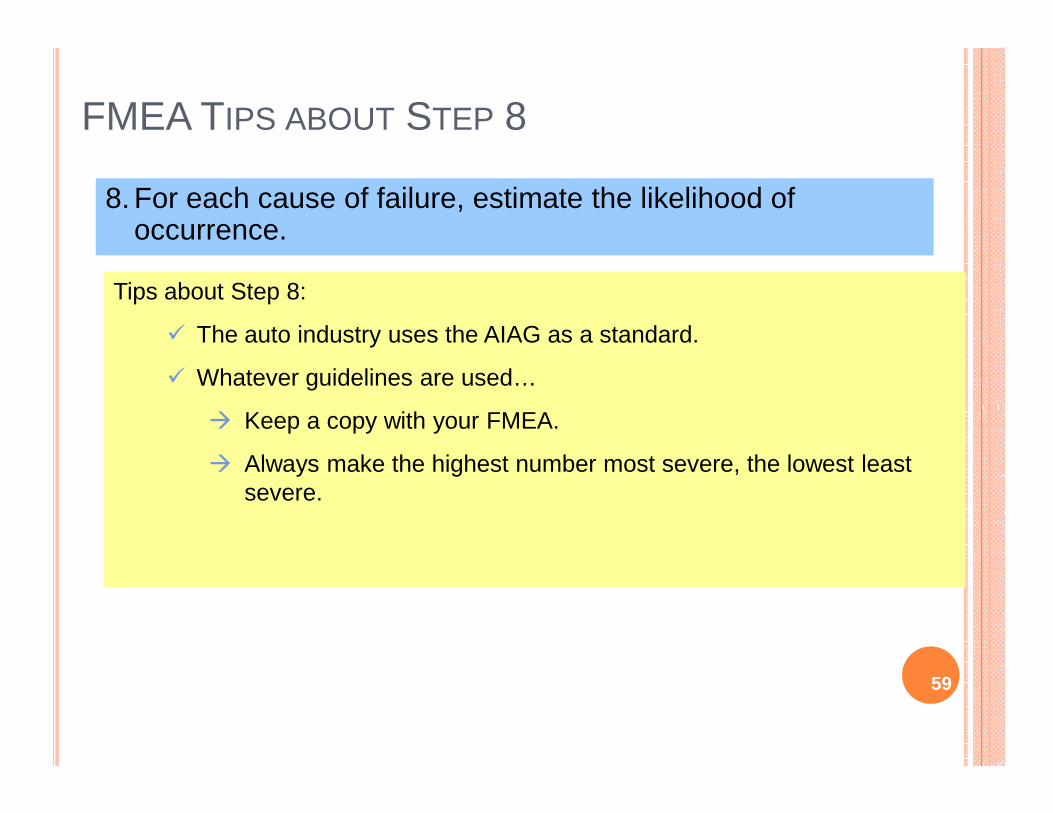
FMEA TIPS ABOUT STEP 8
8. For each cause of failure, estimate the likelihood of occurrence.
Tips about Step 8:
� The auto industry uses the AIAG as a standard.
� Whatever guidelines are used…
� Keep a copy with your FMEA.
� Always make the highest number most severe, the lowest least severe.
59
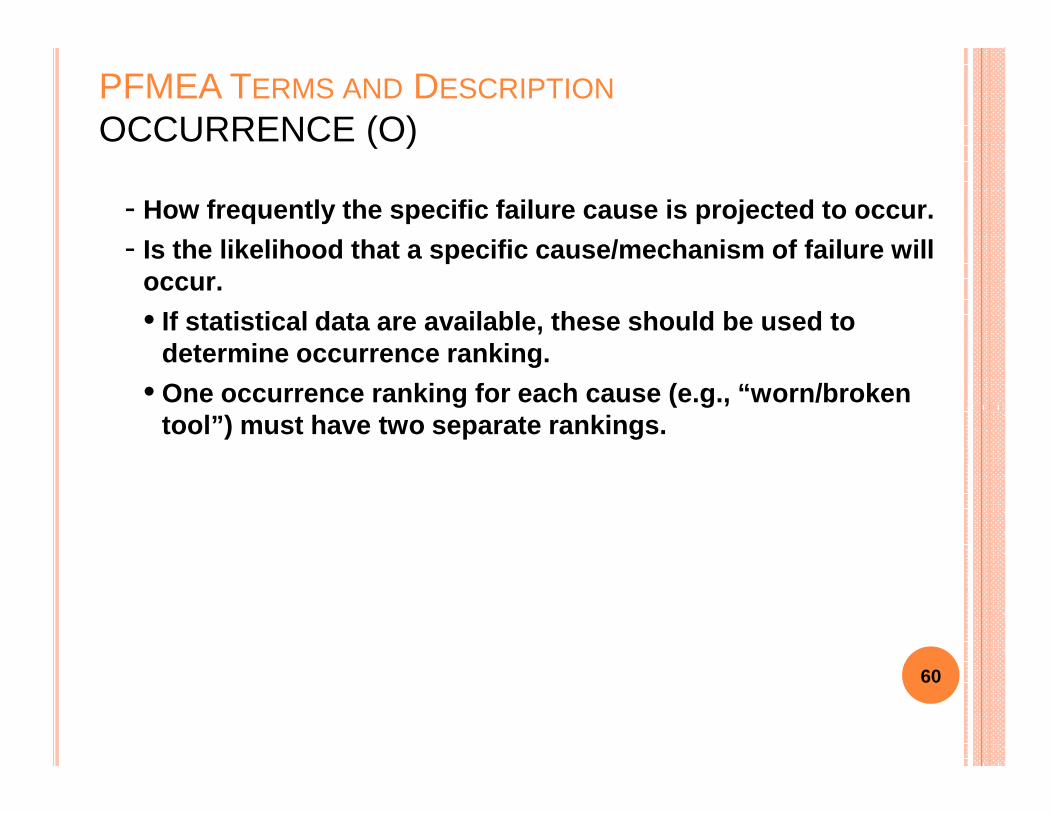
- How frequently the specific failure cause is projec ted to occur.
- Is the likelihood that a specific cause/mechanism o f failure will occur.
• If statistical data are available, these should be used to determine occurrence ranking.
• One occurrence ranking for each cause (e.g., “worn/ broken
PFMEA TERMS AND DESCRIPTION
OCCURRENCE (O)
• One occurrence ranking for each cause (e.g., “worn/ broken tool”) must have two separate rankings.
60
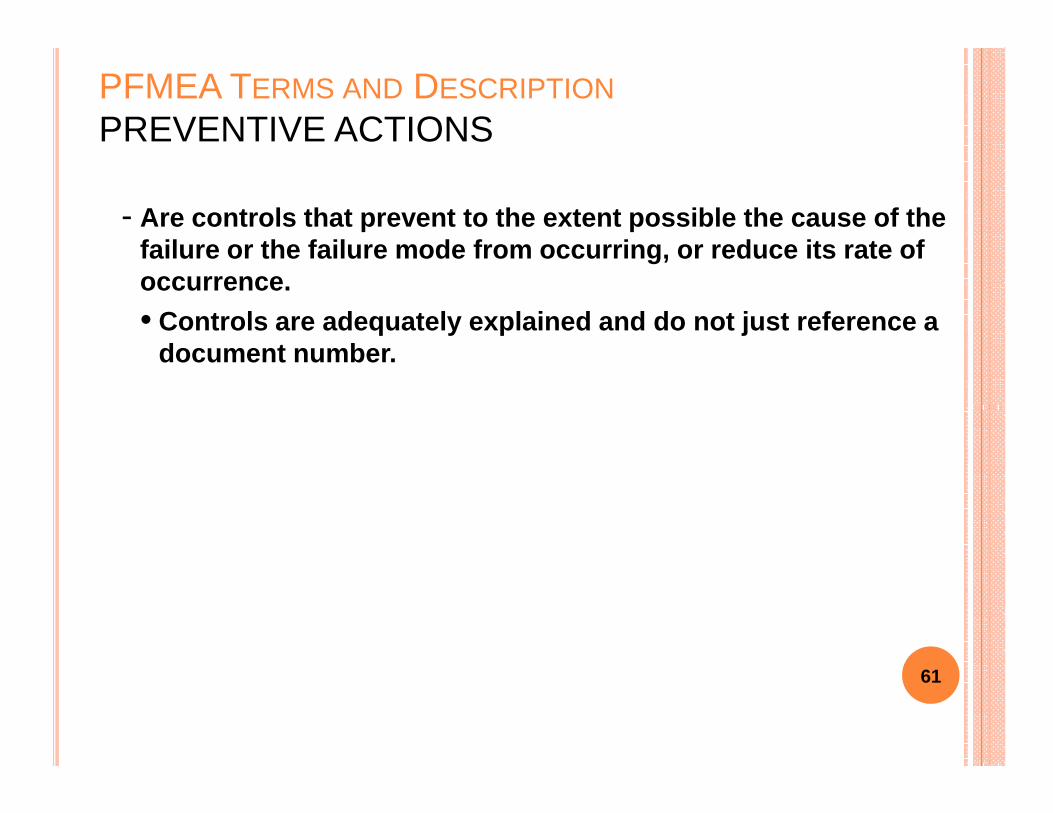
- Are controls that prevent to the extent possible th e cause of the failure or the failure mode from occurring, or redu ce its rate of occurrence.
• Controls are adequately explained and do not just r eference a document number.
PFMEA TERMS AND DESCRIPTION
PREVENTIVE ACTIONS
61
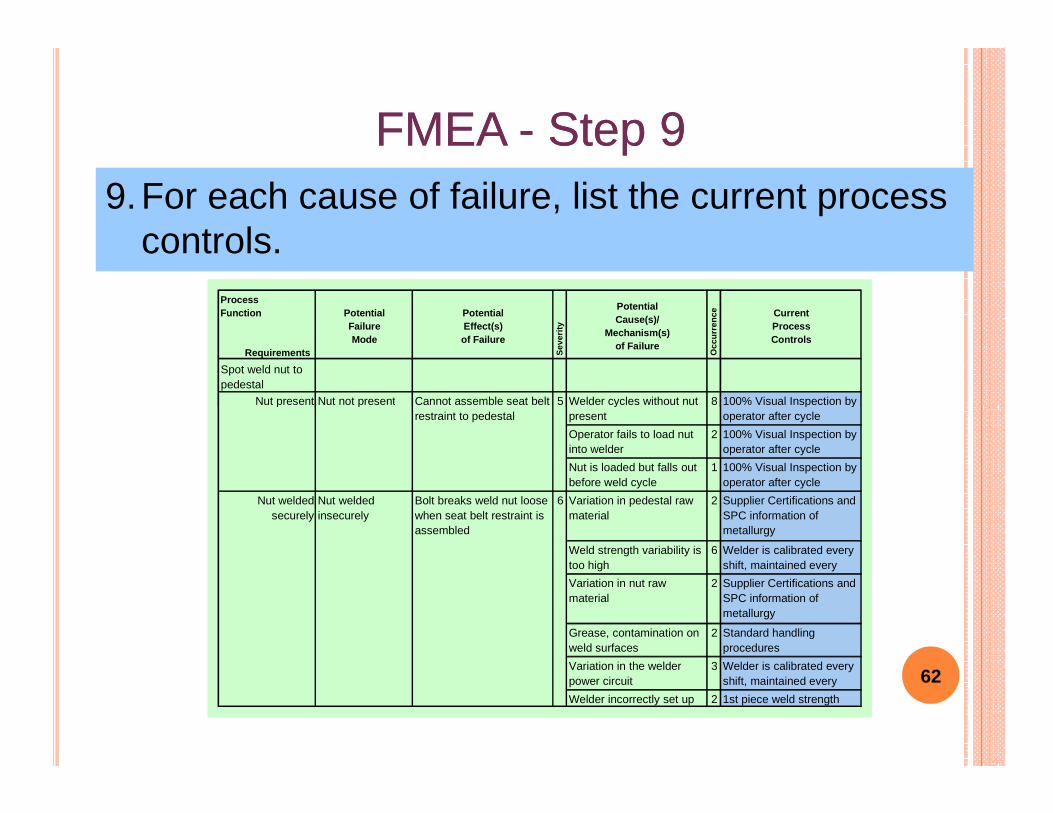
FMEA FMEA -- Step 9Step 99.For each cause of failure, list the current process
controls.ProcessFunction
Requirements
PotentialFailureMode
PotentialEffect(s)of Failure
Sev
erity
PotentialCause(s)/
Mechanism(s)of Failure
Occ
urre
nce Current
ProcessControls
Spot weld nut to pedestal
Nut present Nut not present Cannot assemble seat belt 5 Welder cycles without nut 8 100% Visual Inspection by
62
Nut present Nut not present Cannot assemble seat belt restraint to pedestal
5 Welder cycles without nut present
8 100% Visual Inspection by operator after cycle
Operator fails to load nut into welder
2 100% Visual Inspection by operator after cycle
Nut is loaded but falls out before weld cycle
1 100% Visual Inspection by operator after cycle
Nut weldedsecurely
Nut welded insecurely
Bolt breaks weld nut loose when seat belt restraint is assembled
6 Variation in pedestal raw material
2 Supplier Certifications and SPC information of metallurgy
Weld strength variability is too high
6 Welder is calibrated every shift, maintained every
Variation in nut raw material
2 Supplier Certifications and SPC information of metallurgy
Grease, contamination on weld surfaces
2 Standard handling procedures
Variation in the welder power circuit
3 Welder is calibrated every shift, maintained every
Welder incorrectly set up 2 1st piece weld strength
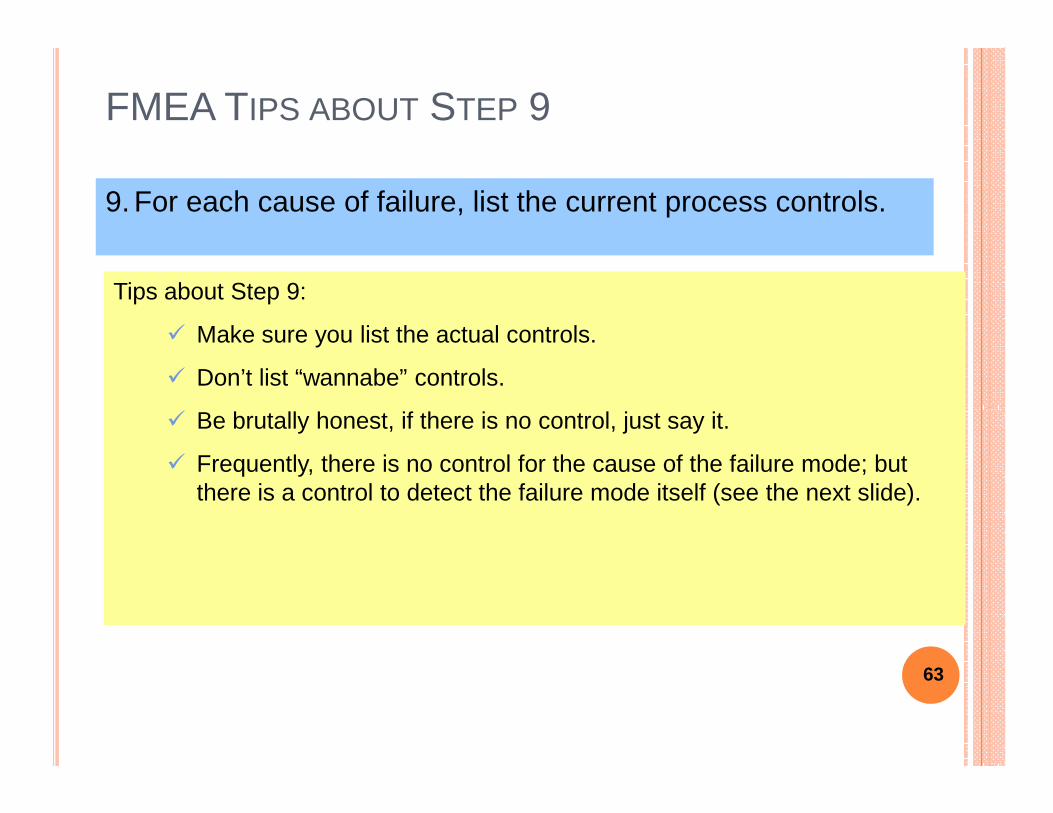
FMEA TIPS ABOUT STEP 9
9. For each cause of failure, list the current process controls.
Tips about Step 9:
� Make sure you list the actual controls.
� Don’t list “wannabe” controls.
� Be brutally honest, if there is no control, just say it.
� Frequently, there is no control for the cause of the failure mode; but there is a control to detect the failure mode itself (see the next slide).
63
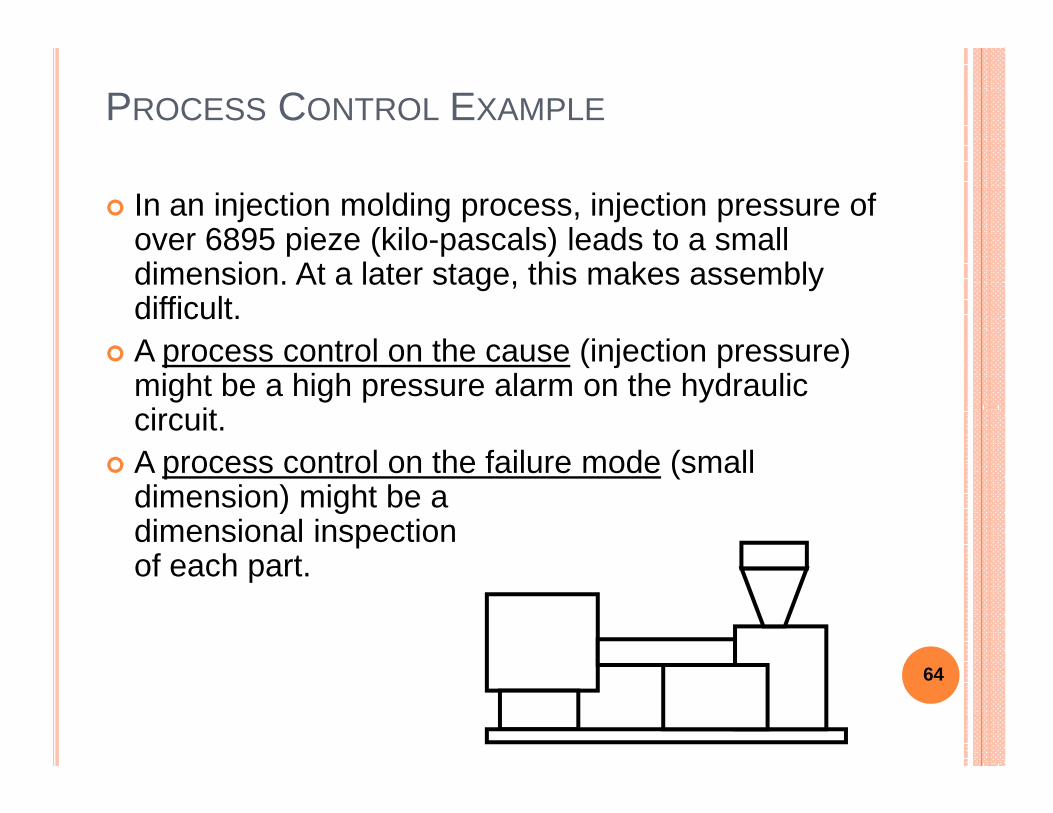
PROCESS CONTROL EXAMPLE
� In an injection molding process, injection pressure of over 6895 pieze (kilo-pascals) leads to a small dimension. At a later stage, this makes assembly difficult.
� A process control on the cause (injection pressure) might be a high pressure alarm on the hydraulic circuit.circuit.
� A process control on the failure mode (small dimension) might be a dimensional inspectionof each part.
64
- Identify the cause of the failure or the failure mo de, leading to the development of associated corrective action(s) or counter-measures.
PFMEA TERMS AND DESCRIPTION
DETECTION ACTION
65
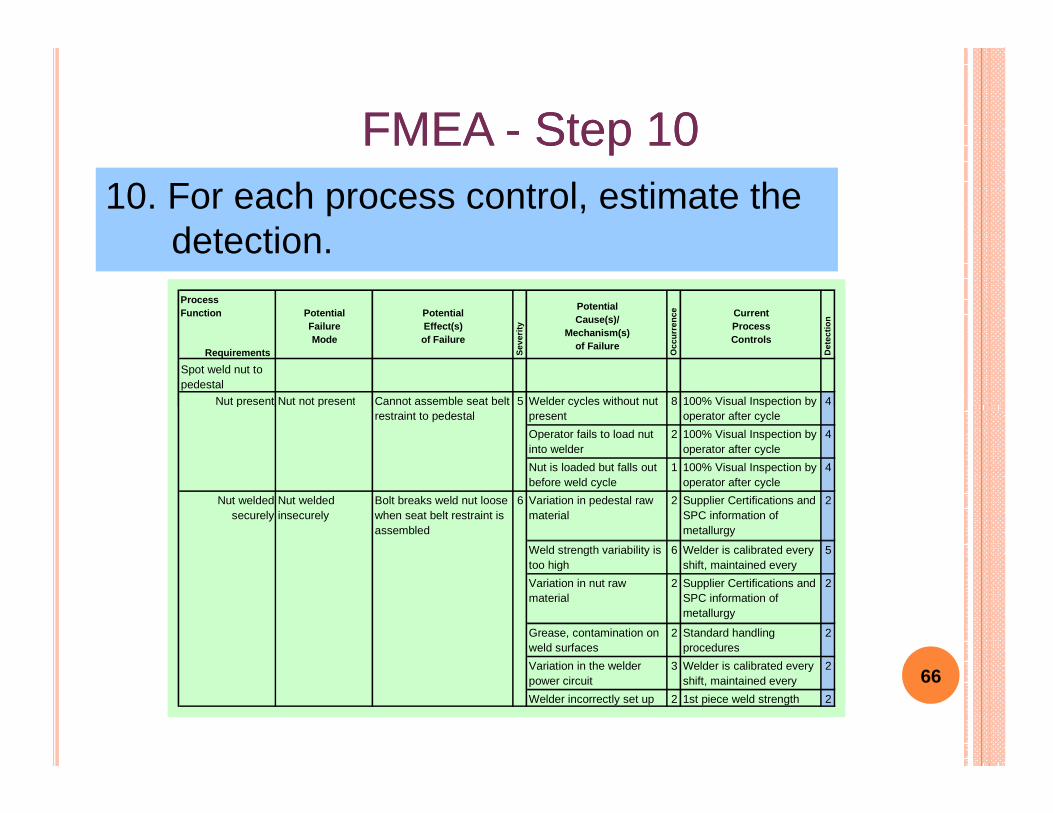
FMEA FMEA -- Step 10Step 1010. For each process control, estimate the
detection.ProcessFunction
Requirements
PotentialFailureMode
PotentialEffect(s)of Failure
Sev
erity
PotentialCause(s)/
Mechanism(s)of Failure
Occ
urre
nce Current
ProcessControls
Det
ectio
n
Spot weld nut to pedestal
Nut present Nut not present Cannot assemble seat belt 5 Welder cycles without nut 8 100% Visual Inspection by 4
66
Nut present Nut not present Cannot assemble seat belt restraint to pedestal
5 Welder cycles without nut present
8 100% Visual Inspection by operator after cycle
4
Operator fails to load nut into welder
2 100% Visual Inspection by operator after cycle
4
Nut is loaded but falls out before weld cycle
1 100% Visual Inspection by operator after cycle
4
Nut weldedsecurely
Nut welded insecurely
Bolt breaks weld nut loose when seat belt restraint is assembled
6 Variation in pedestal raw material
2 Supplier Certifications and SPC information of metallurgy
2
Weld strength variability is too high
6 Welder is calibrated every shift, maintained every
5
Variation in nut raw material
2 Supplier Certifications and SPC information of metallurgy
2
Grease, contamination on weld surfaces
2 Standard handling procedures
2
Variation in the welder power circuit
3 Welder is calibrated every shift, maintained every
2
Welder incorrectly set up 2 1st piece weld strength 2
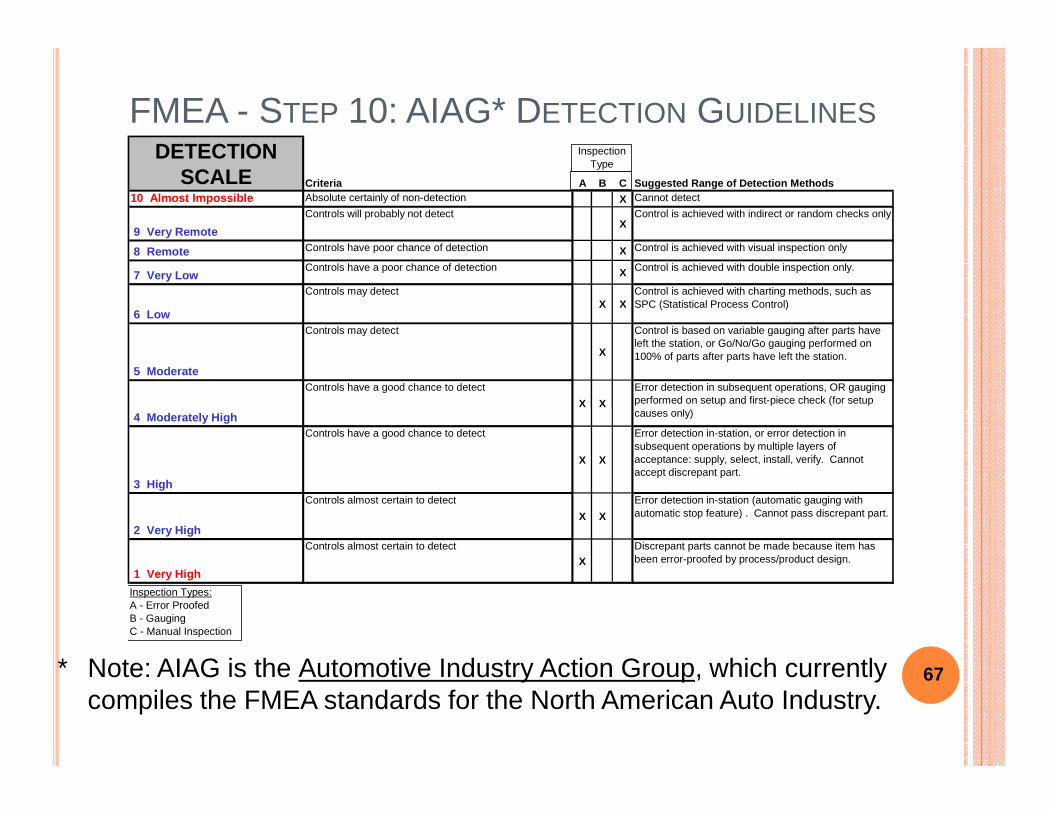
FMEA - STEP 10: AIAG* DETECTION GUIDELINESDETECTION
SCALE Criteria A B C Suggested Range of Detection Methods10 Almost Impossible Absolute certainly of non-detection X Cannot detect
9 Very Remote
Controls will probably not detectX
Control is achieved with indirect or random checks only
8 Remote Controls have poor chance of detection X Control is achieved with visual inspection only
7 Very LowControls have a poor chance of detection X Control is achieved with double inspection only.
6 Low
Controls may detect X X
Control is achieved with charting methods, such as SPC (Statistical Process Control)
5 Moderate
Controls may detect
X
Control is based on variable gauging after parts have left the station, or Go/No/Go gauging performed on 100% of parts after parts have left the station.
Controls have a good chance to detect
X X
Error detection in subsequent operations, OR gauging performed on setup and first-piece check (for setup
InspectionType
* Note: AIAG is the Automotive Industry Action Group, which currently compiles the FMEA standards for the North American Auto Industry.
4 Moderately HighX X
causes only)
3 High
Controls have a good chance to detect
X X
Error detection in-station, or error detection in subsequent operations by multiple layers of acceptance: supply, select, install, verify. Cannot accept discrepant part.
2 Very High
Controls almost certain to detect
X X
Error detection in-station (automatic gauging with automatic stop feature) . Cannot pass discrepant part.
1 Very High
Controls almost certain to detect
XDiscrepant parts cannot be made because item has been error-proofed by process/product design.
Inspection Types:A - Error ProofedB - GaugingC - Manual Inspection
67
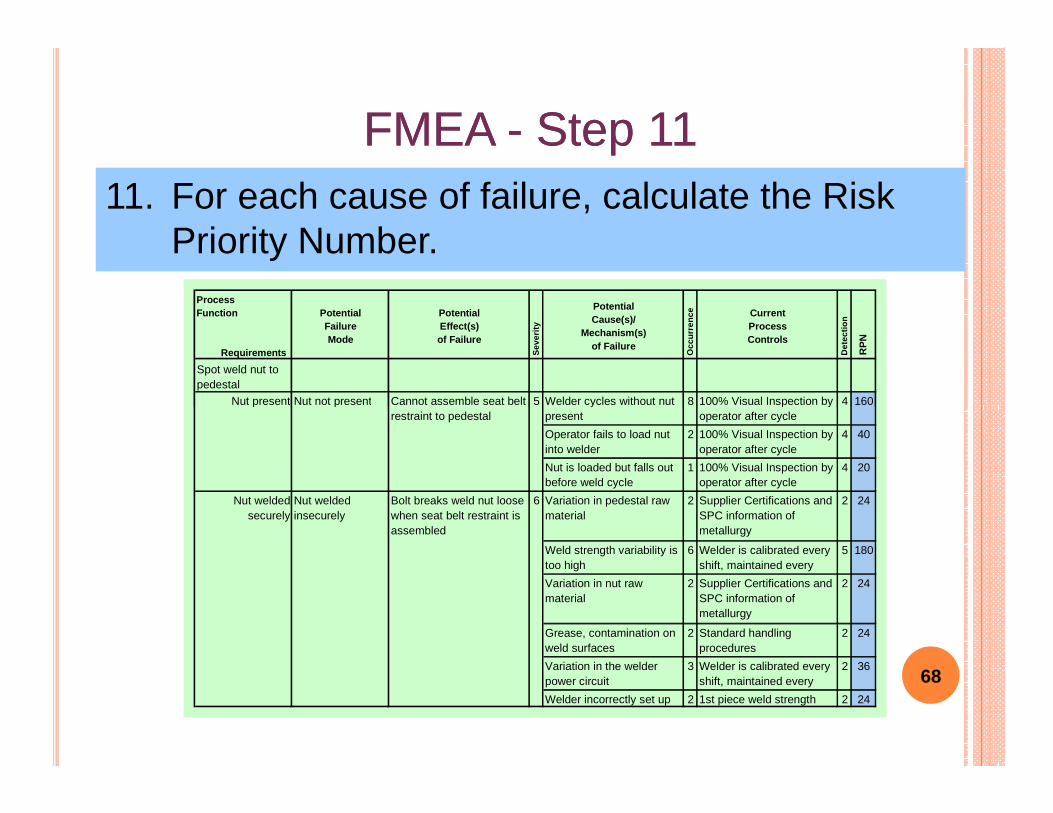
FMEA FMEA -- Step 11Step 1111. For each cause of failure, calculate the Risk
Priority Number.ProcessFunction
Requirements
PotentialFailureMode
PotentialEffect(s)of Failure
Sev
erity
PotentialCause(s)/
Mechanism(s)of Failure
Occ
urre
nce Current
ProcessControls
Det
ectio
n
RP
N
Spot weld nut to pedestal
Nut present Nut not present Cannot assemble seat belt 5 Welder cycles without nut 8 100% Visual Inspection by 4 160
68
Nut present Nut not present Cannot assemble seat belt restraint to pedestal
5 Welder cycles without nut present
8 100% Visual Inspection by operator after cycle
4 160
Operator fails to load nut into welder
2 100% Visual Inspection by operator after cycle
4 40
Nut is loaded but falls out before weld cycle
1 100% Visual Inspection by operator after cycle
4 20
Nut weldedsecurely
Nut welded insecurely
Bolt breaks weld nut loose when seat belt restraint is assembled
6 Variation in pedestal raw material
2 Supplier Certifications and SPC information of metallurgy
2 24
Weld strength variability is too high
6 Welder is calibrated every shift, maintained every
5 180
Variation in nut raw material
2 Supplier Certifications and SPC information of metallurgy
2 24
Grease, contamination on weld surfaces
2 Standard handling procedures
2 24
Variation in the welder power circuit
3 Welder is calibrated every shift, maintained every
2 36
Welder incorrectly set up 2 1st piece weld strength 2 24
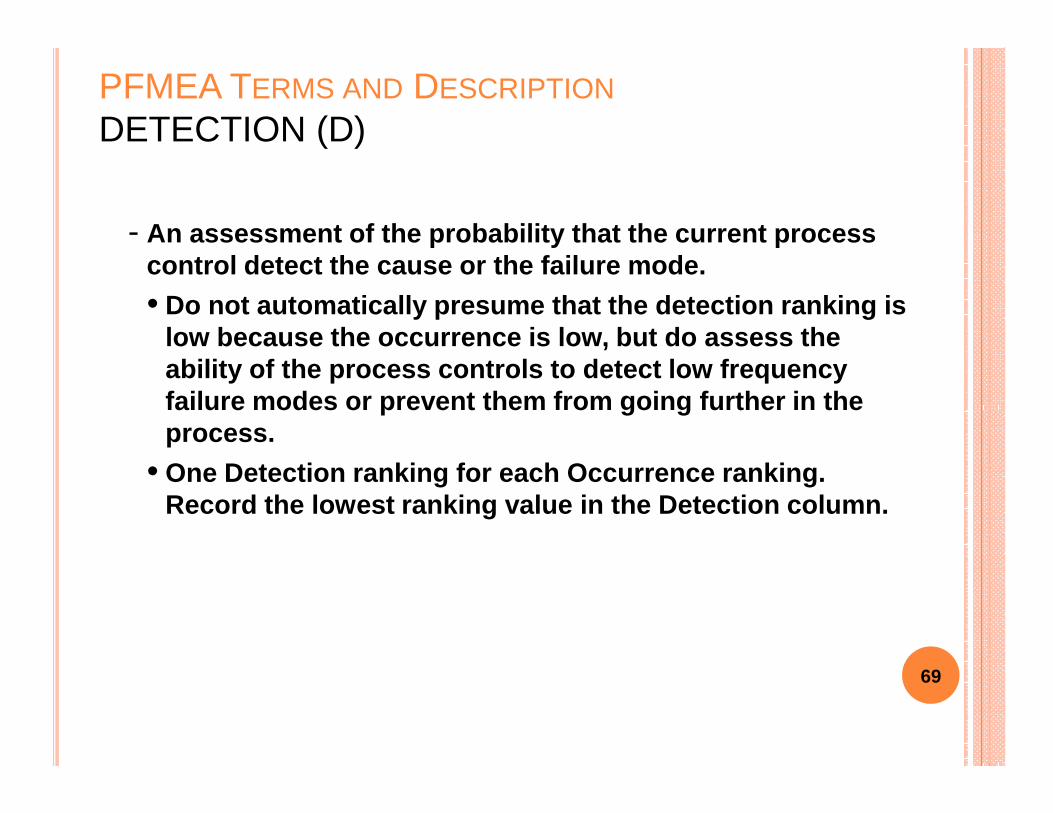
- An assessment of the probability that the current p rocess control detect the cause or the failure mode.
• Do not automatically presume that the detection ran king is low because the occurrence is low, but do assess th e ability of the process controls to detect low frequ ency failure modes or prevent them from going further in the
PFMEA TERMS AND DESCRIPTION
DETECTION (D)
failure modes or prevent them from going further in the process.
• One Detection ranking for each Occurrence ranking. Record the lowest ranking value in the Detection co lumn.
69
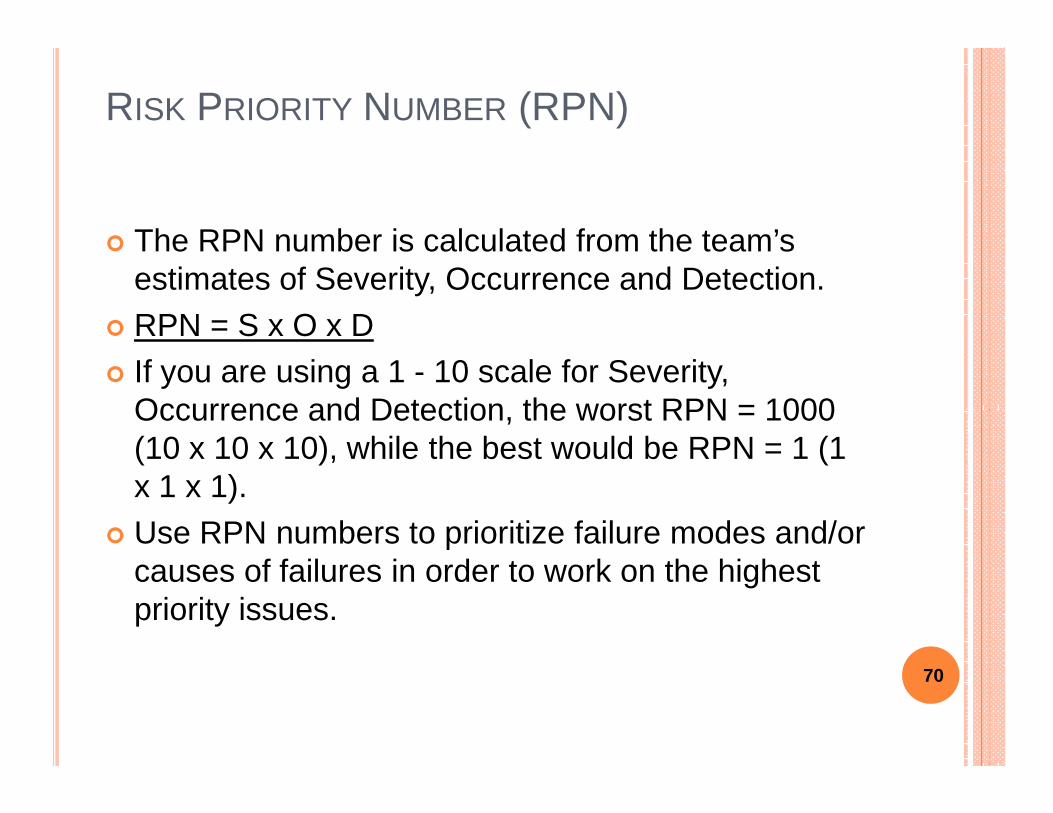
RISK PRIORITY NUMBER (RPN)
� The RPN number is calculated from the team’s estimates of Severity, Occurrence and Detection.
� RPN = S x O x D
� If you are using a 1 - 10 scale for Severity, Occurrence and Detection, the worst RPN = 1000 Occurrence and Detection, the worst RPN = 1000 (10 x 10 x 10), while the best would be RPN = 1 (1 x 1 x 1).
� Use RPN numbers to prioritize failure modes and/or causes of failures in order to work on the highest priority issues.
70

FMEA TIPS ABOUT STEP 11
11. For each cause of failure, calculate the Risk Priority Number.
Tips about Step 11:
� Any failure mode with a severity of 9 or 10 must be identified as high priority regardless of the RPN.priority regardless of the RPN.
� Addressing the highest RPNs is more important than setting an actual target (all RPNs < 150, for example).
� Teams are all different, so different teams will obtain different RPNs.
� Use the high RPNs to identify critical issues (failure modes, causes of failures, key process inputs).
71
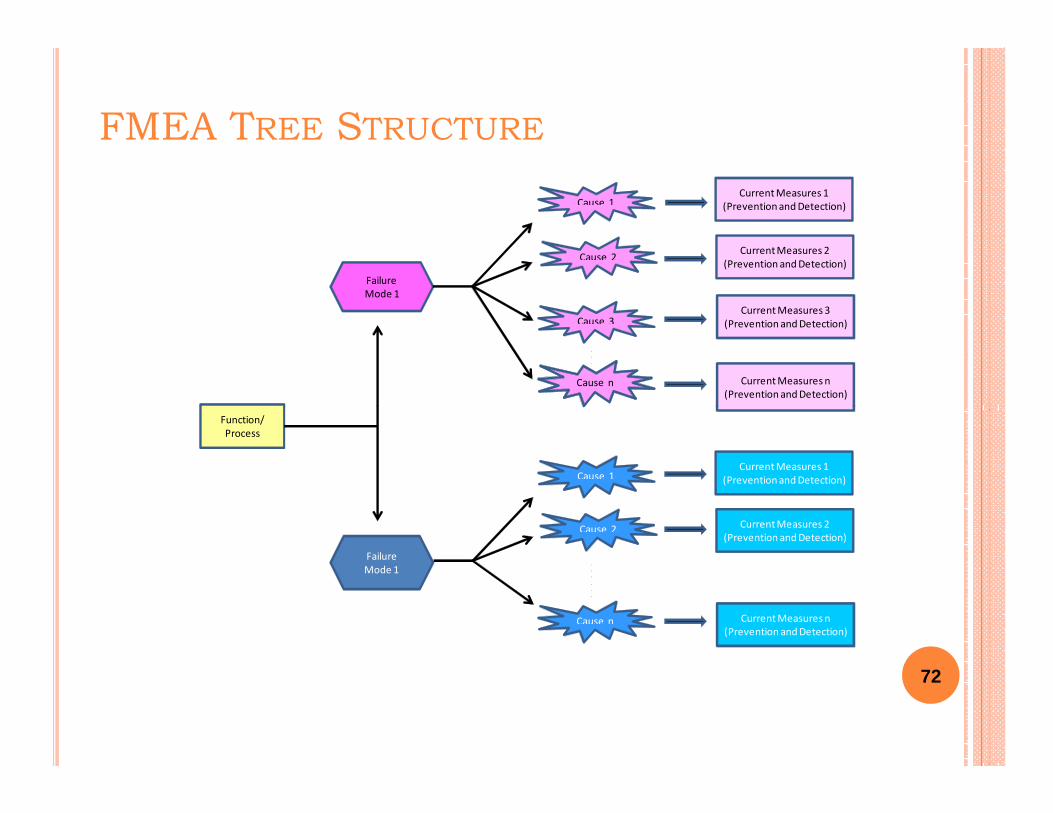
FMEA TREE STRUCTURE
.
.
.
Failure
Mode 1
Cause 2
Cause 1
Cause 3
Cause n
Current Measures 1
(Prevention and Detection)
Current Measures 2
(Prevention and Detection)
Current Measures 3
(Prevention and Detection)
Current Measures n
(Prevention and Detection)
72
.
.
.
.
.
.
Function/
Process
Failure
Mode 1
Cause 2
Cause 1
Cause n
Current Measures 1
(Prevention and Detection)
Current Measures 2
(Prevention and Detection)
Current Measures n
(Prevention and Detection)
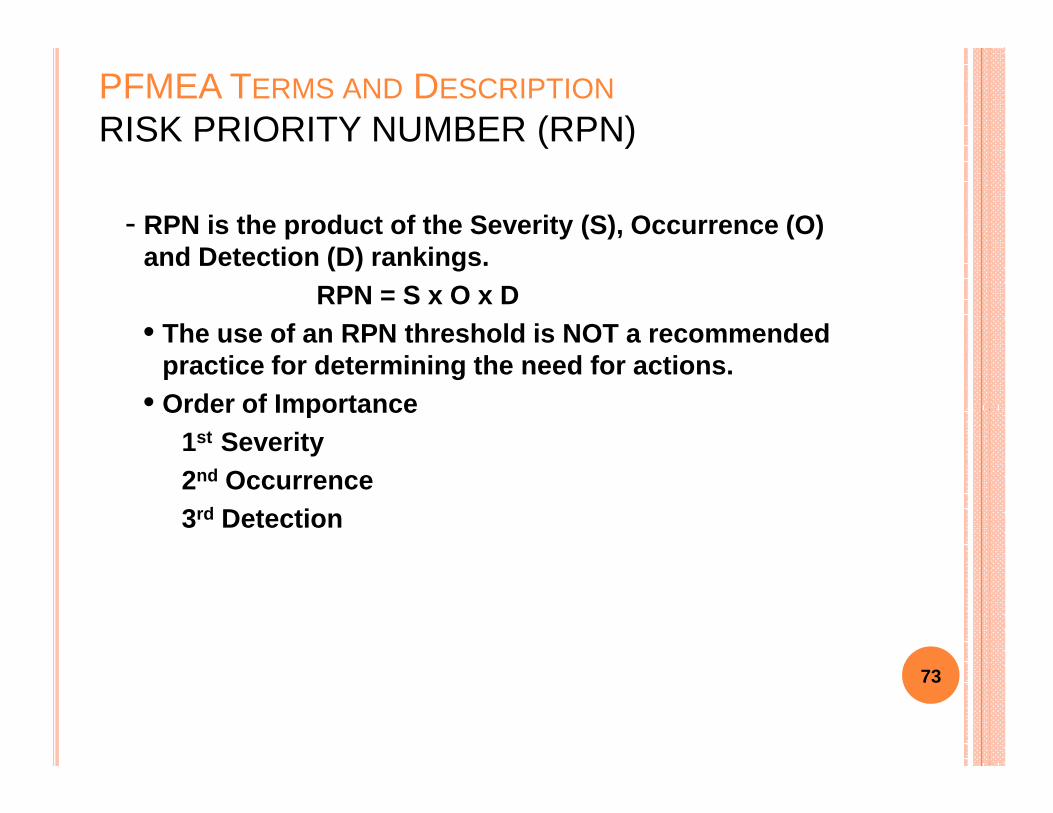
- RPN is the product of the Severity (S), Occurrence (O) and Detection (D) rankings.
RPN = S x O x D• The use of an RPN threshold is NOT a recommended
practice for determining the need for actions.• Order of Importance
PFMEA TERMS AND DESCRIPTION
RISK PRIORITY NUMBER (RPN)
• Order of Importance1st Severity2nd Occurrence3rd Detection
73
Johnson Controls, Inc. ©
January 2006
W2F
ME
AforS
ixSigm
a.ppt
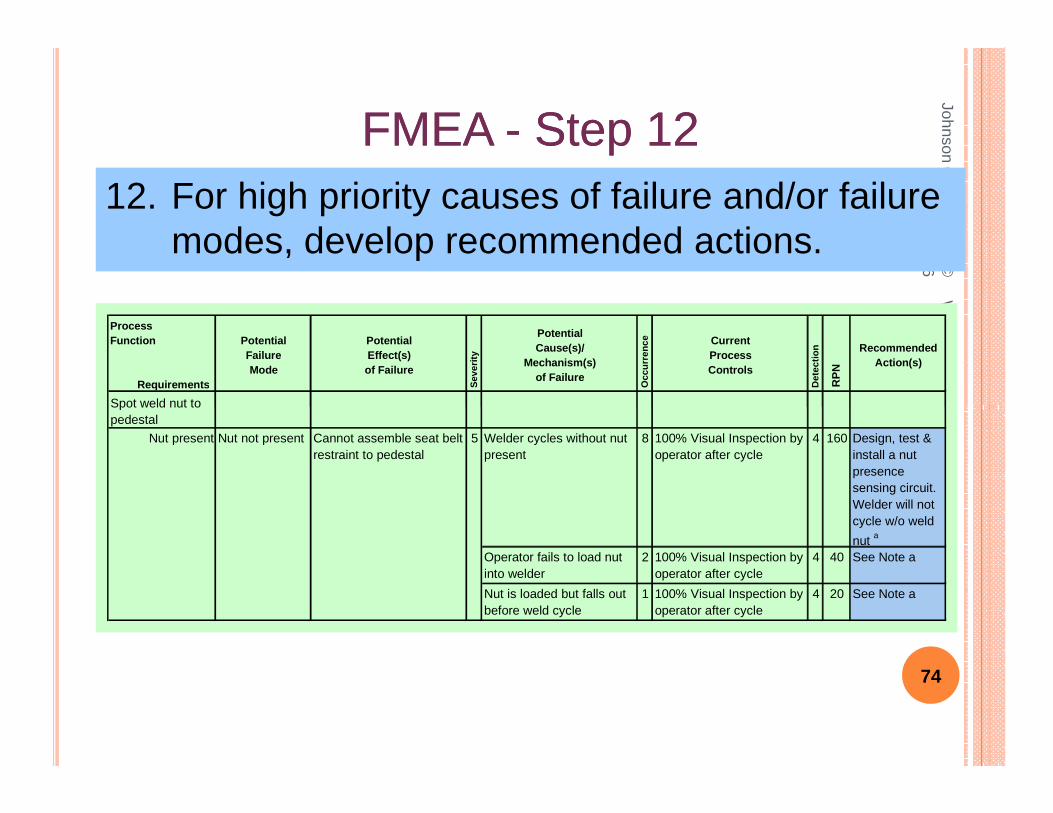
FMEA FMEA -- Step 12Step 1212. For high priority causes of failure and/or failure
modes, develop recommended actions.
ProcessFunction
Requirements
PotentialFailureMode
PotentialEffect(s)of Failure
Sev
erity
PotentialCause(s)/
Mechanism(s)of Failure
Occ
urre
nce Current
ProcessControls
Det
ectio
n
RP
N
RecommendedAction(s)
Spot weld nut to
W2F
ME
AforS
ixSigm
a.ppt
74
Spot weld nut to pedestal
Nut present Nut not present Cannot assemble seat belt restraint to pedestal
5 Welder cycles without nut present
8 100% Visual Inspection by operator after cycle
4 160 Design, test & install a nut presence sensing circuit. Welder will not cycle w/o weld
nut a
Operator fails to load nut into welder
2 100% Visual Inspection by operator after cycle
4 40 See Note a
Nut is loaded but falls out before weld cycle
1 100% Visual Inspection by operator after cycle
4 20 See Note a
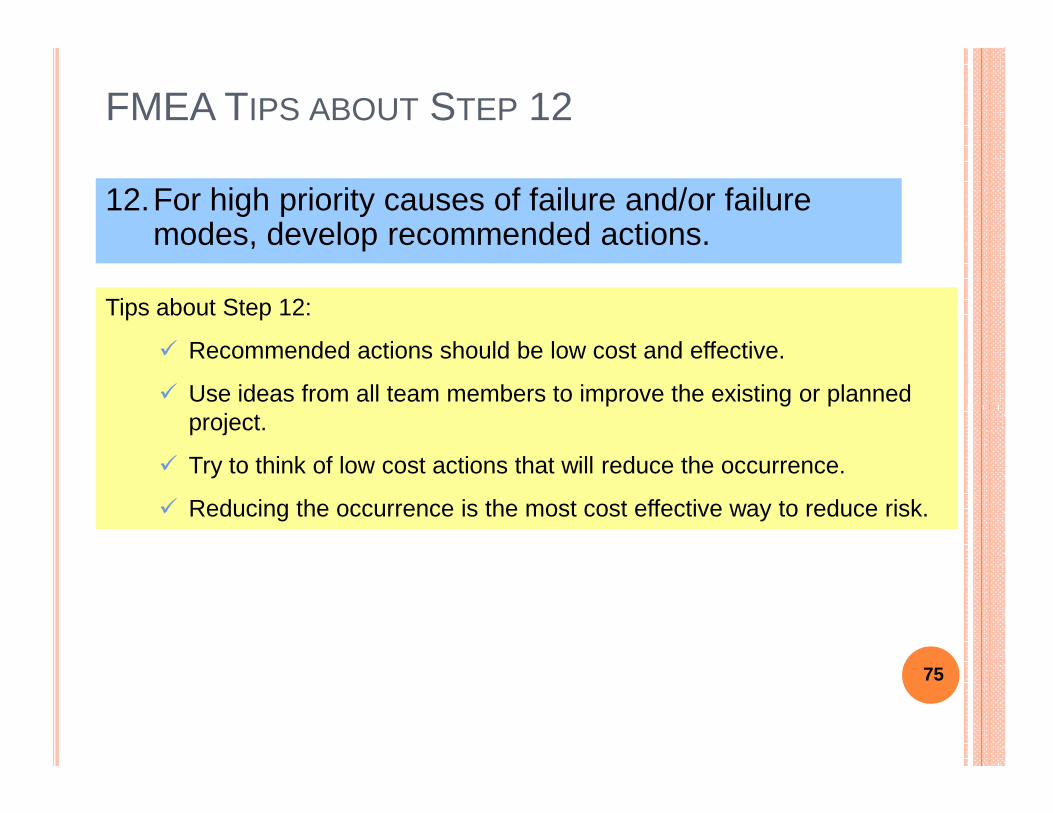
FMEA TIPS ABOUT STEP 12
12.For high priority causes of failure and/or failure modes, develop recommended actions.
Tips about Step 12:
� Recommended actions should be low cost and effective.
� Use ideas from all team members to improve the existing or planned project.
� Try to think of low cost actions that will reduce the occurrence.
� Reducing the occurrence is the most cost effective way to reduce risk.
75

W2F
ME
AforS
ixSigm
a.ppt
FMEA FMEA -- Step 13Step 1313. For each recommended action, assign
responsibility and completion dates.
ProcessFunction
Requirements
PotentialFailureMode
PotentialEffect(s)of Failure
Sev
erity
PotentialCause(s)/
Mechanism(s)of Failure
Occ
urre
nce Current
ProcessControls
Det
ectio
n
RP
N
RecommendedAction(s)
Responsibility& Target
Completion Date
Spot weld nut to pedestal
Nut present Nut not present Cannot assemble seat belt 5 Welder cycles without nut 8 100% Visual Inspection by 4 160 Design, test & Mark, 4/15/96 c
W2F
ME
AforS
ixSigm
a.ppt
76
Nut present Nut not present Cannot assemble seat belt restraint to pedestal
5 Welder cycles without nut present
8 100% Visual Inspection by operator after cycle
4 160 Design, test & install a nut presence sensing circuit. Welder will not cycle w/o weld
nut a
Mark, 4/15/96 c
Operator fails to load nut into welder
2 100% Visual Inspection by operator after cycle
4 40 See Note a See above, note c
Nut is loaded but falls out before weld cycle
1 100% Visual Inspection by operator after cycle
4 20 See Note a See above, note c

FMEA FMEA -- Step 14Step 1414. For each recommended action, implement the
action and note its effect.
ProcessFunction
Requirements
PotentialFailureMode
PotentialEffect(s)of Failure
Sev
erity
PotentialCause(s)/
Mechanism(s)of Failure O
ccur
renc
e CurrentProcessControls
Det
ectio
n
RP
N
RecommendedAction(s)
Responsibility& Target
Completion DateActionsTaken
Spot weld nut to pedestal
Nut present Nut not present Cannot assemble seat belt 5 Welder cycles without nut 8 100% Visual Inspection by 4 160 Design, test & Mark, 4/15/96 c Circuit installed
Action Results
77
Nut present Nut not present Cannot assemble seat belt restraint to pedestal
5 Welder cycles without nut present
8 100% Visual Inspection by operator after cycle
4 160 Design, test & install a nut presence sensing circuit. Welder will not cycle w/o weld
nut a
Mark, 4/15/96 c Circuit installed
on 4/12/96. 10,000 welds-no problem. Circuit added to
welder design e
Operator fails to load nut into welder
2 100% Visual Inspection by operator after cycle
4 40 See Note a See above, note c
See above, note e
Nut is loaded but falls out before weld cycle
1 100% Visual Inspection by operator after cycle
4 20 See Note a See above, note c
See above, note e

• The intent of any recommended action is to reduce r ankings in the following order: severity occurrence and det ection.
PFMEA TERMS AND DESCRIPTION
RECOMMENDED ACTION(S)
RESPONSIBILITY & TARGET COMPLETION DATE
78
RESPONSIBILITY & TARGET COMPLETION DATE
• Name of the individual and organization responsible for completing each recommended action including the ta rget completion date.
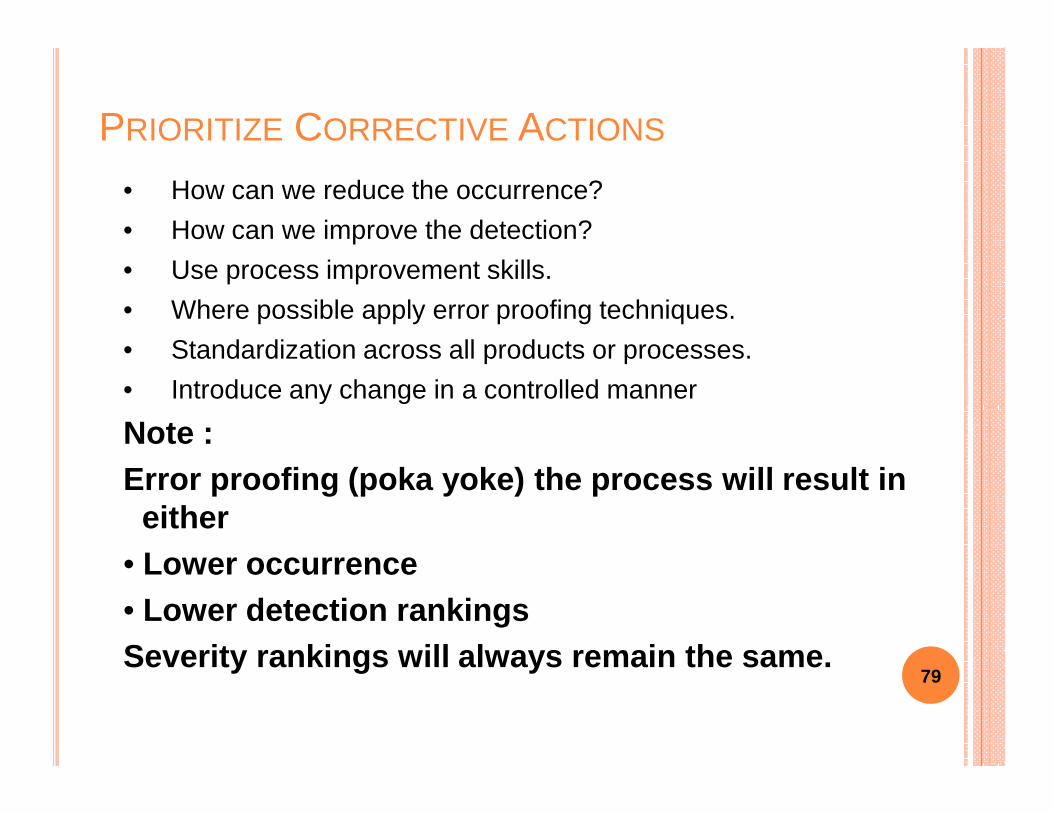
• How can we reduce the occurrence?
• How can we improve the detection?
• Use process improvement skills.
• Where possible apply error proofing techniques.
• Standardization across all products or processes.
• Introduce any change in a controlled manner
PRIORITIZE CORRECTIVE ACTIONS
Note :Error proofing (poka yoke) the process will result in
either• Lower occurrence• Lower detection rankingsSeverity rankings will always remain the same.
79
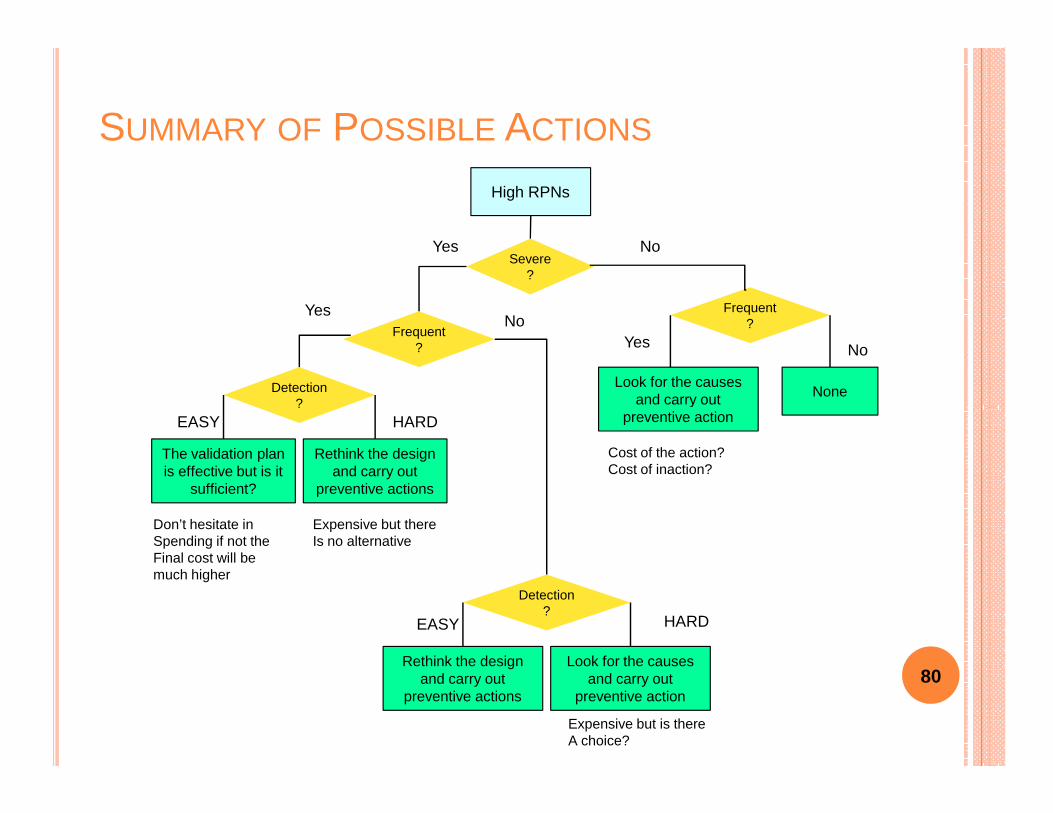
SUMMARY OF POSSIBLE ACTIONS
High RPNs
Severe?
Frequent ?
Frequent?
Detection?
No
No
NoYes
Yes
Yes
Look for the causes and carry out None
80
?
Detection?
EASY HARD
HARDEASY
Rethink the design and carry out
preventive actions
The validation plan is effective but is it
sufficient?
Don’t hesitate in Spending if not the Final cost will be much higher
Expensive but there Is no alternative
Rethink the design and carry out
preventive actions
Look for the causes and carry out
preventive action
Expensive but is there A choice?
and carry out preventive action
Cost of the action?Cost of inaction?
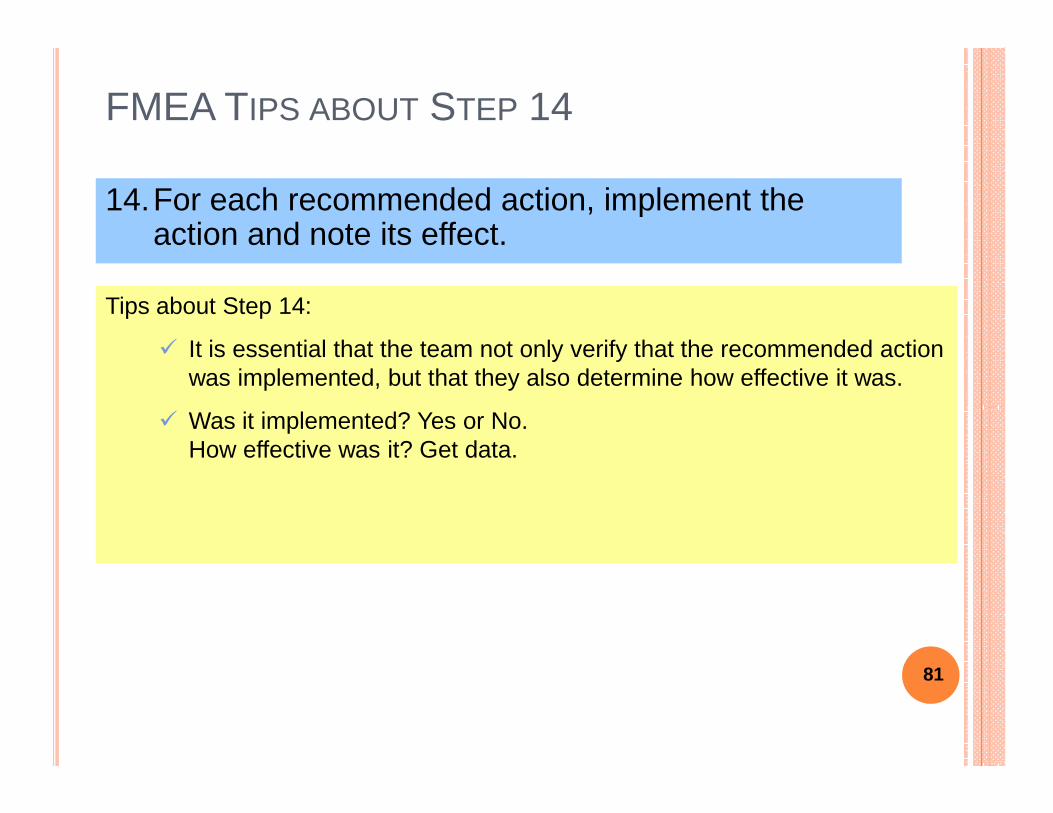
FMEA TIPS ABOUT STEP 14
14.For each recommended action, implement the action and note its effect.
Tips about Step 14:
� It is essential that the team not only verify that the recommended action was implemented, but that they also determine how effective it was.
� Was it implemented? Yes or No.How effective was it? Get data.
81

FMEA FMEA -- Step 15Step 1515. For each implemented action, re-estimate the
severity, occurrence and detection rankings and recalculate the RPN.
ProcessFunction Potential
FailurePotentialEffect(s)
Sev
erity
PotentialCause(s)/
Occ
urre
nce Current
Process
Det
ectio
n RecommendedResponsibility
& Target Actions
Action ResultsAction ResultsAction Results
82
Requirements
FailureMode
Effect(s)of Failure
Sev
erity
Cause(s)/Mechanism(s)
of Failure
Occ
urre
nce
ProcessControls
Det
ectio
n
RP
N
RecommendedAction(s)
& TargetCompletion Date
ActionsTaken
Sev
Occ
Det
RP
N
Spot weld nut to pedestal
Nut present Nut not present Cannot assemble seat belt restraint to pedestal
5 Welder cycles without nut present
8 100% Visual Inspection by operator after cycle
4 160 Design, test & install a nut presence sensing circuit. Welder will not cycle w/o weld
nut a
Mark, 4/15/96 c Circuit installed on 4/12/96. 10,000 welds-no problem. Circuit added to
welder design e
5 1 1 5
Operator fails to load nut into welder
2 100% Visual Inspection by operator after cycle
4 40 See Note a See above, note c
See above, note e
5 1 1 5
Nut is loaded but falls out before weld cycle
1 100% Visual Inspection by operator after cycle
4 20 See Note a See above, note c
See above, note e
5 1 1 5
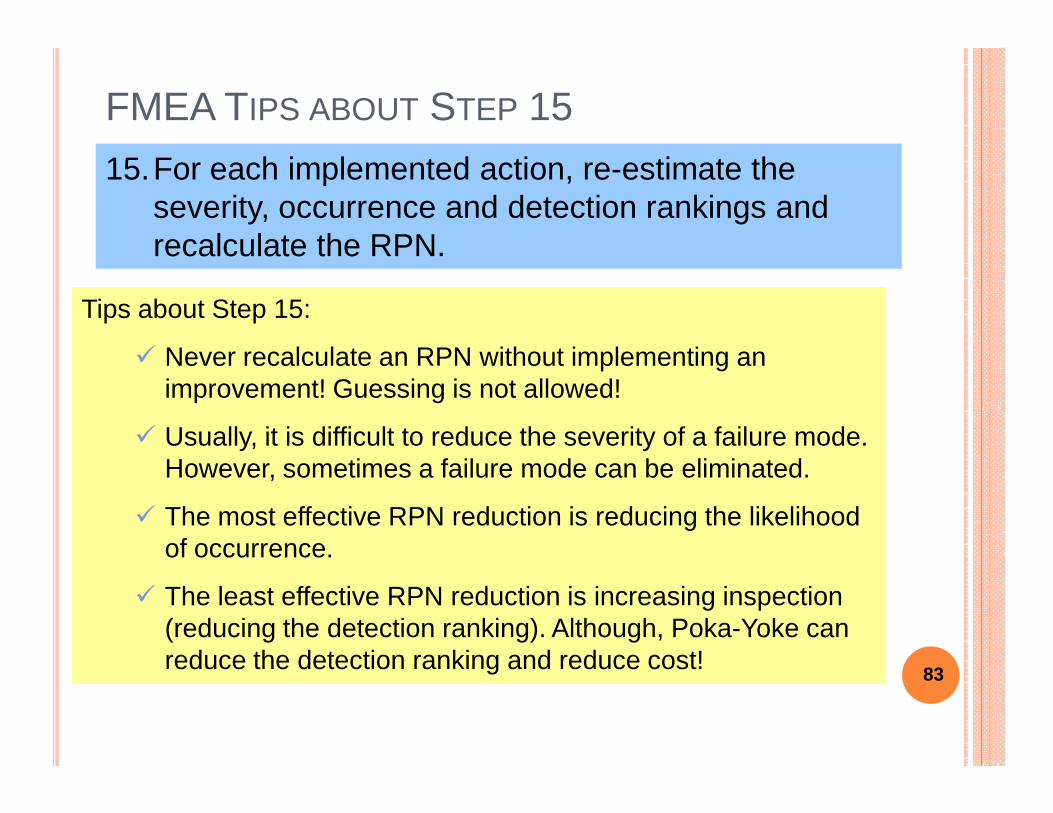
FMEA TIPS ABOUT STEP 15
15.For each implemented action, re-estimate the severity, occurrence and detection rankings and recalculate the RPN.
Tips about Step 15:
� Never recalculate an RPN without implementing an improvement! Guessing is not allowed!
� Usually, it is difficult to reduce the severity of a failure mode. However, sometimes a failure mode can be eliminated.
� The most effective RPN reduction is reducing the likelihood of occurrence.
� The least effective RPN reduction is increasing inspection (reducing the detection ranking). Although, Poka-Yoke can reduce the detection ranking and reduce cost!
83
- Identifies the results of any completed actions and their effect on S, O, D rankings and RPN.
PFMEA TERMS AND DESCRIPTION
ACTION RESULTS
84
FMEA “TIPS”� Make it a “team effort.”
� Analyze new processes to avoid problems before they happen.
� Analyze existing processes to find and fix problems.
� Analyze existing processes to discover the high priority � Analyze existing processes to discover the high priority (“key”) process input variables.
� Work down the columns, not across.
� Keep it moving! Avoid paralysis by analysis.
85

WHAT TO DO
� Function comes from Functional Analysis, Functional Decomposition
� Potential Failure Mode comes from things that have gone wrong in the past, concerns of designers, and brainstorming. Possible considerations are partial brainstorming. Possible considerations are partial function, intermittent function, excess function.
� Potential Effects are consequences to the design, the user, and the environment. Safety and regulation noncompliance are critical issues.
86
WHAT TO DO
� Potential Causes of failure should be engineering related such as incorrect material, corrosion, wear and human related such as inexperience, misuse, etc.
� Current Design Controls are things like inspections, � Current Design Controls are things like inspections, testing, poke yoke, and other design checks that are intended to prevent the problem.
87

WHAT TO DO
� Assign values to Severity, Occurrence, and Detection using the tables on the next three pages.
� Determine the Risk Priority Number (Severity* Occurrence * Detection)
� Develop an action plan� Develop an action plan
� Implement an action plan
88
MAINTAINING PFMEAS
• PFMEA must be a LIVING document.
• Review regularly. (Annual review)
• Reassess rankings whenever changes are made to the product
and/or process. (Release of CRB)
• Add any new defects or potential problems when found. (8D Report,
89
• Add any new defects or potential problems when found. (8D Report,
Lessons Learned)
• All revised ratings should be reviewed and if further action is
considered necessary, repeat the analysis.
• The focus should always be on continuous improvemen t
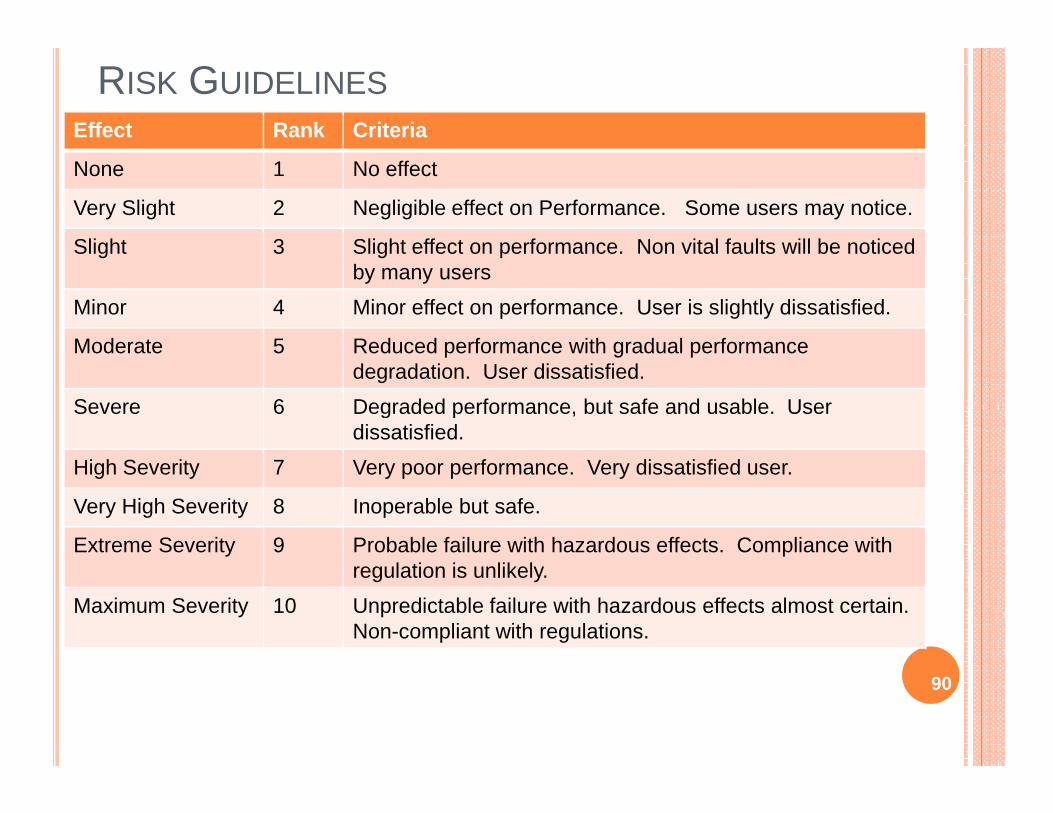
RISK GUIDELINESEffect Rank Criteria
None 1 No effect
Very Slight 2 Negligible effect on Performance. Some users may notice.
Slight 3 Slight effect on performance. Non vital faults will be noticed by many users
Minor 4 Minor effect on performance. User is slightly dissatisfied.
Moderate 5 Reduced performance with gradual performance degradation. User dissatisfied.
Severe 6 Degraded performance, but safe and usable. User Severe 6 Degraded performance, but safe and usable. User dissatisfied.
High Severity 7 Very poor performance. Very dissatisfied user.
Very High Severity 8 Inoperable but safe.
Extreme Severity 9 Probable failure with hazardous effects. Compliance with regulation is unlikely.
Maximum Severity 10 Unpredictable failure with hazardous effects almost certain. Non-compliant with regulations.
90
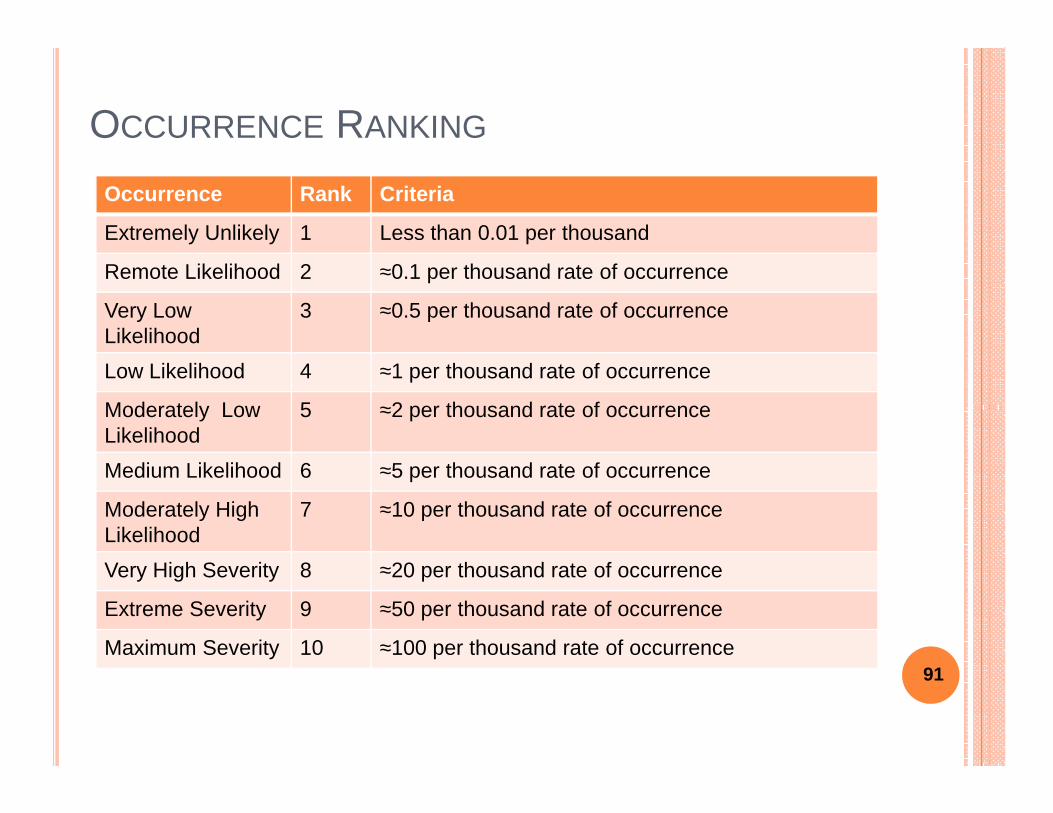
OCCURRENCE RANKING
Occurrence Rank Criteria
Extremely Unlikely 1 Less than 0.01 per thousand
Remote Likelihood 2 ≈0.1 per thousand rate of occurrence
Very Low Likelihood
3 ≈0.5 per thousand rate of occurrence
Low Likelihood 4 ≈1 per thousand rate of occurrence
Moderately Low 5 ≈2 per thousand rate of occurrenceModerately Low Likelihood
5 ≈2 per thousand rate of occurrence
Medium Likelihood 6 ≈5 per thousand rate of occurrence
Moderately High Likelihood
7 ≈10 per thousand rate of occurrence
Very High Severity 8 ≈20 per thousand rate of occurrence
Extreme Severity 9 ≈50 per thousand rate of occurrence
Maximum Severity 10 ≈100 per thousand rate of occurrence91
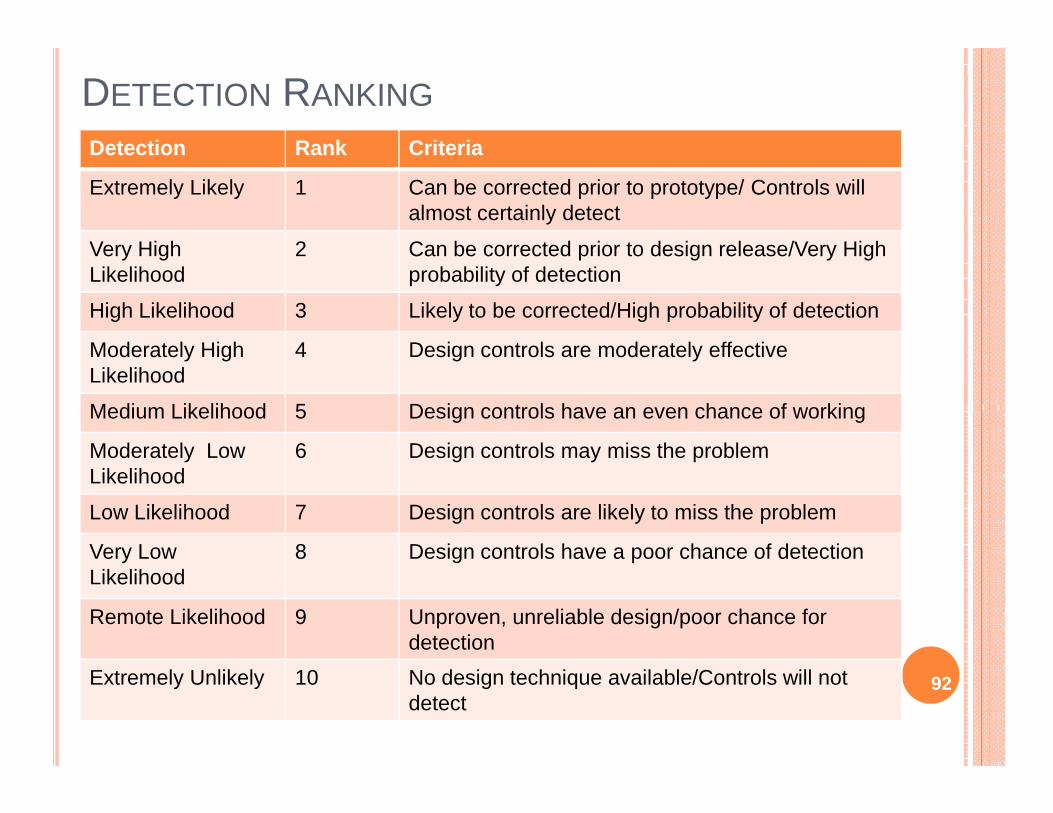
DETECTION RANKING
Detection Rank Criteria
Extremely Likely 1 Can be corrected prior to prototype/ Controls will almost certainly detect
Very High Likelihood
2 Can be corrected prior to design release/Very High probability of detection
High Likelihood 3 Likely to be corrected/High probability of detection
Moderately High Likelihood
4 Design controls are moderately effective
Medium Likelihood 5 Design controls have an even chance of workingMedium Likelihood 5 Design controls have an even chance of working
Moderately Low Likelihood
6 Design controls may miss the problem
Low Likelihood 7 Design controls are likely to miss the problem
Very Low Likelihood
8 Design controls have a poor chance of detection
Remote Likelihood 9 Unproven, unreliable design/poor chance for detection
Extremely Unlikely 10 No design technique available/Controls will not detect
92

Thank you for your attention
93


