1
2
FMS-TQ: combining smartphone and iBeacon 3
technologies in a transit quality survey 4
5
6
Corinna Li1, 3 7
(347) 863-5765; [email protected] 8
(Corresponding author) 9
10
P. Christopher Zegras1 11
(617) 452-2433; [email protected] 12
13
Fang Zhao2 14
(65) 6516 8603; [email protected] 15
16
Francisco Pereira3, 4 17
(617) 253-9729; [email protected] 18
Kalan Vishwanath Nawarathne2 19
(65) 6516 8603; [email protected] 20
21
Zhengquan Qin2 22
(65) 6516 8603; [email protected] 23
24
Moshe Ben-Akiva3 25
(617) 253-5324; [email protected] 26
27
Jinhua Zhao1 28
(617) 324-7594; [email protected] 29
30
1Massachusetts Institute of Technology 31
Department of Urban Studies and Planning 32
77 Massachusetts Avenue 7-346 Cambridge, MA 02139 33
34
2Singapore MIT Alliance for Research and Technology 35
1 CREATE Way, #09-01/02 CREATE Tower; 36
#01-13 Enterprise Wing, Singapore 138602 37
38
3Massachusetts Institute of Technology 39
Department of Civil Engineering 40
77 Massachusetts Avenue 1-290 Cambridge, MA 02139 41
42
4Technical University of Denmark (DTU) 43
Transport Department 44
2800 Kongens-Lyngby, Denmark 45
46
47
48
6,586 words + 5 figures + 4 tables= 8,836 words 49
50
Submitted on August 1, 2015 51
52
53
ABSTRACT 1
The Internet of Things (IoT) will offer transit agencies an opportunity to transform ways to 2
measure, monitor, and manage performance. We demonstrate the potential value of two 3
combined technologies, smartphones and iBeacons, for actively engaging customers in 4
measuring satisfaction and co-monitoring bus service quality. Specifically, we adapt our 5
smartphone-based survey system, Future Mobility Sensing (FMS), to connect with iBeacons for 6
an event-driven approach to measure user-reported satisfaction before (i.e. at the stop), during 7
(i.e., while traveling), and after (reflectively) transit trips. The system collects a combination of 8
sensor (GPS, WiFi, GSM and accelerometer) data to track transit trips, while soliciting users’ 9
feedback on trip experience with in-app pop-up surveys. Both bus trip data and passenger 10
feedback are collected and uploaded onto the server at the end of each day. These data are not 11
intended to replace traditional monitoring channels and processes, but, rather, they complement 12
official performance monitoring through a more customer-centric perspective in relative real-13
time. The paper presents the theoretical foundations, describes a pilot implementation of the 14
platform in Singapore, and discusses preliminary results that demonstrate technical feasibility. 15
Li et al 2
INTRODUCTION 1
As the digital age brings shifts in customer preferences and emerging business models to 2
urban mobility, these changes pose both challenges and opportunities for public transit 3
operators and regulators. Today’s transit riders, growingly more accustomed to the on-4
demand economy and customer-centric user experience, continue to hold transit services to 5
ever higher standards. In attempts to remain sensitive to consumers’ needs, service providers 6
need to pay more attention to proactively engaging customers to gather feedback and build 7
more personal relationships (1). These evolving new norms in the service sector come 8
increasingly at odds with the traditional methods and metrics for monitoring and evaluating 9
transit service quality. Customer satisfaction surveys, though common in the industry, are 10
administered too infrequently and by-and-large ask subjects to provide only general, overall 11
ratings. This abstractness not only reduces the possibility to pinpoint which trips are satisfactory 12
or unsatisfactory - and what characteristics might influence this outcome - it also shortchanges 13
the potential to use riders as higher-resolution sources of information on specific dimensions of 14
experienced service quality, hindering agencies from obtaining more spatially and temporally 15
precise results. 16
Mobile technology and digital platforms bear the potential to make intelligence gathering 17
more dynamic, effective, and engaging. The Internet of Things (IoT) brings the promise of a 18
widespread network of uniquely identifiable sensing and computing devices of different kinds, 19
able to communicate with each other. Such a vision brings opportunities and challenges for 20
transport applications, particularly in the realm of behavior sensing. One such device is the 21
iBeacon (2). In its simplest form, an iBeacon broadcasts continuously its unique ID to the 22
surrounding area, allowing devices such as smartphones to detect their co-location. Thus, an 23
iBeacon can be attached to a stop or a bus to serve as a “context identifier.” 24
In this pilot study, we combine the iBeacon technology with the Future Mobility Sensing 25
(FMS) (3, 4), a smartphone-based travel survey system developed by the Singapore-MIT Alliance 26
for Research and Technology (SMART). The iBeacons provide FMS with the additional 27
capability to detect users’ arrival at and departure from bus stops, thus allowing us to conduct 28
surveys on the transit experience as users are waiting, boarding, or completing their bus trips. 29
For each trip, users receive a single survey randomly selected from the set of three stages, 30
followed by a retrospective survey about the same trip at the end of day. These real-time and 31
retrospective survey responses enable comparisons between real-time and recalled levels of 32
satisfaction, potentially offering exploratory insights into the complexities of passenger 33
satisfaction and decision towards using transit. 34
This pilot is a proof-of-concept, aiming to test the technical feasibility to crowdsource 35
bus service monitoring and passenger satisfaction sensing. The pilot is conducted in 36
collaboration with the Land Transport Authority of Singapore (LTA). The key capabilities of 37
interest are 1) accurate and reliable detection of a passenger’s stage in the trip that requires 38
minimum user input from the user; and 2) gathering of meaningful, high-resolution feedback 39
down to the level of a given trip by an individual passenger. This paper is organized as follows: 40
we review related literature in the next section and then describe our technology. We 41
subsequently introduce the survey design and present and discuss the pilot results. 42
Li et al 3
LITERATURE REVIEW 1
In the public transit world, the concepts of service quality and customer satisfaction are closely 2
connected. Service quality represents transit performance from passengers’ perspectives (5, 6, 7), 3
and should reflect quantitative as well as qualitative measures (8, 9). Inherently customer-centric, 4
assessing quality of service thus entails gauging customer satisfaction, often through surveys (8). 5
The most common method for measuring service quality and customer satisfaction are 6
intercept surveys on board and at stops/stations. Of the 27 U.S. transit agencies and 7
Metropolitan Planning Organizations surveyed in 2006, three-quarters reported of using intercept 8
surveys, with two-third of which also supplementing with telephone interviews (10). This is 9
unsurprising, given the advantages of onboard and intercept surveys in gaining direct access to 10
transit customers and obtaining relatively representative samples (11). Questionnaires commonly 11
ask respondents to rate their satisfaction with overall transit service and its individual attributes: 12
wait time, reliability comfort, etc. (12, 13, 14, 15, 16). Agencies may also solicit passengers’ 13
reported importance of various service attributes (17). Evaluations are collected periodically, and 14
ratings are averaged to generate scores for historical comparisons. 15
The primary limitation of this report card approach is the incapability for ubiquitous, 16
detailed assessment and feedback (18, 19). In Adler et al’s (10) examination of survey practices, 17
only 30% of the agencies conducted customer satisfaction assessments more than once a year; 18
another 30% carried out such surveys less than once a year, and 20% had never done one. As a 19
result of the low frequency, questionnaires typically ask respondents for general ratings on various 20
aspects of the transit service, based on prior experiences (20). This puts transit regulators and 21
system administrators at a disadvantage in understanding how performance varies by driver, route, 22
and time of day, as well as in identifying the precise area for commendation and targeted 23
improvement (19). Of course, in-person questionnaires, administered during or after the ride, 24
could solicit trip-specific assessment, but their scopes would be quite limited. Transit experiences 25
can well vary from trip to trip, but it would not be realistic to deploy survey teams to every bus, 26
stop, and station every day. 27
The snapshot nature of traditional satisfaction surveys also calls into question the accuracy 28
and meaningfulness of data. People’s actual and recalled experiences often differ due to 29
psychological heuristics (21). Pedersen et al (22) recorded 62 volunteers’ predicted, experienced, 30
and remembered satisfaction of transit trips for a month, revealing that their recalled satisfaction 31
was significantly lower than experienced satisfaction. Abou-Zeid et al (23) observed a similar 32
bias, noting that subjects report lower satisfaction with transit after experiencing a commute by 33
automobile. This phenomenon implies two things. First, if we want to better capture riders’ transit 34
experience, surveying should be done as in real-time as possible, potentially even segmenting by 35
the waiting, on board, and post-alighting portions of the trip. Second, we have been ill-equipped 36
at understanding the relative importance of actual versus recalled customer experiences for the 37
health of the transit system. Should transit operators and regulators care more about the joys and 38
pains on a certain trip, or people’s overall, longer-lasting quality assessment? How do they 39
influence each other? 40
Given smartphone’s ubiquity and apps’ capacity to prompt data collection and transmit 41
information in real-time, smartphone-based survey systems hold great promise. Smartphone-based 42
surveys can be carried out without the need for mobilizing field surveyors, reducing the time and 43
cost of survey administration. They can also be deployed over extended periods of time and space, 44
enabling intra-day, inter-day and inter-seasonal assessments for numerous routes, stops, segments, 45
Li et al 4
etc. Carrel et al (20, 24) used an Android app (San Francisco Travel Quality Study) to examine the 1
relationship between objectively measured service quality (e.g. travel and wait times) and transit 2
riders’ satisfaction, emotions, and modal choice. During the month-long study, participants were 3
asked to use transit service on at least five days and fill out the corresponding daily in-app surveys 4
(for which they received a reminder every day). The app used Wi-Fi and cell tower positioning to 5
automatically record the user’s location information, which were then matched with the automatic 6
vehicle location data to infer transit trips. Using a BlackBerry OS-based app (TOES), Dunlop et al 7
(18) implemented a series of surveys to measure riders’ emotional state before, during, and after 8
each bus trip. Participants needed to manually signal the beginning of their trip and, subsequently, 9
each survey in the sequence; otherwise, they would be prompted by the app to complete the next 10
stage of the trip every six minutes. Undoubtedly, these two pioneering efforts generated invaluable 11
multi-day, real-time data for understanding transit experiences from the customers’ perspectives. 12
Given the extensive manual input required, however, these apps are unsuited for a sustainable 13
quality monitoring platform through rider feedback. 14
The existing literature on transit service quality and customer satisfaction reveals little 15
consensus on what to measure and how to measure it. And on the differences in measuring 16
perception and experience in-the-moment versus recalled. Studies have measured these concepts 17
with as few as six attributes (6) and as many as 31 components (25). Most studies fall between 8-22 18
factors (5, 7, 8, 9, 26, 27, 28, 29, 30, 31, 32). Of course, this diversity comes partially from varying 19
levels of specificity and ways to categorize the attributes; overlaps are common. Roughly, most of 20
the above literature encompass the following indicators: system coverage/accessibility, wait time, 21
travel time, transfers, onboard comfort and crowding, customer service, information availability, 22
safety, and stop and station facilities. 23
The general concept of service quality offers a framework to help contextualize and define 24
transit service metrics. The most widely applied approaches in market research are SERVQUAL 25
(33) and SERVPERF (34). Though the two frameworks differ in the theory underlying customers’ 26
satisfaction, they both measure perceived quality of service with the same 22 specific indicators 27
along five dimensions: Reliability, Assurance, Tangibility, Empathy, and Responsiveness (RATER). 28
Many transit studies have been inspired by this five-dimension framework, adapting the indicators 29
to better fit special characteristics of transit services and of the local rider communities (19, 35, 36). 30
The “empathy” dimension is the trickiest, since the nature of mass transit services juxtaposes 31
intimate, one-to-one relationship-based services. Some scholars hence propose excluding the 32
“Empathy” category (37, 38) when assessing transit quality. We believe, however, that empathy can 33
still manifest through personal relationship-building: understanding the customers, seeking 34
feedback on their experiences and input for improvement. 35
FMS’ real-time surveying capability presents an opportunity to test another innovation – 36
measuring riders’ subjective well-being and happiness from transit experiences. Transit services aim 37
to improve people’s quality of life by providing access to work, education, and recreation, as well 38
as through improving the urban environment. Thus, surveys that effectively gauge riders’ well-being 39
could better reflect service quality than satisfaction reports. A number of studies have sought to 40
measure happiness and well-being from travelling (39, 40, 41, 42). In particular, Ettema et al. (43) 41
develop and test a measure consisting of a self-reported satisfaction with travel scale, an affective 42
mood scale, and a satisfaction with day scale. In modelling commute satisfaction, Abou-Zeid (44) 43
employs questionnaires that include questions on travelers’ affect (such as com- mute enjoyment and 44
stress), personality, and well-being. Ory and Mokhtarian (45) devise a set of questionnaires to 45
Li et al 5
predict people’s liking for travel based on attitude, personality, and lifestyle preferences. These 1
studies provide direct precedent to the design of mood, personality, and well-being-related questions 2
in our pilot. 3
In summary, considerable room exists to innovate in measuring and monitoring transit service 4
quality. With the aim of providing transit agencies and regulators with an innovative, yet practical 5
tool, one which is more real-time, granular, and actionable, we adopt a mobile-phone based 6
approach, using Future Mobility Sensing (FMS). 7
8
FUTURE MOBILITY SENSING - TRANSIT QUALITY (FMS-TQ) 9
With the vision of a practical tool in mind, we designed FMS-TQ to combine three objectives: (1) to 10
gather operational intelligence in a more real-time and granular fashion; (2) to more accurately 11
capture riders’ transit experience by enriching self-reported satisfaction with emotions and 12
happiness measures; and, (3) to pair real-time and retrospective surveys on any given trip. The 13
latter aims to shed further light on the study of perception and experience, improving our 14
understanding of the differences in measuring happiness as an in-the-moment versus a recalled 15
experience. 16
17
FMS technology 18
The Future Mobility Sensing platform (FMS) (3, 4) was developed for high-resolution longitudinal 19
travel surveys, primarily for activity-based modeling. Its original system architecture contains three 20
components: smartphone app; backend; web interface. 21
The smartphone app (currently in iOS or Android) has the role of collecting location (GPS, 22
WiFi, GSM), accelerometer data and some other information (e.g. battery level) on a continuous 23
basis. The goal is to capture all trip data, be it through motorized (car, bus, train, taxi, motorbike) or 24
non-motorized modes (walking, bicycle). The app is allowed to rest idle when the user is not 25
moving. A state machine algorithm in the app leverages transition events data from the 26
accelerometer and OS API events (e.g. Significant Location Change in iOS) to push notifications to 27
users. Besides collecting location data, the app is also responsible for uploading data to the backend 28
in batches, when the phone is charging. The backend server receives and stores the data and turns 29
them, in real time, into trip information (stops, trips, modes) using machine learning algorithms (46). 30
These data then supports a web interface that presents the user with a sketch of her day. A map, 31
together with an editable timeline with sequences of stops and trips, are available for users to 32
“validate" their data. For further details about FMS, please refer to earlier literature (3, 4). 33
For the FMS-TQ survey, we used only the smartphone and backend components of this 34
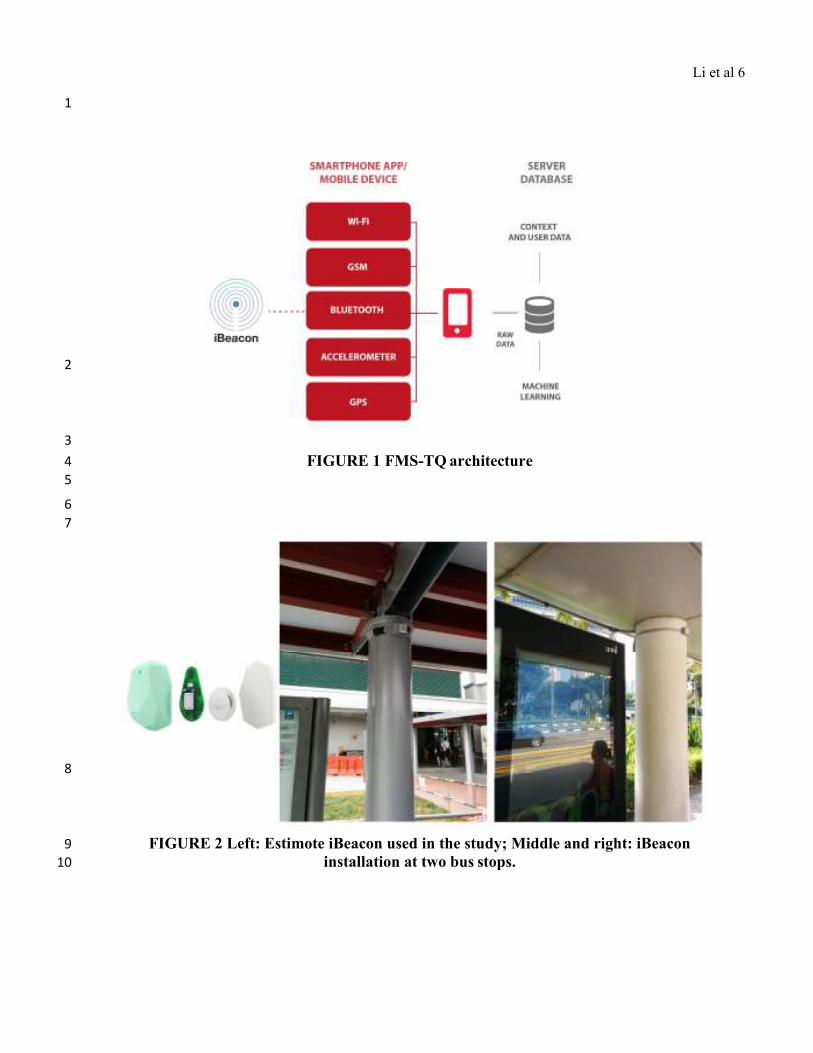
technology. Figure 1 depicts FMS-TQ architecture. 35
36
iBeacon extension 37
The iBeacon (2) is a small device that leverages low power Bluetooth transmission to 38
frequently broadcast its unique ID for a very long battery life. Current Android and iOS phones 39
are able to recognize such signals and identify the unique ID. When attached to a bus stop, an 40
iBeacon becomes a very simple yet high resolution method to enable smartphone apps to 41
determine users’ arrival to, waiting at and leaving from a bus stop. In our study, the weatherproof 42
iBeacons were mounted in a strapped pouch near the top of the bus stops (Figure 2); this set-up is to 43
maximize signal transmission and facilitate installation and removal without modifications to the 44
stop infrastructure. The iBeacons cost approximately USD 25 each, and have a reported battery life 45
of two years. 46
Li et al 6
1
2
3
FIGURE 1 FMS-TQ architecture 4
5
6
7
8
FIGURE 2 Left: Estimote iBeacon used in the study; Middle and right: iBeacon 9
installation at two bus stops. 10
Li et al 7
We extended FMS’ current state machine algorithm to consider two new events: iBeacon 1
entry event (detecting a known iBeacon) and iBeacon exit event (no longer detecting a known 2
iBeacon). These events are important for determining the present stage of a user’s bus trip, and, 3
correspondingly, the correct questionnaire to display in the app. We ran initial tests on the iBeacon 4
technology to measure the proximity accuracy (distance from the beacon) and the received signal 5
strength (rssi). Weaker signal strengths generally resulted in larger proximity accuracy values. 6
We also found that the rssi and proximity accuracy were affected by the number of people in 7
the surrounding environment. This relates to a well- known problem that human body interferes 8
with high frequency signals. This shortcoming should not affect our study much, given that 9
the FMS-TQ app only needs to detect the iBeacon as opposed to accurately determining its 10
location. We suspect, however, that the adverse effect would be more pronounced in overcrowding 11
conditions. 12
13
FIGURE 3 Effect of human body on accuracy (left) and on signal strength (right). 14
“Attenuation” denotes having one person between the iBeacon and the smartphone; on the 15
other hand, “no attenuation state” signify a clear line-of-sight. 16
17
From these tests, we concluded that line-of-sight transmission would maximize detection 18
accuracy. Hence, we decided to place iBeacons at high positions at bus stops. For this pilot, the 19
FMS-TQ uses iBeacons exclusively for real-time detection of bus stops, although the FMS 20
backend also possess similar capabilities non-real-time using users’ location data submitted by 21
the app. 22
23
FMS-TQ pilot survey 24
Survey design 25
The service attributes measured by FMS-TQ aim to be comprehensive and relevant to riders’ 26
bus experiences at each of the trip stages. Thus, we modified the RATER framework to 27
accommodate characteristics of bus services. We arrived at 17 factors, coalesced from the 28
European (EN 13816) and American standards (TCRP Reports 100 and 47) for transit service 29
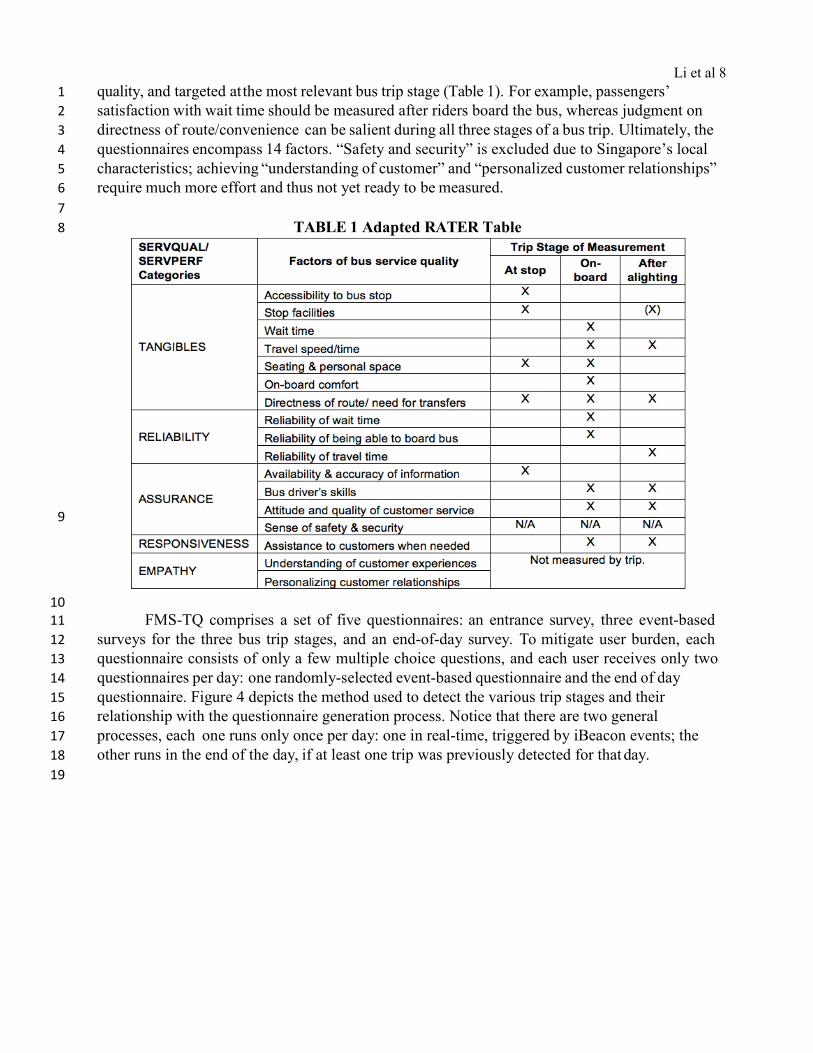
Li et al 8 quality, and targeted at the most relevant bus trip stage (Table 1). For example, passengers’ 1
satisfaction with wait time should be measured after riders board the bus, whereas judgment on 2
directness of route/convenience can be salient during all three stages of a bus trip. Ultimately, the 3
questionnaires encompass 14 factors. “Safety and security” is excluded due to Singapore’s local 4
characteristics; achieving “understanding of customer” and “personalized customer relationships” 5
require much more effort and thus not yet ready to be measured. 6
7
TABLE 1 Adapted RATER Table 8
9
10
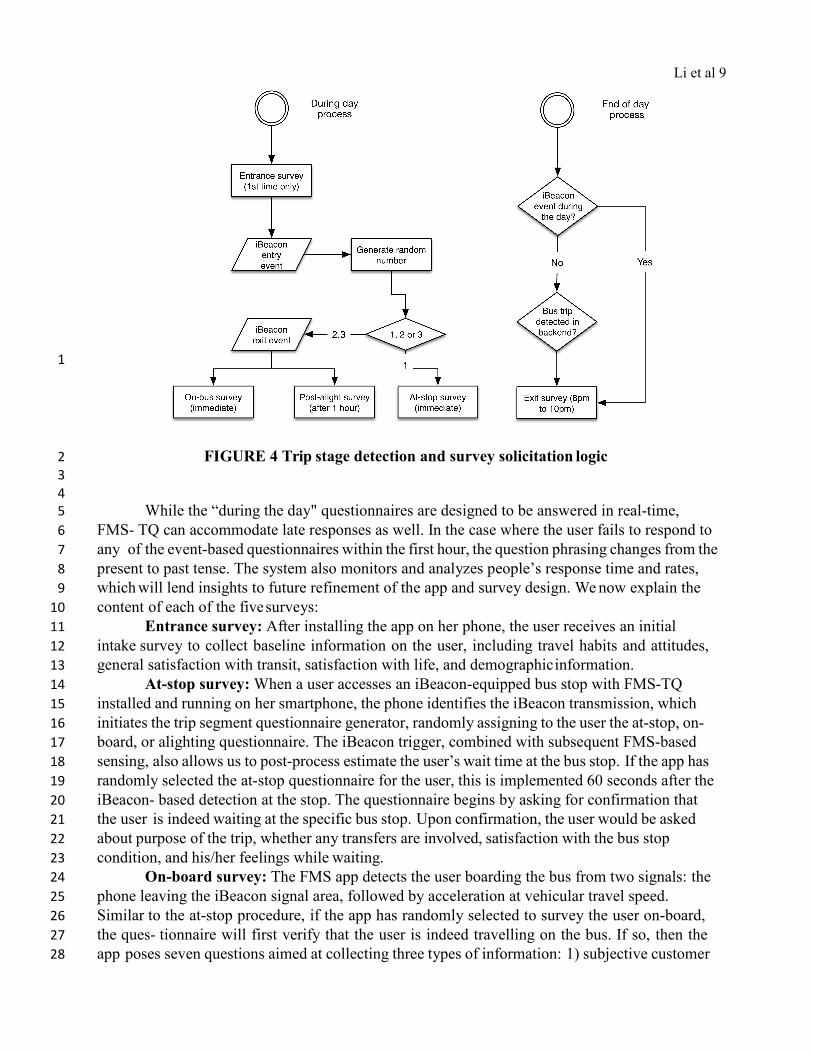
FMS-TQ comprises a set of five questionnaires: an entrance survey, three event-based 11
surveys for the three bus trip stages, and an end-of-day survey. To mitigate user burden, each 12
questionnaire consists of only a few multiple choice questions, and each user receives only two 13
questionnaires per day: one randomly-selected event-based questionnaire and the end of day 14
questionnaire. Figure 4 depicts the method used to detect the various trip stages and their 15
relationship with the questionnaire generation process. Notice that there are two general 16
processes, each one runs only once per day: one in real-time, triggered by iBeacon events; the 17
other runs in the end of the day, if at least one trip was previously detected for that day. 18
19
Li et al 9
1
FIGURE 4 Trip stage detection and survey solicitation logic 2
3
4
While the “during the day" questionnaires are designed to be answered in real-time, 5
FMS- TQ can accommodate late responses as well. In the case where the user fails to respond to 6
any of the event-based questionnaires within the first hour, the question phrasing changes from the 7
present to past tense. The system also monitors and analyzes people’s response time and rates, 8
which will lend insights to future refinement of the app and survey design. We now explain the 9
content of each of the five surveys: 10
Entrance survey: After installing the app on her phone, the user receives an initial 11
intake survey to collect baseline information on the user, including travel habits and attitudes, 12
general satisfaction with transit, satisfaction with life, and demographic information. 13
At-stop survey: When a user accesses an iBeacon-equipped bus stop with FMS-TQ 14
installed and running on her smartphone, the phone identifies the iBeacon transmission, which 15
initiates the trip segment questionnaire generator, randomly assigning to the user the at-stop, on-16
board, or alighting questionnaire. The iBeacon trigger, combined with subsequent FMS-based 17
sensing, also allows us to post-process estimate the user’s wait time at the bus stop. If the app has 18
randomly selected the at-stop questionnaire for the user, this is implemented 60 seconds after the 19
iBeacon- based detection at the stop. The questionnaire begins by asking for confirmation that 20
the user is indeed waiting at the specific bus stop. Upon confirmation, the user would be asked 21
about purpose of the trip, whether any transfers are involved, satisfaction with the bus stop 22
condition, and his/her feelings while waiting. 23
On-board survey: The FMS app detects the user boarding the bus from two signals: the 24
phone leaving the iBeacon signal area, followed by acceleration at vehicular travel speed. 25
Similar to the at-stop procedure, if the app has randomly selected to survey the user on-board, 26
the ques- tionnaire will first verify that the user is indeed travelling on the bus. If so, then the 27
app poses seven questions aimed at collecting three types of information: 1) subjective customer 28
Li et al 10 satisfaction of the wait and onboard experiences, 2) reasons for any dissatisfaction, and 3) 1
observations on onboard crowding level. The latter two types of questions intend to provide 2
feedback on service quality from a relatively objective perspective, covering bus stop condition, 3
service information availability, crowding, comfort, and the driver’s service. 4
Post-alight survey: If selected, the post-alighting questionnaire begins one hour after the 5
user exits the iBeacon area (bus stop). The questionnaire targets the overall bus travel experience, 6
gauging people’s perception of their travel times, convenience, and overall satisfaction with the 7
service. Since a rider’s perceived bus experience can be much influenced by his/her activities 8
during the trip, questions also focus on the user’s on-board activities. 9
End-of-day At the end of each day, all users who took a bus trip that day are given an 10
end-of-day questionnaire. We determine if a user has taken a bus trip in one of two ways: (1) she 11
completed one of the bus trip stage questionnaires; or (2) we infer they made a bus trip based on 12
FMS back-end analysis of their sensor data. The end of day questionnaire is then implemented 13
in the 8pm to 10pm window. This questionnaire aims to collect respondents’ reflections on their 14
transit experience and their evaluation of transit’s impacts on their lives and happiness that day. It 15
also asks users the degree to which their bus experience has met their expectations. Comparing 16
to the previously-mentioned questionnaires, which focus more on specific service attributes, this 17
retrospective survey targets riders’ broader well-being and travel choices. The pairing of responses 18
to the trip-segment and end-of-day questionnaires intends to provide grounds for comparing 19
real-time and retrospective passenger satisfaction. 20
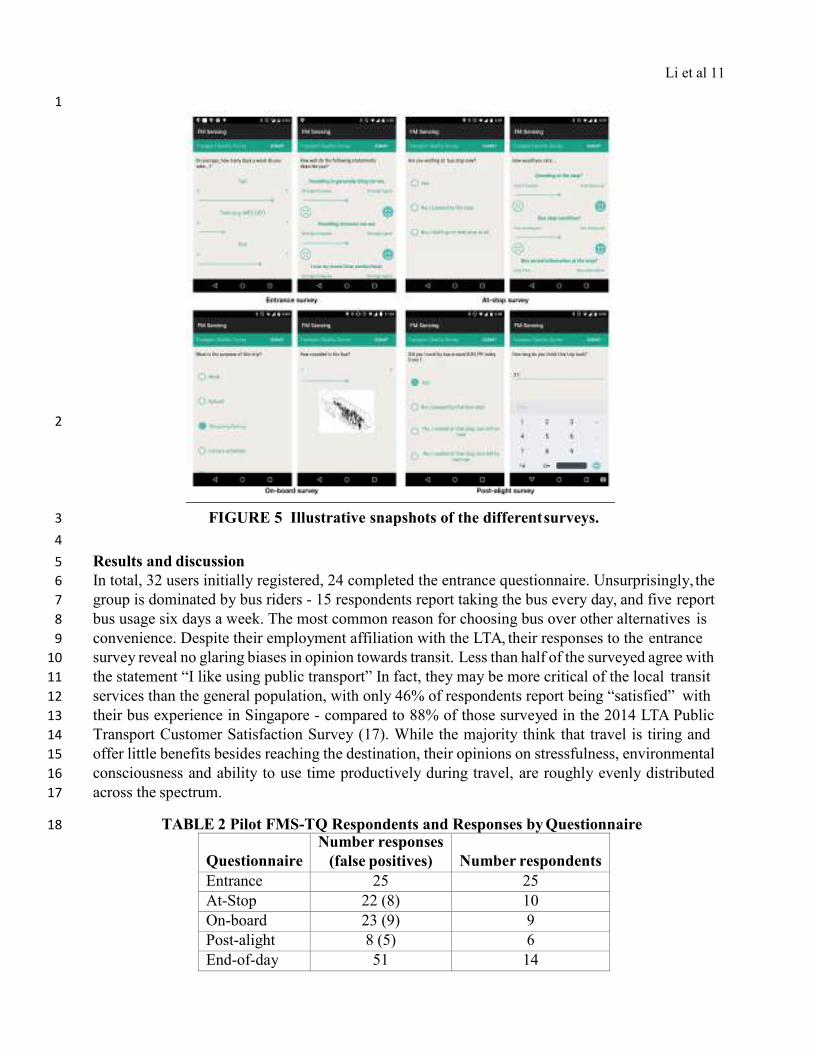
Figure 5 presents a few snapshots of the several different surveys. 21
In addition to passengers’ responses, the app also automatically collects the following trip- 22
based data: 23
• Boarding stop, estimated arrival to stop, estimated arrival and departure time of trip; 24
• GPS location readings (time and place stamps) and speed estimates. 25
Based on these readings, we are able to estimate, on the FMS back-end: waiting time, in-26
vehicle travel time and average speed, alighting stop, and characteristics of bus stop access 27
and egress (likely mode, total distance and time). 28
29
Survey administration 30
To pilot the approach, we partnered with Singapore’s Land Transport Authority (LTA). The LTA 31
disseminated an email invitation to employees at one of their offices, encouraging them to “help 32
innovate Singapore’s bus service” by “transforming the way we sense transit service quality and 33
customer satisfaction” and offering a prize draw of SGD 100 gift card to be awarded via lottery 34
(with chances of winning directly related to the number of questionnaires completed during the 35
course of the pilot). Android and iPhone users were invited to download the FMS-TQ app from 36
Google Play and the iOS App Store, respectively, and then prompted to register for an account. 37
We installed iBeacons at four bus stops near the LTA office, identifying with LTA administratively 38
feasible stops (as some bus stops are managed via private concessionaires) most likely to be used 39
by employees (see Figure 2. The pilot began on June 18, 2015 and ended on July 4, 2015. 40
Li et al 11
1
2
FIGURE 5 Illustrative snapshots of the different surveys. 3
4
Results and discussion 5
In total, 32 users initially registered, 24 completed the entrance questionnaire. Unsurprisingly, the 6
group is dominated by bus riders - 15 respondents report taking the bus every day, and five report 7
bus usage six days a week. The most common reason for choosing bus over other alternatives is 8
convenience. Despite their employment affiliation with the LTA, their responses to the entrance 9
survey reveal no glaring biases in opinion towards transit. Less than half of the surveyed agree with 10
the statement “I like using public transport” In fact, they may be more critical of the local transit 11
services than the general population, with only 46% of respondents report being “satisfied” with 12
their bus experience in Singapore - compared to 88% of those surveyed in the 2014 LTA Public 13
Transport Customer Satisfaction Survey (17). While the majority think that travel is tiring and 14
offer little benefits besides reaching the destination, their opinions on stressfulness, environmental 15
consciousness and ability to use time productively during travel, are roughly evenly distributed 16
across the spectrum. 17
TABLE 2 Pilot FMS-TQ Respondents and Responses by Questionnaire 18
Questionnaire
Number responses
(false positives)
Number respondents
Entrance 25 25
At-Stop 22 (8) 10
On-board 23 (9) 9
Post-alight 8 (5) 6
End-of-day 51 14
Li et al 12
For each real-time survey, we ask the user if s/he had indeed been at the bus stop. In 1
this way, we can understand the accuracy provided by the iBeacons. From a total of 52 iBeacon 2
triggered surveys, 21 were considered false positives. A detailed analysis revealed that the iBeacon 3
range may be set too high (can reach up to 70 meters) and the threshold of 60 seconds continuously 4
receiving iBeacon signal to avoid false positives (e.g. walking near the bus stop) was too low. We 5
also compared the quality of stop detection from backend intelligence (post-processing) with what 6
is provided with the iBeacons. Notice that the end-of-day survey would also take into account 7
backend analysis. In total, there were 14 cases where iBeacon could not detect a backend detected 8
stop. It is likely (but not verifiable in current data) that these were backend false positives or 9
that iBeacon signal was attenuated on crowded situations. There were 26 cases of stops detected 10
through iBeacons but not caught by the backend. This may happen if FMS location data is noisy, 11
absent, or the wait for the bus was too short to be considered a stop. Interestingly, whenever the 12
two technologies agreed, the detection time difference was negligible. 13
Over the course of the pilot, a total of 129 questionnaires were completed, in addition to the 14
25 entrance responses: 22 at-stop, 23 on-board, 8 post-alighting, and 51 end-of-day (Table 2). The 15
low number of post-alighting responses was due to a bug in the software discovered after the pilot 16
had begun (a roughly equal share of post-alighting, at-stop, and on-board questionnaires should 17
have been implemented). Furthermore, only after the pilot began did we notice that we needed to 18
remind Apple users to keep Bluetooth on (in Android, we could set this programmatically). At the 19
end of the pilot, only 16 users responded to a questionnaire other than the entrance 20
questionnaire.Over the course of the pilot, more respondents (14) completed the end-of-day 21
questionnaire at least once than any of the trip-stage-based questionnaires (Table 2). 22
In order to enable real-time surveying, the system must be able to detect trips as they 23
happen. Results show that FMS-TQ can detect trip stages with essentially no user input, though 24
its accuracy needs further improvement. On 22 instances, respondents reported of not having 25
waited for or boarded a bus at the stop detected by the app (false positives). Questionnaire 26
timestamps and pilot exit survey responses suggest that, for many of these cases, the app may have 27
misinterpreted people alighting at an iBeacon-equipped stop as waiting or boarding at that stop. 28
While we had set a minimum threshold of 1 minute (of continuously receiving the iBeacon 29
signal) to prevent this, this points to the need of adjusting this setting. The imperfectness of 30
iBeacon-based trip detection also affirms, for now, the importance of placing a trip-verifying 31
question in the beginning of surveys that employ automatic trip detection. 32
33
34
Li et al 13
TABLE 3 At-Stop Survey Response Summary 1
2
*Rate on scale of 1-5: 1 = very crowded, 5 = very spacious **Rate on scale of 1-5: 1 = very inadequate, 5 = very 3
adequate 4
***Rate on scale of 1-5: 1 = very poor, 5 = very informative ****Rate on scale of 1-5: 1 = very inconvenient, 5 = very 5
convenient 6
User ID
Date & time
Trip purpose
Transfers on this trip?
Passenger's affective state
Bus stop crowding*
Rating on bus stop
condition **
Rating on bus arrival information at the stop
***
Rating on accessibility
to the bus stop ****
Primary descriptor
Second descriptor
442 6/25/2015 18:23
Shopping/ Eating
no Anxious 5 4 3 3
453 6/19/2015 8:53
Work no Neutral 3 3 3 3
453 6/23/2015 19:07
Home yes Neutral 3 3 2 4
453 6/25/2015 8:55
Work no Neutral 3 3 3 3
453 7/1/2015 9:12
Work no Neutral 3 3 3 3
456 6/22/2015 7:47
Work yes Neutral 3 3 3 3
456 6/29/2015 7:53
Work yes Neutral 3 3 3 3
456 7/8/2015 7:55
Work yes Neutral 3 3 3 3
459 7/3/2015 18:21
Shopping/ Eating
No Very calm Very
content 2 2 2 4
465 6/25/2015 8:10
Work no Neutral 4 4 4 4
465 6/26/2015 8:10
work no Neutral 4 3 4 4
466 6/23/2015 12:50
Shopping/Eating
no Neutral Tired 4 3 3 4
470 6/29/2015 18:09
Going home
yes Very tired Very
hurried 2 3 4 4
470 7/1/2015 18:20
Going home
yes Very
anxious Very bored 4 4 1 1
Li et al 14
Despite the pilot’s limitations, the responses demonstrate FMS-TQ’s capability to gather 1
information on transit service quality that may better reflect customers’ actual experience. For 2
illustration, user #465, for example, reports two very different bus experiences on the same 3
commute on two consecutive days (Table 4). On June 22, the user reports satisfactory wait and 4
onboard experiences, while on the next day, however, s/he waits longer for the bus. According to 5
the entrance survey, this user usually checks real-time bus arrival information before the trip, 6
which suggests that the bus might have encountered an abnormal delay. The user’ s responses 7
also reveal on- board crowding and a somewhat rough ride. The differentiating details between 8
these two bus trips would have almost certainly been lost in more traditional customer satisfaction 9
surveys. 10
For transit operators and regulators, the most useful benefit of this smartphone-based sys- 11
tem may be trip-specific feedback. The FMS-TQ system records the phone’s geographical 12
coordinates when surveys are solicited and returned, which, when combined with the 13
automatically- collected GPS traces, enable us to infer the bus route taken. For example, at 18:14 14
on June 22, User #465 receives an onboard survey at (1.3104978, 103.8477377). This matches 15
the in-vehicle trip detected by FMS between 18:12 (1.310086, 103.848) and 18:22 (1.32541, 16
103.8419). We can thus infer that the user was traveling on one of the five bus routes serving that 17
corridor at that time of day (lines 56, 57, 166, 851 and 980). If given access to automatic vehicle 18
location (AVL) data, we could also know the exact bus trip by matching the user’s coordinates in 19
FMS with AVL data. A simpler technological approach, at the cost of additional user input, would 20
be to include a question about the bus number in the onboard and alighting surveys, or even to 21
install iBeacons in front and back of every bus. 22
Generating trip-specific feedback will likely become a crucial capability for transit 23
industry in the coming years. Compared to the rapidly-growing on-demand mobility services 24
(e.g. Uber, Lyft), transit agencies have fallen far behind in soliciting individualized feedback for 25
quality control and cultivating relationships with riders. Companies such as Uber and Lyft have 26
built meticulous quality control on the mandatory mutual ratings between drivers and passengers 27
at the end of every trip (48). As a result, not only do they have detailed service quality data for 28
analysis and monitoring, these new mobility service providers have also become much more 29
self-aware and self-regulating of their quality standards. 30
Lastly, with both real-time and retrospective customer opinions, we can begin to explore 31
how in-the-moment experiences may differ from recalled memory. 21 bus trips have both real-32
time and end-of-day survey responses. While this is not a sufficient pool to statistically detect 33
patterns, incidents of discrepancies are visible to the naked eye. For instance, User #458 34
expresses dissatisfaction with the wait (rated 3/5) and comfort (rated 2/5) while onboard the bus, 35
citing “wait time too long” and “too many people on the bus” as rea- sons. However, s/he seems 36
rather happy with the trip experience (rated 4/5) when asked again later that day. Such 37
discrepancies should not be surprising - the unpleasantness of being on a crowded bus after a 38
long wait would reasonably be most intense during the trip. Of course, this does not imply 39
superiority of one type of measures over the other. The real-time indicators are helpful at 40
reflecting riders’ actual experience, which could aid efforts to mitigate peak-period frustration 41
for customers; on the other hand, recalled reports of satisfaction may be more salient to users’ 42
longer-term decision-making, including future mode and route choice. 43
44
45
Li et al 15
TABLE 4 Onboard Survey Response Summary 1
2
* Rate on scale of 1-5: 1 = very dissatisfied, 5 = very satisfied 3
** Bus crowdedness: user shown a pictorial scale of 5 levels of crowding, with 1 = very empty, 5 = very 4
crowded. 5
6
While the results from the pilot have been encouraging, the FMS-TQ platform brings its 7
challenges. For example, iPhone users would need to manually enable Bluetooth on their 8
phones.Another limitation is the dependency on having a wide set of iBeacon-equipped stops. 9
If the ultimate vision is to develop a platform for a city’s entire bus network, it may be 10
impractical to install and maintain iBeacons at every bus stop. 11
Going forward, the approach can be enhanced through improved location and travel mode 12
identification. We also need to learn more about user burden in using the app, perhaps though 13
more agile selective surveying based on pattern detection. For instance, a commuter’s morning trip 14
to work tends to be consistent spatially and temporally across workdays, so his experience may 15
be similar across multiple trips. We can thus push the survey to him once every 5 or 10 trips. 16
User ID
Date & time
Wait satisfaction*
Why less than satisfied with wait? (if wait rating < 4)
Bus crowdedness**
Comfort satisfaction*
Why less than satisfied with
comfort? (if comfort rating < 4)
Driver service satisfaction*
442 6/24/2015
12:42 4 N/A 2 3
Ride is not smooth
3
448 6/26/2015
8:26 3 Other 3 4 N/A 4
453 6/22/2015
9:00 3 Wait time too long 2 3 “Don’t know”
453 7/2/2015
9:00 3 Rather not say 4 3 Rather not say “Don’t’ know”
453 7/8/2015
8:50 3 Rather not say 4 3
Cannot get a seat on the
bus “Don’t know”
456 6/24/2015
7:37 3 2 3
Temperature is too hot/cold
3
456 6/30/2015
17:02 3
Bus too crowded to board
2 3 Too many
people on the bus
3
456 7/2/2015
7:52 3 2 4 3
456 7/7/2015
7:54 4 2 4 3
458 6/19/2015
17:42 5 N/A 5 2
Too many people on the
bus 5
458 6/24/2015
12:32 3 Wait time too long 4 2
Too many people on the
bus 4
465 6/22/2015
18:14 4 N/A 3 4 N/A “Don’t know”
465 6/23/2015
18:15 3 Wait time too long 4 2
Ride is not smooth; Too many people on the bus
“Don’t know”
473 6/26/2015
7:48 4 N/A 3 3
Cannot get a seat on the
bus 4
Li et al 16
Lastly, we likely need a more effective incentives program to sustain participation, such as offering 1
reward points or fare discounts. Our pilot did not focus on incentive design for public participation 2
nor possible adjustments in transit regulatory frameworks; these elements will be examined in 3
future work which aims to develop a mature, effective, and sustainable crowdsourcing system that 4
helps agencies better monitor, improve, and govern transit services. 5
Despite the tasks ahead, FMS-TQ holds good potential to improve transit service 6
monitoring and regulation. The advances in smartphones and IoT technologies represent a great 7
opportunity (and a necessity) for transit operators, regulators, planners, and citizens alike to 8
leverage new technologies for generating more meaningful information. 9
10
CONCLUSION 11
This research aspires to bring multiple innovations to the field of transit service management and 12
regulation. First, the pilot demonstrates FMS’ capability to detect various stages of a bus trip that 13
enables surveying a passenger during travel with an unprecedented high resolution. Information 14
collected by FMS-TQ can be linked to specific bus trips, signifying a step towards allowing transit 15
operators and regulators to identify precise areas for improvement or commendation. This granular, 16
real-time, and customer-centric information collection can help agencies, operators and others to 17
become more in-tune with what passengers actually experience, representing an important step 18
towards building more personal relationships with customers. 19
20
ACKNOLWEDGEMENTS 21
This research was supported by the Singapore MIT Alliance for Research and Technology’s FM 22
IRG research program. We thank the Land Transport Authority of Singapore for their support 23
of the pilot. We would also like to thank Paula Garbagnoli, Inês Dias, Ajinkya Ghorpade, Jorge 24
Santos, William Ko, Bruno Santos and Rui Baltazar, who have contributed to making the FMS 25
system a reality. 26
27
REFERENCES 28
[1] Prahalad, C. K. and V. Ramaswamy, Co-creation experiences: The next practice in value 29
creation. Journal of interactive marketing, Vol. 18, No. 3, 2004, pp. 5–14. 30
[2] Aislelabs, The Hitchhikers Guide to iBeacon Hardware: A Comprehensive Report by Aisle- 31
labs (2015). http://www.aislelabs.com/reports/beacon-guide/, 2015. 32
[3] Cottrill, C., F. Pereira, F. Zhao, I. Dias, H. Lim, M. Ben-Akiva, and P. Zegras, Future mobility 33
survey: Experience in developing a smartphone-based travel survey in singapore. Transporta- 34
tion Research Record: Journal of the Transportation Research Board, , No. 2354, 2013, pp. 35
59–67. 36
[4] Zhao, F., F. C. Pereira, R. Ball, Y. Kim, Y. Han, C. Zegras, and M. Ben-Akiva, Ex- ploratory 37
Analysis of a Smartphone-Based Travel Survey in Singapore. Transportation Re- search 38
Record: Journal of the Transportation Research Board, , No. to appear, 2015. 39
[5] Hensher, D. A., P. Stopher, and P. Bullock, Service quality—-developing a service quality index 40
in the provision of commercial bus contracts. Transportation Research Part A: Policy and 41
Practice, Vol. 37, No. 6, 2003, pp. 499–517. 42
[6] Kittelson & Associates, Transit Cooperative Research Program T. C. R. Program, and Transit 43
Li et al 17
Development Corporation, eds. Transit capacity and quality of service manual, Vol. 100. 1
Transportation Research Board, 2003. 2
[7] Tyrinopoulos, Y. and C. Antoniou, Public transit user satisfaction: Variability and policy 3
implications. Transport Policy, Vol. 15, No. 4, 2008, pp. 260–272. 4
[8] Eboli, L. and G. Mazzulla. How to capture the passenge’s point of view on a transit service 5
through rating and choice options. Transportation reviews, Vol. 30, NO.4, 2010, pp. 435-450 6
[9] Eboli, L. and G. Mazzulla, A methodology for evaluating transit service quality based on 7
subjective and objective measures from the passenger’ s point of view. Transport Policy, Vol. 18, 8
No. 1, 2011, pp. 172–181. 9
[10] Spitz, G., Niles F., and Adler, T. Web-Based Survey Techniques. A Synthesis of Transit 10
Practice. TCRP Synthesis, 2007. 11
[11] Schaller, B., On-board and intercept transit survey techniques. 63, Transportation Research 12
Board, 2005. 13
[12] Dunlop, I. N., J. M. Casello, and S. T. Doherty, Tracking Transit Rider Experience: Using 14
Smartphones to Measure Comfort and Well-Being Throughout the Trip. In Transportation 15
Research Board. Meeting (93rd: 2014 : Washington, D.C.)., 2012. 16
[13] Elmore-Yalch, R., A Handbook: integrating market research into transit management, Vol. 17
37. Transportation Research Board, 1998. 18
[14] Carrel, A., R. Sengupta, and J. L. Walker, The San Francisco Travel Quality Study: Tracking 19
Trials and Tribulations of a Transit Taker. Transportation, 2015. 20
[15] Fredrickson, B. L. and D. Kahneman, Duration neglect in retrospective evaluations of affec- 21
tive episodes. Journal of personality and social psychology, Vol. 65, No. 1, 1993, p. 45. 22
[16] Pedersen, T., M. Friman, and P. Kristensson, The role of predicted, on-line experienced and 23
remembered satisfaction in current choice to use public transport services. Journal of Retail- 24
ing and Consumer Services, Vol. 18, No. 5, 2011, pp. 471–475. 25
[17] Abou-Zeid, M., R. Witter, M. Bierlaire, V. Kaufmann, and M. Ben-Akiva, Happiness and travel 26
mode switching: findings from a Swiss public transportation experiment. Transport Policy, 27
Vol. 19, No. 1, 2012, pp. 93–104. 28
[18] Habib, K. M. N., L. Kattan, M. Islam, et al., Model of personal attitudes towards transit service 29
quality. Journal of Advanced Transportation, Vol. 45, No. 4, 2011, pp. 271–285. 30
31
[19] de Oña, J., R. de Oña, L. Eboli, and G. Mazzulla, Perceived service quality in bus transit 32
service: a structural equation approach. Transport Policy, Vol. 29, 2013, pp. 219–226. 33
[20] Eboli, L. and G. Mazzulla, Service quality attributes affecting customer satisfaction for bus 34
transit. Journal of Public Transportation, Vol. 10, No. 3, 2007, pp. 35–46. 35
Li et al 18
[21] European Committee for Standardization. EN 13816. Transportation - Logistics and Ser- vices 1
- Public Passenger Transport - Service Quality Definition, Targeting and Measurement. EN 2
13816:2002 E, 2002. 3
[22] Friman, M. and M. Fellesson, Service supply and customer satisfaction in public transporta- 4
tion: the quality paradox. Journal of Public transportation, Vol. 12, No. 4, 2009, p. 4. 5
[23] Parasuraman, A., V. A. Zeithaml, and L. L. Berry, A conceptual model of service quality and 6
its implications for future research. the Journal of Marketing, 1985, pp. 41–50. 7
[24] Cronin Jr, J. J. and S. A. Taylor, Measuring service quality: a reexamination and extension. 8
The journal of marketing, 1992, pp. 55–68. 9
[25] Cavana, R. Y., L. M. Corbett, and Y. Lo, Developing zones of tolerance for managing passen- 10
ger rail service quality. International Journal of Quality & Reliability Management, Vol. 24, 11
No. 1, 2007, pp. 7–31. 12
[26] Tripathi, V., A. Kumar, and G. Nema, Measuring Service Quality in India Public Transport 13
System: A Comprehensive reviewâA U . Asia-Pacific Marketing Review, Vol. 1, No. 1, 2012, 14
pp. 113–119. 15
[27] Barabino, B., E. Deiana, and P. Tilocca, Measuring service quality in urban bus transport: a 16
modified SERVQUAL approach. International Journal of Quality and Service Sciences, Vol. 17
4, No. 3, 2012, pp. 238–252. 18
[28] Too, L. and G. Earl, Public transport service quality and sustainable development: a commu- 19
nity stakeholder perspective. Sustainable development, Vol. 18, No. 1, 2010, pp. 51–61. 20
[29] Bergstad, C. J., A. Gamble, T. Gärling, O. Hagman, M. Polk, D. Ettema, M. Friman, and 21
L. E. Olsson, Subjective well-being related to satisfaction with daily travel. Transportation, 22
Vol. 38, No. 1, 2011, pp. 1–15. 23
[30] Duarte, A., C. Garcia, G. Giannarakis, S. Limão, A. Polydoropoulou, and N. Litinas, New 24
approaches in transportation planning: happiness and transport economics. NETNOMICS: 25
Economic Research and Electronic Networking, Vol. 11, No. 1, 2010, pp. 5–32. 26
[31] Olsson, L. E., T. Gärling, S. Fujii, D. Ettema, H. Lekedal, and M. Friman, Relationship Between 27
Satisfaction with Daily Travel and Subjective Well-Being in Three Urban Areas in Sweden: 28
Description of Survey Questionnaire, Sample Characteristics and Preliminary Results, 2011. 29
[32] Olsson, L. E., T. Gärling, D. Ettema, M. Friman, and S. Fujii, Happiness and satisfaction with 30
work commute. Social indicators research, Vol. 111, No. 1, 2013, pp. 255–263. 31
[33] Ettema, D., T. Gärling, L. Eriksson, M. Friman, L. E. Olsson, and S. Fujii, Satisfaction with 32
travel and subjective well-being: Development and test of a measurement tool. Transporta- 33
tion Research Part F: Traffic Psychology and Behaviour, Vol. 14, No. 3, 2011, pp. 167–175. 34
[34] Abou-Zeid, M., Measuring and modeling activity and travel well-being. Ph.D. thesis, 35
Massachusetts Institute of Technology, 2009. 36
Li et al 19
[35] Ory, D. T. and P. L. Mokhtarian, When is getting there half the fun? Modeling the liking for 1
travel. Transportation Research Part A: Policy and Practice, Vol. 39, No. 2, 2005, pp. 97–2
123. 3
[36] Ghorpade, A., F. C. Pereira, F. Zhao, C. Zegras, and M. Ben-Akiva, An Integrated Stop- 4
Mode Detection Algorithm for Real World Smartphone-Based Travel Survey. Transportation 5
Research Board 94th Annual Meeting, 2015. 6
[37] Cook, J., Uber’s internal charts show how its driver-rating system actually works. Business 7
Insider, 2015.8