28
Food Access Indicators Food Access Indicators ENCAP TRAINING ENCAP TRAINING Bangkok 12-17 January 2009 Bangkok 12-17 January 2009
| Date post: | 29-Dec-2015 |
| Category: |
Documents |
| Upload: | christina-sutton |
| View: | 225 times |
| Download: | 5 times |

Food Access IndicatorsFood Access Indicators
ENCAP TRAINING ENCAP TRAINING
Bangkok 12-17 January 2009Bangkok 12-17 January 2009

Objectives
• Review food access indicators
• Share experiences

Food and Nutrition Security Conceptual Framework
We cannot measure food security directly. It is a function of:
•food availability
•food access
•food utilization

Definitions & Key Concepts
Food access: physical & economical ability of a household to acquire adequate amounts of food.
Households have access to food supplies through a variety of livelihood strategies:
i. own production (e.g., harvest)
ii. market purchases
iii. transfers from other sources (e.g., remittances, food aid, gifts, credit, bartering, etc.)

Even though “food access” is easier to observe than “food security”, still it is a
difficult concept to measure
In fact…
Key Concepts

Key Concepts
…The way the households access food:
• depends on household livelihood activities
• is context-specific (e.g., new challenges in urban contexts)
challenging to prescribe ‘a priori’ food access indicators valid for each analysis (each country, each livelihood group).
+It is not advisable to use JUST one FOOD ACCESS indicator
therefore

From HH questionnaire several questions related to access…

The actual current household food consumption depends upon the ability to acquire adequate amount of food. Food consumption (FCS) is therefore a proxy of food access (and food security).
o Households with low FCS are likely to have difficulties in acquiring adequate amount of food (i.e., poor food access). Otherwise they would eat more!
Current Food Consumption

Sources of food
Questions on sources of food consumed during the 7 days before the assessment play a crucial role in assessing the ability of the household to acquire adequate amount of food.
o Household’s food access is poor if the HH has high dependency on food aid, gifts, or tends to buy food on credit
o the relative contribution of each source (% of food from own production, purchase, etc.) suggests what are the other access indicators to consider.
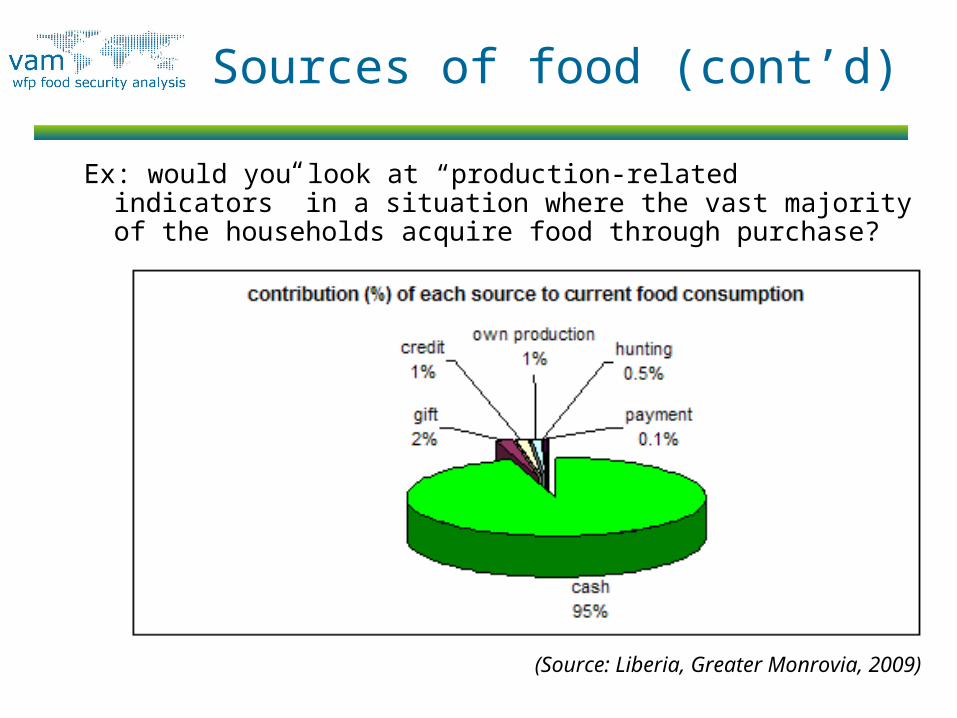
Ex: would you look at “production-related indicators” in a situation where the vast majority of the households acquire food through purchase?
(Source: Liberia, Greater Monrovia, 2009)
Sources of food (cont’d)

Expenditures
Expenditures are useful as a proxy for wider purchasing power, which is another important component of food access.
o Households that: i. devote most of the expenditures to buy foodii. have low per capita total expendituresiii. have debts (especially to satisfy basic needs)
are likely to have difficulties in acquiring adequate amount of food (i.e., poor food access).
Consider the context!! (e.g., urban vs rural, etc.)

Total Income
(If what is produced for auto-consumption is considered in the estimation of total income), total income can be used as a proxy of purchasing power – which is, in turn, a component of food access.
o It is likely that households with higher total income have higher capability to acquire adequate food compared with the poor households.

Wealth
Wealth should be included while analysing household access to food. It gives an idea of the coping potential of the households.
o It is likely that rich households have higher capability to acquire adequate food compared with the poor households.
o Rich households can cope better to shocks compared with poor households

Type of livelihood activities
Likewise some food sources, some livelihood activities help understanding the level of sustainability of the current food consumption.
o Household’s ability to acquire food is poor if the HH has high dependency on gifts, support from neighbours, casual labour, etc.
Consider the context while evaluating the type of income sources!!

Crop Production
Crop production-related indicators can be crucial in evaluating food access of households that rely mainly on agriculture (farmers):
o Farmersi. with scarce amount food stock,ii. with a bad harvest,iii. whose production does not satisfy HH food needs
are likely to have difficulties in acquiring adequate amount of food (i.e., poor food access).

Choosing food access indicators
There is no golden rule, but basic recommendations:
• Do not rely only on one food access indicator. Use more food access indicators
• Consider the survey context and livelihood activities in order to choose the most appropriate indicators.
• Results from the “main sources of food” can suggest appropriate food access indicators

What do we do with these indicators?
Using Food Access Indicators
Food Access Indicators can be used to complement/enrich the Food Security classification from the FC groups. This is particularly important if:
• The FCS is not a sufficient indicator of household FS in the local context (e.g., no convergence of evidence, food aid recipients)
• Substantial changes in food access will take place across the population in the short run (e.g., as a result of a recent shock).

Example: looking at food sources
10
8
17
15
50
0%
10%
20%
30%
40%
50%
60%
70%
80%
90%
100%
population
acceptable
borderline
poor
Food consumption
Food aid recipients
10
25
65
0%
10%
20%
30%
40%
50%
60%
70%
80%
90%
100%
population
acceptable
borderline
poor
Food consumption
– 10% poor food security– 25% borderline food security
Or: – 10% poor food security– 25% borderline, including 8% receiving food aid– 15% with acceptable food consumption but who also receive food aid

Farmers: FCGs & own production
15%
70%
5% w ith bad production
10% good production
0% 10% 20% 30% 40% 50% 60% 70% 80%
poor
bordeline
acceptable
% HHs
Example: considering livelihood
15% of the farmers have poor consumption, 15% borderline consumption, 70% acceptable consumption…
…however, 5% have a borderline consumption AND bad production.
They face a more instable food security situation compared with the 10% borderline that produce well.

Profiling the food insecureProfiling the food insecure
ENCAP TRAINING ENCAP TRAINING
Bangkok 12-17 January 2009Bangkok 12-17 January 2009

• Once the food consumption groups are identified, it is important to explore the socio-economical characteristics of the food insecure
Who are they?
Profiling the food insecure

Demographic factors
Demographic Factors by FC groups
22%
10%
30%
5%
30%
11%
27%
1%
23%
7%
16%
1%
24%
8%
19%
2%
0%
5%
10%
15%20%
25%
30%
35%
Female-headed HHs elderly-headed HH Illiterate headed HH CI/disabled HH head
% H
Hs
poor borderline acceptable Total
0%20%40%
60%80%
100%no
ne
inco
mpl
ete
prim
ary
com
plet
epr
imar
y
mor
e th
anpr
imar
y
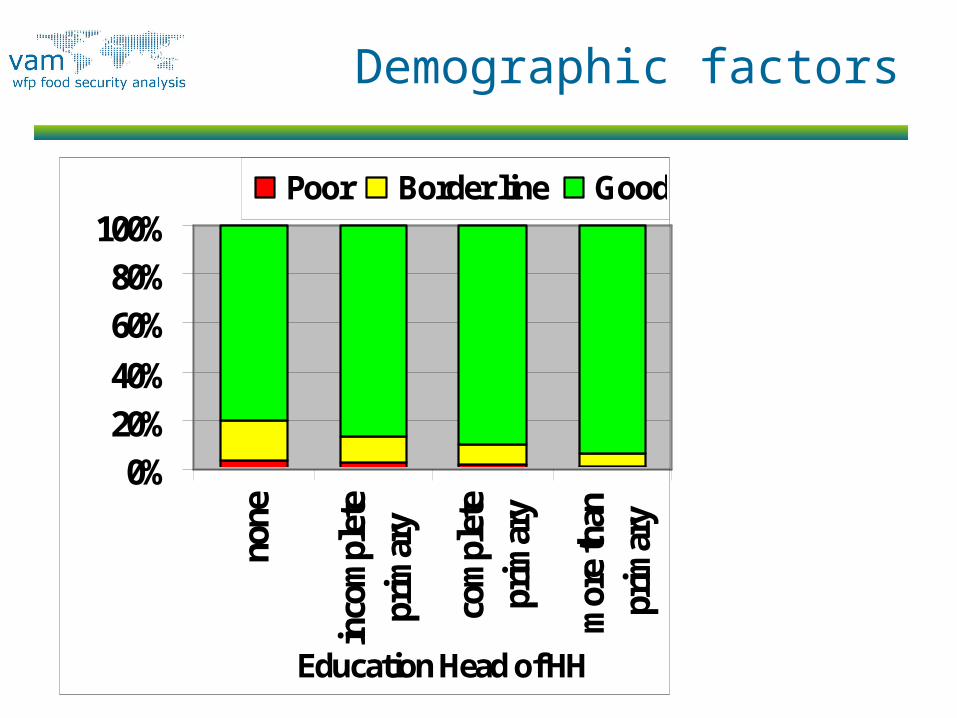
Poor Border line Good
Education Head of HH
Demographic factors

Economic factors
Food Consumption Groups (FCS) by Livelihood Profiles
2%
9%
12%
7%
9%
0%
0%
0%
7%
10%
0%
13%
22%
30%
23%
29%
13%
13%
25%
30%
12%
54%
85%
69%
58%
71%
62%
87%
87%
75%
63%
79%
46%
0% 10% 20% 30% 40% 50% 60% 70% 80% 90% 100%
Employees
Petty trade
Casual Labourers
Skilled Labourers
Support receivers
Other (charcoal)
Traders
renting
Food Crop Farmers
remittance
pensioners
poor borderline acceptable

Economic factors
Employment status by Food Consumption Group
12%25%
39%22%16%
8%42% 36%
38%
24% 23% 15%
0%
20%
40%
60%
80%
100%
poor borderline acceptable
% H
Hs
Wage/salary Casual Self-employed Unemployed
% HHs w ith one income source by Food Consumption Group
53%
55%
51%
49%
50%
51%
52%
53%
54%
55%
56%
poor borderline acceptable%
HH
s

Assets
Food Consumption Groups
poor borderline acceptable
Own 34% 34% 39%
Rent 42% 46% 45% Squatter 12% 8% 7%
Caretaker 13% 12% 8%
Bed frame (wood, metal) 30% 38% 63%
Sponge mattress 80% 91% 94% Table/chairs 67% 76% 85%
Radio 28% 41% 60%
Television 4% 5% 26%
Generator 3% 5% 25% Cell phone 41% 44% 64%

Comments?


