Food wastage footprint & Climate Change The 2012 market value of food products lost or wasted was USD 936 billion; that is in the range of the GDP of countries such as Indonesia or the Netherlands. According to the methodology of the FAO report on full-cost accounting (3) and using the estimate of the social cost of carbon that mainly considers damage costs or defensive expenditures, the cost of GHG emissions from global food wastage is USD 411 billion. Global food loss and waste generate annually 4.4 GtCO 2 eq, or about 8% of total anthropogenic GHG emissions (5). This means that the contribution of food wastage emissions to global warming is almost equivalent (87%) to global road transport emissions (6). 0 Gtonnes GtCO 2 eq China Source: WRI’S Climate Data Explorer (4) USA Food wastage India Russia Japan Brazil Germany Indonesia Mexico Canada Iran South Korea Australia United Kingdom Saudi Arabia Italy France South Africa Turkey Ukraine 2 4 6 8 10 12 Total GHGs emissions excluding LULUCF Top 20 of countries (year 2011) vs. Food wastage If food wastage were a country, it would be the third largest emitting country in the world. Global food loss and waste The 2011 FAO assessment of global food losses and waste (1) estimated that each year, one-third of all food produced in the world for human consumption never reached the consumer’s table. This not only means a missed opportunity for the economy and food security, but also a waste of all the natural resources used for growing, processing, packaging, transporting and marketing food. Through an extensive literature search, the 2011 assessment of food wastage volumes gathered weight ratios of food losses and waste for different regions of the world, different commodity groups and different steps of the supply chain. These ratios were applied to regional food mass flows of FAO’s Food Balance Sheets for the year 2007. Food wastage arises at all stages of the food supply chains for a variety of reasons that are very much dependent on the local conditions within each country. At a global level, a pattern is clearly visible; in high income regions, volumes of wasted food are higher in the processing, distribution and consumption stages, whereas in low-income countries, food losses occur in the production and post- harvesting phases. In low income countries, the lack of infrastructure and lack of knowledge on proper storage and food handling, combined with unfavourable climatic conditions, favour food spoilage. In higher income countries, aesthetic preferences and arbitrary sell-by dates are factors that contribute to food waste. Carbon footprint of global food wastage FAO quantified the food wastage footprint on natural resources (2), most notably its carbon footprint. Carbon footprint calculations – based on the 2011 assessment of food wastage volumes (1) and emissions factors taken from Life Cycle Assessment studies – were estimated at 3.3 GtCO 2 eq for 2007 (excluding land use change). Using the most recent Food Balance Sheets (2011), this figure is updated to 3.6 GtCO 2 eq, plus 0.8 GtCO 2 eq from food wastage emissions from deforestation and managed organic soils (3). Thus, the total carbon footprint of food wastage is around 4.4 GtCO 2 eq per year.
Transcript
Food wastage footprint& Climate Change
The 2012 market value of food products lost or wasted
was USD 936 billion; that is in the range of the GDP of
countries such as Indonesia or the Netherlands.
According to the methodology of the FAO report on
full-cost accounting (3) and using the estimate of the
social cost of carbon that mainly considers damage
costs or defensive expenditures, the cost of GHG
emissions from global food wastage is USD 411 billion.
Global food loss and waste generate annually
4.4 GtCO2 eq, or about 8% of total anthropogenic
GHG emissions (5). This means that the contribution of
food wastage emissions to global warming is almost
equivalent (87%) to global road transport emissions (6).
0
Gto
nnes
GtC
O2
eq
China
Source: WRI’S Climate Data Explorer (4)
USA
Food
wast
age
India
Russi
aJa
pan
Braz
il
Germ
any
Indon
esia
Mex
ico
Canad
aIra
n
Sout
h Ko
rea
Austra
lia
United
King
dom
Saud
i Arab
iaIta
ly
Franc
e
Sout
h Afri
ca
Turke
y
Ukraine
2
4
6
8
10
12
Total GHGs emissions excluding LULUCFTop 20 of countries (year 2011) vs. Food wastage
If food wastage were a country, it would be the third largest emitting country in the world.
Global food loss and wasteThe 2011 FAO assessment of global food losses and waste (1) estimated that each year, one-third of all food produced in the world for human consumption never reached the consumer’s table. This not only means a missed opportunity for the economy and food security, but also a waste of all the natural resources used for growing, processing, packaging, transporting and marketing food.
Through an extensive literature search, the 2011 assessment of food wastage volumes gathered weight ratios of food losses and waste for different regions of the world, different commodity groups and different steps of the supply chain. These ratios were applied to regional food mass flows of FAO’s Food Balance Sheets for the year 2007.
Food wastage arises at all stages of the food supply chains for a variety of reasons that are very much dependent on the local conditions within each country. At a global level, a pattern is clearly visible; in high income regions, volumes of wasted food are higher in the processing, distribution and consumption stages, whereas in low-income countries, food losses occur in the production and post-harvesting phases.
In low income countries, the lack of infrastructure and lack of knowledge on proper storage and food handling, combined with unfavourable climatic conditions, favour food spoilage. In higher income countries, aesthetic preferences and arbitrary sell-by dates are factors that contribute to food waste.
Carbon footprint of global food wastageFAO quantified the food wastage footprint on natural resources (2), most notably its carbon footprint. Carbon footprint calculations – based on the 2011 assessment of food wastage volumes (1) and emissions factors taken from Life Cycle Assessment studies – were estimated at 3.3 GtCO2 eq for 2007 (excluding land use change). Using the most recent Food Balance Sheets (2011), this figure is updated to 3.6 GtCO2 eq, plus 0.8 GtCO2 eq from food wastage emissions from deforestation and managed organic soils (3). Thus, the total carbon footprint of food wastage is around 4.4 GtCO2 eq per year.
Products hold different carbon intensities. For example, vegetable production in Europe is more carbon-
intensive than vegetable production in Industrialized and Southeast Asia, as Europe uses more carbon-
intensive means of production, such as artificially heated greenhouses. Inversely, cereal production in
Asia is more carbon intensive than cereal production in Europe due to the difference in the type of cereal
grown: rice on average has higher impact factors than wheat. Rice is a CH4 emitting crop because of the
decomposition of organic matter in paddy fields (1 kg of CH4 is the equivalent of 25 kg of CO2).
2
Carbon footprint intensitiesThe carbon footprint of a food product is the total amount of GHG emitted throughout its lifecycle, expressed in kilograms of CO2-equivalents.
GHG emissions of the production phase (including all agricultural inputs, machinery, livestock, soils) and successive phases (such as processing, transportation, preparation of food, waste disposal) are all included in this calculation.
Thus, one kg of wheat, or one kg of beef, have different carbon footprints, since their life cycles are different, emitting specific types and varying amount of greenhouse gases.
Despite meat being a relatively low contributor to global food wastage in terms of volumes (less than 5% of total food wastage) it has a significant impact on climate change, contributing to over 20% of the carbon footprint of total food waste (see chart above). This is because meat carbon footprint includes the emissions from producing a kilogram of meat (e.g. the methane emitted by ruminants), the emissions related to feed provision (e.g. the fertilizer used for the production of feed) and emissions from manure management. Thus, efforts to reduce GHG related to food wastage should focus on major climate hotspots commodities, such as meat and cereals.
0%
% o
f to
tal
Cereals(excluding beer)
Starchy roots Oilcrops& Pulses
Fruits(excluding wine)
Meat Fish& Seafood
Vegetables Milk(excluding
butter) & Eggs
10%
20%
30%
Contribution of each commodity to carbon footprint and food wastage
Carbon footprint Food wastage
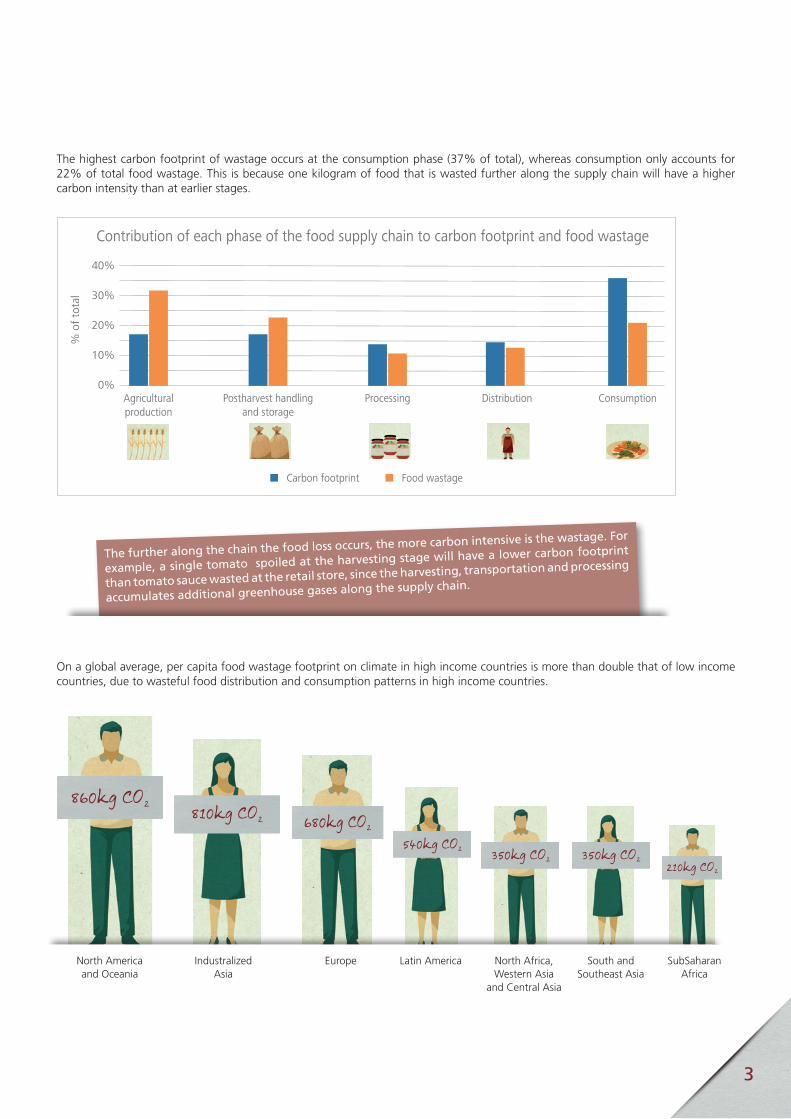
0%
% o
f to
tal
Agriculturalproduction
Postharvest handlingand storage
Processing Distribution Consumption
10%
20%
30%
40%
Contribution of each phase of the food supply chain to carbon footprint and food wastage
Food wastageCarbon footprint
The further along the chain the food loss occurs, the more carbon intensive is the wastage. For
example, a single tomato spoiled at the harvesting stage will have a lower carbon footprint
than tomato sauce wasted at the retail store, since the harvesting, transportation and processing
accumulates additional greenhouse gases along the supply chain.
3
The highest carbon footprint of wastage occurs at the consumption phase (37% of total), whereas consumption only accounts for 22% of total food wastage. This is because one kilogram of food that is wasted further along the supply chain will have a higher carbon intensity than at earlier stages.
On a global average, per capita food wastage footprint on climate in high income countries is more than double that of low income countries, due to wasteful food distribution and consumption patterns in high income countries.
860kg CO2 810kg CO2 680kg CO2
540kg CO2 350kg CO2 350kg CO2210kg CO2
North America and Oceania
Industralized Asia
Europe Latin America North Africa, Western Asia
and Central Asia
South and Southeast Asia
SubSaharan Africa
Food wastage reduction scenario and climate change mitigationUnited Nations Sustainable Development Goal 12 (SDG 12) on “Ensuring sustainable consumption and production patterns” includes a specific food waste reduction target: “by 2030, to halve per capita global food waste at the retail and consumer levels and reduce food losses along production and supply chains, including post-harvest losses”.
The SDG 12 target of 50% food waste reduction is hereby combined with assumptions on feasible food loss reduction ratios, for each commodity group, in order to calculate a possible scenario.
The proposed scenario would lead to a reduction of the carbon footprint of food wastage by 38%, or 1.4 GtCO2 eq per year (see chart below); this would be equivalent to the GHG emissions of the Japanese economy. Considering that post-harvest handling reductions are feasible in developing countries through improvements in their food systems (e.g. adopting improved technologies, better handling practices, efficient markets), investment in reducing post-harvest losses represent an important climate mitigation strategy.
Despite data and modelling uncertainties, the magnitude of the figures above suggest that a reduction of food losses and waste at global, regional and national levels would have a substantial positive effect on societal resources and in particular, climate change.
References (1) FAO, 2011. Global Food Losses and Food Waste. Extent, Causes and Prevention.(2) FAO, 2013. Food Wastage Footprint: Impacts on Natural Resources, Summary Report.(3) FAO, 2014. Food Wastage Footprint: Full-Cost Accounting, Final Report.(4) CAIT, 2015. Climate Data Explorer. World Resources Institute.(5) EC, JRC/PBL, 2012 Emission Database for Global Atmospheric Research, version 4.2.(6) IPCC, 2014 Fifth Assessment Report. Chapter 8: Transportation.
Assumptions for food wastage reduction ratios achievable by 2030
Phases “Agricultural production” and “Processing”
• 5% reduction of 2011 food wastage in developed countries• 15% reduction of 2011 food wastage in developing countries (a larger progress margin is assumed for developing countries)
Phase “Post-harvest handling and storage”
• 5% reduction of 2011 of food wastage in developed countries• 54% reduction of 2011 food wastage in developing countries (reduction estimated to be needed to reach the average percentage
of wastage observed in developed countries for most commodity groups)
Phases “Distribution” and “Consumption”
• 50% reduction of 2011 food wastage amounts in all regions
0
Mill
ions
ton
nes
CO
2 eq
Europe North America& Oceania
IndustrializedAsia
SubsaharaAfrica
North Africa,Western Asia
and Central Asia
South andSoutheast
Asia
Latin America
200
400
600
800
1 000
1 200
1 400
Climate change mitigation potential of food wastage reduction
Carbon footprint of food wastage in 2011 Food wastage reduction scenario for 2030


![2013 PRODUCT FOOTPRINT REPORT MARCH 12, 2014 …Global Warming ("carbon footprint") [kg CO2-equiv.] : A measure of greenhouse gas emissions, such as CO2 and methane. These emissions](https://static.documents.pub/doc/80x56/60de4d1f5e4c5c44de6fdb55/2013-product-footprint-report-march-12-2014-global-warming-carbon-footprint.jpg)