59
” ENGINEERING MONOGRAPH United States Department of the Interior BUREAU OF RECLAMATION \ No. 9 DISCII[ARGE COEFFICIEN’I’S FOR IRREGULAR 1 OVERFALL SPILLWAYS

”
ENGINEERING MONOGRAPH
United States Department of the Interior
BUREAU OF RECLAMATION \
No. 9
DISCII[ARGE COEFFICIEN’I’S
FOR IRREGULAR 1
OVERFALL SPILLWAYS

United States Department of the Interior
Bureau of Reclamation
Engineering Monograph
No. 9
DISCHARGE COEFFICIENTS FOR IRREGULAR
OVERFALL SPILLWAYS
by J. N. BradlpJr Engineering Laboratories Branch Design and Construction Division
Technical Information Office Denver Federal Center
Denver, Colorado I

On November 6.1979, the Bureau of Reclamation was renamed the Water and Power Resources Service in the U.S. Department of the Interior. The new name more closely identifies the agency with its principal functions-supplying water and power.
The text of this publication was prepared prior to adoption of the new name; ail references to the Bureau of Reclamation or any derivative thereof are to be considered synonymous with the Water and Power Resources Service.
ENGINEERING MONOGRAPHS are published in limited editions for the technical staff of the Bureau of Reclamation and interested technical circles in government and private agencies. Their purpose is to record developments, inno- vations, and progress in the engineering and scientific techniques and practices that are em- ployed in the planning, design, construction, and operation of Reclamation structures and equip- ment. Copies may be obtained from the Bureau of Reclamation, Denver Federal Center, Denver, Colorado, and Washington, D. C.

CONTENTS
INTRODUCTION..; .........................................
DEFINITIONOFSYMBOLS ....................................
EXTENT OF INVESTIGATION ..................................
SPILLWAYSWITHFREE OVERFALL.. ........................... Method of Procedure ...................................... Application of Results .....................................
Example 1: Spillway with free overfall ........................
SPILLWAYS WITH OVERFALL SUPPRESSED. ........................ Method of Procedure ...................................... Application of Results .....................................
Example 2: Spillway with overfall suppressed ...................
DETERMINATION OF COEFFICIENT OF DISCHARGE CURVE Spillways with Free Overfall .... .. ......... ...... : : : : : : : : : : : : Spillways with Overfall Suppressed ............................. Application of Results .....................................
Example 3: Coefficient curve for free overfall spillway ............. Example 4: Coefficient curve for spillway with overfall suppressed .....
WATER SURFACE AND PRESSURE PROFILES .......................
LIST OF FIGURES
Identification of Symbols ............................... Spillways with Vertical Upstream Face ..................... Spillways with Vertical Upstream Face ..................... Spillways with Vertical Upstream Face ..................... Spillways with Vertical Upstream Face ..................... Spillways with Sloping Upstream Face ...................... Spillways with Sloping Upstream Face ...................... Spillways with Sloping Upstream Face ...................... Spillways with Sloping Upstream Face ...................... Spillways with Sloping Upstream Face ...................... Spillways with Sloping Upstream Face ...................... Spillways with Sloping Upstream Face ...................... Spillways with Sloping and Offset Upstream Face Spillways with Offset in Upstream Face ... .... : : : : : : : : : : : : : : Spillways with Offset in Upstream Face ..................... Spillways with Offset in Upstream Face ..................... Spillways with Offset in Upstream Face ..................... Spillways with Offset in-upstream Face ..................... Elevation and Section American Falls Dam Spillway. ............ American Falls Dam Spillway (Examples 1 and 3) .............. Spillways with Overfall Suppressed ........................ Spillways with Overfall Suppressed ........................ Spillways with Overfall Suppressed ........................ Spillways with Overfall Suppressed ........................ Spillways with Overfall Suppressed ........................ Spillways with Overfall Suppressed ........................ Spillways with Overfall’suppressed ........................ Spillways with Overfall Suppressed ........................ Spillways with Overfall Suppressed ........................ Spillways with Overfall Suppressed ........................ Spillways with Overfall Suppressed ........................
i

Number
:23 34
35
LIST OF FIGURES (Continued)
Page
Plan and Section Kachess Dam Spillway . . . . . . . . . . . . . . . . . . . . . 37 Kachess Dam Spillway (Examples 2 and 4) . . . . . . . . . . . . . . . . . . . 38 Coefficients of Discharge for Other Than the
Design Head (Free Overfall Spillways) . . . . . . . . . . . . . . . . . . . . . 39 Coefficients of Discharge for Other Than the
Design Head (Spillways with Overfall Suppressed) . . . . . . . . . . . . . 40
APPENDIX
Spillways with vertical upstream face ...................... Spillways with vertical and sloping upstream faces ............. 4: Spillways with sloping upstream faces ...................... Miscellaneous spillway shapes ...........................
2:
Spillways with irregular upstream faces .................... Spillways with offset in upstream face ...................... :87 Earth dam spillways with shallow approach depth .............. Earth dam spillways with shallow approach depth ..............
ti
Earth dam spillways with shallow approach depth .............. Earth dam spillways with shallow approach depth .............. :i Earth dam spillways with shallow approach depth .............. 53
ii

INTRODUCTION
In 1948, the Bureau of Reclamation pub- lished Bulletin 3, Part VI, a Boulder Canyon Project Fir&Report, titled “Studies of Crests for Overfall Dams. ” This work was based on an extensive series of experiments on weirs with sharp crests for the purpose of defining the natural nappe shapes, both upper and lower, and determining the resulting dis&arge coefficients. These natural nappe shapes and discharge coefficients, recorded in the above bulletin, are termed “datum profiles” and “datum discharge coefficients” to distinguish them from those which will be presented in this monograph.
By datum shape is meant the shape of spillway cross section which corres or coincides with the natural (basic P
onds to profile
of the lower nappe surface for the design dis- charge condition. This will be the smallest cross section, as well as the most efficient shape, on which no significant negative pres- sures will exist for the design discharge. For discharges less than the design discharge, pressures on the face will be greater than atmospheric and discharge coefficients will be smaller than for the design discharge. For discharges greater than the design dis- charge, subatmospheric pressures will exist on the downstream face and discharge coef- ficients will be greater. The terms “datum shape” and “datum coefficient” represent a definite basis from which the designer may work, even though he may deviate from the datum shape in any particular design
Datum shapes are included in this mono- graph for the purpose of comparison. It is suggested that the reader become familiar
with Bulletin 3, Part VI, of Boulder Canyon Project Final Reports, because much of the material in the monograph is supplementary to that in the bulletin
Coefficient of discharge information is quite Complete for the datum shapes. There is, however, much to be desired in the way of reliable data on coefficients of discharge for sections that differ from the datum shape.
The monograph deals with overfall spill- way sections which differ from the datum shape. For lack of a better descriptive term, these are referred to as “irregular” shapes. Irregular shapes are the ones most likely to be encountered in practice. This is true for several reasons: (1) sufficient information for the design of datum shapes has not been available until recently; (2) where radial or vertical slide gates are used for regulation, it has been customary to shape the overfall section to fit-the trajectory issuing from a small gate opening. This gives a broader section than the datum shape. Such practice is losing ground in favor of the datum shapes; and (3) where drum gates are provided on a spillway, a broad overfall section is usually required for structural reasons. For these reasons, true datum shapes are not as com- mon in practice as the irregular shapes.
This monograph was written for the ex- press purpose of providing the designer with experimental information by which he may determine, with a fair degree of accuracy, the coefficient of discharge at any head for irregular overfall spillway shapes.
DEFINITIONS OF SYMBOLS
The symbols will be the same as those used in Bulletin 3, Part VI, Boulder Canyon Project Final Reports. Symbols appearing F,this monograph are as follows: (See Figu~
A, total head for which spillway section was designed (including velocity head of approach)
H any other total head measured above high point of crest
& velocity head of approach
P + E the average depth of approach Channel
Co coefficient of discharge for the designed head, Ho
C coefficient of discharge for other than the designed head, A
CM coefficient of discharge obtained from model at designed head
CD coefficient of discharge for corres- ponding datum shape at designed head
hd drop headwater to tail water elevation (low dams)
d tail water depth (low dams)
1

EXTENT OF INVESTIGATION
Tne Hydraulic Laboratory of the Bureau of Reclamation-has been continously experi- menting, collecting, and compiling data on flow over both high and low overfall dams since its inception. It is now felt that suffi- cient information has been accumulated to warrant a compilation of coefficient data for spillways of irregular shape (those differing from the datum shape).
The information stems from model studies performed on spillways of dams designed by the Bureau during the past 20 years, model studies of spillways for several Tennessee Valley Authority dams, and model studies of spillways for three dams for the Government of India, performed at the Colorado A and M College at Fort Collins. Coefficients of dis- charge are included for high dams with free overfall, as well as for the shallow earth dam type of spillway where free flow is suppressed by insufficient getaway downstream.
Considering the information collectively, it will be found that, for high dams, Figures
2 through 5 pertain to spillways having ver- tical upstream faces; Figures 6 through 12 represent spillways with sloping upstream faces; and Figures 13 through 18 are for spill- ways having offsets, or corbels, on the up- stream face. Figures 21 through 31 apply to earth dam spillways. The charts on the fore- going figures will be referred to as stock shapes. All charts are plotted to the same scale, an ordinate or abscissa value of 1.0 on any chart being equal to 100 of the small- est divisions on a 60 engineer’s scale. This scale will be referred to hereinafter as the “standard scale. ”
The discussion first shows how to obtain the coefficient of discharge, at the designed head, for a spillway section m question This is done for both the free overfall spillway and for one in which free overfall is suppressed (earth dam type). Then it is shown how the curve showing coefficient of discharge for various heads may be established from a single point. Examples are included to illus- trate the procedures.
SPILLWAYS WITH FREE OVERFALL
Method of Procedure
The solid lines on Figure 2 represent two spillway shapes with free overfall which were tested by means of hydraulic models. These cross sectional shapes and the ones that follow are plotted to the same scale, which is dimen- sionless (both X and Y distances are divided by the total designed head, Ho). By this meth- od of plotting, similar shapes with similar heads will coincide. The coefficient of dis- charge for each shape at its respective de- signed head (as determined from a model) is listed opposite the symbol CM. The model coefficient for the Wheeler Dam, CM is 3.99 while the much broader section for the Hoover Dam shows CM is 3.58, Figure 2.
For the purpose of comparison, datum shapes, computed for the same heads and ap- proaoh conditions, are also plotted on Figure 2 for the two spillway sections and are identi- fied by the heavy dash lines. The datum co- efficient CD is 3.96 for the Wheeler Dam and 3.93 for the Hoover Dam In making a com- parison of this kind, it is necessary to match either the upstream faces of the actual and datum sections or their axes. Neither meth- od is altogether satisfactory. In this com- parison of free overfall shapes, however, the axes of the actual and datum shapes are made
to coincide so that the crest, or high point, of each shape constitutes a common point. The values H + (P + E) on Figure 2 indicate the ratio of tl?e total designed head to the approach depth.
The method consists simply of compar- ing an irregular shape in question with a cor- responding, or closely corresponding, shape for which the coefficient of discharge is known. Considering the number of variables involved, the procedure is perhaps the best that can be devised at the present stage of the study. The accuracy obtainable is well within the limit of practical design.
Dimensions and details have been omit- ted from the charts as it was desired to pre- sent these in as simplified a form as pos- sible. Prototype dimensions can be found in the Appendix by observing the reference on each chart. For example, the prototype di- mensions of the Wheeler Dam Spillway Sec- tion, shown on Figure 2, can be found in Fig- ure lA of the Appendix.
Application of Results The most effective way fo explain the use
of the charts on Figures 2 through 18 is to present an example.
2

Example 1: Spillway with free overfall From the elevation and section of the
American Falls Dam spillway, shown on Fig- ure 19, determine thecoefficient of discharge for the designed head of 11.3 feet This spill- way has never been rated, so this serves as a practical application as well as an example.
First, all dimensions of the crest pro- file, Figure 19, are divided by the total de- signed head which is 11.3 feet The resulting dimensionless values are then plotted, to the standard scale, as shown on Figure 2OA, but transparent paper should be used so that this shape may be readily superimposed on the stock shapes. As the shape in question has a vertical upstream face, it should be super- imposed on the charts of Figures 2 through 5 until a satisfactory comparison is obtained with an actual shape or a datum shape--either will do. It is not necessary to match the axes in this process, rather it is much more im- portant to match the upstream and downstream faces simultaneously.
The American Falls Spillway profile compares favorably with the profile for the Keswick Dam Spillway, Figure 4. The model coefficient CM for the Keswick Spillway is 3.50.
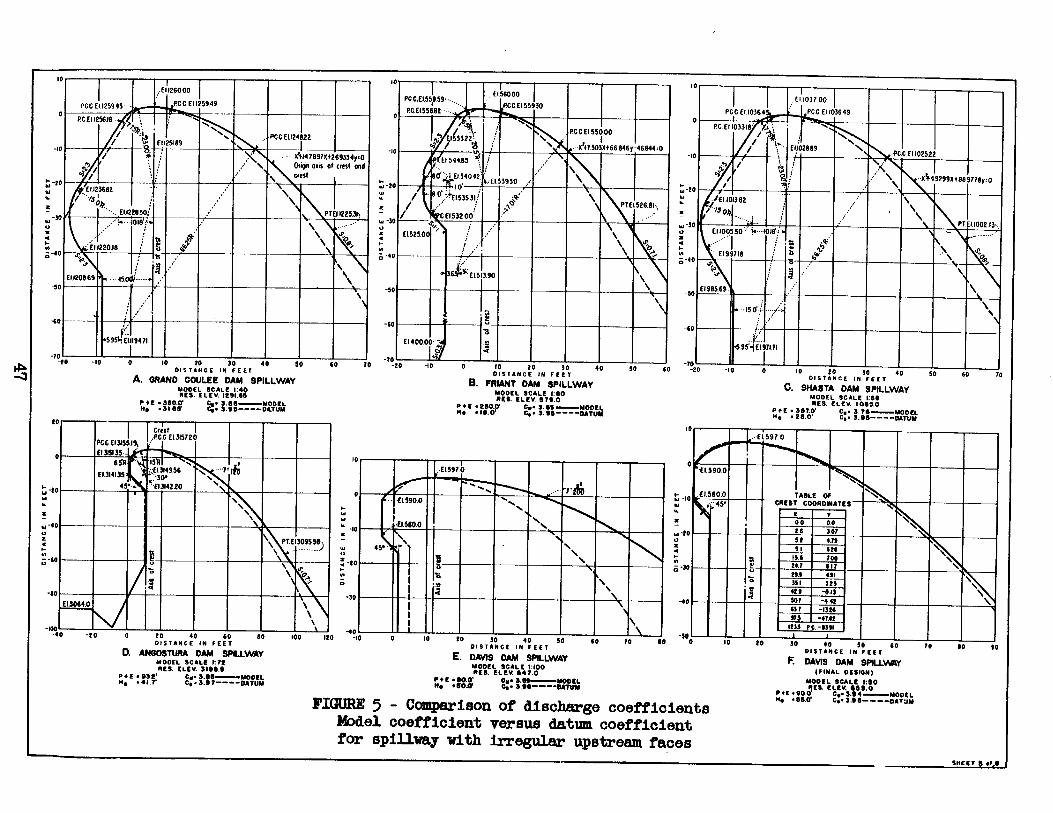
As the experimental work was per- formed in several laboratories by different personnel over a period of years, inconsisten- cies in the results may be expected. There- fore, it is desirable to obtain as many com- parisons as possible. By checking with Fig- ures 2 through 18. it is found that the shane for the DavisDam Spillway (Figure 15) also compares favorably with the American Falls shape. The model coefficient for the Davis shape is 3.59. It was previously demonstrat- ed in the Boulder Bulletin 3, that spillways with straight vertical offsets in the upstream face perform very much the same as though the upstream face of the offset was continu- ous. The Davis Dam Spillway can, there- fore, also be considered. From the two com- parisons, the coefficient of discharge for the total designed head of 11.3 feet will be cho- sen as 3.55 for the American Falls Dam Spillway.
It is evident that a large variety of stock shapes is necessary in a compilation of this type. It is to be understood that the charts do not include all spillway shapes that may be encountered in practice; however, they do include the majority of cross sections used by the larger design offices.
SPILLWAYS WITH OVERFALL SUPPRESSED
Method of Procedure
Earth dam spillways usually follow closely the downstream profile of the dam; conse- quently, they are not steep and the approach depth is shallow. ln the case of the free over- fall dam sections just presented, the only important factor affecting the coefficient.of discharge was the shape of the overfall sec- tion Three factors, however, affect the co- efficient of discharge on the earth dam type of spillway: (1) the depth of the approach channel; (2) the shape of the overflow or gate section; and (3) the elevation of the floor of the channel or chute immediately downstream from the gate section. The individual effects of each factor are evaluated in Boulder Can- yon Bulletin 3, Part VI, but when combina- tions of the three factors must be consid- ered simultaneously, the following proce- dure is the best for determining over-all dis- charge coefficients.
From Figure 21, it can be seen that the efficiency of three flat spillways shown there- on can be increased considerably by making use of a small ogee, or overflow crest, at the gate section and providing a free getaway downstream The solid lines represent the
actual shapes of the spillways, while the dash lines are datum shapes. The method of plot- ting is different than for the previous free overfall shapes, principally to illustrate a point For fl&t spillways, the shapes are plot- ted with a common vertical axis, but due to the better efficiency of the datum shape, its crest has been elevated to show that each spillway section will pass the same discharge for the rmximum reservoir elevations. Should the more efficient datum shapes on Figure 21 be used, it would be possible to either reduce the height of the gates or,by holding the crests at their original elevations, shorten the width of the gate sections. The datum shapes, as ‘drawn, will have atmospheric pressure over the face of the ove&.lls proper for the max- imum discharge condition, while the chute floor downstream has been dropped to an ele- vation where it will have no effect on the dis- charge coefficim In actual design, the layout of the gate section will depend on existing to- pography and other practical considerations as well as efficiency.
Figures 21 through 31 all represent earth dam spillways in which the discharge is re- tarded by the position of the chute floor im- mediately downstream from the gate section
3

and by the skallow depth of approach These are dimensionless plottings in which the X and Y distances are related to the total design head. The scale is the same as in the pre- vious charts. The prototype dimensions for these spillways can be found in the Appendix E~;.II,s of the reference number under each
Application of Results
ExamDle 2: Soillwav with overfall ismressed
Determine the discharge coefficient for the Kachess Dam Spillway, shown on Figure 32, for the total designed head of 8.0 feet This spillway has not been rated previously.
The procedure to follow to obtain the coefficient of discharge for this flat profile spillway is the same as described in Example 1.
The dimensions of the overfall portion should be divided by the designed head, and the spillway in question should be drawn to the standard scale on a piece of transparent paper, A dimensionless plot of the Kachess Spillway is shown on Figure 33A. The trans- parent plot is superimposed on the stock shapes of Figures 21 through 31 until one, or preferably more than one, shape is found to be col-rparable. Either actual or datum shapes
may be used, as the discharge coefficients are listed for each. It will be found that a reasonable agreement exists between the Ka- chess Spillway shape and the following:
Coefficient of Dam spillway Figure discharge
Boca Scofield f; z: Unity Deer Creek 2”:
;:g
Keyhole 29 &6
Average 3.49
It will, therefore, be assumed that the coefficient of discharge for the Kachess Spill- way for the total design head of 8.0 feet is 3.50.
When using the stock shapes of Figures 21 through 31, it should be kept in mind that the flat portion of a chute immediately down- stream from a gate section can have a more marked effect on the discharge coefficient than the approach depth upstream Thus, it is more important to match the chute floor immediately downstream from the overfall than the approach floor upstream The gen- eral effect of the position of the chute floor on the coefficient of discharge can be read- ily observed from Figure 44 of the Boulder Canyon Bulletfn 3, previously mentioned.
DETERMINATION OF COEFFICIENT OF DISCHARGE CURVE
Spillways With Free Overfall
The coefficient of discharge curves ob- tained from the free overfall models of Fig- ures 2 through 18 are shown plotted in a di- mensionless form on Figure 34. The ordin- ate, II/Ho is the ratio of any total head to the total designed head, while the abscissa, C/C is the ratio of the corresponding coefficien P of discharge for the .head H to the coefficient for the designed head, Ho A single curve was drawn through the mass of points, as there was no logical order to those that scattered. The scattering is therefore considered ex- perimental error. When one considers the number of models involved, varying in size and scale, and considers that the testing was performed in several laboratories by a num- ber of individuals, the agreement is all that can be expected.
Spillways With Overfall Suppressed
The same method of plotting was used for the earth dam spillways of Figures 21 through
4
31 and these results are shown on Figure 35. It was again possible to draw a single curve through the points. The curve is steeper than the free overfall curve and does not show as much variation in the value of C/Co. As the coefficient of discharge is usually lower for this type of spillway, it cannot vary as much as for the free overflow. It can be noted that the curve doubles back for heads greater than 1.2 times the design head and the maximum value of C/C is slightly more than 1.0. This is explained%y the fact that, as the head in- creases over one of these flat spillways, the floor effect downstream becomes more pro- nounced. The result is a decrease in the co- efficient of discharge.
As there is no particular order to the points on either Figures 34 or 35, there is no basis for drawing intermediate curves be- tween the two lines already established. Thus, it a-s that the discharge coefficients con- sidered in this monograph fall into one type or the other. In attempting to classify a spill-

way as to type, it may be helpful to observe the values of
H o and ( hd + d) actual P (hd + d) experimental tabulated in Figures 34 and 35.
Application of Results . J=mDle 3. Co efficient curve for free
overfa&pillway
Determine the entire head versus co- efficient of discharge curve for the Ameri- can Falls Dam Spillway from the one point obtained in Example 1, where Ho = 11.3 feet and Co = 3.55.
Values of C/Co for corresponding values of H/H, are read from the curve on Figure
34. These values are tabulated as shown in Table JA. With Ho and Co known, values of H and C are computed. The resulting head versus coefficient of discharge curve is plot- ted on Figure 20B.
-mole 4: Coefficient curve for soillway With OVerfall SUDoreSSed
Determine the complete head versus coefficient of discharge curve for the Kachess Dam Spillway from the one point determined in Example 2, where Co = 3.50 for the de- signed head of 8.0 feet.
The procedure is the same as for Ex- ample 3 except that in this case the H/Ho and C/Co values were obtained from Figure 35. The computation is tabulated in Table 1B and the resulting head-coefficient of discharge curve is shown on Figure 33B.
WATER SURFACE AND PRESSURE PROFILES
Where the experimental information was available, average water surfaces and pres- sures have been plotted on the charts of Fig- ures 2 through 18 and 21 through 31. The water surface and pressure profiles are for the actual overfall shapes operating at their respective designed heads, Water surfaces for the datum shapes are not shown as these can be computed from Bulletin 3, Part VI, Boulder Canyon Project Final Reports. The water surface profiles will be found useful where the designer desires to locate gate pins or counterweights in close proximity to the maximum water surface. They may also be useful in determining the height of training walls. One should be reminded, however, that a water surface profile is not nearly as easy
to define as the profile of the lower nappe, because piers and entrance conditions can produce diagonal surface waves and fins of appreciable magnitude.
Pressures are more or less indicative of the coefficient of discharge. Generally speak- ing, if the pressures are appreciable and posi- tive, over the overfall face, +he coefficient of discharge will be low. Conversely, subatmos- pheric pressures generally distributed over the overfall face are conducive to high dis- charge coefficients, The pressures are plot- ted using the overfall face as a zero reference line, thus pressures above the line are posi- tive and those falling below the line are negative.
Table 1
COEFFICIENT OF DISCHARGE COMPUTATIONS FOR EXAMPLES 3 AND 4
A H/H, c/co H C
American Falls Dam % 0.843 2.26
Spillway . 0.900 4.52
2: 0.940 6.79
33%
Ho = 11.3 2% 9.05 3:33
1’:;
3.46
co= 3.55 1:025 11.30 13.57 Ei . B
Kachess Dam Spillway
Ho 8.0 = co = 3.50
H I c I 1.60 3.20 %
2% 3:41
8:00 3.47 3.50
9.60 3.51
5

I I
HO \
E w----w----- m
i \ I
FIGURX 1 - Identification of symbols.
6

WHEELER DAM WHEELER DAM c, = 3.99 - c, = 3.99 - Go = 3.96 --- Go = 3.96 ---
APPENDIX-FIG. IA APPENDIX-FIG. IA
i HOOVER DAM 1 SHAPE 3 MODEL M-l
I SE = 0.66 C,= 3.56 -
I - c, =3.93 --
APPENDIX-FIG. 1C
I I
Y HO
0 1.0 2.0 x Ho
FIGURE 2 - Spillways with vertical upstream face.
SHEET I OF 4

HIRAKUD DAM
-1.0 ’
APPENDIX -FIG. 4A
0.5
0
u
HO
-I. 0
-2.0
f I
I \ \
I \\
.‘” \ I 2 \ I . I I \
I CANYON FERRY DAM \
p$ f 0.26 CM = 3.70 Go = 3.96--
APPENDIX -FIG. I8
2.5
FIGURE 3 - Spillways with vertical upstreaxu face.
SHEET 2 OF 4 8

KESWlCK DAM KESWlCK DAM -1.0 -1.0 0, = 3.50 - 0, = 3.50 -
CD ~3.85-0 CD ~3.85-0
F1GUR.E 4 - Spillwaya with vertical upstream face. SHEET 3 OF 4

1.0
f -- Ho
(HIGH CREST) c, = 390--. CD 2 3.90--
APPENDIX - FIG. 48
0 I.0 2.0
?--n-T-
HOOVER DAM SHAPE 2 MODEL C-3
SE = 0.66 c, CD 2 = 3.91 3.91 - -- \ \ APPENDIX- FIG. 1F
0 2.0
FIGURE5- Spillways with vertical upstream face. SHEET4 OF4
10

0
Y G
-1.0
- 1.5
MADDEN DAM MADDEN DAM c, = 3.71 - c, = 3.71 - CD = 3.97 --- CD = 3.97 ---
APPENDIX - FIG. 2C APPENDIX - FIG. 2C
- 1.5 - 1.0 0 x
1.0
Ho
u Ho
MARSHALL FORD DAM (INITIAL DESIGN )
CM = 3.96 -
FI(3 KRE 6 - Spillways with BlOpiZlg U&JBtretiUIt face.
Ho
11 SHEET. I OF 7

I.0
0
Y
&I
-1.0
-1.5 -1
MODEL C-8 GM = 3.76 - CD =3.92 --
APPENDIX -FIG. 10 1
HOOVER DAM HOOVER DAM MODEL C-8
GM = 3.76 - CD =3.92 --
\ \
\
\
‘--_ --.
-.
j
Pressure-'
r. r. ‘\ ‘\
‘\ ‘\ \ \ \ \ \ \
1 &=D.16 CM 2 3.64 - Go = 3.97 - -
APPENDIX-FIG. 2E
1 ‘1 \ \ \
2.0 2.5
?‘Ix3uBE 7 - splllwap3 with dLoplm& upstmam face.
SHEET 2 OF ?

0
Y -
HO
-1.0
-1.5
Y G
-1.0
-2.0 -1.0
Pressure---“’
I I
HOOVER DAM SHAPE 0 -FINAL MODEL C-6
GU = 3.85- Go z3.92 ---
APPENDIX - FIG. 28
//’ //’
\, \ \, \
/ /
\
v, v,
/ / = =
c c
, ,
/ /
r- r-
NORRIS NORRIS DAM
I
“0 - P+E -0.13 Co = 3.96---
APPENDIX- FIG. 3E \ ‘\
0 X
I.0
G
FIGURE8 - Spllluaye with doplng lqls~eam face.
2.5
13 SHEET 3 OF 7

-1.0 - G, : 3.76 -
c, = 3.64 - -
APPENDIX- FIG. 3C
-1.5 * -1.0 0 Y 2.0 2.5
Y iT0
-1.0
MOON LAKE DAM \
C, = 3.80 - CD f 3.89 - -
APPENDIX-FIG. $A
FIGUREg- Spillwsye with t3loplng upstreapn face.
SHEET 4 OF 7
14

-1.0
i-1.0
.O.S L‘
-1.0 -1.0 0 0 I.0 I.0 2.0 2.0 2.5 2.5 X X
6 6
Pressure
IMPERIAL DAM CM = 3.75 - co - 3.91 --
APPENDIX -FIG. 38
I ii
/ / HGOVER DAM HGOVER DAM SHAPE 4 SHAPE 4 MODEL M-3 MODEL M-3
C,= 3.68 - - = 0.66 C,= c, = 3.68 3.92 -- G, = 3.92 --
APPENDIX-FIG. 3F APPENDIX-FIG. 3F \
FIGURE 10 FIGURE 10 - spiuways with slopblg upstreaItl face. - spiuways with slopblg upstream face.
2.5
15 SHEET 5 OF 7

I HAMILTON DAM -1.0 (
’ ‘\ ’ &.I6 GM=3.67 - \ r
CD = 3.90 --- \
APPENDIX -FIG. 3D \
v v Ho Ho
-1.0
CEDAR BLUFF DAM GM’4.02 - -
CD = 3.88 --- APPENDIX -FIG. 4C
CEDAR BLUFF DAM
= 0.96 GM’4.02 - -
CD = 3.88 --- APPENDIX -FIG. 4C
-2.0 -2.0 ,
-1.0 -1.0 0 0 1.0 1.0 2.0 2.0 x x Ho Ho
FIGURZll- Spillways with sloping upstream face.
SHEET 6 OF 7 16

0
.x
HO
-1.0
I
TRENTON G, - 3.68- \.- CD = 3.76--
L \
APPENDIX -FIG. 4F \
Outlet trashrocks interfere with flow \ over spillway.
G, - 3.68 - CD = 3.76--
APPENDIX -FIG. 4F
Outlet trashrocks interfere with flow over spillway.
I I I -
2.0 2.5 0
HIWASSEE DAM
Ho P3 so-'4
G, = 3.82 Go = 3.98- -
APPENDIX -FIG. 4E
FIGURE 3.2 - SpilLways with sloping upstream face.
StiEEf 7 OF 7

-1.0
$0
-2.q
-2.2,
C
-1.c
Y
ii-,
-2.0
-2.5
CAPILANO DAM \ ’ & ~0.23
C, = 3.62 - GI, f 3.95 --
APPENDIX-FIG. 68
I.5
f-
I-
-1.0 0 I.0 : X
G
BHAKRA DAM
Cy 13.66 - co 23.95 --
APPENDIX -FIG. SD
-1.5 -1.0 0 I.0 it.0 A Ho
FIGURE 13 - spill~s with sloping and ofmet upstream face.
SHEET I OF G
18

0
Y &I
- I.0
- 1.5
GRAND COULEE DAM
APPENDIX- FIG SA
I.0
0
Y
FT,
-1.0
-I .5
DAVIS DAM I (FINAL DESIGN)
$ : 0.64 c u = 3.94 Go =3.95 --
APPENDIX -FIG. SF
FIGURE 14 - spillways with offset in upstream face.
SHEET 20F 6
19

0
Y
Kl
-1.0
- 1.5
SHASTA DAM
APPENDIX- FIG 5C
0
v
HO
FlGUEB15- Splll~e 182th offeet In upetm8m face.
SHEET 3 OF 6
20

0
Y
Gi
-1.0
/-
-1.5
ANGOSTURA CM = 3.88 - - CD = 3.97---
APPENDIX -FIG. SD
^ - l.U cl X I.0 2.0
K3 0.5
0
-1.0
-2.0
FRIANT DAM
CD = 3.%- - APPENDIX- FIG. 58
-1.0 0 I.0 2.0 X
G
FIGURE 16 - spiuways with offset in upstream face.
. 21
SHEET 4 OF 6

0.5 -
Y Iid
I -1.0
I
I
-2.0 . -1.0
\
co = 3.99- -
I I APPENDIX -FIG. 6C I ‘\I \ I
I I FONTANA DAM 1 I I APPENDLX - FIG. 60 I
0 1.0 2.0 2 X
4l
FIGUREl7- spiuways with off set in upstream face.
SHEET 5 OF 6 22

/
\
<
\ 1
<
b
! DOS BOCAS DAM p$ = 0.22 G, - 3.95 CD - 3.97 t
- p$=Q.22 G, - 3.95 CD - 3.97
APPENDIX- FIG. 6A 1 1 , APPET- FIG. 6A ,
0 1.0 0 1.0
- I.0 -2.0
Ho
APPENDIX -FIG. 6E
FIGURE 18 - spillways with off set in upstream face.
SHEET 6 OF 6
23

T----Upstream face of dam
-A,& ------------ 2,‘0’-----------;
PIER -SECTION
: --_-------- 21’-0” --_------
,-Normal W.S. El.4354.5
p ---m--------, 5 Boys @ 36’0’ = 540’-O’--------r--+--7
I t I I
I I I I ’ I
I / I l- - I I I I I
e$$-- End pier Intermediate pier --___ Jtiii
UPSTREAM ELEVATION
/El.432129 -_v_--
.,.:
.“.d,
0.’ :
: 0”
,’ ‘o, .‘;,
.v . . ‘D:
:o :
.+. ,.
*:-.
_’ .‘.
.‘e..q . .
.’ .‘d. ‘. ‘, :, :.
.: .‘. v “. .,cf . .
: ‘0 0 . . 6’;. .,. . ‘,
.., ;: .o’
..‘, a.,., :. 0.’
. ...; : o-
0. “O. _. :. ..:: .’
.b ‘;
0. .” . ;, :; :, .;..
. SPILLWAY
I I ! I
300.42 I 0 0 ,’ 4 .“..‘;., ., ..: : .s .fi ‘0. . . ,. .;. . .
a’ :. ‘0..
: .. . 10
SECTION .. . .
FIGURE19 - Elevation and section American FaUs Dam Spillway.
24

0 X
1.0 2.0
H,
A- OVERFALL CREST SECTION
14 I I I I I I I
I
Desion head: I 1.3’ 1 I /I
kl W IL
lx I I I I I I I I I I I/ I 0 I I I I I I I I A I t
Y
I I Ii I I III I I l/l I
II II II III1 I/ I
I I I I I I I I II/
i I l/l / I I I I IA I I
3.1 3.2 3.3 3.4 3.5 3.6
CinQ=CLH 4
B- HEAD- COEFFICIENT CURVE
2.5
F- 20 - American FaYs ‘Dam SPi-W (‘-mles 1 ana 3).
25

* -1.0 0
Hxo
I .o 2.0 2.5
RYE PATCH DAM H,- ‘7 C,:2.81 -
- P+E 3.53 co53.77 -- APPENDIX- FIG. 7A
u Ho
-\ \
\ \
\
h 3
s
AGENCY “AkEY DAM Ho 17 GM- 2.73 -
-5 P+E 3.23 Go= 3.78 --
CONTRACTION IN CHUTE D.S. APPENDIX- FIG. 70
ii
PINE V&V DAM .
Ho 4 Cm= 2.74 - P+E= 1.81 G0=3.86 --
CONTRACTION IN CHUTE D.S. APPENDIX -FIG. 7C
FIGURE2l- Spillways with overfall suppressed.
SHEET l OF II 26

Y
G
I.0 r
0 ’
-1.0 L
-1.5 * -I 0
Y J-Jo
Y \ \ \ ‘\ . \ . -.
1 -.
ALCOVA DAM HO 8 = 2.85 -
PtE = CM
2.81 GO = 3.80 --
APPENDIX - FIG 7E
I 1 I I
0 X
1.0 2.0 2.5
Ho
.--
-1. 0 Ho 5.44 CM : 3.30- I GE=3.17 Co = 3.78 - -
APPENDIX -FIG. 7F
-1.5 - 1
-1.0 0 1.0 20 2.5 1L Ho
SHADOW MOUNTAIN DAM 1
F1GUR.E 22 - spiu~ay13 with overfall s~pp3ss~a. SHEET 2 OF11
27

L
HO
GREEN MOUNTAIN DAM HQ 5.5 C, = 3.21 -
P+E’ 3.16 CQ = 3.70--- CONTRACTION IN CtiUTE D.S.
APPENDIX - FIG. 78
U 1L
1.v 2.0
Ho
ANDERSON RANCH DAM Hg 3.80 GM = 3.40 - _
- P+E 3.46 GQ - 3.76--- APPENDIX- FIG. 8A
.̂ - -
HO
BARTLETT DAM Ho 3.57
P+E= 2.64 CM = 3.40 - C, =3.?6 ---
APPENDIX - FIG. BB
~~camz 23 - SpilLways with overfall suppressed.
SHEET 3 OF II 28

t?o
GRANBY DAM Ho 5.0
“c”, = 3.20 - _
m-3.1 = 3.7 I --- APPENDIX- FIG. BC
-1.0 0 1.0 --
X ?r,
VALLECITO DAM Ho 3.8 C, = 3.42 -
Px ’ 3.0 Co = 3.720---- CONTRACTION IN CHUTE D.S.
APPENDIX - FIG. 8F
-1.0 -1.0 0 0 x X
I.0 I.0 2.0 2.0 2.5 2.5
BOYS;: DAM BOYS;: DAM (PRELIMINARY DESIGN)
HO 3.7 I - PtE =
cy = 3.37 2.74 C, = 3.76 ---
APPENDIX - FIG. BE
(PRELIMINARY DESIGN) HO 3.7 I
PtE = 2.74 cy = 3.37 - C, = 3.76 ---
APPENDIX - FIG. BE
FIGURE 24 - Spillways with overfall suppressed.
29 SHEET 4 OF II

SCOFI ELD DAM -I .o “0 4.16 CM = 3.44 - .
iTE = 3.14 CD = 3.72 --
l APPENDIX -FIG 9A I
-1.0 1.0 0 1.0 2.0 2
-1.0
-1.5
I I BOCA DAM 1 “0 3.08 CM = 3.50 -
P+E = 2.52 CD = 3.81 --
APPENDIX -FIG. 8D
- I .o 0 1.0 2.0
x Ho
FIGURE 25 - spillways with overfall suppressed.
2.5
SHEET 5 OF II 30

-1.0
-1.5 -I
-4- -
FRESNO DAM “0 1.39
: = 3.52
im 1.34 G, rJ 3.88 -
CD - - APPENDIX-FIG 98
#
0 1.0 2.0 2
\ ‘.,..
I I
Ho 3.20 = 2.75
c,=3.48- . co = 3.79 --
UNITY DAM UNITY DAM c, = 3.48- co = 3.79 --
APPENDIX -FIG. 9C 1 I APPENDIX -FIG. 9C I I
0 1.0
FIGURE 26 - Spillways with overfall suppressed.
31
2.0 2.5
SHEET 6 OF II
i

0
u Ho
-1.0
u Ho
SHEET 7 OF II
\ ‘. ---a---
BULL LAKE DAM Ho 2.75 CM = 3.58
P+E = 2.34 GI, - 3.04 --
APPENDIX-FIG. SO L
0 1.0 2.0 x Ho
\
‘. A----
CABALLO DAM Ho 2.62 CM = 3.48 - P+E- 1.9 co :3.85 --
APPENDIX -FIG. SE
PIGuRE27- spillways with OverfdJ- sup~es~d*
32

-1.0 0 1L
1.0
M~n!*‘ki?AM HO 4.0. G, 7 3.28 -
P+E ’ 2.57 ‘GQ = 3.80--- CONTRACTION IN CHUTE D.S.
APPENDIX - FIG. 9F
HO
DEER CREEK DAM Ho 5.0 h - 3.46 -
P+E = 4.22 CD = 3.61 --- CONTRACTION IN CHUTE 0.S.
APPENDIX - FIG. 9G
--
-1.0 0
ALAMOGORDO DAM
& = ::282 %I - 3.18 - c,, = ?,.79---
CONTRACTION IN CHUTE D.S. APPENDIX - FIG. 9H
FIGURERS- spillways with overhll. suppressed.
SHEET 8 OF II
33

MEDICINE Cl&ii: DAM (LOW CREST)
HIJ 4.53 P+E’ 3.74
CN = 3.54 CQ = 3.73
APPENDIX- FIG. IOC
0
&
0.5 \ A-r.
-1.0 0 r I.0 2.0 2
P+E= 3 4.0 Cu= 3.56 3.3 Co: 3.76
APPENDIX-FIG. 100
-1.6 0 X
1.0 2.0
DICKIN%N DAM
&= 2.75 CM= co = 3.75 3.60 APPENDIX -FIG. IOB
FIGURES- spiU.~ays with overfall suppressed.
SWEET 9 OF II 34

Y Ho
0
-0.5
-I
1.0
I Ho
0
-0.5
Y Ho
-
\ \ \ ‘\
/-
I I I I x 1.0 2.0 :
CACHlJitA DAM Ho 5.0
FE= 3.55 Cu=3.42 - CD ~3.76 --
APPENDIX -FIG. IOA
?. & 1.0‘ 2.0
FALCON DAM Ho 3.44
P+E= 2.50 c&=3.33 - CD”3.78 --
r-1 I
APPENDIX-FIG. 110
1 I I I I I -1.0 0 X I.0
HORSE&E DAM
P+E= h 4.75 Gu”3.20 - 2.54 --
APPENDIX -FIG. c‘, =3.74 116
FIGURE 30 - Spillways with overfdl suppressed.
3.5 SHEET 0 OF I I

Y
F.
0
-0.5
-1.0 0 L
I.0 2.0 2.5
Ho
CASCADE DAM HO 6.67 c,” = 3.38 -
P+E ‘4.75 Go = 3.57 --- APPENDIX -FIG. IIE
X I.0 z Ho
TIBER DAM (WITHOUT CURTAIN WALL)
HO 3.49 CM = 3.49 - P+E 2.77 c, = 3.77 - --
APPENDIX- FIG. IIA
,I.0 0 &
‘.O 2.0
HO
BOYSEN DAM (FINAL DESIGN)
“0 5.20 3.45 - P+E =
cm = 4.5 I c, = 3.57 ---
APPENDIX- FIG. IIC
2.5
FIGURE 31- spillway6 With OV8l?fa SUp$W3668d.
SHEET II OF II 36

N01133S 13NNVHE-l 11x3 N01133S 33NVMlN3 002522 13
00’6922 13,’ p . ..__... “&+O~ . r(
: ; k ..p __., ooo(.~ ----j ^. _. : L .. .._ ........ l-ml ......
-ipog F.. ........ .,gveg ..... ,_. _. ,~~ .FZ 01.’
NW-Id

0
Ho
A- PROFILE OF GATE SECTION
3.1 3.2 3.3 3.4 3.5 3.6
c in Q=CLH%
B- HEAD- COEFFICIENT CURVE
FIGURE 33 - Kachess Dam Spillway (Examples 2 and 4).
38

I I I I II 11 ” ’ “1
0 llllllllll~~ll 0.9 0.9 r 1.0 I.
v CO
-9-----r ----- j ha
SPILLWAY
I
FIGURE 34 - Coefficients of discharge for other than the aesign head (free overfall spillways).
39

I I Hg SPI LLW --’ Ihd+d (Actual)
P+E Al
I.3 Fresno I .64 3.7 Boysen (Prelim.) .85 2.6 Gob IOIIO .66 I
FXXRE 35 - Coefficients of discharge for other than the design head (spillways with overfall sup~essed).
40

APPENDIX
41


1 a 1 / /I 1
/’ / /

A. MARSHALL FORD DAM SPILLWAY ,CINAL OESION,
MODEL SCALE 140.9 RES. ELE”. 7420
PIE-9149' w, - 29.0 2: *.:09: -. o”*\v
8. HOOVER DAM SPl+LWAY SHIPE s- FlNlL MODEL c-6
MoatL 6Cbl.E 1:20 MS. ELE”. IL32.0
:; E = $& 8:: :.“o: _z g:“r”,p
SPILLWAY SECTIONS WITH VERTICAL IJPSTREAU FACF
c. MADDEN DAM SPILLWAY MODEL SC&LE 1:72
RES ELEV 265.4 ; : E : 1;,z4,w C.. 3.71 - YOOEL
c.- 3.97--- OI,“Y
0. MARSHALL FORD DAM SPILLWAY UNlTlAL OESlCN,
MODEL SCLLE 1:4oa RES ELE”. 670.0
: : E = ;$y’ C.- 3.96 -MODEL c,- 3.9s---MTuY
E. ROSS,~D~A~QPILLWAY
M00EL”9C.LE I:60 RE9 ELE”. 15450
‘H; E : h’b”os’ I&- 3.64 - MODEL c.= 3.97 - -- o.,&al
SPILLWAY SECTIONS WITH SLOPING UPSTREAM FACE
FIGURE2 - Compewlaon of discharge coefficients Model coefficient versub datum coefficient
for spillway sections with vertical end slapltq upstream faces

45 .

A. HIRAKUD DAM SPILLWAY 8. MEDICINE CREEK DAM SPILLWAY (HIGHCICST) YOotL SCALE I’*0 YOOLL ,CALE 1’00
“C,. LLCY. .10.0 ILS. ELL”. *101.,0 He = 17.0’ cr= ,.m-YODEL HO =2*7 c.. , ,o--YODEL PtE-lOs ce= s.w-- -clAT”Y PtE-2e.2 co= I.‘)O-----D.T”Y
c. CEOAR BLUFF DAM SPILLWAY YODEL SCALL ,:.a RES LLEY 21930
Ho= !a?’ Cr’ +a*----YODEL PtE”O8’ cs = 3.8~----DAI”Y
t? TRENTON DAM SPILLWAY YODEL SCLLE 1:s. RLI. LLE”. 21~100
FIGURE 4 - Caqarieon of diecharge coefficiente Model coefficient versus datum coefficient
Mlscellaneou6 qd.llway shape6
0. ANGDSlURA DAM SPUWAY UODEI. SCILC I:IL “ES. CLL”. II,,.,
g c : fff: C.. S.ss-YODcL c..3..7----Dm”Y
8. FRIANT DAM SPILLWAY YODEL SC.LC ,:so RES. LLL”. o,,.o
‘.p :f,qodp C.. S.SS-YODLL 0,. s..s----DA,uy
E. DAVIS DAM SPHLWAY MODLL SCALE 1:100 *Es. LLLV. WT.0
CIC .*o.o, “. 06000
CW S.WWDCL 4. s.s.----0mn
IN FEE,
G. SHASTA DAM SPILLWAY
F. DAVIS DAM SPUW ,FIWAl. Dtslo”,
YODLL *cALI ,:*o
FICURPj- Comparison of diecharge coefficlentr 3 Model coefficient verma datum coefficient for spillway with irregular upetream faces

I ’ S
I A/I I s ,.\ _
48

A. RYE PATCH DAM SPILLWAY YODEL SOILL Inso RES. ELE”. 412,-o
” C.6 1% I
4. *.I, -YOOLL
14.1 4 c, ,.71---UKnJY
tt.GREEN MOUNTAIN DAM SPILLWAY ,FlNlL DESIGN,
MODEL S0ll.E 1*40 “ES. ELE”. 1950 0
%o ‘:,’ (*. a.*, - YODEL 0,. 3.76 ---DATUM
19.76 6.96 CONT”,OT,ON O.S. CROM SAT6 SECTlO”
E. ALCOVA DAM SPILLWAY
“00 s
RES ELE” ssoog P.C h.2 66 - UOOLL
C,., SO---DAWN 53 s 11.5
FIGURES- Comparison of discharge coefficients Model coefficient versus datum coefficient
for earth dam spillway sections with &allow approauh depth
c. PINE VIEW DAM SPILLWAY UODEI. S0Il.E ,*,o RES ELE'A,6100
” I% ‘4’ E
0.. *.,.-MODEL
IL.9 1.1 c..1.66---oLT"u
CONTRACTION D.S.FROM OATS SECTtON
F. SHADOW MOUNTAIN DAM SPILLWAY MODEL SCALE b30 RES ELE” 63610
Ho P.E Cr. ,.lO-MODEL I9 1.0 G..3.76---OITUY I,., 1.4

A. ANDERSON RANCH DAM SPILLWAY &lAtC:c~s~oi!:o
I)El. CLEW .lS‘.O
E. BOYSEN DAM SPILLWAY ,PRLLIMI”A”” OE6IONl YcmLL SCA‘L ,:oo
RES. ELE” 4711.6
c. QRANBY OAM SPILLWAY (FINrL OESlON I
WODEL SCILE I:.* RES. ELL”. SP76.0
FIGURE 8 - compcW1s0n of discharge coefficlerlts Model coefficient versus datum coefficient
for earth dam splllway sections with shallow approach depth

I . ::
51

I I ‘. w Oriqin ot cr55t oxir I I / Iii I I
A. CACHUMA DAM SPtLLWAY YOOEL JCLLE I:60
“LS. LLC”. 737.6
,“I.* 1e.t
‘7$ 9.9’
o.= ,.*P--UOoEL cD’1.7*--- DATUY
OISTANCL I” n-5,
B. DICKtNSON DAM SPILLWAY UOOLL SCALL 1:3* ICI. ELE”. e.tmo
He P+E te.4 4.5 C. - s.ts --YODEL te.4 4., C~=3.~0---oA7”Y
C. M~Dlc~~~~~ftE~~; “;A$ SPILLWAY (LOW CREST 1
IL,. CLE” L3¶*JO
3:s CtE
7.9. C”’ 5.84 “OOEL ,I.* ..* co= ,.,I----DATUM
0. KEYHOLE DAM SPILLWAY YODEL SCALE LPI REI. ELC”. 4lL1.10
2% ‘7Y C.=,.Se YOOLL CT.0 e.4 C~=3.,,---0*7”Y
FIGURE 10 - Comparison of discharge coefficients Model coefficient vt3rSus datum coefficient
for earth dam aplJ-lway sections with &allow approach depth

i I/ I I II A
,o --- -------- --_ ,$‘ F(I ____ I A! I
t i iir’i SI / I I
n
T 4
53


