BEXLEY CITY SCHOOL DISTRICT FINANCIAL PROJECTION 5705.391 O.R.C AS ENACTED BY SUB. H.B. 412 FOR FISCAL YEARS ENDING JUNE 30, 2014 THROUGH 2021 OCTOBER 2016 First Adoption MAY 2017 Revised Questions - see or call Kyle F. Smith, Treasurer/CFO 614-231-7611 (5210) To see any Ohio school district's five year plan go to the following web site: www.ode.state.oh.us/ go to top of page - "Topics" - choose "Finance" In the Topics section choose "Five Year Forecasts 1
Transcript
BEXLEY CITY SCHOOL DISTRICT
FINANCIAL PROJECTION
5705.391 O.R.C AS ENACTED BY SUB. H.B. 412
FOR FISCAL YEARS ENDING JUNE 30, 2014 THROUGH 2021
OCTOBER 2016 First Adoption
MAY 2017 Revised
Questions - see or call Kyle F. Smith, Treasurer/CFO614-231-7611 (5210)
To see any Ohio school district's five year plan go to the following web site: www.ode.state.oh.us/
go to top of page - "Topics" - choose "Finance"In the Topics section choose "Five Year Forecasts
1
SECTION ONE
GENERAL GUIDELINES
2
Bexley City School District
Financial Projection 5705.391 O.R.C. as enacted by Sub. H.B. 412
For the Fiscal Years Ending June 30, 2014 through 2021
Introduction The financial projections are required by section 5705.391, R.C. enacted in Sub. H.B. No. 412. The projections are intended to provide a method for the State Department of Education and the State Auditor’s Office to identify school districts that will have financial difficulty. The format of the projection has also been designed as a guide for determining the ability to certify obligations under the requirement of section 5705.412, R.C. The projection package consists of three spreadsheets (pages 6-7). The submission of spreadsheet A on page 6 to the Department of Education will satisfy the requirements of H.B. 412. Spreadsheet B (page 7) is intended to assist in the recognition of amounts that may require additional analysis and the identification of trends. Spreadsheet B presents the average percentage change in revenue and expenditure accounts over the three-year period covered by the actual data and calculates the percentage change in the projected amounts from year to year. The Auditor of State and the Department of Education have established the format of these spreadsheets. The five-year forecast is required to be completed twice a year (October & May) and submitted to Ohio Department of Education. Assumptions contained in this forecast are based on information that is deemed the best available as of the time of preparation. Actual amounts will differ and any significant difference will be explained in the next forecast. General Guidelines Time Period – Amounts are for a fiscal year of July 1 through June 30. The projection is to include three years of historical data and five years of projected data. The first year of projected data will be the year in which the projection is submitted. Funds Included - The projection is to include the following funds: general fund. Entering Amounts - All amounts are rounded to the nearest dollar. Debt Payments - Debt payments that were paid from money that otherwise would have gone to the general fund. This section does not affect Bexley at this time.
3
Bexley City School District, Financial Projection, 5705.391 O.R.C. as enacted by H.B. 412 For the Fiscal Years Ending June 30, 2014 through 2021 Property Tax Allocation - Money received from the homestead, rollback provisions of State statute and for reimbursement of the $10,000 personal property tax exemption are to be presented separately from the real and personal property tax amounts. See line number 1.050 of spreadsheet A. New Levies - Money from a new levy may never be considered for determining the ability to certify an obligation under the requirements of section 5705.412, R.C. unless the electorate has already passed the levy. The Board made a pledge to the community with the passage of the 0.75% School District Income Tax in November 2004, that the District would not ask for additional funds for a five-year period and hopefully for a six-year period or longer. The Board did not ask for a levy until November 2010, which was six years. A 6.5 mill levy was approved in November 2010. The promise to the community was to stay off the ballot for 3 years. 2017 will be 7 years. Current projects show a positive balance for the five year forecast. Income Tax Levies - The Auditor of State will treat income tax levies in the same manner as property tax levies. The district’s 0.75% school income tax was required to be paid by residents of Bexley on all income beginning in January 2005. The district received the first payment in April 2005. The collections are received quarterly from the Ohio Department of Taxation. Assumptions - Written assumptions that explain the reasoning behind the projected amounts must be included in the projection for every major revenue and expenditure category. The assumptions that accompany the projections are related specifically to Bexley. 412 Certification of Contracts per Ohio Revised Code Section 5705.412 - Legislation making changes in the 412 certification requirements have passed through the Legislature and was signed by the Governor in early 2000. The language specifies, among other changes, which contracts will require certification, was amended into SB77 and was effective June 30, 2000. The changes include the following items: (1) The requirement for certification will apply to contracts and salary schedules that are the lesser of $500,000 or 1% of the general fund and (2) the certificate must cover the term of the contract or salary schedule. Certification of Adequate Revenues (Rule 3301-92-05) The Rules prescribe the events for which a district must certify availability of revenue pursuant to Revised Code Section 5705.412, which include, among others:
1. Negotiated agreements; 2. Appropriations;
3. Contracts for benefits; such as health insurance; 4. Increased salary or wage schedules; 5. Construction contracts. For purposes of certifying revenue relating to appropriation measures, the Rules provide that the renewal or replacement of existing property tax levies, any new property tax or income tax levies may not be considered.
4
SECTION TWO
TWO SPREADSHEETS
5
BEXLEY CITY SCHOOL DISTRICT, FRANKLIN COUNTY SCHEDULE OF REVENUES, EXPENDITURES AND CHANGES IN FUND BALANCES Spreadsheet A FOR THE FISCAL YEARS ENDED JUNE 30, 2014, 2015 AND 2016 ACTUAL; FORECAST FOR FISCAL YEARS ENDING JUNE 30,2017 THROUGH 2021 May-17
Average Fiscal Year Fiscal Year Fiscal Year Fiscal Year Fiscal Year LINE Fiscal Year Fiscal Year Fiscal Year Annual 2017 2018 2019 2020 2021
NUMBER Revenues 2014 Actual 2015 Actual 2016 Actual Change Forecast Forecast Forecast Forecast Forecast
1.010 General Property Tax (Real Estate) $19,863,754 $22,832,993 $17,684,647 -3.80% $20,689,927 $20,675,000 $20,700,000 $20,710,000 $20,750,0001.020 Tangible Personal Property Taxes 5,328 176 0 -98.35% 0 0 0 0 01.030 School District Income Taxes 7,036,098 6,411,559 7,216,467 1.84% 8,123,073 7,200,000 7,200,000 7,250,000 7,300,0001.035 Unrestricted Grants-In -Aid (Foundation/Casino) 4,160,642 4,127,132 4,150,233 -0.12% 4,096,500 4,158,500 4,158,500 4,158,500 4,158,5001.040 Restricted Grants in Aid (Bus Reimb.) na 16,100 16,100 16,100 16,100 16,1001.045 Restricted Federal Grant SFSF 532 and 504 0 0 0 na 0 0 0 0 01.050 Property Tax Allocation (Rollback & Homestead) 2,788,592 2,809,528 2,811,744 0.41% 2,811,040 2,812,000 2,815,000 2,815,000 2,817,0001.060 All Other Income ( Interest/tuition other) 310,221 386,490 468,111 22.85% 515,000 450,000 450,000 420,000 420,0001.070 Total Revenues 34,164,635 36,567,878 32,331,202 -2.28% 36,251,640 35,311,600 35,339,600 35,369,600 35,461,600
9.060 June Tax Advances- Reserved for next FY 1,694,230 4,451,500 1,700,000 50.47% 1,700,000 1,700,000 1,700,000 1,700,000 1,700,000
9.080 Total Reservations 1,694,230 4,451,500 1,700,000 1,700,000 1,700,000 1,700,000 1,700,000 1,700,00010.010 Fund Balance June 30 for Certification of Approp 20,327,232 20,796,412 21,557,689 22,175,994 19,912,594 16,245,194 11,404,794 5,246,39412.010 Fund Bal June 30 for Cert. of Contracts, Salary 20,327,232 20,796,412 21,557,689 22,175,994 19,912,594 16,245,194 11,404,794 5,246,394
Salary Schedule, Other Obligations15.010 End of Year Balance June 30 for Certification $20,327,232 $20,796,412 $21,557,689 2.98% $22,175,994 $19,912,594 $16,245,194 $11,404,794 $5,246,394
See accompanying summary of significant forecast assumptions and accounting policies 6
May-17 Average Fiscal Year Fiscal Year Forecast Fiscal Year Fiscal Year Fiscal Year Fiscal YearAnnual 2016 2017 % 2018 % 2019 % 2020 % 2021 % Change Actual Forecast Change Forecast Change Forecast Change Forecast Change Forecast Change
June Tax Advances- Reserved for next FY 50.47% 1,700,000 1,700,000 0.00% 1,700,000 0.00% 1,700,000 0.00% 1,700,000 0.00% 1,700,000 0.00%
Unreserved Fund Balance June 30 2.98% 21,557,689 22,165,994 2.82% 19,902,594 -10.21% 16,245,194 -18.38% 11,404,794 -29.80% 5,246,394 -54.00%
Includes: general fund, emergency levy fund, DPIA fund, textbook fund and any portion of debt service fund related to general fund debt
Spreadsheet BBEXLEY CITY SCHOOL DISTRICT, FRANKLIN COUNTYSCHEDULE OF PERCENTAGE CHANGES
FOR THE FISCAL YEARS ENDED JUNE 30, 2016 ACTUAL; FORECAST FOR FISCAL YEARS ENDING JUNE 30, 2017 THROUGH 2021
See accompanying summary of significant forecast assumptions and accounting policies
7
SECTION THREE
ASSUMPTIONS FOR PROJECTIONS
8
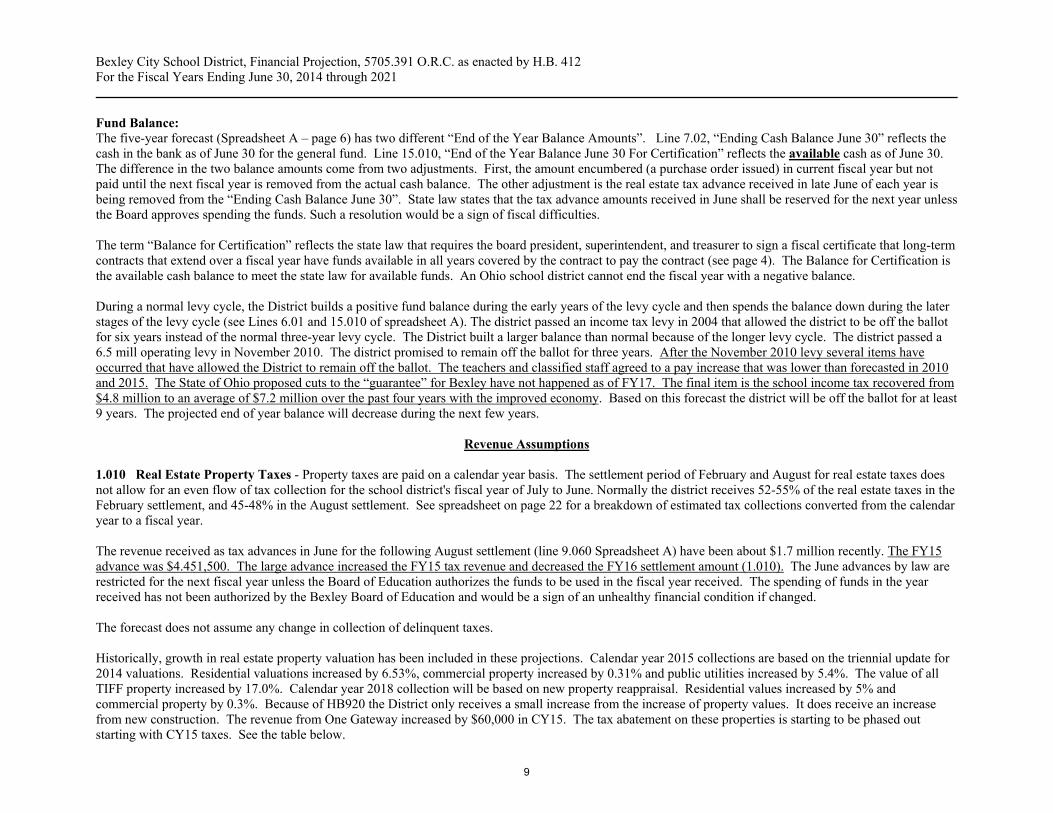
Bexley City School District, Financial Projection, 5705.391 O.R.C. as enacted by H.B. 412 For the Fiscal Years Ending June 30, 2014 through 2021 Fund Balance: The five-year forecast (Spreadsheet A – page 6) has two different “End of the Year Balance Amounts”. Line 7.02, “Ending Cash Balance June 30” reflects the cash in the bank as of June 30 for the general fund. Line 15.010, “End of the Year Balance June 30 For Certification” reflects the available cash as of June 30. The difference in the two balance amounts come from two adjustments. First, the amount encumbered (a purchase order issued) in current fiscal year but not paid until the next fiscal year is removed from the actual cash balance. The other adjustment is the real estate tax advance received in late June of each year is being removed from the “Ending Cash Balance June 30”. State law states that the tax advance amounts received in June shall be reserved for the next year unless the Board approves spending the funds. Such a resolution would be a sign of fiscal difficulties. The term “Balance for Certification” reflects the state law that requires the board president, superintendent, and treasurer to sign a fiscal certificate that long-term contracts that extend over a fiscal year have funds available in all years covered by the contract to pay the contract (see page 4). The Balance for Certification is the available cash balance to meet the state law for available funds. An Ohio school district cannot end the fiscal year with a negative balance. During a normal levy cycle, the District builds a positive fund balance during the early years of the levy cycle and then spends the balance down during the later stages of the levy cycle (see Lines 6.01 and 15.010 of spreadsheet A). The district passed an income tax levy in 2004 that allowed the district to be off the ballot for six years instead of the normal three-year levy cycle. The District built a larger balance than normal because of the longer levy cycle. The district passed a 6.5 mill operating levy in November 2010. The district promised to remain off the ballot for three years. After the November 2010 levy several items have occurred that have allowed the District to remain off the ballot. The teachers and classified staff agreed to a pay increase that was lower than forecasted in 2010 and 2015. The State of Ohio proposed cuts to the “guarantee” for Bexley have not happened as of FY17. The final item is the school income tax recovered from $4.8 million to an average of $7.2 million over the past four years with the improved economy. Based on this forecast the district will be off the ballot for at least 9 years. The projected end of year balance will decrease during the next few years.
Revenue Assumptions
1.010 Real Estate Property Taxes - Property taxes are paid on a calendar year basis. The settlement period of February and August for real estate taxes does not allow for an even flow of tax collection for the school district's fiscal year of July to June. Normally the district receives 52-55% of the real estate taxes in the February settlement, and 45-48% in the August settlement. See spreadsheet on page 22 for a breakdown of estimated tax collections converted from the calendar year to a fiscal year. The revenue received as tax advances in June for the following August settlement (line 9.060 Spreadsheet A) have been about $1.7 million recently. The FY15 advance was $4.451,500. The large advance increased the FY15 tax revenue and decreased the FY16 settlement amount (1.010). The June advances by law are restricted for the next fiscal year unless the Board of Education authorizes the funds to be used in the fiscal year received. The spending of funds in the year received has not been authorized by the Bexley Board of Education and would be a sign of an unhealthy financial condition if changed. The forecast does not assume any change in collection of delinquent taxes. Historically, growth in real estate property valuation has been included in these projections. Calendar year 2015 collections are based on the triennial update for 2014 valuations. Residential valuations increased by 6.53%, commercial property increased by 0.31% and public utilities increased by 5.4%. The value of all TIFF property increased by 17.0%. Calendar year 2018 collection will be based on new property reappraisal. Residential values increased by 5% and commercial property by 0.3%. Because of HB920 the District only receives a small increase from the increase of property values. It does receive an increase from new construction. The revenue from One Gateway increased by $60,000 in CY15. The tax abatement on these properties is starting to be phased out starting with CY15 taxes. See the table below.
9
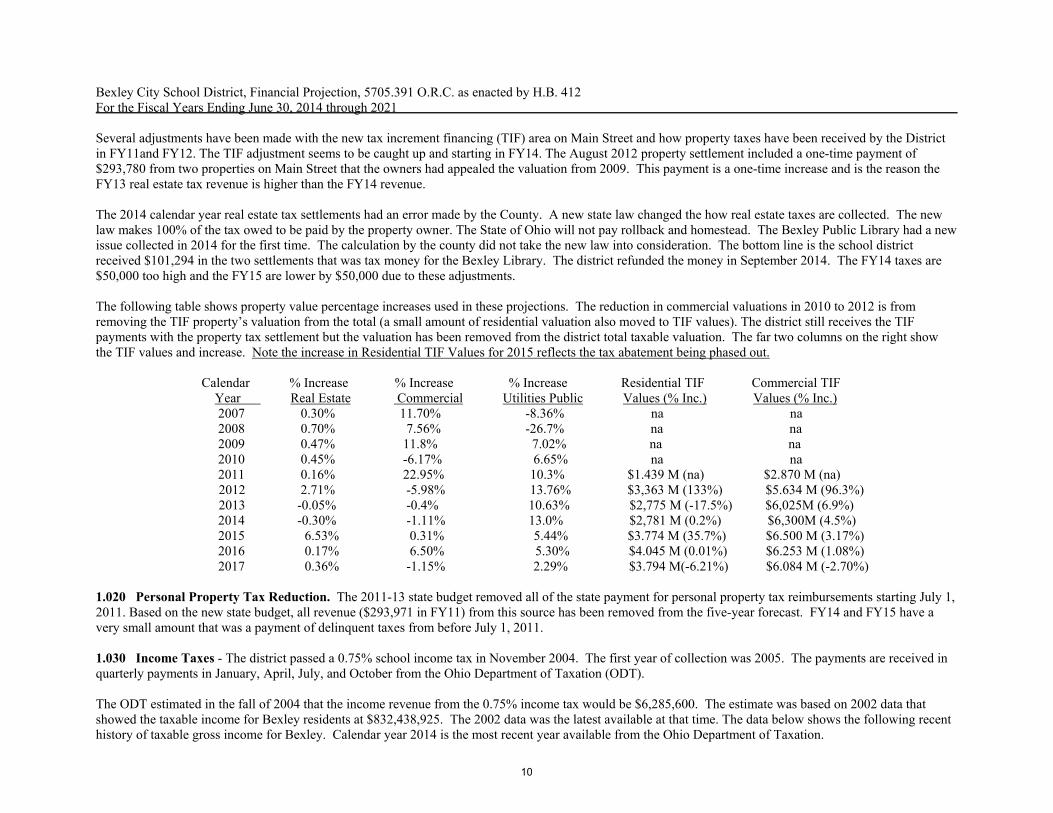
Bexley City School District, Financial Projection, 5705.391 O.R.C. as enacted by H.B. 412 For the Fiscal Years Ending June 30, 2014 through 2021 Several adjustments have been made with the new tax increment financing (TIF) area on Main Street and how property taxes have been received by the District in FY11and FY12. The TIF adjustment seems to be caught up and starting in FY14. The August 2012 property settlement included a one-time payment of $293,780 from two properties on Main Street that the owners had appealed the valuation from 2009. This payment is a one-time increase and is the reason the FY13 real estate tax revenue is higher than the FY14 revenue. The 2014 calendar year real estate tax settlements had an error made by the County. A new state law changed the how real estate taxes are collected. The new law makes 100% of the tax owed to be paid by the property owner. The State of Ohio will not pay rollback and homestead. The Bexley Public Library had a new issue collected in 2014 for the first time. The calculation by the county did not take the new law into consideration. The bottom line is the school district received $101,294 in the two settlements that was tax money for the Bexley Library. The district refunded the money in September 2014. The FY14 taxes are $50,000 too high and the FY15 are lower by $50,000 due to these adjustments. The following table shows property value percentage increases used in these projections. The reduction in commercial valuations in 2010 to 2012 is from removing the TIF property’s valuation from the total (a small amount of residential valuation also moved to TIF values). The district still receives the TIF payments with the property tax settlement but the valuation has been removed from the district total taxable valuation. The far two columns on the right show the TIF values and increase. Note the increase in Residential TIF Values for 2015 reflects the tax abatement being phased out. Calendar % Increase % Increase % Increase Residential TIF Commercial TIF Year Real Estate Commercial Utilities Public Values (% Inc.) Values (% Inc.) 2007 0.30% 11.70% -8.36% na na 2008 0.70% 7.56% -26.7% na na 2009 0.47% 11.8% 7.02% na na 2010 0.45% -6.17% 6.65% na na 2011 0.16% 22.95% 10.3% $1.439 M (na) $2.870 M (na) 2012 2.71% -5.98% 13.76% $3,363 M (133%) $5.634 M (96.3%) 2013 -0.05% -0.4% 10.63% $2,775 M (-17.5%) $6,025M (6.9%) 2014 -0.30% -1.11% 13.0% $2,781 M (0.2%) $6,300M (4.5%) 2015 6.53% 0.31% 5.44% $3.774 M (35.7%) $6.500 M (3.17%) 2016 0.17% 6.50% 5.30% $4.045 M (0.01%) $6.253 M (1.08%) 2017 0.36% -1.15% 2.29% $3.794 M(-6.21%) $6.084 M (-2.70%) 1.020 Personal Property Tax Reduction. The 2011-13 state budget removed all of the state payment for personal property tax reimbursements starting July 1, 2011. Based on the new state budget, all revenue ($293,971 in FY11) from this source has been removed from the five-year forecast. FY14 and FY15 have a very small amount that was a payment of delinquent taxes from before July 1, 2011. 1.030 Income Taxes - The district passed a 0.75% school income tax in November 2004. The first year of collection was 2005. The payments are received in quarterly payments in January, April, July, and October from the Ohio Department of Taxation (ODT). The ODT estimated in the fall of 2004 that the income revenue from the 0.75% income tax would be $6,285,600. The estimate was based on 2002 data that showed the taxable income for Bexley residents at $832,438,925. The 2002 data was the latest available at that time. The data below shows the following recent history of taxable gross income for Bexley. Calendar year 2014 is the most recent year available from the Ohio Department of Taxation.
10
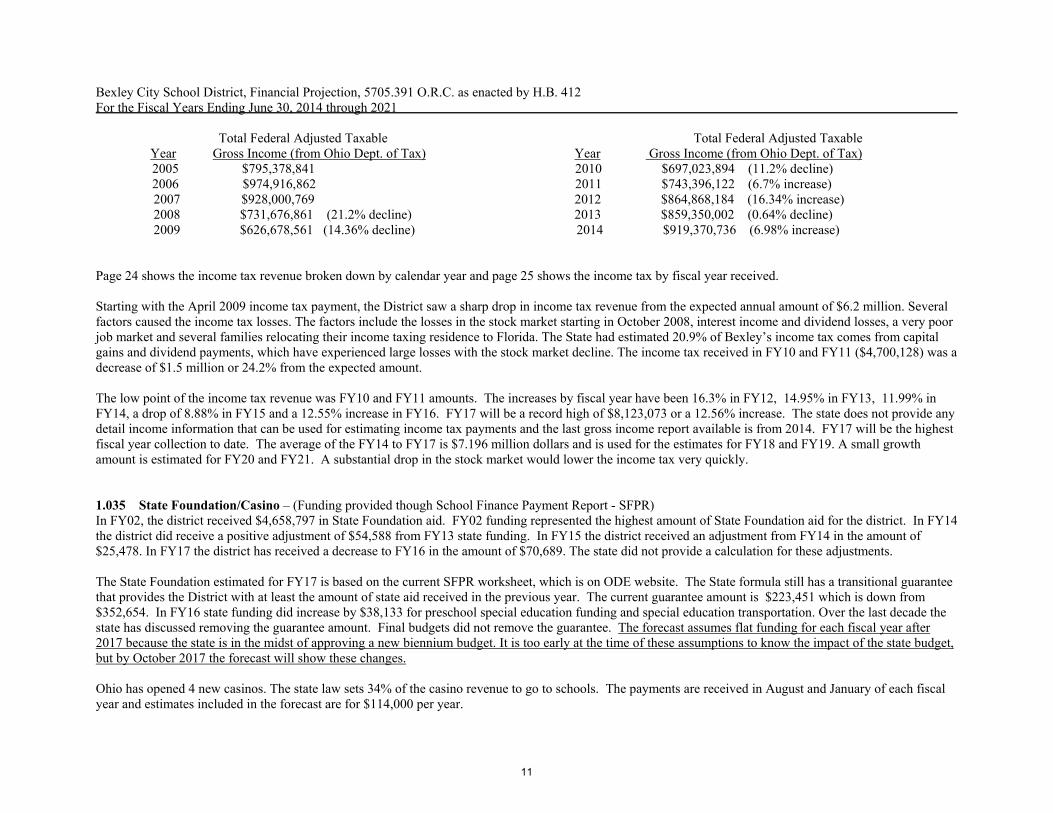
Bexley City School District, Financial Projection, 5705.391 O.R.C. as enacted by H.B. 412 For the Fiscal Years Ending June 30, 2014 through 2021 Total Federal Adjusted Taxable Total Federal Adjusted Taxable Year Gross Income (from Ohio Dept. of Tax) Year Gross Income (from Ohio Dept. of Tax) 2005 $795,378,841 2010 $697,023,894 (11.2% decline) 2006 $974,916,862 2011 $743,396,122 (6.7% increase) 2007 $928,000,769 2012 $864,868,184 (16.34% increase)
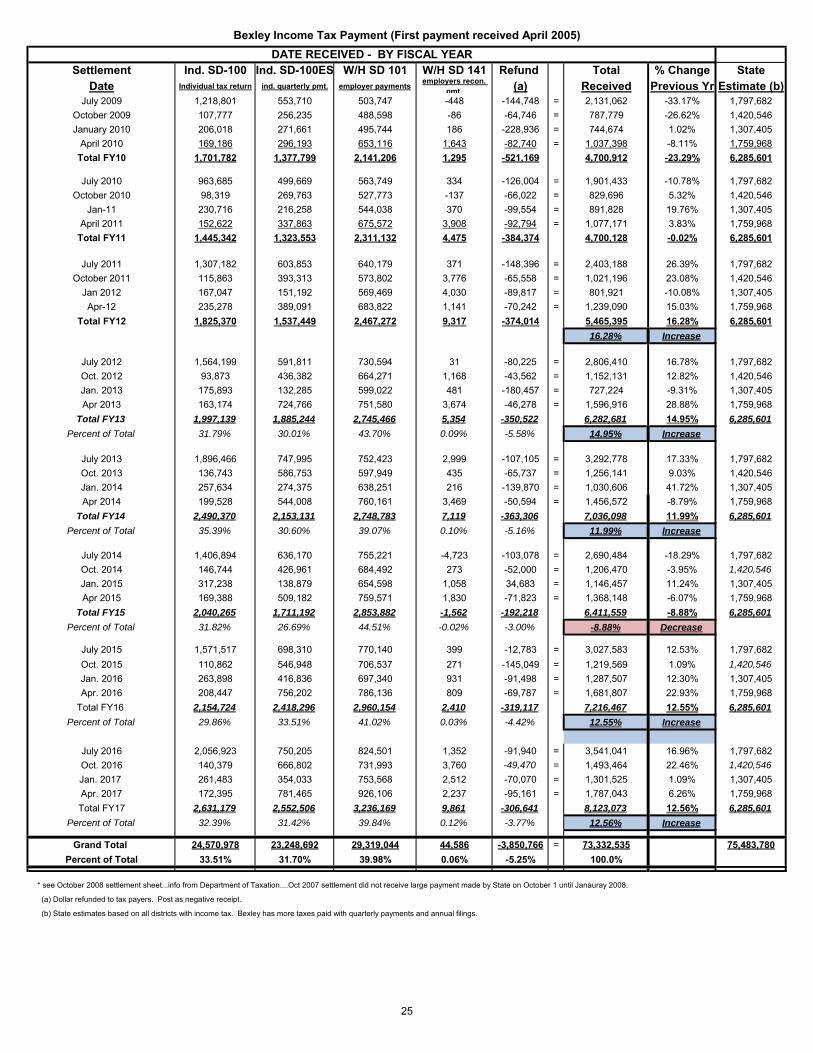
Page 24 shows the income tax revenue broken down by calendar year and page 25 shows the income tax by fiscal year received. Starting with the April 2009 income tax payment, the District saw a sharp drop in income tax revenue from the expected annual amount of $6.2 million. Several factors caused the income tax losses. The factors include the losses in the stock market starting in October 2008, interest income and dividend losses, a very poor job market and several families relocating their income taxing residence to Florida. The State had estimated 20.9% of Bexley’s income tax comes from capital gains and dividend payments, which have experienced large losses with the stock market decline. The income tax received in FY10 and FY11 ($4,700,128) was a decrease of $1.5 million or 24.2% from the expected amount. The low point of the income tax revenue was FY10 and FY11 amounts. The increases by fiscal year have been 16.3% in FY12, 14.95% in FY13, 11.99% in FY14, a drop of 8.88% in FY15 and a 12.55% increase in FY16. FY17 will be a record high of $8,123,073 or a 12.56% increase. The state does not provide any detail income information that can be used for estimating income tax payments and the last gross income report available is from 2014. FY17 will be the highest fiscal year collection to date. The average of the FY14 to FY17 is $7.196 million dollars and is used for the estimates for FY18 and FY19. A small growth amount is estimated for FY20 and FY21. A substantial drop in the stock market would lower the income tax very quickly. 1.035 State Foundation/Casino – (Funding provided though School Finance Payment Report - SFPR) In FY02, the district received $4,658,797 in State Foundation aid. FY02 funding represented the highest amount of State Foundation aid for the district. In FY14 the district did receive a positive adjustment of $54,588 from FY13 state funding. In FY15 the district received an adjustment from FY14 in the amount of $25,478. In FY17 the district has received a decrease to FY16 in the amount of $70,689. The state did not provide a calculation for these adjustments. The State Foundation estimated for FY17 is based on the current SFPR worksheet, which is on ODE website. The State formula still has a transitional guarantee that provides the District with at least the amount of state aid received in the previous year. The current guarantee amount is $223,451 which is down from $352,654. In FY16 state funding did increase by $38,133 for preschool special education funding and special education transportation. Over the last decade the state has discussed removing the guarantee amount. Final budgets did not remove the guarantee. The forecast assumes flat funding for each fiscal year after 2017 because the state is in the midst of approving a new biennium budget. It is too early at the time of these assumptions to know the impact of the state budget, but by October 2017 the forecast will show these changes. Ohio has opened 4 new casinos. The state law sets 34% of the casino revenue to go to schools. The payments are received in August and January of each fiscal year and estimates included in the forecast are for $114,000 per year.
11
Bexley City School District, Financial Projection, 5705.391 O.R.C. as enacted by H.B. 412 For the Fiscal Years Ending June 30, 2014 through 2021 1.050 Property Tax Allocation (Rollback and Homestead) - Rollback and Homestead are property tax payments made from the state in exchange for tax reduction on homeowners. The increase starting in FY11 in Rollback and Homestead is reflecting the 6.5 mill levy passed in November 2010. The state law changed this area starting in November 2013. Future tax levies will not have the state contributions to this area. Revenue will be received all from the tax payers in General Property Taxes (1.010) Also, eligibility for homestead payments from the state will now be restricted to low income homeowners. Revenue from this area will not grow in the future if new levies are approved. 1.060 All Other - Investment income, tuition from summer school and court placed students are the primary components of other revenue. Investment income is a function of available cash balances and market interest rates. Current interest rates have increased this year, but are still at historical low rates. Current rates are 0.89% for overnight accounts and longer-term investments are below 2.0%. Interest income for FY08 was $879,554. Interest income for FY14 was only $86,104. Interest was $172,636 in FY15 and $225,264 in FY16. The current yield of the portfolio is 1.43% and the projected interest income for FY17 is $282,000. The district has extended the maturity time of investments to pick up higher rates. Interest income will decrease as available cash balances decrease. Rental of buildings has several new groups renting facilities over the past two years. About $20,000 has been reduced due to a church potentially no longer renting one of the district’s facilities. The FY16 payment in lieu of taxes from the City of Bexley was $42,177 or 74.4% higher due to additional employees in the One Gateway Project. 2.06 Other - FY15 had a one-time refund from the county auditor in the amount of $98,518 for previous paid fees for collection of taxes and a refund of $43,802 from the FY13 Worker’s Compensation. These refunds are not expected in the future.
Expenditure Assumptions (see review of object - pages 16-21)
3.010 Salaries - The salaries included for the FY17 are from the appropriations adopted by the Board of Education in September 2016 and adjusted for actual projected expenditures. Current BEA contract sets the increase for salaries at 1% in July 2015, 1% in July 2016, and 1% in July 2017. OAPSE (Non-teaching staff) increases are 2.4% in July 2017, $0.53 increase in July of 2018 and $0.52 increase in 2019. Future salary increases are subject to negotiations with the BEA and OAPSE. For the purpose of this five-year projection, a 2.0% base increase and a 2.0% step increase are used for future years. (higher than in the past due to the large number of new teachers hired in the past two years that all will get a step increase.) The current cost of 1% salary increase for all salary areas is $185,000. Staffing changes in FY15 included adding the Special Ed. Director position to the salary accounts. Previous years it was included in the purchase service (400) object. In FY15 one elementary positon was added for enrollment and a reduction of one PE teacher in HS. FY15 has $300,000 of salary costs for substitute teachers removed from salary and placed in purchase services to reflect hiring sub teachers through the COG. FY16 includes adding one teacher at Montrose in the behavior unit. The cost historically was in purchase services. Other changes in FY16 include adding 0.2 FTE to each elementary gifted teacher and moving a music teacher salary to the COG as a teacher aide. FY17 included adding one elementary position based on class sizes. FY18 includes an additional 5.5 staff for moving 6th grade to the Middle school, special education and class sizes. A total of 18 teachers and 2 classified staff retired at the end of FY15. In FY16 a total of $669,313 was paid as severance pay. Replacement salaries for these teachers were lower by about this same amount in FY16. With the step and wage increases this will keep the personnel salaries line flat for FY17. Future years will not have this number of retiring staff members.
12
Bexley City School District, Financial Projection, 5705.391 O.R.C. as enacted by H.B. 412 For the Fiscal Years Ending June 30, 2014 through 2021 3.020 Benefits – The benefits area includes retirement and insurance benefits. Based on the 2016 actual expenditures, the breakdown in this area is as follows: Retirement (STRS, SERS, Medicare) 35.36% - Medical Insurance 54.13% - Dental Insurance 3.4% - All Other 7.11%. The estimates for FY17 are the appropriations as adopted by the Board of Education in September 2016 and adjusted to reflect actual projected expenditures. The cost for retirement usually will increase the same percentage as salary increases. Payments for State Teachers Retirement System are based on estimated payroll information submitted to STRS annually. The estimated amount for calendar year 2015 was made before the decision to move all substitute teachers to the ESC/COG. The amount being withheld for calendar year 2015 will be over by $120,000. STRS payments for FY16 and FY17 will be lowered to offset 2015 overage. The rates for medical insurance have increased by 9.0% in July 2014 and July 2015. The July 2015 increase was for 18 months. In October of 2017 the district entered into a two-year agreement with Medical Mutual for a 7.0% increase in January 2017. The forecast has an increase of 9% for future years. The affordable health care law has a Cadillac tax that could cost $800,000 which has been delayed until 2020 and the law is in uncertain political waters at this time. The District will have conversations with both employee groups to work on reducing the Cadillac tax if this tax remains in the federal law. The tax is not figured into this estimate. The additional staff have also been factored into the FY18 forecast and beyond for benefit purposes. Dental rates increased remained the same in July 2014. Effective July 2015 dental rates dropped by 3.5% until July 1, 2017. Future increases are at 5% per year. An extra $130,000 was added in FY16 and FY17 to cover the cost of staff tuition reimbursement increases for gifted certification.
3.030 Purchased Services - Purchased Services includes all utilities (17.53%), repairs (19.32%), tuition costs for outside placements for special education, vocational, charter schools and other tuition students (31.14%), contracted substitute teachers, teacher aides and OT services (15.47%), legal costs (2.93%) and all other purchased services total (13.61%) based on FY16 actual expenditures. The estimates for FY17 have been adjusted to reflect projected expenditures and current year trends. The following areas of note:
Utility increases are very hard to predict. Natural gas had a large increase in FY15, but a new purchasing agreement lowered the expected costs in FY16. The forecast keeps the cost of gas low. Electric costs increase will be held down by changing over to more economical lighting and other energy improvements. The estimates are to increase around 5-6%.
Tuition to other districts increased by 3.88% in FY16 and estimated 15.0% in FY17. Includes increase for the new College Credit Plus Program. Other tuition includes students placed or enrolled in other districts for special education reasons, Eastland Vocational School and charter schools. Future increases are about 9% with very little control over most expenditures. This area of expense is very hard to predict depending on the needs of students and agreements made for them to attend programs outside the district. The District is experiencing a large increase in FY17.
Starting in the 14/15 school year, all substitute teachers are now hired through the Educational Service Center of Central Ohio/Council of Government (COG). The cost for substitute teachers is posted to object 411. Previous cost had been posted to 100 for salaries and 200 for retirement costs. Total cost for FY15 was $299,980 and FY16 was $428,166, which includes the salary, retirement and business charge for substitute teachers. FY16 includes costs for several long term subs for extended teacher absences.
Several areas were moved from salary account to purchase services for FY16. This includes one music teacher converted to a music aide. The sound and music position was also moved from a Bexley employee to a COG employee. The increase in purchase services is offset by a reduction in salaries and benefits.
Teaching and Special Education aides continue to increase in numbers and cost with the a projected increase in FY17 around 30%. These positions have been contracted through the COG.
13
Bexley City School District, Financial Projection, 5705.391 O.R.C. as enacted by H.B. 412 For the Fiscal Years Ending June 30, 2014 through 2021
Repairs are constantly a concern for a district with older facilities and Bexley is not immune. For purposes of this forecast increases in the repair line items have been increased.
In 2016 the community passed a permanent improvement levy of 1.38 mills that will generate an estimated $688,000. The revenue and expense of this does not flow through this forecast. However, expenses that are normally in the capital outlay and purchased services categories can be diverted to permanent improvement and would relieve the general fund of significant costs. This is an area that must have more discussion and planning.
3.040 Supplies - Supplies include teaching supplies, textbooks, paper, library books, and software (68.58%). Other areas include cleaning, maintenance, bus and gasoline supplies (17.44%) and all other remaining supplies (13.98%). The estimates for FY17 are the 2017 appropriations as adopted by the Board of Education in September 2016 and adjusted to reflect projected expenditures. FY15 and FY16 expenditures for textbooks were lower than normal due to adoption schedules. The textbook amount is back to the normal amount of $300,000 for FY17, however, timing of payments could push this expense into FY18. Estimated increases for future years are at 3.0%. 3.050 Capital Outlay – Capital outlay expenditures include purchases of equipment, furniture, technology, vehicles and building improvements/construction. Because many of these types of expenditures occur over the summer months there are fluctuations from one year to the next. Purchases of equipment or computers may be encumbered in April and may not be delivered or invoiced until July. This was the case with a new chiller in 2015 that was not fully completed until later in the summer. The district has a few outstanding purchases that assumedly will be paid out in July and into FY18. FY17 has funds to purchase a new van. FY18 and FY19 includes $95,000 for one new school bus each year. The note in purchased services regarding the permanent improvement fund applies to Capital Outlay as well. The district should divert any additional costs towards the permanent improvement fund and relieve financial pressures off the general fund. 4.300 Other Objects - The major items in this area are charges for the collection of property and income taxes that the county and state assess. The county charged a new fee starting in 2013 for the Franklin County Land Bank. The total fee for CY16 was $27,313. The charge will help buy and tear down blighted properties in Franklin County. 5.010 – 5.030 Other Financing Uses- Transfers in FY17 include the following amounts to the following funds: Athletic Fund $35,000, Theater Fund $25,000, Food Service Fund $180,000, Permanent Improvement Fund (field replacement fund) $25,000 and Middle School Camp Fund $10,000. FY17 Food Service transfer is $20,000 lower than FY16 and FY16 was $30,000 lower than previous years. The reduction is due to food service fund operating at a smaller deficit. The camp fund transfer reflects a new camp program that lowered Bexley’s general fund salary costs since staffing is now provided by the camp vendor. Advances are temporary loans from the General Fund to other funds that will be returned once they have received reimbursements. The majority of the time this is for federal grants. These are returned in the next fiscal year on line 2.050.
TOTAL 100.00% 18,430,728 1.26% 18,657,260 1.229% 18,396,879 -0.18% 19,415,724 5.54% 19,987,052 2.94% 20,789,532 4.02% 21,576,803 3.79%diff from original appropriation -260,381 -1.40%
(a) - FY 2017 amounts are the appropriations as adopted by the Board of Education - Sept. 2016 (b) - FY2017 projected expenditures are the estimated actual expenditures. This is the amount used for the 5 year projections. By state law actual expenditures must be equal to or less than appropriations. Estimates are based on past experience of actual expenditures lower than appropriations.
# BEA contract provides a base increase of 1% in FY16, FY17 and FY18. FY19 and beyond use a 2.0% increase. Actual salary will be negotiated in spring of 2018. Step increases are included at an overall cost of 2.1% per year (279,000 in FY18.
# OAPSE contract provided a base increase of 2.4% increase for 2017/18. A $0.53/$0.52per hour increase for FY19 and FY20 respectively. 2.0% increase is used for 2021 and beyond. Contract goes through June 30, 2020(c)- FY17 one aide moved from hired through the ESC to being hired by Bexley. Costs moved from purchased services (400) object to Salary (100) object. FY17 Athletic direct salary moved from certified (111) to classified (141). FY17 supplemental increased to reflect Lacrosse becoming a school sport. FY18 includes 2.5 FTE for 6th grade move. Staffing in the future years will be adjusted according to enrollment/program changes or other changes as approved. FY18 also includes 2.0 FTE additional staff for Intervention and 1 FTE for class sizes. (d) Substitute teachers are now hired through the Central Ohio Educational Service center as a purchase service starting with the 2014/15 year.(e) Termination benefits are offset by lower salaries of replacement staff. FY15 had 8 teachers in FY15 and FY16 had a record number of 18. FY18 will have a few large severances but should normalize by FY19(f) With large termination payment not made after FY16, the FY17 total are lower with the decrease in termination costs.
231/3/4 award\tuition (h) 1.82% 139,261 105.19% 181,000 29.97% 150,000 7.71% 175,000 4.00% 120,000 -31.43% 120,000 5.00% 120,000 5.00%does not include Cadillac does not include Cadillac
(a) - FY 2017 amounts are the appropriations as adopted by the Board of Education - Sept. 2016 (b) - FY2017 projected expenditures are the estimated actual expenditures. This is the amount used for the 5 year projections. By state law actual expenditures must be equal to or less than appropriations. Estimates are based on past experience of actual expenditures lower than appropriations.(c) - Increases in retirement tied directly to salary increases plus SERS surcharge at 2.0% of payroll for Bexley. STRS is deducted based on an annual estimate of salary. August 2014 the district moved all certificated subs to the COG. The 14/15 estimate was made in January 14 before subs moved to the COG. Will cause a one time decrease in STRS payments in the 2015/16 of $90,000 and $45,000 in 2016/17.(d) - Increases in Medicare is tied to salary increases for all new staff hired since 1986.(e) - Medical insurance increased 9% in FY15. The increase was for 18 months. January 2017 rates increased 7.5% and are for two years. Future increases are estimated at 9%. The affordable health care law delayed the Cadillac tax until 2020. Current estimated cost is $800,000 +. This tax is NOT INCLUDED. Costs for FY18 and beyond are based on current enrollment.(f) - Life insurance is $0.095 per $1000 of salary. Increase will follow salary increases.(g) - Dental insurance future years are at an 5% increase. (h) - Extra $130,000 added in FY16 and FY17 to cover tuition for staff to gain a gifted endorsement certification.
diff from original appropriations
17
May-17 OBJECT REVIEW OF 400 PURCHASE SERVICESPercent Actual 2016 % Increase 2017 Percentage 2017 Percentage 2018 Percentage 2019 Percentageof Total Expenditures over FY15 Approp (a) Increase Proj. Exp. (b) Increase Proj Exp Increase Proj Exp Increase
TOTAL (e) 100.00% 5,018,271 2.55% 5,838,232 16.34% 5,973,300 19.03% 6,211,518 3.99% 6,590,072 6.09%diff from original appropriations 135,068 2.31%
(a) - FY 2017 amounts are the appropriations as adopted by the Board of Education - Sept. 2016 (b) - FY2017 projected expenditures are the estimated actual expenditures. This is the amount used for the 5 year projections. By state law actual expenditures must be equal to or less than appropriations. Estimates are based on past experience of actual expenditures lower than appropriations.(c)' Teacher aides for classroom support in large classes and special education. Contracted through the ESC of Central Ohio (COG). Staffing has been increasing. (d) FY17 added Children's Hospital Weight Room Trainer(e) FY17 has $97,572 higher po's carrying over to FY17 than from FY15 to FY16. Projected exp. 2017 increase to reflect the higher carryover po's.(f) Starting in FY15 all substitute teachers are employed through the COG. Salary and retirement objects reduced by $400,000.(g) Contract negotiations with gas company lowered the costs in FY2016.(h) architect services and increase in META services(i) consultant costs for superintendent and treasurer search and other costs in FY17 only.(j) repair costs are scheduled to increase significantly for existing facilities.
(d) diff from original appropriations -114,236 -7.39%
(a) - FY 2017 amounts are the appropriations as adopted by the Board of Education - Sept. 2016 (b) - FY2017 projected expenditures are the estimated actual expenditures. This is the amount used for the 5 year projections. By state law actual expenditures must be equal to or less than appropriations. Estimates are based on past experience of actual expenditures lower than appropriations.
(c) FY15 and FY16 textbooks are lower than normal. FY17 amounts estimated at the historical amount. If textbooks were only increased by 5%in FY17 the total supplies for FY17 would be a 2.33% increase
(d) FY18 increase for phase in of 6th grade move. Elem 75% of 6th grade per pupil remains in budget and is phased down.
19
May-17 OBJECT REVIEW OF 600 CAPITAL OUTLAY
Percent Actual 2016 % Increase 2017 Percentage 2017 Percentage 2018 Percentage 2019 Percentageof Total Expenditures over FY15 Approp (a) Increase Proj exp (b) Increase Proj Exp Increase Proj Exp Increase
TOTAL 79.17% 1,198,655 0.00% 999,948 -16.58% 711,253 -40.66% 1,242,500 74.69% 1,287,500 3.62%diff from original appropriations -288,695 -28.87%
(a) - FY 2017 amounts are the appropriations as adopted by the Board of Education - Sept. 2016 (b) - FY2017 projected expenditures are the estimated actual expenditures. This is the amount used for the 5 year projections. By state law actual expenditures must be equal to or less than appropriations. Estimates are based on past experience of actual expenditures lower than appropriations.
(c) Copiers replaced in 2016 . Plans were to replace in FY17.(d) A van replacement is included in FY17 and a bus replacement in FY18 and FY19.
(e) Some FY17 equipment is expected to be paid out in FY18. Timing of payments could cause expenditures to cross over between fiscal years.
20
May-17 OBJECT REVIEW OF 800 OTHERPercent Actual 2016 % Increase 2017 Percentage 2017 Percentage 2018 Percentage 2019 Percentageof Total Expenditures over FY15 Approp (a) Increase Proj exp (b) Increase Proj Exp (b) Increase Proj Exp (b) Increase
(a) - FY 2017 amounts are the appropriations as adopted by the Board of Education - Sept. 2016 (b) - FY2017 projected expenditures are the estimated actual expenditures. This is the amount used for the 5 year projections. By state law actual expenditures must be equal to or less than appropriations. Estimates are based on past experience of actual expenditures lower than appropriations.
(c) New posting of object for City County Agreement codes starting in FY14 move to purchase services object 400
(d) Increase starting in FY14 due to new charge by County Treasurer for County Land Bank. CY16 amount was $27,313. Fees for income collections are charged as a percentage. Higher collections increase the fees.(e) Previous years had memberships for IB posted to curriculum purchase services. FY16 moves the expense to 841 object.
OBJECT REVIEW OF 900 TRANSFERSPercent Actual 2016 % Increase 2017 Percentage 2017 Percentage 2018 Percentage 2019 Percentageof Total Expenditures over FY15 Approp (a) Increase Proj exp Increase Approp Increase Approp Increase
Transfers To Athletic Fund 11.68% 35,000 0.00% 35,000 0.00% 30,000 -14.29% 35,000 16.67% 35,000 0.00% To Drama Fund 8.34% 25,000 0.00% 25,000 0.00% 25,000 0.00% 25,000 0.00% 25,000 0.00% To Camp Fund (b) 4.90% 14,700 0.00% 14,700 0.00% 10,000 0.00% 15,000 50.00% 15,000 0.00%
To Food Service Fund (a) 66.73% 200,000 0.00% 180,000 -10.00% 180,000 -10.00% 180,000 0.00% 180,000 0.00%
To P. I. Fund (field replace) 8.34% 25,000 0.00% 25,000 0.00% 25,000 0.00% 25,000 0.00% 25,000 0.00%TO: Contingent 0.00% 0 #DIV/0! 20,300 #DIV/0! 0 70,000 100,000Refund of Prior Year Rec. 0.00% 0 #DIV/0! 1,500 0 0 0
(a) Transfer to food service reduced in FY16 and FY17. Revenue up in fund 006 - food service(b) Transfer if $14700 to MS Camp Fund offset salaries This does not include Advances
diff from original appropriations
21
Italic #'S are est.TAX SETTLEMENTS 2012 (A) 2013 2014 (B) 2015 2016 2017 est 2018 est 2019 est
Total Real and Rollback 22,836,114 22,658,827 22,844,991 23,014,232 23,375,863 23,496,669 23,500,000 23,520,000
original estimates 22,400,000 22,750,000 22,850,000 23,000,000 23,050,000 23,350,000 23,500,000 23,520,000
Total Personal Property 3,796 0 0 0 0 0 0 0
Total Calendar Year 22,839,910 22,658,827 22,844,991 23,014,232 23,375,863 23,496,669 23,500,000 23,520,000
Total Local 20,078,343 19,888,602 20,047,438 20,197,141 20,565,016 20,689,106 20,685,000 20,705,000Total State 2,761,567 2,770,225 2,797,553 2,817,092 2,810,847 2,807,563 2,815,000 2,815,000
Fiscal Year Revenue 2011/12 2012/13 2013/14 2014/15 2015/16 2016/17 2017/18 2018/19Real Estate 16,231,003 20,252,141 19,863,754 22,832,994 17,684,647 20,700,597 20,625,000 20,695,000State Utility Payment 0 na na na na na na naRollback 2,735,069 2,776,333 2,788,592 2,809,528 2,811,745 2,811,039 2,810,000 2,815,000Personal Property 3,796 0 0 176 0 0 0 0PP State JV25 0 0 0 0 0 0 0 0PP State 0 0 0 0 0 0 0 0
Total Fiscal Year Rev. 18,969,869 23,028,473 22,652,347 25,642,698 20,496,391 23,511,636 23,435,000 23,510,000
MINUS June Adv. this -1,693,280 -1,694,230 -1,694,230 -4,451,500 -1,700,000 -1,700,000 -1,700,000 -1,700,000PLUS June Adv. last 5,257,200 1,693,280 1,694,230 1,694,230 4,451,500 1,700,000 1,700,000 1,700,000Adjusted Fiscal Yr. Tax 22,533,789 23,027,523 22,652,347 22,885,428 23,247,891 23,511,636 23,435,000 23,510,000
(A)(A) Second half 2012 settlement included $293,780 from CVS and Bexley Pizza Plus form previous 3 years of back taxes(B) County Auditor overpaid 2014 settlements. Reason was new law for new taxes. Library new tax caused the issue. 1st half = $50,580 - 2nd half $50,714 Amount listed above for 2nd half received has the total paid back to County.
General Fund TAX REVENUE WORKSHEET - CALENDAR YEAR - COLLECTION YEAR
22
CALENDAR Residential 5.0% Commercial 0.31%YEAR 2018 GENERAL FUNDPROPERTY PROPERTY TAX TOTAL TAXES
Grand Total 24,137,101 22,113,194 27,639,371 39,837 -3,685,534 = 70,243,969 72,416,407Percent of Total 34.4% 31.5% 39.3% 0.1% -5.2% 100.0%
* see October 2008 settlement sheet...info from Department of Taxation....Oct 2007 settlement did not receive large payment made by State on October 1 until Janauray 2008.
(a) Dollar refunded to tax payers. Post as negative receipt.
Bexley Income Tax Payment (First payment April 2005)
DATE RECEIVED - BY CALENDAR YEAR
24
Settlement Ind. SD-100 Ind. SD-100ES W/H SD 101 W/H SD 141 Refund Total % Change State
Date Individual tax return ind. quarterly pmt. employer payments employers recon. pmt. (a) Received Previous Yr Estimate (b)
Total FY17 2,631,179 2,552,506 3,236,169 9,861 -306,641 8,123,073 12.56% 6,285,601Percent of Total 32.39% 31.42% 39.84% 0.12% -3.77% 12.56% Increase
Grand Total 24,570,978 23,248,692 29,319,044 44,586 -3,850,766 = 73,332,535 75,483,780Percent of Total 33.51% 31.70% 39.98% 0.06% -5.25% 100.0%
* see October 2008 settlement sheet...info from Department of Taxation....Oct 2007 settlement did not receive large payment made by State on October 1 until Janauray 2008.
(a) Dollar refunded to tax payers. Post as negative receipt.
(b) State estimates based on all districts with income tax. Bexley has more taxes paid with quarterly payments and annual filings.
Bexley Income Tax Payment (First payment received April 2005)DATE RECEIVED - BY FISCAL YEAR