25
For Official Use Only CENTRAL GROUND WATER BOARD MINISTRY OF WATER RESOURCES GOVERNMENT OF INDIA GROUND WATER BROCHURE WARANGAL, ANDHRA PRADESH SOUTHERN REGION HYDERABAD September 2013
For Official Use Only
CENTRAL GROUND WATER BOARD MINISTRY OF WATER RESOURCES
GOVERNMENT OF INDIA
GROUND WATER BROCHURE WARANGAL, ANDHRA PRADESH
SOUTHERN REGION
HYDERABAD September 2013

CENTRAL GROUND WATER BOARD MINISTRY OF WATER RESOURCES
GOVERNMENT OF INDIA
GROUND WATER BROCHURE WARANGAL ANDHRA PRADESH
(AAP-2012-13)
BY
R.V.V. SAGAR SCIENTIST-D
SOUTHERN REGION BHUJAL BHAWAN, GSI Post, Bandlaguda NH.IV, FARIDABAD -121001 Hyderabad-500068 HARYANA, INDIA Andhra Pradesh Tel: 0129-2418518 Tel: 040-24225201 Gram: Bhumijal Gram: Antarjal

GROUND WATER BROCHURE WARANGAL DISTRICT, ANDHRA PRADESH
CONTENTS
DISTRICT AT A GLANCE
1.0 INTRODUCTION
2.0 RAINFALL
3.0 GROUND WATER SCENARIO
4.0 DEPTH TO WATER LEVEL
5.0 GROUND WATER RESOURCES
6.0 GROUND WATER QUALITY
7.0 STATUS OF GROUND WATER DEVELOPMENT
8.0 GROUND WATER MANAGEMENT STRATEGY
9.0 GROUND WATER DEVELOPMENT
10.0 WATER CONSERVATION & ARTIFICIAL RECHARGE
11.0 RECOMMENDATIONS
WARANGAL DISTRICT AT A GLANCE
1. GENERAL FEATURES: i. Location : North Latitude 170 19' and 180 36'
: East Longitude 780 49' and 800 43' ii. Geographical area : 12846 Sq Kms iii. Dist head quarters : Warangal iv. No. of Rev.Mandals : Fifty One (51) v. No. of Rev. villages : One thousand ninety eight (1098). vi. Population (2011 Census)
a) Total : 3522644 b) Urban : 998146 c) Rural : 2524498
vii. Population density : 274/ sq.km 2. RAINFALL (mm): i. Normal Annual Rainfall : 955 mm ii) Annual rainfall (2012) : 1232 mm 3. LAND USE (2012) (Area in ha) i. Forest : 3,71,014 ii. Barren and uncultivable land : 51,363 iii. Cultivable waste : 10,940 iv. Current fallows : 58,080 v. Net area sown : 5,30,401 4. IRRIGATION (2012) (Area in ha) i. Area irrigated under canals : 12,264 ii. Area irrigated under tanks : 56,176 iii. Area irrigated under dug wells : 1,68,377 iv. Area irrigated under tube wells : 98,753 v. Area irrigated under other sources : 3,196 vi. Net area irrigated : 1,09,203 vii. Gross area irrigated : 4,47,969 viii. Medium irrigation (Aycut area in Ha)
a) Phakal lake : 21225 b) Laknavaram lake: 12400 c) Ramappa lake: 4860 d) Chalivagu project: 3246 e) Ghanpur tank: 3156
5. GEOLOGY Granites and Gneisses, Schists, Conglomerates, Sandstone, Limestone, Shale, Quartzites, Clays
6. GROUND WATER Exploration by CGWB Number of wells drilled : 32 EW, 15 OW,PZ 89 as on 2012. Monitoring Number of Observation wells : Dug wells : 25
Piezometers : 48 Range of water levels (meters below ground level May 2012)
Minimum : 2.71 Maximum : 20.74
(meters below ground level Nov 2012) Minimum : 0.49 Maximum : 15.89
7. GROUND WATER RESOURCES (MCM) Net annual Ground water Resources : 1854.18 Net Annual Ground water Draft : 1376.45 Balance Ground water resource : 511.39 8. GROUND WATER DEVELOPMENT CATEGORY No. of mandals categorized as Safe (<70% of net available resource) : 22 mandals Semi Critical (70-90%) : 9mandals Critical (90-100%) : 3mandals Over Exploited (>100%) : 16 mandals Stage of Ground Water Development : 74% 9. CHEMICAL QUALITY i. Electrical Conductivity : 1020 to 1900. ( micro Siemens/cm at 250 C) ii. Chloride (mg/l) : 48 to 241. iii. Fluoride (mg/l) : 0.52 to 0.55 iv. Nitrate (mg/l) : 20 to 140.

GROUND WATER BROCHURE WARANGAL DISTRICT, ANDHRA PRADESH
1.0 INTRODUCTION
Warangal district with a total geographical area of 12,846 sq km is one of the ten
Telangana districts of Andhra Pradesh. The district is mainly agrarian and agriculture is the
main stay of the population. Population density 274 person per sq km as per 2001 census.
The district falls in the drainage basins of both Godavari and Krishna rivers. The
river Godavari, the largest river in the peninsular India flows along the eastern boundary of
the district in south easterly direction (Fig.1). Pedavaguand Lakhnavaram are the two main
tributaries of the Godavari. In the southern and south western part of the district the streams
flow towards south and south easternly direction and finally fall into the Krishna river. The
important tributaries of river Krishna are Akeru, Paleru and Muneru. The entire district is
divided into 58 minor basins.
Table-1: Source Wise Area Irrigated ( Ha)
S. No. Source of irrigation 2012
1 Canals 12,264 2 Tanks 56,176 3 Tube Wells & filter points 98,753 4 dug wells 1,68,377 5 Other Sources 3,196 6 Net Area Irrigated 1,09,203 7 Gross area Irrigated 4,47,969

2.0 RAINFALL
The average annual rainfall of the district is 955 mm, which ranges from nil rainfall in
December to January to 272 mm in July. July and august are the wettest months of the year.
The mean seasonal rainfall distribution is 797 mm in southwest monsoon (June-September),
115 mm in northeast monsoon (Oct-Dec), nil rainfall in winter (Jan-Feb) and 43mm in
summer (March–May). The percentage distribution of rainfall, season-wise, is 83% in
southwest monsoon, 12 % in northeast monsoon, nil percentage in winter and 5 % in summer.
The mean monthly rainfall distribution is given in the Table-1 and shown in Fig. 2. The
annual rainfall during 2012 is 1232mm.
Table.1monthly Rainfall Distribution (1999-2011)
Source: Indian Meteorological Department and Directorate Of Economics And Statistics
Fig.2 Mean monthly rainfall distribution - Warangal district
The annual rainfall ranges from 655.2 mm in 2009 to 1353.3 mm in 2010. The annual rainfall
departure ranges from -31 % in 2002 and 2009 to 42 % in 2010. The southwest monsoon
rainfall contributes about 83 % of annual rainfall. It ranges from 504 mm in 2009 to 1123 mm
YE
AR
AN
NU
AL
SW
M
NE
M
WIN
TE
R
SU
MM
ER
SW
M
(%)
NE
M
(%)
WIN
TE
R (
%)
SU
MM
ER
(%
)
DE
P
FR
OM
L
PA
(%)
1999 855.0 720.0 43.0 0.0 92.0 84.21% 5.03% 0.00% 10.76% -10%
2000 1133.0 1046.0 12.0 17.0 58.0 92.32% 1.06% 1.50% 5.12% 19% 2001 807.9 648.0 117.9 0.0 42.0 80.21% 14.59% 0.00% 5.20% -15%
2002 661.5 524.5 88.0 15.0 34.0 79.29% 13.30% 2.27% 5.14% -31% 2003 902.2 728.6 161.0 1.0 11.6 80.76% 17.85% 0.11% 1.29% -6% 2004 934.7 717.3 98.1 39.7 79.6 76.74% 10.50% 4.25% 8.52% -2%
2005 1051.8 890.4 128.8 7.6 25.0 84.65% 12.25% 0.72% 2.38% 10% 2006 1229.8 1021.7 82.9 0.0 125.2 83.08% 6.74% 0.00% 10.18% 29% 2007 1030.2 921.6 70.2 8.8 29.6 89.46% 6.81% 0.85% 2.87% 8% 2008 1326.6 1060.2 49.1 32.2 185.1 79.92% 3.70% 2.43% 13.95% 39% 2009 655.2 503.9 128.4 0.0 22.9 76.91% 19.60% 0.00% 3.50% -31%
2010 1353.3 1122.8 160.8 13.5 56.2 82.97% 11.88% 1.00% 4.15% 42%
2011 861.5 795.3 17.3 0.0 48.9 92.32% 2.01% 0.00% 5.68% -10%
Long Period Average
796.7 115.3 0.0 42.9 83.43% 12.07% 0.00% 4.49%

in 2010. The year 2002 and 2009 experienced drought conditions in the district as the annual
rainfall recorded in these two years is 31 % less than the long period average (LPA). The
annual and seasonal rainfall distribution with its departure from mean along with year-wise
percentage distribution is given in Fig.3. It indicates that, the rainfall departure as on 2011 is
positive i.e. 41%, showing excess rainfall.
Fig.3 Cumulative departure of annual rainfall from LPA - Warangal district
3.0 GROUND WATER SCENARIO
3.1 Hydrogeology
Ground water occurs in all the geological formations in the district. The major rock
types occurring in the district are granites, gneisses, sandstone, limestone, shale, quartzite’s
etc. The occurrence and movement of the ground water is a consequence of a finite
combination of topographical, climatological, hydrological, geological, structural and
pedagogical factors, which together form integrated dynamic system. All these factors are
interrelated and inter dependent, each providing a insight into the total functioning of this
dynamic system. Hydrogeological conditions of the district are shown in the Fig.4. The yields
of the wells depend on the recharge conditions and spacing of the wells. The nature of
occurrence and behaviour of ground water in different water bearing formations are given
Fig.4 Hydrogeology of Warangal district

3.1.1 Ground Water in Crystalline Rocks
These rocks types occupy about 60% area of the district. The crystalline rocks like
granite and gneisses lack primary porosity. They develop secondary porosity through
fracturing and weathering over ages and thus become water bearing. The movement of
ground water is controlled by the degree of inter-connection of secondary pores/voids. The
depth to bed rock varies from few meters to 30 m bgl. Ground water occurs under unconfined
conditions in weathered zone and under semi confined conditions in the fractures and
fissures.
The shallow water table or phreatic aquifers are developed through large diameter
irrigation dug wells and small diameter domestic wells. The irrigation wells are generally
rectangular in shape with an open area ranging from 40 to 100 m2 with length of sides
ranging from 4 to 10 m and diameter of circular wells varies from 6 to 10 m. The depth of the
wells range from 6 to 15 m bgl. Depth to water in the wells vary from 5 to 20 m bgl during
summer and < 2 to 5 m bgl during post monsoon. The yield ranges from 20 to 60 m3/day and
specific capacity ranges from 0.002 to 0.324 m3/mdd.
The deeper fractured aquifer is developed through bore wells. The fractured aquifers
are potential upto 100 m depth in general, the occurrence of fractures decreases drastically
beyond 100m depth. Potential fractures are encountered only along the lineaments and at
other favourable location. The discharge of the successful bore wells ranges from 0.5 lps to 4
lps. The transmissivity values range from 2.36 to 12.65 m2/day.
3.1.2 Ground Water in Pakhals and Sullavais
The Pakhals and Sullavais the oldest sedimentary rocks occupy an area of 1500 and
700 sq.km respectively in north eastern part of the district. They comprise mainly sandstones,
quartzite, limestones, shales and phyllites. They are hard, compact and possess limited
primary porosity. However, subsequent fracturing and fissuring followed by weathering
enabled them to form aquifers locally. The thickness of weathered zone varies from 8 to 20m.
The depth ranges of the dug wells vary from 6 to 10 m bgl. The premonsoon water levels
vary from 5 to 20 m bgl and the post monsoon water levels vary from <2 to 10 m bgl. The
yields of the dug wells range between 20 to 60 m3/day. In general they form poor aquifers
except wells tapping weathered shales and sandstones.
The shallow fractured aquifer is tapped through bore wells. The discharges in Pakhal
dolomitic limestones range from 6 to 32 m3/hr for drawdowns of 6 to 12 m. The specific
capacity ranges from 24 to 76 lpm/mdd and the transmissivity from 168 to 834 m2/day. The
discharges in the phyllitic shales ranges from 19 to 33 m3/hr, the specific capacity from 12.5
to 36 lpm/m/mdd and the transmissivity ranges from 33.9 to 35 m2/day. The discharges in the
quartzite and shales ranges from 5 to 60 m3/hr, the transmissivity varies between 140 to 202
m2/day and the storage coefficient is about 3.4 x 10⁻³. The discharges in the Sullavai
quartzite sandstones ranges from 15 to 42 m3/hr at draw downs varying from 1.1 to 6.6 m.
The aquifer transmissivity ranges from 25 to 988 m2/day and the storage coefficient ranges
from 1.6 x 10⁻⁴ to 2 x 10⁻⁴.

3.1.3 Ground Water in Gondwanas
Shallow Phreatic Aquifers
The Talchir boulder bed is favourable for sinking open wells, the depth of wells varies
from 8 to 13 m in general and the yields ranges from 15 to 30 m3/day. The depth of the dug
wells in Barakars 12 to 17 m bgl. They form poor aquifers and are tapped only for domestic
needs. The depth of the dug wells tapping Kamthi sand stones vary from 4 to 15 m bgl and
the have yields of 20 to 40 m3/day. The Maleri and Chikiala formations are predominantly
clayey and form poor aquifers.
Deeper Confined Gondwana Aquifers
The yields of the bore wells tapping the Talchir formation (depth 100 m) ranges from
5 to 20 m3/hr and the specific capacity of the wells ranges from 10 to 55 lpm/mdd. The
Barakar formation form poor aquifers. The sandstone horizons of 50 to 80 m tapped in the
wells have discharges of 56 to 72 m3/day at draw down 19 to 23 m. The specific capacity of
wells ranges from 27 to 330 lpm/mdd and the aquifer transmissivity ranges between 128 and
396 m2/day. The Kamthi sandstones extend upto 446 m bgl, the potential zones can be
classified in to three groups top upto 100m, middle between 100 to 250 m and bottom beyond
250 m bgl. The lower group comprising of gritty sandstones have low to moderate yields of
324 to 1936 m3/day, transmissivity ranging from 70 to 135 m2/day and storage coefficient of
3.7 x 10⁻⁴. The middle group consisting of coarse to medium grained sandstones with
intercalation of clays have moderate yields of 1180 m3/day with a transmissivity value of 70
m2/day and storage coefficient of 1.6 x 10⁻⁴. The upper Kamthi sandstones comprising of
coarse to gritty sandstones have very high yields ranging from 1909 to 3896 m3/day,
transmissivity ranging from 225 to 740 m2/day and storage coefficient varying from 2.6 x 10-
4 to 8.4 x 10⁻⁵. The deeper sandstone aquifers of Maleri and Chikiala extending down to 220
m bgl occur under highly confined conditions. The discharges are around 2615 m3/day at
drawdown of 22 m. The transmissivity and storage coefficient are around 126 m2/day and
7.98 x 10⁻⁴ respectively and many of them become artesian flowing wells.
3.1.4 Ground Water in Laterites and Alluvium
The yields of dug wells and dug-cum-bore wells are as high as 300 m3/day.
Alluvium occurs either as terrace deposits or flood plains in about 125 sq km area along the
western bank of the Godavari River. The depth of the alluvial sands varies from 5 to 20 m
bgl. The yields of the shallow wells tapping alluvium vary from 30 to 60 m3/day and that of
the filter point wells from 720 to 960 m3/day for a drawdown of 1 to 15 m.
4.0 DEPTH TO WATER LEVEL
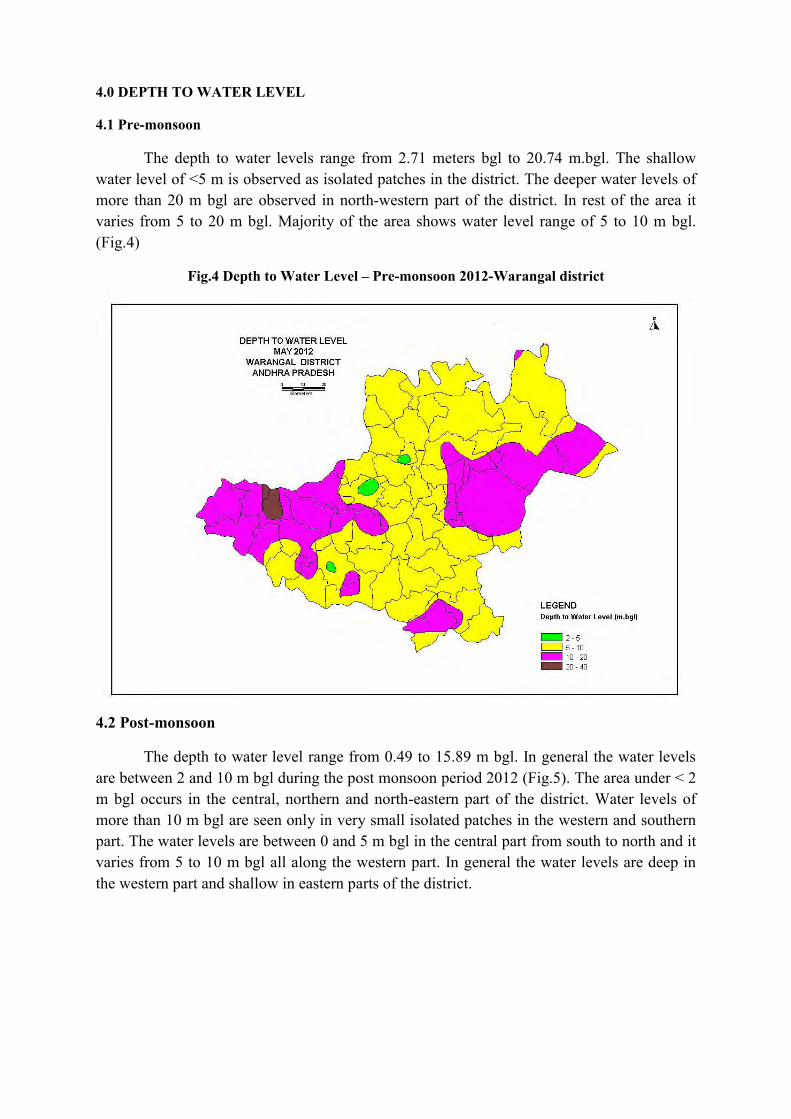
4.1 Pre-monsoon
The depth to water levels range from 2.71 meters bgl to 20.74 m.bgl. The shallow
water level of <5 m is observed as isolated patches in the district. The deeper water levels of
more than 20 m bgl are observed in north-western part of the district. In rest of the area it
varies from 5 to 20 m bgl. Majority of the area shows water level range of 5 to 10 m bgl.
(Fig.4)
Fig.4 Depth to Water Level – Pre-monsoon 2012-Warangal district
4.2 Post-monsoon
The depth to water level range from 0.49 to 15.89 m bgl. In general the water levels
are between 2 and 10 m bgl during the post monsoon period 2012 (Fig.5). The area under < 2
m bgl occurs in the central, northern and north-eastern part of the district. Water levels of
more than 10 m bgl are seen only in very small isolated patches in the western and southern
part. The water levels are between 0 and 5 m bgl in the central part from south to north and it
varies from 5 to 10 m bgl all along the western part. In general the water levels are deep in
the western part and shallow in eastern parts of the district.

Fig.5 Depth to Water Level – Post monsoon 2012
4.3 Water Level Fluctuation:
The rise in water level between pre and post monsoon period of 2012 is more than 4
m in the entire district except in small pockets in central and western part of the district,
where it is between 0-2 and 2-4 m (Fig 6). Fluctuation of water level shows a general rise.
Fig.6 Water level Fluctuation 2012- Warangal District
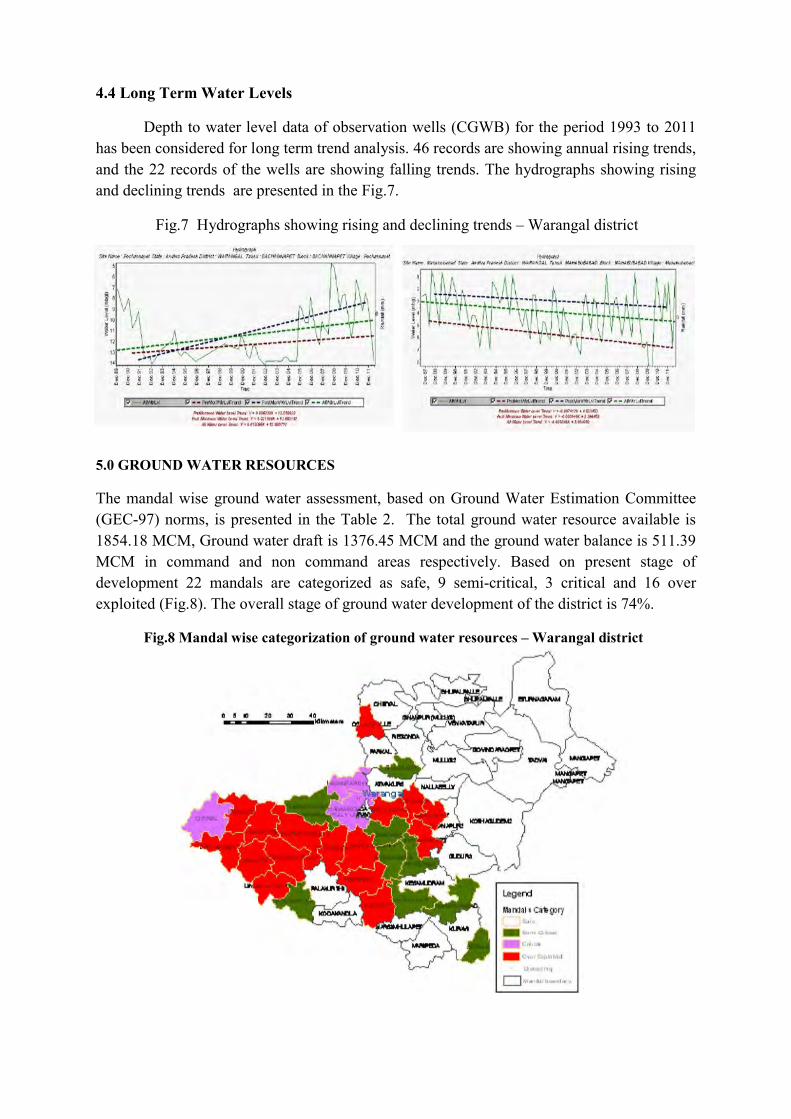
4.4 Long Term Water Levels
Depth to water level data of observation wells (CGWB) for the period 1993 to 2011
has been considered for long term trend analysis. 46 records are showing annual rising trends,
and the 22 records of the wells are showing falling trends. The hydrographs showing rising
and declining trends are presented in the Fig.7.
Fig.7 Hydrographs showing rising and declining trends – Warangal district
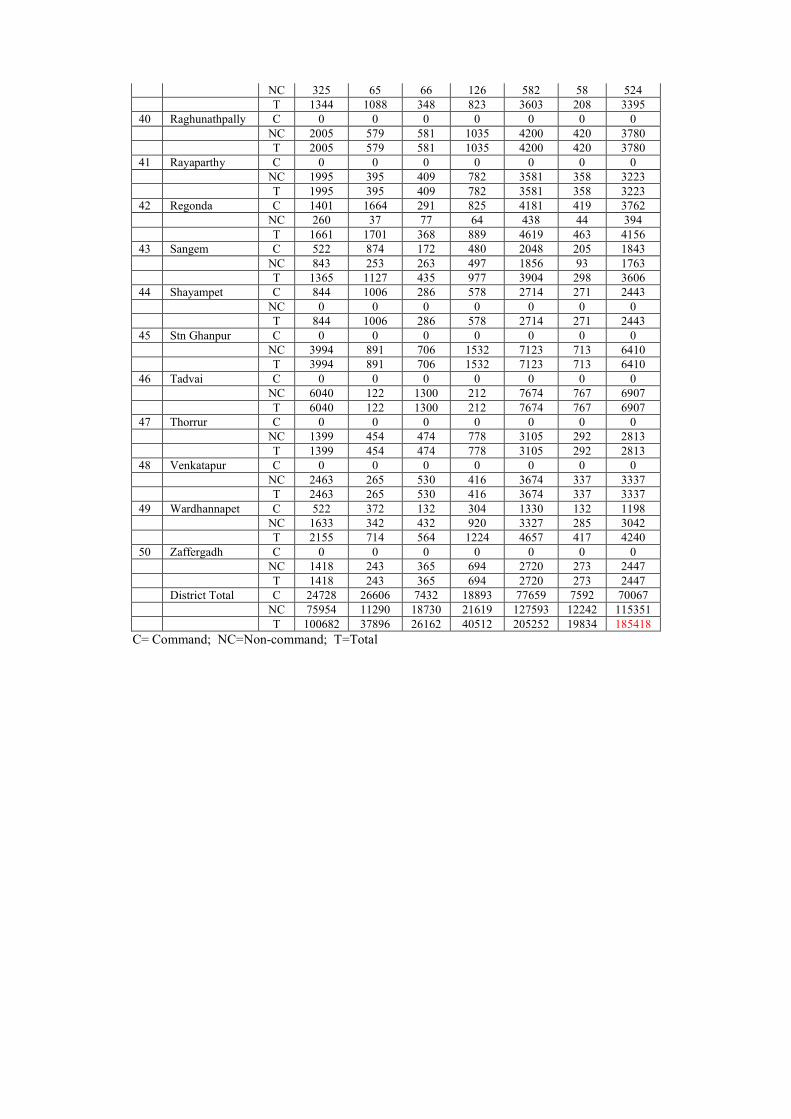
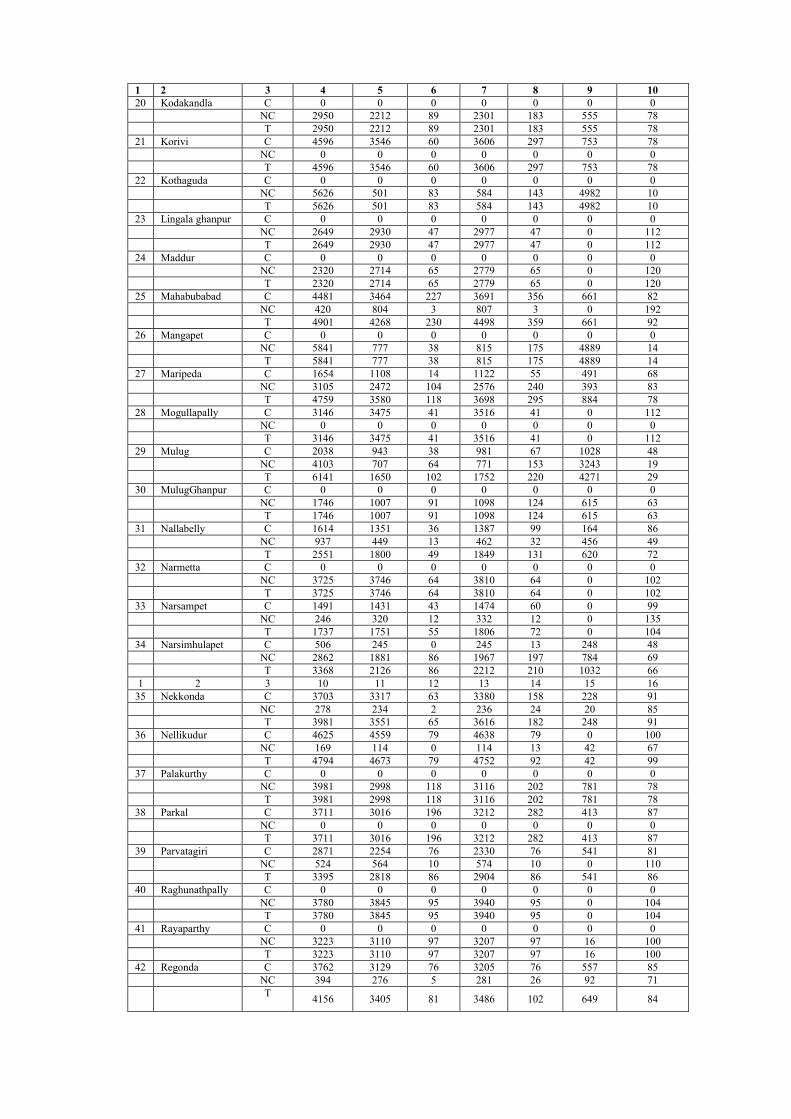
5.0 GROUND WATER RESOURCES
The mandal wise ground water assessment, based on Ground Water Estimation Committee
(GEC-97) norms, is presented in the Table 2. The total ground water resource available is
1854.18 MCM, Ground water draft is 1376.45 MCM and the ground water balance is 511.39
MCM in command and non command areas respectively. Based on present stage of
development 22 mandals are categorized as safe, 9 semi-critical, 3 critical and 16 over
exploited (Fig.8). The overall stage of ground water development of the district is 74%.
Fig.8 Mandal wise categorization of ground water resources – Warangal district

Table.2 Mandal Wise Dynamic Groundwater Resources Assessment Warangal District, Andhra Pradesh[2008-2009] [in ha.m.]
Sl.
No
Man
dal
C/
NC
/ T
Rec
harg
e fr
om r
ainf
all
duri
ng
mon
soon
sea
son
Rec
harg
e fr
om o
ther
sou
rces
du
ring
mon
soon
sea
son
Rec
harg
e fr
om r
ainf
all
duri
ng
non-
mon
soon
sea
son
Rec
harg
e fr
om o
ther
sou
rces
du
ring
non
-mon
soon
sea
son
Tot
al a
nnu
al g
roun
d w
ater
re
char
ge [
4+5+
6+
7]
Pro
vis
ion
for
natu
ral
disc
harg
e
Net
ann
ual
gro
und
wat
er
avai
labi
lity
1 2 3 4 5 6 7 8 9 10 1 Atmakur C 1507 1962 561 1082 5112 511 4601 NC 0 0 0 0 0 0 0 T 1507 1962 561 1082 5112 511 4601 2 Bachannapet C 0 0 0 0 0 0 0 NC 1752 355 380 869 3356 336 3020 T 1752 355 380 869 3356 336 3020 3 Bhupalpally C 263 63 52 63 441 44 397 NC 2302 139 423 244 3108 311 2797 T 2565 202 475 307 3549 355 3194 4 Chennaraopet C 1026 597 267 886 2776 278 2498 NC 0 0 0 0 0 0 0 T 1026 597 267 886 2776 278 2498 5 Cherial C 0 0 0 0 0 0 0 NC 2240 212 564 914 3930 393 3537 T 2240 212 564 914 3930 393 3537 6 Chityal C 1938 2593 391 1165 6087 609 5478 NC 480 44 77 77 678 67 611 T 2418 2637 468 1242 6765 676 6089 7 Devaruppula C 0 0 0 0 0 0 0 NC 1541 430 450 795 3216 322 2894 T 1541 430 450 795 3216 322 2894 8 Dharmasagar C 0 0 0 0 0 0 0 NC 1761 721 505 1278 4265 426 3839 T 1761 721 505 1278 4265 426 3839 9 Dornakal C 993 491 332 766 2582 258 2324 NC 0 0 0 0 0 0 0 T 993 491 332 766 2582 258 2324 10 Duggondi C 459 530 182 371 1542 154 1388 NC 306 78 142 153 679 68 611 T 765 608 324 524 2221 222 1999 11 Eturnagaram C 0 0 0 0 0 0 0 NC 5903 112 1375 179 7569 757 6812 T 5903 112 1375 179 7569 757 6812 12 Geesugonda C 234 416 122 181 953 95 858 NC 780 226 331 423 1760 176 1584 T 1014 642 453 604 2713 271 2442 13 Govindraopet C 0 0 0 0 0 0 0 NC 3649 247 832 408 5136 514 4622 T 3649 247 832 408 5136 514 4622 14 Gudur C 707 305 177 600 1789 179 1610 NC 1306 177 322 462 2267 227 2040 T 2013 482 499 1062 4056 406 3650 15 Hanamkonda C 21 6 7 12 46 5 41 NC 2127 317 654 620 3718 372 3346 T 2148 323 661 632 3764 377 3387 16 Hasanparthy C 1205 801 295 969 3270 327 2943 NC 0 0 0 0 0 0 0 T 1205 801 295 969 3270 327 2943 17 Jangaon C 0 0 0 0 0 0 0 NC 1277 373 426 813 2889 289 2600

T 1277 373 426 813 2889 289 2600 18 Kesamudram C 1501 1488 488 1242 4719 472 4247 NC 0 0 0 0 0 0 0 T 1501 1488 488 1242 4719 472 4247 19 Khanapur C 0 0 0 0 0 0 0 NC 910 128 227 334 1599 159 1440 T 910 128 227 334 1599 159 1440 20 Kodakandla C 0 0 0 0 0 0 0 NC 1534 430 459 682 3105 155 2950 T 1534 430 459 682 3105 155 2950 21 Korivi C 1644 1501 552 1410 5107 511 4596 NC 0 0 0 0 0 0 0 T 1644 1501 552 1410 5107 511 4596 22 Kothaguda C 0 0 0 0 0 0 0 NC 4459 179 1352 262 6252 626 5626 T 4459 179 1352 262 6252 626 5626 23 Lingala ghanpur C 0 0 0 0 0 0 0 NC 1293 392 439 820 2944 295 2649 T 1293 392 439 820 2944 295 2649 24 Maddur C 0 0 0 0 0 0 0 NC 1314 279 331 653 2577 257 2320 T 1314 279 331 653 2577 257 2320 25 Mahabubabad C 1456 1839 469 1216 4980 499 4481 NC 266 37 66 98 467 47 420 T 1722 1876 535 1314 5447 546 4901 26 Mangapet C 0 0 0 0 0 0 0 NC 5042 177 969 302 6490 649 5841 T 5042 177 969 302 6490 649 5841 27 Maripeda C 452 834 150 402 1838 184 1654 NC 1889 433 465 662 3449 344 3105 T 2341 1267 615 1064 5287 528 4759 28 Mogullapally C 1075 1256 275 890 3496 350 3146 NC 0 0 0 0 0 0 0 T 1075 1256 275 890 3496 350 3146 29 Mulug C 655 872 272 439 2238 200 2038 NC 3498 140 680 241 4559 456 4103 T 4153 1012 952 680 6797 656 6141 30 MulugGhanpur C 0 0 0 0 0 0 0 NC 1225 182 247 286 1940 194 1746 T 1225 182 247 286 1940 194 1746 31 Nallabelly C 454 765 225 350 1794 180 1614 NC 550 130 147 215 1042 105 937 T 1004 895 372 565 2836 285 2551 32 Narmetta C 0 0 0 0 0 0 0 NC 2102 588 455 993 4138 413 3725 T 2102 588 455 993 4138 413 3725 33 Narsampet C 602 429 157 468 1656 165 1491 NC 149 28 39 57 273 27 246 T 751 457 196 525 1929 192 1737 34 Narsimhulapet C 130 274 43 115 562 56 506 NC 1396 461 425 730 3012 150 2862 T 1526 735 468 845 3574 206 3368 35 Nekkonda C 1204 1440 391 1079 4114 411 3703 NC 136 40 42 75 293 15 278 T 1340 1480 433 1154 4407 426 3981 36 Nellikudur C 1542 1884 500 1214 5140 515 4625 NC 81 27 32 47 187 18 169 T 1623 1911 532 1261 5327 533 4794 37 Palakurthy C 0 0 0 0 0 0 0 NC 2311 562 671 871 4415 434 3981 T 2311 562 671 871 4415 434 3981 38 Parkal C 1352 1321 361 1089 4123 412 3711 NC 0 0 0 0 0 0 0 T 1352 1321 361 1089 4123 412 3711 39 Parvatagiri C 1019 1023 282 697 3021 150 2871
C= Command; NC=Non-command; T=Total
NC 325 65 66 126 582 58 524 T 1344 1088 348 823 3603 208 3395 40 Raghunathpally C 0 0 0 0 0 0 0 NC 2005 579 581 1035 4200 420 3780 T 2005 579 581 1035 4200 420 3780 41 Rayaparthy C 0 0 0 0 0 0 0 NC 1995 395 409 782 3581 358 3223 T 1995 395 409 782 3581 358 3223 42 Regonda C 1401 1664 291 825 4181 419 3762 NC 260 37 77 64 438 44 394 T 1661 1701 368 889 4619 463 4156 43 Sangem C 522 874 172 480 2048 205 1843 NC 843 253 263 497 1856 93 1763 T 1365 1127 435 977 3904 298 3606 44 Shayampet C 844 1006 286 578 2714 271 2443 NC 0 0 0 0 0 0 0 T 844 1006 286 578 2714 271 2443 45 Stn Ghanpur C 0 0 0 0 0 0 0 NC 3994 891 706 1532 7123 713 6410 T 3994 891 706 1532 7123 713 6410 46 Tadvai C 0 0 0 0 0 0 0 NC 6040 122 1300 212 7674 767 6907 T 6040 122 1300 212 7674 767 6907 47 Thorrur C 0 0 0 0 0 0 0 NC 1399 454 474 778 3105 292 2813 T 1399 454 474 778 3105 292 2813 48 Venkatapur C 0 0 0 0 0 0 0 NC 2463 265 530 416 3674 337 3337 T 2463 265 530 416 3674 337 3337 49 Wardhannapet C 522 372 132 304 1330 132 1198 NC 1633 342 432 920 3327 285 3042 T 2155 714 564 1224 4657 417 4240 50 Zaffergadh C 0 0 0 0 0 0 0 NC 1418 243 365 694 2720 273 2447 T 1418 243 365 694 2720 273 2447 District Total C 24728 26606 7432 18893 77659 7592 70067 NC 75954 11290 18730 21619 127593 12242 115351 T 100682 37896 26162 40512 205252 19834 185418

ASSESSMENT OF MANDAL WISE DYNAMIC GROUNDWATER RESOURCES (Table.2 cont)
OF THE WARANGAL DISTRICT, ANDHRA PRADESH [2008-2009] [in ha.m.]
Sl.
No
Man
dal
C/
NC
/ T
Net
an
nu
al g
rou
nd w
ater
av
aila
bil
ity
Ex
isti
ng
gro
ss g
rou
nd w
ater
d
raft
fo
r ir
rig
ate-
on
Ex
isti
ng
gro
ss G
W d
raft
fo
r d
om
esti
c an
d i
nd
ust
rial
wat
er
sup
ply
Ex
isti
ng
gro
ss g
rou
nd w
ater
d
raft
fo
r al
l u
ses
[1
1+
12
]
Pro
vis
ion
fo
r d
om
esti
c an
d
ind
ust
rial
req
uir
emen
t su
pp
ly
to 2
02
5
Net
GW
av
aila
bil
ity
for
futu
re i
rrig
atio
n d
evel
op
- m
ent
[1
0-1
1-1
4]
Sta
ge
of
gro
un
d w
ater
d
evel
op
men
t
{(1
3/1
0*1
00
)} [
%]
1 2 3 4 5 6 7 8 9 10 1 Atmakur C 4601 2374 68 2442 203 2024 53 NC 0 0 0 0 0 0 0 T 4601 2374 68 2442 203 2024 53 2 Bachannapet C 0 0 0 0 0 0 0 NC 3020 2900 66 2966 120 0 98 T 3020 2900 66 2966 120 0 98 3 Bhupalpally C 397 176 0 176 22 199 44 NC 2797 490 412 902 412 1895 32 T 3194 666 412 1078 434 2094 34 4 Chennaraopet C 2498 3054 61 3115 61 0 125 NC 0 0 0 0 0 0 0 T 2498 3054 61 3115 61 0 125 5 Cherial C 0 0 0 0 0 0 0 NC 3537 3148 98 3246 250 139 92 T 3537 3148 98 3246 250 139 92 6 Chityal C 5478 4012 70 4082 191 1275 75 NC 611 151 1 152 25 435 25 T 6089 4163 71 4234 216 1710 70 7 Devaruppula C 0 0 0 0 0 0 0 NC 2894 2217 67 2284 153 524 79 T 2894 2217 67 2284 153 524 79 8 Dharmasagar C 0 0 0 0 0 0 0 NC 3839 3359 79 3438 257 223 90 T 3839 3359 79 3438 257 223 90 9 Dornakal C 2324 2136 105 2241 174 14 96 NC 0 0 0 0 0 0 0 T 2324 2136 105 2241 174 14 96 10 Duggondi C 1388 1361 40 1401 40 0 101 NC 611 959 44 1003 44 0 164 T 1999 2320 84 2404 84 0 120 11 Eturnagaram C 0 0 0 0 0 0 0 NC 6812 525 30 555 138 6149 8 T 6812 525 30 555 138 6149 8 12 Geesugonda C 858 734 15 749 47 77 87 NC 1584 1933 73 2006 73 0 127 T 2442 2667 88 2755 120 77 113 13 Govindraopet C 0 0 0 0 0 0 0 NC 4622 417 35 452 109 4096 10 T 4622 417 35 452 109 4096 10 14 Gudur C 1610 1190 32 1222 107 313 76 NC 2040 1049 43 1092 94 897 54 T 3650 2239 75 2314 201 1210 63 15 Hanamkonda C 41 0 0 0 0 41 0 NC 3346 2800 433 3233 546 0 97 T 3387 2800 433 3233 546 41 95
16 Hasanparthy C 2943 2797 92 2889 146 0 98
NC 0 0 0 0 0 0 0 T 2943 2797 92 2889 146 0 98 17 Jangaon C 0 0 0 0 0 0 0 NC 2600 3111 127 3238 127 0 125 T 2600 3111 127 3238 127 0 125 18 Kesamudram C 4247 2540 370 2910 370 1337 69 NC 0 0 0 0 0 0 0 T 4247 2540 370 2910 370 1337 69 19 Khanapur C 0 0 0 0 0 0 0 NC 1440 855 25 880 115 470 61 T 1440 855 25 880 115 470 61
1 2 3 4 5 6 7 8 9 10 20 Kodakandla C 0 0 0 0 0 0 0 NC 2950 2212 89 2301 183 555 78 T 2950 2212 89 2301 183 555 78 21 Korivi C 4596 3546 60 3606 297 753 78 NC 0 0 0 0 0 0 0 T 4596 3546 60 3606 297 753 78 22 Kothaguda C 0 0 0 0 0 0 0 NC 5626 501 83 584 143 4982 10 T 5626 501 83 584 143 4982 10 23 Lingala ghanpur C 0 0 0 0 0 0 0 NC 2649 2930 47 2977 47 0 112 T 2649 2930 47 2977 47 0 112 24 Maddur C 0 0 0 0 0 0 0 NC 2320 2714 65 2779 65 0 120 T 2320 2714 65 2779 65 0 120 25 Mahabubabad C 4481 3464 227 3691 356 661 82 NC 420 804 3 807 3 0 192 T 4901 4268 230 4498 359 661 92 26 Mangapet C 0 0 0 0 0 0 0 NC 5841 777 38 815 175 4889 14 T 5841 777 38 815 175 4889 14 27 Maripeda C 1654 1108 14 1122 55 491 68 NC 3105 2472 104 2576 240 393 83 T 4759 3580 118 3698 295 884 78 28 Mogullapally C 3146 3475 41 3516 41 0 112 NC 0 0 0 0 0 0 0 T 3146 3475 41 3516 41 0 112 29 Mulug C 2038 943 38 981 67 1028 48 NC 4103 707 64 771 153 3243 19 T 6141 1650 102 1752 220 4271 29 30 MulugGhanpur C 0 0 0 0 0 0 0 NC 1746 1007 91 1098 124 615 63 T 1746 1007 91 1098 124 615 63 31 Nallabelly C 1614 1351 36 1387 99 164 86 NC 937 449 13 462 32 456 49 T 2551 1800 49 1849 131 620 72 32 Narmetta C 0 0 0 0 0 0 0 NC 3725 3746 64 3810 64 0 102 T 3725 3746 64 3810 64 0 102 33 Narsampet C 1491 1431 43 1474 60 0 99 NC 246 320 12 332 12 0 135 T 1737 1751 55 1806 72 0 104 34 Narsimhulapet C 506 245 0 245 13 248 48 NC 2862 1881 86 1967 197 784 69 T 3368 2126 86 2212 210 1032 66 1 2 3 10 11 12 13 14 15 16
35 Nekkonda C 3703 3317 63 3380 158 228 91 NC 278 234 2 236 24 20 85 T 3981 3551 65 3616 182 248 91 36 Nellikudur C 4625 4559 79 4638 79 0 100 NC 169 114 0 114 13 42 67 T 4794 4673 79 4752 92 42 99 37 Palakurthy C 0 0 0 0 0 0 0 NC 3981 2998 118 3116 202 781 78 T 3981 2998 118 3116 202 781 78 38 Parkal C 3711 3016 196 3212 282 413 87 NC 0 0 0 0 0 0 0 T 3711 3016 196 3212 282 413 87 39 Parvatagiri C 2871 2254 76 2330 76 541 81 NC 524 564 10 574 10 0 110 T 3395 2818 86 2904 86 541 86 40 Raghunathpally C 0 0 0 0 0 0 0 NC 3780 3845 95 3940 95 0 104 T 3780 3845 95 3940 95 0 104 41 Rayaparthy C 0 0 0 0 0 0 0 NC 3223 3110 97 3207 97 16 100 T 3223 3110 97 3207 97 16 100 42 Regonda C 3762 3129 76 3205 76 557 85 NC 394 276 5 281 26 92 71
T
4156 3405 81 3486 102 649 84
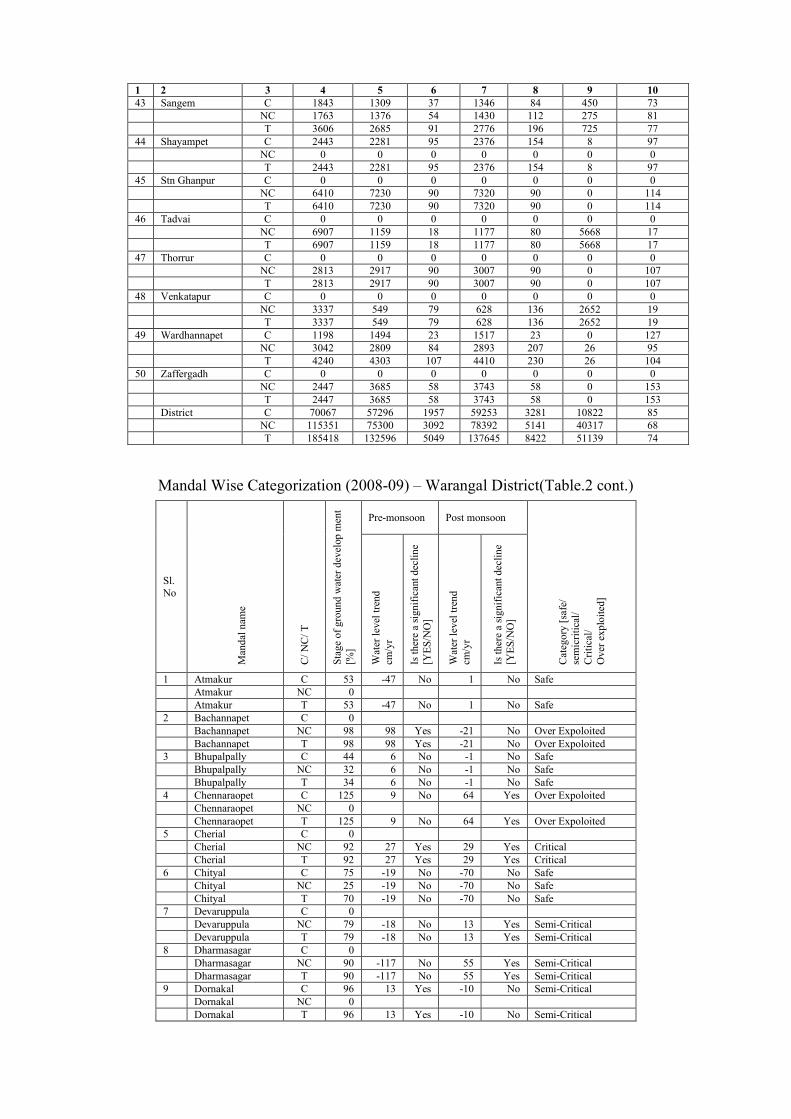
Mandal Wise Categorization (2008-09) – Warangal District(Table.2 cont.)
1 2 3 4 5 6 7 8 9 10 43 Sangem C 1843 1309 37 1346 84 450 73 NC 1763 1376 54 1430 112 275 81 T 3606 2685 91 2776 196 725 77 44 Shayampet C 2443 2281 95 2376 154 8 97 NC 0 0 0 0 0 0 0 T 2443 2281 95 2376 154 8 97 45 Stn Ghanpur C 0 0 0 0 0 0 0 NC 6410 7230 90 7320 90 0 114 T 6410 7230 90 7320 90 0 114 46 Tadvai C 0 0 0 0 0 0 0 NC 6907 1159 18 1177 80 5668 17 T 6907 1159 18 1177 80 5668 17 47 Thorrur C 0 0 0 0 0 0 0 NC 2813 2917 90 3007 90 0 107 T 2813 2917 90 3007 90 0 107 48 Venkatapur C 0 0 0 0 0 0 0 NC 3337 549 79 628 136 2652 19 T 3337 549 79 628 136 2652 19 49 Wardhannapet C 1198 1494 23 1517 23 0 127 NC 3042 2809 84 2893 207 26 95 T 4240 4303 107 4410 230 26 104 50 Zaffergadh C 0 0 0 0 0 0 0 NC 2447 3685 58 3743 58 0 153 T 2447 3685 58 3743 58 0 153 District C 70067 57296 1957 59253 3281 10822 85 NC 115351 75300 3092 78392 5141 40317 68 T 185418 132596 5049 137645 8422 51139 74
Sl. No
Man
dal
nam
e
C/
NC
/ T
Sta
ge o
f gr
ound
wat
er d
evel
op m
ent
[%]
Pre-monsoon Post monsoon
Cat
egor
y [s
afe/
se
mic
riti
cal/
C
riti
cal/
O
ver
expl
oite
d]
Wat
er l
eve l
tre
nd
cm/y
r
Is t
here
a s
igni
fica
nt d
ecli
ne
[YE
S/N
O]
Wat
er l
evel
tre
nd
cm/y
r
Is t
here
a s
igni
fica
nt d
ecli
ne
[YE
S/N
O]
1 Atmakur C 53 -47 No 1 No Safe Atmakur NC 0 Atmakur T 53 -47 No 1 No Safe 2 Bachannapet C 0 Bachannapet NC 98 98 Yes -21 No Over Expoloited Bachannapet T 98 98 Yes -21 No Over Expoloited 3 Bhupalpally C 44 6 No -1 No Safe Bhupalpally NC 32 6 No -1 No Safe Bhupalpally T 34 6 No -1 No Safe 4 Chennaraopet C 125 9 No 64 Yes Over Expoloited Chennaraopet NC 0 Chennaraopet T 125 9 No 64 Yes Over Expoloited 5 Cherial C 0 Cherial NC 92 27 Yes 29 Yes Critical Cherial T 92 27 Yes 29 Yes Critical 6 Chityal C 75 -19 No -70 No Safe Chityal NC 25 -19 No -70 No Safe Chityal T 70 -19 No -70 No Safe 7 Devaruppula C 0 Devaruppula NC 79 -18 No 13 Yes Semi-Critical Devaruppula T 79 -18 No 13 Yes Semi-Critical 8 Dharmasagar C 0 Dharmasagar NC 90 -117 No 55 Yes Semi-Critical Dharmasagar T 90 -117 No 55 Yes Semi-Critical 9 Dornakal C 96 13 Yes -10 No Semi-Critical Dornakal NC 0 Dornakal T 96 13 Yes -10 No Semi-Critical
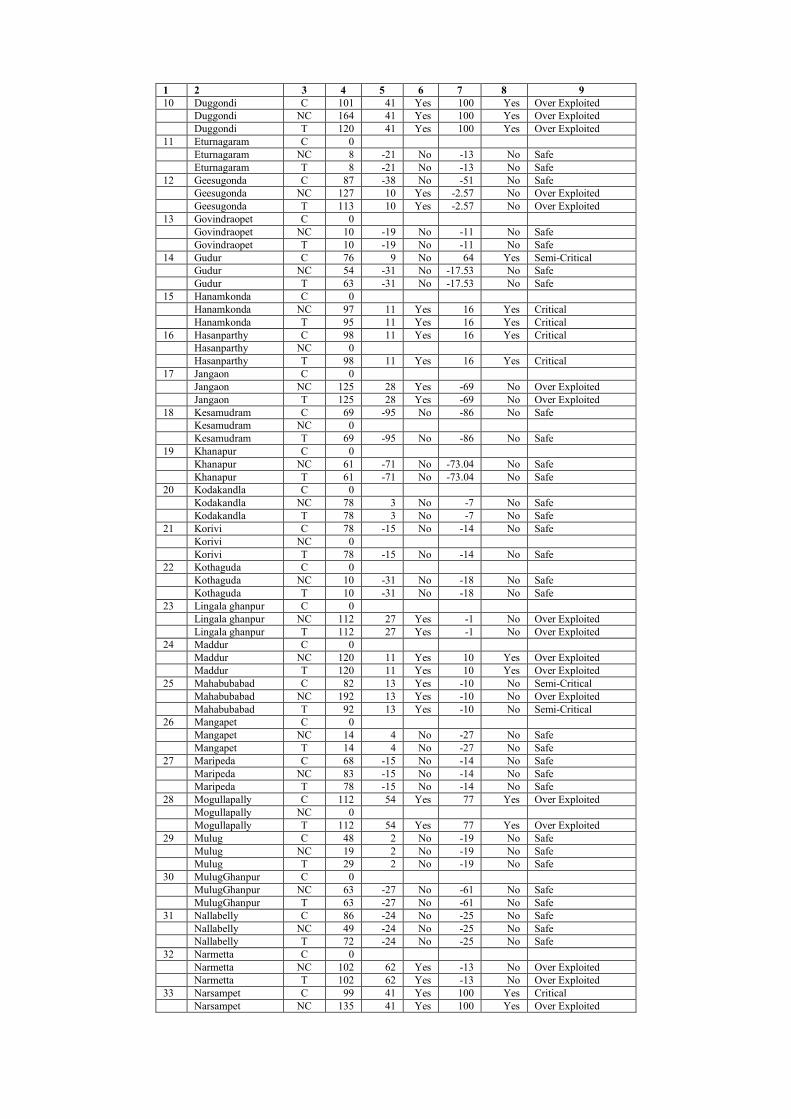
1 2 3 4 5 6 7 8 9 10 Duggondi C 101 41 Yes 100 Yes Over Exploited Duggondi NC 164 41 Yes 100 Yes Over Exploited Duggondi T 120 41 Yes 100 Yes Over Exploited 11 Eturnagaram C 0 Eturnagaram NC 8 -21 No -13 No Safe Eturnagaram T 8 -21 No -13 No Safe 12 Geesugonda C 87 -38 No -51 No Safe Geesugonda NC 127 10 Yes -2.57 No Over Exploited Geesugonda T 113 10 Yes -2.57 No Over Exploited 13 Govindraopet C 0 Govindraopet NC 10 -19 No -11 No Safe Govindraopet T 10 -19 No -11 No Safe 14 Gudur C 76 9 No 64 Yes Semi-Critical Gudur NC 54 -31 No -17.53 No Safe Gudur T 63 -31 No -17.53 No Safe 15 Hanamkonda C 0 Hanamkonda NC 97 11 Yes 16 Yes Critical Hanamkonda T 95 11 Yes 16 Yes Critical 16 Hasanparthy C 98 11 Yes 16 Yes Critical Hasanparthy NC 0 Hasanparthy T 98 11 Yes 16 Yes Critical 17 Jangaon C 0 Jangaon NC 125 28 Yes -69 No Over Exploited Jangaon T 125 28 Yes -69 No Over Exploited 18 Kesamudram C 69 -95 No -86 No Safe Kesamudram NC 0 Kesamudram T 69 -95 No -86 No Safe 19 Khanapur C 0 Khanapur NC 61 -71 No -73.04 No Safe Khanapur T 61 -71 No -73.04 No Safe 20 Kodakandla C 0 Kodakandla NC 78 3 No -7 No Safe Kodakandla T 78 3 No -7 No Safe 21 Korivi C 78 -15 No -14 No Safe Korivi NC 0 Korivi T 78 -15 No -14 No Safe 22 Kothaguda C 0 Kothaguda NC 10 -31 No -18 No Safe Kothaguda T 10 -31 No -18 No Safe 23 Lingala ghanpur C 0 Lingala ghanpur NC 112 27 Yes -1 No Over Exploited Lingala ghanpur T 112 27 Yes -1 No Over Exploited 24 Maddur C 0 Maddur NC 120 11 Yes 10 Yes Over Exploited Maddur T 120 11 Yes 10 Yes Over Exploited 25 Mahabubabad C 82 13 Yes -10 No Semi-Critical Mahabubabad NC 192 13 Yes -10 No Over Exploited Mahabubabad T 92 13 Yes -10 No Semi-Critical 26 Mangapet C 0 Mangapet NC 14 4 No -27 No Safe Mangapet T 14 4 No -27 No Safe 27 Maripeda C 68 -15 No -14 No Safe Maripeda NC 83 -15 No -14 No Safe Maripeda T 78 -15 No -14 No Safe 28 Mogullapally C 112 54 Yes 77 Yes Over Exploited Mogullapally NC 0 Mogullapally T 112 54 Yes 77 Yes Over Exploited 29 Mulug C 48 2 No -19 No Safe Mulug NC 19 2 No -19 No Safe Mulug T 29 2 No -19 No Safe 30 MulugGhanpur C 0 MulugGhanpur NC 63 -27 No -61 No Safe MulugGhanpur T 63 -27 No -61 No Safe 31 Nallabelly C 86 -24 No -25 No Safe Nallabelly NC 49 -24 No -25 No Safe Nallabelly T 72 -24 No -25 No Safe 32 Narmetta C 0 Narmetta NC 102 62 Yes -13 No Over Exploited Narmetta T 102 62 Yes -13 No Over Exploited 33 Narsampet C 99 41 Yes 100 Yes Critical Narsampet NC 135 41 Yes 100 Yes Over Exploited

6.0 GROUND WATER QUALITY
The ground water in the district is in general suitable for both domestic and irrigation
purpose. PH is well within the prescribed limits in the district. Total Hardness values are
beyond permissible limits in about 28% of the samples.12% of samples are beyond
permissible limits with respect to Bicarbonate, whereas about 80% samples falls beyond the
permissible limits, in case of Nitrates. This may be attributed to anthropogenic activities
going on thought the district. Fluoride is excess as per the BIS permissible limits at one place
ie., Narampet in the district.
The electrical conductivity is defined as reciprocal of electrical resistance and it
measures the ability of water to conduct electric current. The distribution of EC in Warangal
1 2 3 4 5 6 7 8 9 Narsampet T 104 41 Yes 100 Yes Over Exploited 34 Narsimhulapet C 48 -71 No -73 No Safe Narsimhulapet NC 69 -71 No -73 No Safe Narsimhulapet T 66 -71 No -73 No Safe 35 Nekkonda C 91 -1 No 12 Yes Semi-Critical Nekkonda NC 85 -1 No 12 Yes Semi-Critical Nekkonda T 91 -1 No 12 Yes Semi-Critical 36 Nellikudur C 100 18 Yes 7 No Over Exploited Nellikudur NC 67 3 No -6.75 No Safe Nellikudur T 99 18 Yes 7 No Semi-Critical 37 Palakurthy C 0 Palakurthy NC 78 3 No -7 No Safe Palakurthy T 78 3 No -7 No Safe 38 Parkal C 87 10 No -3 No Safe Parkal NC 0 Parkal T 87 10 No -3 No Safe 39 Parvatagiri C 81 36 Yes -2 No Semi-Critical Parvatagiri NC 110 36 Yes -2 No Over Exploited Parvatagiri T 86 36 Yes -2 No Semi-Critical 40 Raghunathpally C 0 Raghunathpally NC 104 33 Yes -16 No Over Exploited Raghunathpally T 104 33 Yes -16 No Over Exploited 41 Rayaparthy C 0 Rayaparthy NC 100 -138 No 21 Yes Over Exploited Rayaparthy T 100 -138 No 21 Yes Over Exploited 42 Regonda C 85 -19 No -70 No Safe Regonda NC 71 -19 No -70 No Safe Regonda T 84 -19 No -70 No Safe 43 Sangem C 73 18 Yes 7 No S.C. Sangem NC 81 3 No -6.75 No Safe Sangem T 77 18 Yes 7 No S.C. 44 Shayampet C 97 11 Yes -3 No Semi-Critical Shayampet NC 0 Shayampet T 97 11 Yes -3 No Semi-Critical 45 Stn Ghanpur C 0 Stn Ghanpur NC 114 -42 No 21 Yes Over Exploited Stn Ghanpur T 114 -42 No 21 Yes Over Exploited 46 Tadvai C 0 Tadvai NC 17 -1 No -10 No Safe Tadvai T 17 -1 No -10 No Safe 47 Thorrur C 0 Thorrur NC 107 -159 No 14 Yes Over Exploited Thorrur T 107 -159 No 14 Yes Over Exploited 48 Venkatapur C 0 Venkatapur NC 19 -4 No 0 No Safe Venkatapur T 19 -4 No 0 No Safe 49 Wardhannapet C 127 36 Yes -2 No Over Exploited Wardhannapet NC 95 36 Yes -2 No Semi-Critical Wardhannapet T 104 36 Yes -2 No Over Exploited 50 Zaffergadh C 0 Zaffergadh NC 153 45 Yes 29 Yes Over Exploited Zaffergadh T 153 45 Yes 29 Yes Over Exploited
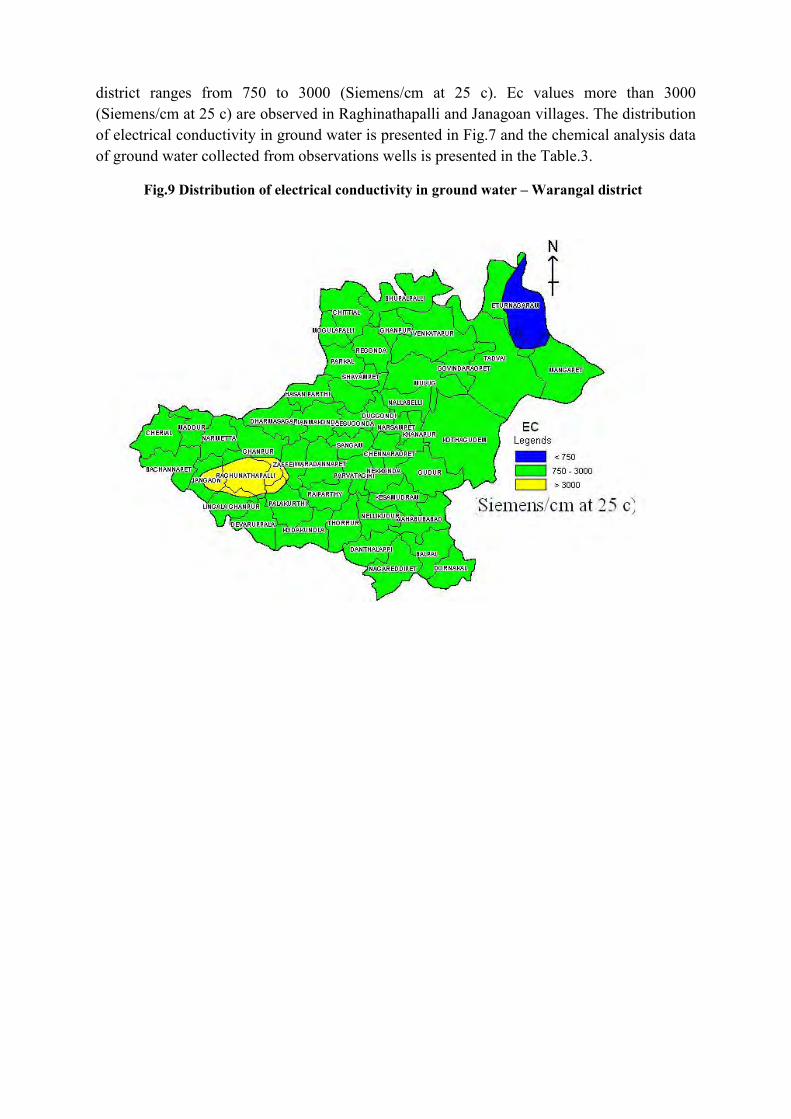
district ranges from 750 to 3000 (Siemens/cm at 25 c). Ec values more than 3000
(Siemens/cm at 25 c) are observed in Raghinathapalli and Janagoan villages. The distribution
of electrical conductivity in ground water is presented in Fig.7 and the chemical analysis data
of ground water collected from observations wells is presented in the Table.3.
Fig.9 Distribution of electrical conductivity in ground water – Warangal district
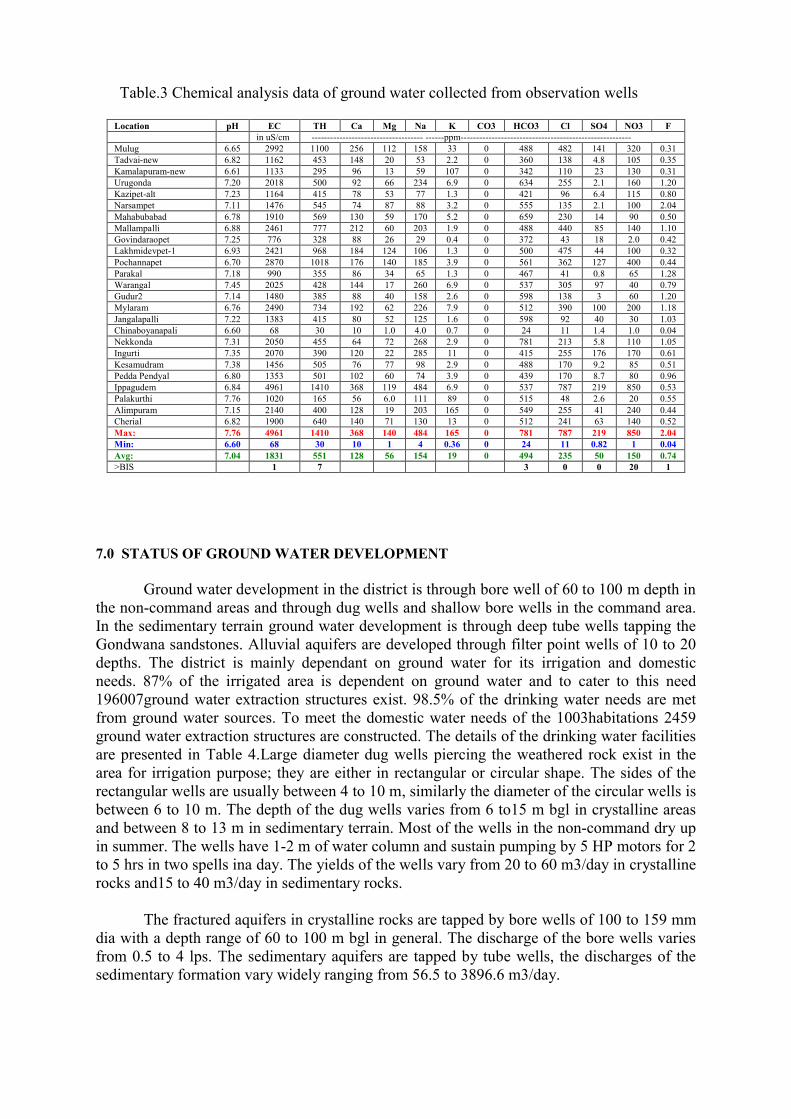
Table.3 Chemical analysis data of ground water collected from observation wells
7.0 STATUS OF GROUND WATER DEVELOPMENT
Ground water development in the district is through bore well of 60 to 100 m depth in
the non-command areas and through dug wells and shallow bore wells in the command area. In the sedimentary terrain ground water development is through deep tube wells tapping the Gondwana sandstones. Alluvial aquifers are developed through filter point wells of 10 to 20 depths. The district is mainly dependant on ground water for its irrigation and domestic needs. 87% of the irrigated area is dependent on ground water and to cater to this need 196007ground water extraction structures exist. 98.5% of the drinking water needs are met from ground water sources. To meet the domestic water needs of the 1003habitations 2459 ground water extraction structures are constructed. The details of the drinking water facilities are presented in Table 4.Large diameter dug wells piercing the weathered rock exist in the area for irrigation purpose; they are either in rectangular or circular shape. The sides of the rectangular wells are usually between 4 to 10 m, similarly the diameter of the circular wells is between 6 to 10 m. The depth of the dug wells varies from 6 to15 m bgl in crystalline areas and between 8 to 13 m in sedimentary terrain. Most of the wells in the non-command dry up in summer. The wells have 1-2 m of water column and sustain pumping by 5 HP motors for 2 to 5 hrs in two spells ina day. The yields of the wells vary from 20 to 60 m3/day in crystalline rocks and15 to 40 m3/day in sedimentary rocks.
The fractured aquifers in crystalline rocks are tapped by bore wells of 100 to 159 mm dia with a depth range of 60 to 100 m bgl in general. The discharge of the bore wells varies from 0.5 to 4 lps. The sedimentary aquifers are tapped by tube wells, the discharges of the sedimentary formation vary widely ranging from 56.5 to 3896.6 m3/day.
Location pH EC TH Ca Mg Na K CO3 HCO3 Cl SO4 NO3 F in uS/cm ------------------------------------ ------ppm------------------------------------------------------- Mulug 6.65 2992 1100 256 112 158 33 0 488 482 141 320 0.31 Tadvai-new 6.82 1162 453 148 20 53 2.2 0 360 138 4.8 105 0.35 Kamalapuram-new 6.61 1133 295 96 13 59 107 0 342 110 23 130 0.31 Urugonda 7.20 2018 500 92 66 234 6.9 0 634 255 2.1 160 1.20 Kazipet-alt 7.23 1164 415 78 53 77 1.3 0 421 96 6.4 115 0.80 Narsampet 7.11 1476 545 74 87 88 3.2 0 555 135 2.1 100 2.04 Mahabubabad 6.78 1910 569 130 59 170 5.2 0 659 230 14 90 0.50 Mallampalli 6.88 2461 777 212 60 203 1.9 0 488 440 85 140 1.10 Govindaraopet 7.25 776 328 88 26 29 0.4 0 372 43 18 2.0 0.42 Lakhmidevpet-1 6.93 2421 968 184 124 106 1.3 0 500 475 44 100 0.32 Pochannapet 6.70 2870 1018 176 140 185 3.9 0 561 362 127 400 0.44 Parakal 7.18 990 355 86 34 65 1.3 0 467 41 0.8 65 1.28 Warangal 7.45 2025 428 144 17 260 6.9 0 537 305 97 40 0.79 Gudur2 7.14 1480 385 88 40 158 2.6 0 598 138 3 60 1.20 Mylaram 6.76 2490 734 192 62 226 7.9 0 512 390 100 200 1.18 Jangalapalli 7.22 1383 415 80 52 125 1.6 0 598 92 40 30 1.03 Chinaboyanapali 6.60 68 30 10 1.0 4.0 0.7 0 24 11 1.4 1.0 0.04 Nekkonda 7.31 2050 455 64 72 268 2.9 0 781 213 5.8 110 1.05 Ingurti 7.35 2070 390 120 22 285 11 0 415 255 176 170 0.61 Kesamudram 7.38 1456 505 76 77 98 2.9 0 488 170 9.2 85 0.51 Pedda Pendyal 6.80 1353 501 102 60 74 3.9 0 439 170 8.7 80 0.96 Ippagudem 6.84 4961 1410 368 119 484 6.9 0 537 787 219 850 0.53 Palakurthi 7.76 1020 165 56 6.0 111 89 0 515 48 2.6 20 0.55 Alimpuram 7.15 2140 400 128 19 203 165 0 549 255 41 240 0.44 Cherial 6.82 1900 640 140 71 130 13 0 512 241 63 140 0.52 Max: 7.76 4961 1410 368 140 484 165 0 781 787 219 850 2.04 Min: 6.60 68 30 10 1 4 0.36 0 24 11 0.82 1 0.04 Avg: 7.04 1831 551 128 56 154 19 0 494 235 50 150 0.74 >BIS 1 7 3 0 0 20 1

8.0 GROUND WATER MANAGEMENT STRATEGY
The ground water management strategy should be such that there is optimal utilisation of ground water resource and it should also take into consideration the well spacing norms. Based on the well spacing of 250 m on an average for shallow bore wells in hard rocks and sedimentary rocks, the optimal well density per sq.km comes to 16, whereas presently the well density in the district is 19 per sq. km leaving little scope for further development of the groundwater. Based on the above norm ground water development is possible only in 22 mandals of the district which are falling under safe category.
The district is having limited command area and the entire command area is falling under safe category with a balance resource of 2060 MCM available for development. In view of this situation conjunctive use of surface and groundwater is the only alternative available. Ground water development in the command area through construction of dug wells/bore wells may be taken up for utilization of ground water resource available and use it in conjunction with surface water to increase the irrigation potential.
The southwestern and central part of the district is highly over developed and all the 16 over exploited mandals are located in this area. It is necessary to augment the ground water resource by taking up artificial recharge to ground water on a large-scale to sustain the existing ground water extraction structures. Further construction of bore wells needs to be stopped by strictly implementing APWALTA act. There is an urgent need in this area to motivate the farmer’s for changing the cropping pattern. Less water consuming crops and modern irrigation methods are to be encouraged in the area in lieu of the present practice of double crop of paddy and flood irrigation.
9.0 GROUND WATER DEVELOPMENT
Ground water development should be restricted to the command area and sedimentary terrain. In command area dug wells of 10 to 15 m depth having a radius of 5 m may be constructed in areas having water levels below 5 m bgl or shallow bore wells of 165 mm dia up to a depth of 40 m may be constructed. The selection of bore well sites should be done based on the geophysical and hydrogeological studies.
Deeper aquifer in the Gondwana formations has good potential, which can be developed by deep tube wells up to a depth of 60 to 450 m bgl. Tube wells with 254 mm housing; 152 mm casing with slotted pipes again the productive aquifer zones may be constructed. The selection of bore well sites should be done based on the geophysical and hydrogeological studies. The tube well construction and maintenance may be taken up by Government agencies and irrigation may be taken up on co-operative basis. 10.0 WATER CONSERVATION & ARTIFICIAL RECHARGE
Ground water conservation and artificial recharge works have been taken up on a large scale in the district since 2002 under Neeru-Meeru, Water shed,RIDF and other programmes. So far 1791 number of structures has been constructed. The structures constructed under these schemes are percolation tanks, check dams and farm ponds. Apart from these structures contour trenching has been done by the Forest department in number of
places. Artificial recharge works in the district should be taken up on priority basis in the 18 over exploited mandals of the district. Artificial recharge works should be avoided in command area and sedimentary terrain. Most ideally suited artificial recharge structure in the area is the percolation tank. Further modifying the percolation tank with construction of recharge bore will help very much as the weathered thickness is high and the water levels are very deep. Desalting of all the existing tanks in OE mandals need to be taken up. Apart from this check dams/gully plugs may be taken up where the slope is considerable. All the works have to be taken up on water shed basis and after careful assessment of the available surface run off and after meeting the needs of the existing structures. Rooftop harvesting both in urban and rural areas should be made mandatory to enhance the ground water recharge. 11.0 RECOMMENDATIONS
Construction of very deep bore wells beyond 80-100 m in hard rocks where the success rate is very limited leads to high cost investments and loan burdens. This can be addressed by restriction of further ground water development in then on-command area and over exploited mandalas by strict implementation ofAPWALTA act. The strategies for ground water management have to be different for different areas in the district. In Command area conjunctive use practice has to be adopted by developing ground water through dug wells/shallow bore wells and using it in conjunction with surface water to increase the irrigation potential within the command area. In sedimentary terrain by construction of tube wells of 60–450 m depth to tap the potential Gondwana sandstone. As the cost of the tube wells is quite high the development has to be undertaken by Government agencies and co-operative farming adopted by involving the stakeholders. In over exploited areas large scale artificial recharge needs to be encouraged on water shed basis. Care has to be taken in assessing the source water availability and the needs of the existing structures. Site selection needs to be done on scientific lines. Annual maintenance of the artificial recharge structure is very essential for its effective functioning. A corpus fund has to be created for the maintenance of the structure at the time of construction from the cost of the structure or contribution from the beneficiaries. Involvement of the stakeholders in the maintenance of the structure has to be made mandatory.
Acknowledgements
The author has sincerely thanks to Shri G. Sudarshan, Regional Director, CGWB,SR,
Hyderabad, for giving timely guidance to complete of this report. The data provided by the
State Ground Water Department and Directorate of Economics & Statistic’s, Govt.of Andhra
Pradesh, for preparation of the report, is gratefully acknowledged.


