Date post: | 17-Apr-2019 |
Category: |
Documents |
Upload: | vuonghuong |
View: | 212 times |
Download: | 0 times |
Title Reduced RET expression in gut tissue of individuals carryingrisk alleles of Hirschsprung's disease
Author(s) Miao, X; Leon, TYY; Ngan, ESW; So, MT; Yuan, ZW; Lui, VCH;Chen, Y; Wong, KKY; Tam, PKH; GarciaBarceló, M
Citation Human Molecular Genetics, 2010, v. 19 n. 8, p. 1461-1467
Issued Date 2010
URL http://hdl.handle.net/10722/83609
Rights
This is a pre-copy-editing, author-produced PDF of an articleaccepted for publication in Human Molecular Genetics followingpeer review. The definitive publisher-authenticated versionHuman Molecular Genetics, 2010, v. 19 n. 8, p. 1461-1467 isavailable online at:http://hmg.oxfordjournals.org/content/19/8/1461
For Peer Review
Reduced RET expression in gut tissue of individuals carrying
risk alleles of Hirschsprung’s Disease
Journal: Human Molecular Genetics
Manuscript ID: HMG-2009-W-01223.R1
Manuscript Type: 1 General Article - US Office
Date Submitted by the Author:
Complete List of Authors: Miao, Xiaoping; School of Public Health, Tongji Medical College, Huazhong University of Science and Technology, Department of Epidemiology and Biostatistics Thomas, Leon; HKU, surgery ELLY, NGAN; HKU, SURGERY Man-ting, so; HKU, surgery yuan, zhengwei; chinese medical college, surgery Vincent, Lui; HKU, surgery Kenneth, Wong; HKU, surgery chen, yan; HKU, surgery Tam, Paul; University of Hong Kong Medical Center,Queen Mary
Hospital, Division of Paediatric Surgery, Department of Surgery Garcia-Barcelo, Maria-Merce; The University of Hong Kong, Surgery and Genome Research Centre
Key Words: Hirschsprung’s disease, single nucleotide polymorphism, receptor tyrosine kinase, Gene expression
Human Molecular Genetics
For Peer Review
1
TITLE: Reduced RET expression in gut tissue of individuals carrying risk alleles of
Hirschsprung’s Disease
AUTHORS: Xiaoping MIAO,1,2# Thomas Yuk-yu LEON,2# Elly Sau-wai NGAN,2,3
Man-ting SO,2 Zheng-wei YUAN,4 Vincent Chi-hang LUI,2,3 Yan CHEN,2 Kenneth Kak-yuen
WONG,2 Paul Kwong-hang TAM,2,3 Mercè GARCIA-BARCELÓ2,3,*
1Department of Epidemiology and Biostatistics, School of Public Health, Tongji Medical
College, Huazhong University of Science and Technology, Wuhan, China; 2Division of
Paediatric Surgery, Department of Surgery and 3Centre for Reproduction, Development and
Growth, The University of Hong Kong, Hong Kong SAR, China; 4Department of Pediatric
Surgery, Shengjing Hospital, China Medical University, Shenyang, China.
#Xiaoping MIAO and Thomas Yuk-yu LEON contributed equally to this study
*Correspondence:
Dr. Mercè Garcia-Barceló
Division of Paediatric Surgery, Department of Surgery
University of Hong Kong Medical Centre
HONG KONG SAR; P.R. CHINA
Tel: +(852) 2855 4850
Fax: +(852) 2819 9623
E-mail: [email protected]
Page 1 of 23 Human Molecular Genetics
123456789101112131415161718192021222324252627282930313233343536373839404142434445464748495051525354555657585960
For Peer Review
2
ABSTRACT
RET single nucleotide polymorphisms (SNPs) are associated with the Hirschsprung’s
disease (HSCR). We investigated whether the amount of RET expressed in the ganglionic gut
of human was dependent on the genotype of three regulatory SNPs (-5G>A rs10900296 and
-1A>C rs10900297 in the promoter, and C>T rs2435357 in intron 1). We examined the
effects of three regulatory SNPs on the RET gene expression in 67 human ganglionic gut
tissues using quantitative real-time PCR. Also, 315 Chinese HSCR patients and 325
ethnically matched controls were genotyped for the 3 SNPs by polymerase chain reaction
(PCR) and direct sequencing. The expression of RET mRNA in human gut tissue did indeed
correlate with the genotypes of the individuals. The lowest RET expression was found for
those individuals homozygous for the three risk alleles (A-C-T /A-C-T), and the highest for
those homozygous for the “wild type” counterpart (G-A-C/G-A-C), with expression values
ranging from 218.32±125.69 (mean±SE) in tissues from individuals carrying G-A-C/G-A-C
to 31.42±8.42 for individuals carrying A-C-T /A-C-T (p=0.018). As expected, alleles -5A,
-1C and intron 1 T were associated with HSCR (p=5.94x10⁻³¹, 3.12x10⁻²⁴ and 5.94x10-37,
respectively) as was the haplotype encompassing the three associated alleles (A-C-T) when
compared to the wild type counterpart G-A-C (χ2=155.29, p<<0.0001). To our knowledge,
this is the first RET expression genotype-phenotype correlation study conducted on human
subjects to indicate common genetic variants in the regulatory region of RET may play a role
in mediating susceptibility to HSCR, by conferring a significant reduction of the RET
expression.
Page 2 of 23Human Molecular Genetics
123456789101112131415161718192021222324252627282930313233343536373839404142434445464748495051525354555657585960
For Peer Review
3
INTRODUCTION
Hirschsprung’s disease (HSCR, OMIM 142623), which occurs in 1 in 5000 live births
worldwide and most prevalently in Asians (2.8 per 10,000 life birth), is a developmental
disorder characterized by the absence of ganglion cells of the plexus myentericus and
submucosus in the variable lengths of the digestive tract (1,2). Aganglionosis is attributed
to a defect of the enteric nervous system (ENS), whereby neural crest cells (enteric neurons
precursors) fail to innervate the lower gastrointestinal tract during embryonic development.
This results in failure to pass meconium, chronic severe constipation and colonic distention in
the neonatal period. HSCR most commonly presents sporadically although it can be familial
and manifests with low, sex-dependent penetrance and variability in the length of the
aganglionic segment (total, long and short segment aganglionosis) (2).
HSCR has a complex genetic etiology, and the manifestation of the disease has been
associated with mutations in genes that encode signaling molecules crucial for the proper
ENS development. The receptor tyrosine kinase gene, RET, which is mainly expressed in
neural crest cells (NCC) during enteric neurogenesis and is required for normal development
of the ENS, is the major susceptibility gene for HSCR (1-3). Mutations in the coding
sequences (CDSs) of the RET gene account for up to 50% of familial HSCR patients and
7%–35% of sporadic cases (4-8). Mutations leading to HSCR also occur in other genes
involved in ENS development, namely ECE1, EDN3, EDNRB, GDNF, NRTN, SOX10,
ZFHX1B, PHOX2B, GFRA1, TCF4, NTRK3, NRG1 and KIAA1279 (9-12). However, the
fact only a fraction of HSCR patients are accounted for mutations in these genes suggests that
other susceptibility loci exist. However, the fact that only a fraction of HSCR patients are
accounted for mutations in these genes suggests that other susceptibility loci exist. In fact,
additional HSCR loci have been mapped to the 9q31, 3p21, 19q12 and 16q23 chromosomal
regions (11).
Page 3 of 23 Human Molecular Genetics
123456789101112131415161718192021222324252627282930313233343536373839404142434445464748495051525354555657585960
For Peer Review
4
The HSCR phenotype is also associated with RET single nucleotide polymorphisms
(SNPs) spanning throughout the gene. These could act as low-susceptibility factors and/or
modifiers (13-18). Current in vitro data suggests that HSCR-associated RET regulatory SNPs
might contribute to HSCR by decreasing RET expression. Our previous study showed that
alleles -5A and -1C (-5 and -1 bp from the transcription start site) of the promoter
polymorphisms -5G>A and -1A>C (rs10900296 and rs10900296 respectively;
HSCR-associated allele underlined throughout the text) were strongly associated with HSCR
in Chinese (19). Using firefly luciferase transcription reporter assays on cell lines, we also
showed that these two HSCR-associated RET polymorphisms disrupted a TTF1-binding site
and decreased transcription from the RET promoter. Similarly, the same two promoter SNPs
were found to be associated with HSCR in the Italian, German, Dutch, French and Spanish
populations (15,20-24). Importantly, we showed that the frequency of the risk alleles, -5A
and -1C, was much higher in our population than in European, providing an insight for the
higher incidence of HSCR in Chinese. In another study, Emison and colleagues identified
another HSCR-associated RET SNP within a conserved enhancer-like sequence in intron 1
(C>T rs2435357) (25). Likewise, a markedly reduced RET enhancer activity was noted in
vitro. Interestingly, the frequency of rs2435357 was found to be more elevated in East-Asia
than in other populations and the authors also correlated this fact with the higher incidence of
HSCR in that region. Although promoter and intron 1 HSCR-associated SNP alleles were
reported to play an important role in the pathogenesis of HSCR by decreasing RET
expression when tested in vitro, little in vivo evidence has been provided to sustain this
hypothesis. Since the physical distance between the promoter and the intron 1 SNPs is
around 21 Kb, an attempt to test the combined effect of these 3 SNPs in the luciferase
reporter assay is likely to be technically challenging.
In this study, we sought to investigate the molecular basis of HSCR susceptibility by
Page 4 of 23Human Molecular Genetics
123456789101112131415161718192021222324252627282930313233343536373839404142434445464748495051525354555657585960
For Peer Review
5
studying the effect of the three HSCR-associated RET SNPs (individually and in combination)
by quantitating the amount of RET expressed in the ganglionic part of the gut of HSCR
patients or other newborn patients who had undergone colon surgery for reasons other than
HSCR. In addition, we re-evaluated the contribution of the genotypes and haplotypes of
these RET regulatory polymorphisms in an extended sample that consisted of 315 HSCR
patients and 325 controls.
RESULTS
RET expression is reduced in gut tissue from individuals carrying HSCR-associated
RET SNPs
We first investigated the potential effects of RET -5G>A, -1A>C and intron 1 C>T SNPs
on the RET transcriptional activity by real-time RT-PCR quantitation of RET mRNA in
ganglionic gut tissues (Figure 1) of HSCR patients and non-HSCR individuals.
We analysed the RET expression in all tissue samples collected (N=67; HSCR and
non-HSCR tissues) to establish a correlation between the expression level and the RET
genotypes or diplotypes. The expression of RET in gut tissue did indeed correlate with the
genotypes of the individuals tested. For rs2435357 in intron 1, the lowest RET expression
was found for those individuals homozygous for the T risk allele and the highest for those
homozygous for the “wild type” counterpart CC (Figure 1A). The amount of RET mRNA
(mean±SE) in individuals with the CC, CT and TT genotypes were 211.29±111.07 (N=9),
58.94±13.18 (N=20) and 31.42±8.42 (N=38), respectively (p=0.012). Moreover, there were
no statistically significant difference between HSCR patients and non-HSCR individuals
bearing the same genotype. The mRNA expression values of the CC, CT and TT genotypes
were 116.78±58.62, 59.49±14.58, 10.78±9.09 in HSCR patients and 258.54±106.09,
56.49±14.58, 10.01±3.87 in non-HSCR individuals (p=0.583, 0.913 and 0.957 for each
Page 5 of 23 Human Molecular Genetics
123456789101112131415161718192021222324252627282930313233343536373839404142434445464748495051525354555657585960
For Peer Review
6
genotype). An allele-dosage effect in the reduction of RET expression was observed as
expression values decreased according to the genotypes comprising the “T” HSCR-associated
allele. The effect of RET -5G>A or -1A>C on RET expression was similar to that of intron
1 (data not shown). We further compared the RET level of expression as a function of the
3-site diplotypes. The correlation diplotype-levels of RET expression followed the pattern
described above for the intron 1 SNP, with individuals homozygous for the HSCR
non-associated RET haplotye having the highest levels of RET expression (Figure 1B) and
individuals homozygous for the RET risk diplotype having the lowest. RET mRNA
expression values were 218.32±125.69 (mean±SE) for individuals homozygous for the
non-HSCR associated RET haplotype (G-A-C/G-A-C; N=8); 58.14±13.18 for individuals
with only one risk haplotype (A-C-T/others; N=20) and 31.42±8.42 for individuals
homozygous for the risk haplotype (A-C-T /A-C-T; N=38) (p=0.018). The only individual
with the diplotype A-C-C/A-C-C was not included in the analysis. Again, the values
obtained clearly indicate a dosage-dependent effect of the HSCR-associated RET haplotypes
on the reduction of RET expression.
Genotypes and diplotypes associated with HSCR
We then re-evaluated the contribution of the genotypes and haplotypes of these RET
regulatory polymorphisms in an extended sample that consisted of 315 HSCR patients and
325 controls. Having the functional consequences of these three SNPs in vivo, we next
examined the association of them with risk of HSCR. The genotypes for the three SNPs
tested are shown in Table 1. The allele frequencies for promoter -5A, -1C and intron 1 T
alleles were 0.500, 0.645 and 0.0451 in controls, compared with 0.832, 0.900 and 0.827 in
cases, respectively. The observed genotype frequencies of all 3 polymorphisms, -5G>A,
-1A>C and intron 1 C>T, in controls conformed to the Hardy-Weinberg equilibrium (p=0.947,
Page 6 of 23Human Molecular Genetics
123456789101112131415161718192021222324252627282930313233343536373839404142434445464748495051525354555657585960
For Peer Review
7
0.991 and 0.392, respectively). The three RET SNPs were found to be in strong linkage
disequilibrium, with a D’ value of 0.98 for -5G>A and -1A>C (p<0.001), 0.98 for -1A>C and
intron 1 C>T (p<0.001), and 0.95 for -5G>A and intron1 C>T (p<0.001) in our study
population.
The frequencies for the intron 1 CC, CT, and TT genotypes differed considerably
between cases and controls (χ2=162.54, p=5.94x10-37), with the frequency of TT
homozygotes being much higher in cases than in controls (72.4% versus 19.1%). The
differences in genotype frequencies between cases and controls at the -5G>A and -1A>C
sites were also highly significant (χ2=33.83, p=5.94x10⁻³¹ and χ2=103.14, p=3.12x10⁻²⁴),
although not as strong as those of intron 1 site.
Since the there may be synergistic effects among these SNPs on the gene expression,
we further analyzed the association with HSCR of the haplotypes comprising the three
regulatory HSCR-associated SNP. The haplotype and diplotype frequencies are presented in
Table 2. The haplotype A-C-T, was highly associated with an increased risk to HSCR
(χ2=155.29, p<<0.0001).
The genetic data is fully concordant with the RET expression data in human gut, where,
as explained above, levels of RET expression correlated with the number of copies of
HSCR-associated RET alleles.
DISCUSSION
It has been well recognized that RET, the major HSCR susceptibility gene, plays a
crucial role in the normal ENS development (4,26). Here, we have shown, for the first time,
that individuals harboring RET HSCR-associated alleles have reduced RET expression in the
ganglion cells of the gut, backing the initial genetic association data on these RET regulatory
SNPs. Thus, RET regulatory SNPs may confer an increased risk of HSCR by interfering
Page 7 of 23 Human Molecular Genetics
123456789101112131415161718192021222324252627282930313233343536373839404142434445464748495051525354555657585960
For Peer Review
8
with the normal RET expression in human developing gut. Diminished RET expression as a
risk factor for HSCR may not only be due to inactivating CDS RET mutations but also to
regulatory polymorphisms. Uesaka and colleagues have shown in mice that reduced Ret
expression recapitulated the genetic and phenotypic features of HSCR (27). Importantly, they
show that other developmental processes also dependent on Ret function, such as kidney
formation and motor innervations to the latissimus dorsi muscle, remained intact. This
illustrates that the effect of a low expression of RET is tissue-specific, as only the developing
colon was implicated. This argues for a tissue-specific regulation by trans-acting regulatory
proteins only present in the developing gut. Conceivably, DNA alterations in RET cis-acting
elements targeted by tissue-specific transcription factors and/or long-range interacting
proteins can indeed lead to tissue-specific dysregulation of RET. This would most likely be
associated with a substantial degree of inter-individual variability in the genetic
predisposition to HSCR.
Our real-time RT-PCR quantitation of RET mRNA in human ganglionic gut tissues
showed that the amount of RET mRNA form the enteric neurons correlated with the different
genotypes and haplotypes of the three regulatory RET SNPs tested. The lowest RET
expression corresponded to individuals carrying the RET risk genotypes and the highest to
those carrying the wild type genotypes. This observation was independent of the HSCR
disease status of the individual. Even though the number of non-HSCR individuals was
small, no statistically significant difference between HSCR patients and non-HSCR
individuals bearing the same genotype was observed. This is not surprising as these
HSCR-associated RET SNPs are not exclusive of the HSCR patient group and represent one
of several risk factors of HSCR. As a complex disease, additional factors may be needed for
the HSCR phenotype to appear, including the presence of and/or interaction with other yet
unknown risk or protective alleles. Thus, even though some non-HSCR individuals may
Page 8 of 23Human Molecular Genetics
123456789101112131415161718192021222324252627282930313233343536373839404142434445464748495051525354555657585960
For Peer Review
9
have reduced RET expression, this alone may not have been enough for the disease
manifestation. Importantly, as shown in Table 1, the number of cases with RET risk alleles
outnumber by far that of controls. The genetic analysis presented in this study clearly shows
that the implication of these risk haplotypes in HSCR is in an autosomal recessive or dosage
dependent manner. The latter is fully concordant with the results of the RET expression
study in human gut, which clearly indicates a dosage-dependent effect as the reduction in
RET expression is more acute in individuals homozygous for the risk haplotype when
compared to the heterozygous ones. As over 70% of the HSCR patients are homozygous for
the HSCR-associated RET haplotype (A-C-T) and most of the individuals with only one
A-C-T haplotype belong to the control group (50.8% vs. 22.5% in HSCR patients), one would
be conclude that levels of RET expression in individuals heterozygous for this RET haplotype
reach the threshold required for the correct RET signaling, hence for the proper development
of the enteric nervous system. Heterozygosis for A-C-T among patients, could be explained
by the presence of other risk alleles. Yet, it is also tempting to speculate that differential
RET allelic expression (due to either parental or other effects) between heterozygous patients
and controls (expression mainly from the HSCR-associated RET allele in patients and mainly
from the RET wild type allele in controls) could account for the genetic observation. This
could only be proven by comparing RET expression levels between a large collection of
HSCR and non-HSCR tissue samples from heterozygous individuals. Also important, if
sample size permitted, would be to investigate the differences in RET levels of expression
among individuals bearing only (in homozygosis or heterozygosis) one of the three risk SNPs.
This would help elucidate if the reduction in RET expression levels is due to a joint effect of
the three SNPs or to just to one of them (as seen in supplementary table 2, there is only one
tissue sample homozygous for the promoter risk alleles and for the intron 1 wild type alleles).
This study has limitations, some of which cannot be overcome. Firstly, the gut of
Page 9 of 23 Human Molecular Genetics
123456789101112131415161718192021222324252627282930313233343536373839404142434445464748495051525354555657585960
For Peer Review
10
newborn patients is in an advanced developmental stage (although not fully mature). Thus
our analysis does not mimic the expression of RET during the early developmental stages of
the human gut, when expression patterns of other genes may be different. For obvious
reasons, this cannot be surmounted. Through this study we show that RET expression is
already defective in the enteric neurons of the ganglionic part of the bowel for those
individuals with the RET risk alleles. Why and how this deficient expression leads to
hypo- or aganglionosis of the adjacent tissue is yet to know. Most likely, the aganglionic
gut results from a gradual depletion of RET deficient enteric neurons, as they cannot fully
respond to the environmental clues. Secondly, also for obvious reasons, it is not possible to
obtain gut tissue samples from controls, having to resort to use samples from individuals
that for reasons other than HSCR underwent gut biopsy. Thirdly, would be the sample size
issue. Due to the differences in genotype frequencies between cases and controls and also
due to the preponderance of homozygous individuals for the risk alleles among patients, it is
difficult to get a balanced representation of all genotypes and a desirable sample size.
It is worth mentioning the work by Griseri and colleagues on lymphoblasts of selected
individuals (18). That study also suggests a low expression from the RET promoter with the
-5A rs10900296 and -1C rs10900297 risk alleles.
Here, we provide the first genotype-phenotype correlation on RET expression levels in
HSCR. HSCR-associated RET regulatory SNPs play a critical role in the pathogenicity of
the disease by affecting the expression of RET in the enteric neurons of the human gut. Also,
the study emphasizes the importance of RET gene dosage in the susceptibility of HSCR.
MATERIALS AND METHODS
Study subjects
A total of 315 ethnic Chinese patients diagnosed with sporadic HSCR and 325
Page 10 of 23Human Molecular Genetics
123456789101112131415161718192021222324252627282930313233343536373839404142434445464748495051525354555657585960
For Peer Review
11
population control individuals were included in the case-control study. All patients were
histologically confirmed with either biopsy or surgical resection material for absence of
enteric plexuses, and had been consecutively recruited in the University of Hong Kong Queen
Mary Hospital and in the Beijing Children’s Hospital since January 1997. Fifteen patients
were affected with total colonic aganglionosis (TCA), 28 with long-segment aganglionosis
(LSA) and 272 with short-segment aganglionosis (SSA) (Supplementary Table 1). Part of
the patients (172) had been participants in a molecular epidemiological study of HSCR
previously described (19,28). In this study, we expanded the sample size of the HSCR
patients to 315 and that of the controls to 325. Normal control subjects were unselected,
unrelated, ethnic Chinese subjects without a diagnosis of HSCR whose samples were
obtained from the blood bank of the Hong Kong Red Cross.
Gut tissue was collected from 49 HSCR patients (subset of the 315 individuals
genotyped) and 18 non-HSCR patients who had undergone colon surgery for reasons other
than HSCR.
At recruitment, informed consent was obtained from each subject. This study was
approved by the institutional review board of the University of Hong Kong (UW 03-227
T/227).
Polymorphism analysis
Genomic DNA from 325 controls and 266 HSCR patients was extracted from blood
samples by using a QIAamp-Blood kit (Qiagen, Hilden, Germany), as previously described
(19,28). For 49 HSCR patients, DNA was isolated from surgically resected tissues.
Genotypes were analyzed using PCR and direct sequencing as described below performed
without knowledge of case-control status of subjects. A 15% masked, random sample of
cases and controls was tested twice by different persons, and the results were concordant for
Page 11 of 23 Human Molecular Genetics
123456789101112131415161718192021222324252627282930313233343536373839404142434445464748495051525354555657585960
For Peer Review
12
all of the masked duplicate sets.
The PCR primers and PCR and sequencing conditions for amplification of the RET
intron 1 region containing the polymorphism rs2435357C>T are available upon request.
The other two polymorphisms, including rs10900296 A>G, rs10900297 A>C, which are
located at -1bp and -5bp from the RET transcription start site, were analyzed by PCR and
direct sequencing as previously described (19).
Real-time assay for gene expression
Resected colon tissues were collected from forty-nine HSCR patients and 18 non-HSCR
patients. These individuals had no CDS RET mutations that could cofound our experiment.
No tissues were available from the rest of the patients. HSCR diagnosis was confirmed by
haematoxylin-eosin and acetylcholinesterase histochemical staining of rectal biopsies. For
the 18 non-HSCR patients (9 affected with imperforate anus; 7 with necrotizing enterocolitis
and 2 with mesenteric cysts), tissues were obtained from at least 2cm away from the margin
of the diseased bowel. The frequencies of genotypes and haplotypes of these three SNPs in
human gut tissues are presented in the supplementary Tables 2 and 3. All resected tissues
were immediately placed in liquid nitrogen and then stored at –80oC before analysis.
Full-thickness tissues from ganglionic portions of bowel of each HSCR patients and colons
from non-HSCR patients were used for RNA extraction by Trizol Reagent (Life Technologies,
Rockville, MD) and converted to cDNA using an oligo (dT)15 primer and Superscript III
(Invitrogen, Carlsbad, CA). The cDNA products equivalent to 10ng of total RNA were used
for quantitative real-time PCR which was performed by ready-to-use TaqMan gene
expression assays from Applied Biosystems. Although RET is mainly expressed in ENS
cells and their precursors, recent reports indicate that RET is also expressed and involoved in
the development of lymphoid system of the human gut, such in Peyer’s patches (29).
Page 12 of 23Human Molecular Genetics
123456789101112131415161718192021222324252627282930313233343536373839404142434445464748495051525354555657585960
For Peer Review
13
Therefore we used a general neuronal marker, PGP9.5, as internal control to make sure that
the RET transcripts detected were from enteric neurons. The assay for RET was
Hs01120027_ml and that for the neuron-specific gene PGP9.5 was Hs00188233_ml
(endogenous control). Real-time PCR was performed in triplicate (96-well plates) on an
ABI 7700(Applied Biosystems) machine using standard thermal cycling conditions (10min at
95oC, 40 cycles for 15s at 95oC, 1min at 6oC). A standard curve was constructed for each
PCR run with 10-fold serial dilutions containing 100, 10, 1, 0.1 and 0.01ng/mL of cDNA
from the cell line HTB11. The amount of target gene per sample was interpolated according
to the standard curves. All analyses were performed in a blinded fashion with the laboratory
operators unaware of genotyping data.
Statistical analysis
Allele, genotype and haplotypes frequency comparisons between the 315 patients
and the 325 control individuals were performed using Chi-square tests and
Cochran-Armitage test, which is typically used in tests for trend when some categories are
ordered, therefore we used to detect the dosage dependent effect of RET variants in the risk
of HSCR. Chi-square tests were also performed to determine whether each polymorphism
was in Hardy-Weinberg equilibrium within each group. The program PHASE, which
allows for recombination and decay of LD with distance, was used for computational
reconstruction of most likely haplotype pairs for each individual, for estimation of the
haplotype frequencies in each group, and case-control global statistics (30,31). Linkage
disequilibrium was analyzed using Haploview software (32).
Statistical comparisons of the normalized RET gene expression between the different
genotypes or haplotypes were performed with one-way ANOVA. These statistical analyses
were done using the SPSS statistics software package (SPSS, Chicago, IL). All statistical
Page 13 of 23 Human Molecular Genetics
123456789101112131415161718192021222324252627282930313233343536373839404142434445464748495051525354555657585960
For Peer Review
14
tests were two-sided, and p<0.05 was considered significant.
Acknowledgements
We would like to express our gratitude to all the subjects who participated in the study.
This work was supported by research grants from the Hong Kong Research Grants Council
765407M and HKU 775907M and from The University of Hong Kong Seed Funding
200709159003 and 200611159028 to MGB and PT respectively. Support was also obtained
from The University of Hong Kong Genomics Strategic Research Theme.
Conflicts of Interest
There are no competing interests.
Page 14 of 23Human Molecular Genetics
123456789101112131415161718192021222324252627282930313233343536373839404142434445464748495051525354555657585960
For Peer Review
15
REFERENCES
1 Angrist, M., Kauffman, E., Slaugenhaupt, S.A., Matise, T.C., Puffenberger, E.G., Washington, S.S., Lipson, A., Cass, D.T., Reyna, T, Weeks, D.E., et al. (1993) A gene for Hirschsprung disease (megacolon) in the pericentromeric region of human chromosome 10. Nat. Genet., 4, 351-356. 2 Romeo, G., Ronchetto, P., Luo, Y., Barone, V., Seri, M., Ceccherini, I., Pasini, B., Bocciardi, R., Lerone, M., Kaariainen, H., et al. (1994) Point mutations affecting the tyrosine kinase domain of the RET proto-oncogene in Hirschsprung's disease. Nature, 367, 377-378. 3 Plaza-Menacho, I., Burzynski, G.M., de Groot, J.W., Eggen, B.J. and Hofstra, R.M. (2006) Current concepts in RET-related genetics, signaling and therapeutics. Trends Genet., 22, 627-636. 4 Edery, P., Lyonnet, S., Mulligan, L.M., Pelet, A., Dow, E., Abel, L., Holder, S., Nihoul-Fekete, C., Ponder, B.A. and Munnich, A. (1994) Mutations of the RET proto-oncogene in Hirschsprung's disease. Nature, 367, 378-380. 5 Attie, T., Pelet, A., Edery, P., Eng, C., Mulligan, L.M., Amiel, J., Boutrand, L., Beldjord, C., Nihoul-Fekete, C., Munnich, A., et al. (1995) Diversity of RET proto-oncogene mutations in familial and sporadic Hirschsprung disease. Hum. Mol.Genet., 4, 1381-1386. 6 Seri, M., Yin, L., Barone, V., Bolino, A., Celli, I., Bocciardi, R., Pasini, B., Ceccherini, I., Lerone, M., Kristoffersson, U., et al. (1997) Frequency of RET mutations in long- and short-segment Hirschsprung disease. Hum. Mutat., 9, 243-249. 7 Svensson, P.J., Molander, M.L., Eng C., Anvret, M. and Nordenskjold, A. (1998) Low frequency of RET mutations in Hirschsprung disease in Sweden. Clin. Genet., 54, 39-44. 8 Garcia-Barcelo, M., Sham, M.H., Lee, W.S., Lui, V.C., Chen, B.L., Wong, K.K., Wong, J.S. and Tam, P.K. (2004) Highly recurrent RET mutations and novel mutations in genes of the receptor tyrosine kinase and endothelin receptor B pathways in Chinese patients with sporadic Hirschsprung disease. Clin. Chem., 50, 93-100. 9 Tam, P.K. and Garcia-Barcelo, M. (2009) Genetic basis of Hirschsprung's disease. Pediatr. Surg. Int., 25, 543-558. 10 Brooks, A.S., Bertoli-Avella, A.M., Burzynski, G.M., Breedveld, G.J., Osinga, J., Boven, L.G., Hurst, J.A., Mancini, G.M., Lequin, M.H., de Coo, R.F. et al. (2005) Homozygous nonsense mutations in KIAA1279 are associated with malformations of the central and enteric nervous systems. Am. J. Hum. Genet., 77, 120-126. 11 Amiel, J., Sproat-Emison, E., Garcia-Barcelo, M., Lantieri, F., Burzynski, G., Borrego, S., Pelet, A., Arnold, S., Miao, X., Griseri, P., et al. (2008) Hirschsprung disease, associated syndromes and genetics: a review. J. Med. Genet., 45,1-14. 12 Garcia-Barcelo, M.M., Tang, C.S., Ngan, E.S., Lui, V.C., Chen, Y., So,M.T., Leon, T.Y., Miao, X.P., Shum, C.K., Liu, F.Q. et al. (2009) Genome-wide association study identifies NRG1 as a susceptibility locus for Hirschsprung's disease. Proc. Natl. Acad. Sci. USA., 106, 2694-2699. 13 Borrego, S., Ruiz, A., Saez, M.E., Gimm, O., Gao, X., Lopez-Alonso, M., Hernandez, A., Wright, F.A., Antinolo, G. and Eng, C. (2000) RET genotypes comprising specific haplotypes of polymorphic variants predispose to isolated Hirschsprung disease. J. Med.
Genet., 37, 572-578. 14 Griseri, P., Pesce, B., Patrone, G., Osinga, J., Puppo, F., Sancandi, M., Hofstra, R., Romeo, G., Ravazzolo, R., Devoto, M., et al. (2002) A rare haplotype of the RET proto-oncogene is a risk-modifying allele in hirschsprung disease. Am. J. Hum. Genet., 71, 969-974. 15 Sancandi, M., Griseri, P., Pesce, B., Patrone, G., Puppo, F., Lerone, M., Martucciello, G., Romeo, G., Ravazzolo, R., Devoto, M., et al. (2003) Single nucleotide polymorphic alleles in
Page 15 of 23 Human Molecular Genetics
123456789101112131415161718192021222324252627282930313233343536373839404142434445464748495051525354555657585960
For Peer Review
16
the 5' region of the RET proto-oncogene define a risk haplotype in Hirschsprung's disease. J.
Med. Genet., 40, 714-718. 16 Garcia-Barcelo, M.M., Sham, M.H., Lui, V.C., Chen, B.L., Song,Y.Q., Lee, W.S., Yung, S.K., Romeo, G. and Tam, P.K. (2003) Chinese patients with sporadic Hirschsprung's disease are predominantly represented by a single RET haplotype. J. Med. Genet., 40, e122. 17 Fitze, G., Cramer, J., Ziegler, A., Schierz, M., Schreiber, M., Kuhlisch, E., Roesner, D. and Schackert, H.K. (2002) Association between c135G/A genotype and RET proto-oncogene germline mutations and phenotype of Hirschsprung's disease. Lancet, 359, 1200-1205. 18 Griseri, P., Bachetti, T., Puppo, F., Lantieri, F., Ravazzolo, R., Devoto, M. and Ceccherini, I. (2005) A common haplotype at the 5' end of the RET proto-oncogene, overrepresented in Hirschsprung patients, is associated with reduced gene expression. Hum.
Mutat., 25, 189-195. 19 Garcia-Barcelo, M., Ganster, R.W., Lui, V.C., Leon, T.Y., So, M.T., Lau, A.M., Fu, M., Sham, M.H., Knight, J., Zannini, M.S., et al. (2005) TTF-1 and RET promoter SNPs: regulation of RET transcription in Hirschsprung's disease. Hum. Mol. Genet., 14, 191-204. 20 Fitze, G., Appelt, H., Konig, I.R., Gorgens, H., Stein, U., Walther, W., Gossen, M., Schreiber, M., Ziegler, A., Roesner, D., et al. (2003) Functional haplotypes of the RET proto-oncogene promoter are associated with Hirschsprung disease (HSCR). Hum. Mol.
Genet., 12, 3207-3214. 21 Burzynski, G.M., Nolte, IM., Bronda, A., Bos, K.K., Osinga, J., Plaza Menacho, I., Twigt, B., Maas, S., Brooks, A.S., Verheij, J.B., et al. (2005) Identifying candidate Hirschsprung disease-associated RET variants. Am. J. Hum. Genet., 76, 850-858. 22 Burzynski, G.M., Nolte, I.M., Osinga, J., Ceccherini, I., Twigt, B., Maas, S., Brooks, A., Verheij, J., Plaza Menacho, I., Buys, C.H., et al. (2004) Localizing a putative mutation as the major contributor to the development of sporadic Hirschsprung disease to the RET genomic sequence between the promoter region and exon 2. Eur. J. Hum. Genet., 12, 604-612. 23 Pelet, A., de Pontual, L., Clément-Ziza, M., Salomon, R., Mugnier, C., Matsuda, F., Lathrop, M., Munnich, A., Feingold, J., Lyonnet, S., et al. (2005) Homozygosity for a frequent and weakly penetrant predisposing allele at the RET locus in sporadic Hirschsprung disease. J. Med. Genet., 42, e18. 24 Fernandez, R.M., Boru, G, Peciña, A., Jones, K., López-Alonso, M., Antiñolo, G., Borrego, S. and Eng, C. (2005) Ancestral RET haplotype associated with Hirschsprung's disease shows linkage disequilibrium breakpoint at -1249. J. Med. Genet., 42, 322-327. 25 Emison, E.S., McCallion, A.S., Kashuk, C.S., Bush, R.T., Grice, E., Lin, S., Portnoy, M.E., Cutler, D.J., Green, E.D. and Chakravarti, A. (2005) A common sex-dependent mutation in a RET enhancer underlies Hirschsprung disease risk. Nature, 434, 857-863. 26 Heanue, T.A. and Pachnis, V. (2007) Enteric nervous system development and Hirschsprung's disease: advances in genetic and stem cell studies. Nat. Rev. Neurosci., 8, 466-479. 27 Uesaka, T., Nagashimada, M., Yonemura, S. and Enomoto, H. (2008) Diminished Ret expression compromises neuronal survival in the colon and causes intestinal aganglionosis in mice. J. Clin. Invest., 118, 1890-1898. 28 Miao, X., Garcia-Barcelo, M.M., So, M.T., Leon, T.Y., Lau, D.K., Liu, T.T., Chan, E.K., Lan, L.C., Wong, K.K., Lui, V.C., et al. (2007) Role of RET and PHOX2B gene polymorphisms in risk of Hirschsprung's disease in Chinese population. Gut, 56, 736. 29 Veiga-Fernandes, H., Coles, M.C., Foster, K.E., Patel, A., Williams, A., Natarajan, D., Barlow, A., Pachnis, V. and Kioussis, D. (2007) Tyrosine kinase receptor RET is a key regulator of Peyer's patch organogenesis. Nature, 446, 547-551. 30 Stephens, M. and Donnelly, P. (2003) A comparison of bayesian methods for haplotype
Page 16 of 23Human Molecular Genetics
123456789101112131415161718192021222324252627282930313233343536373839404142434445464748495051525354555657585960
For Peer Review
17
reconstruction from population genotype data. Am. J. Hum. Genet., 73, 1162-1169. 31 Stephens, M., Smith, N.J. and Donnelly, P. (2001) A new statistical method for haplotype reconstruction from population data. Am. J. Hum. Genet., 68, 978-989. 32 Barrett, J.C., Fry, B., Maller, J. and Daly, M.J. (2005) Haploview: analysis and visualization of LD and haplotype maps. Bioinformatics, 21, 263-265.
Page 17 of 23 Human Molecular Genetics
123456789101112131415161718192021222324252627282930313233343536373839404142434445464748495051525354555657585960
For Peer Review
18
FIGURE LEGEND
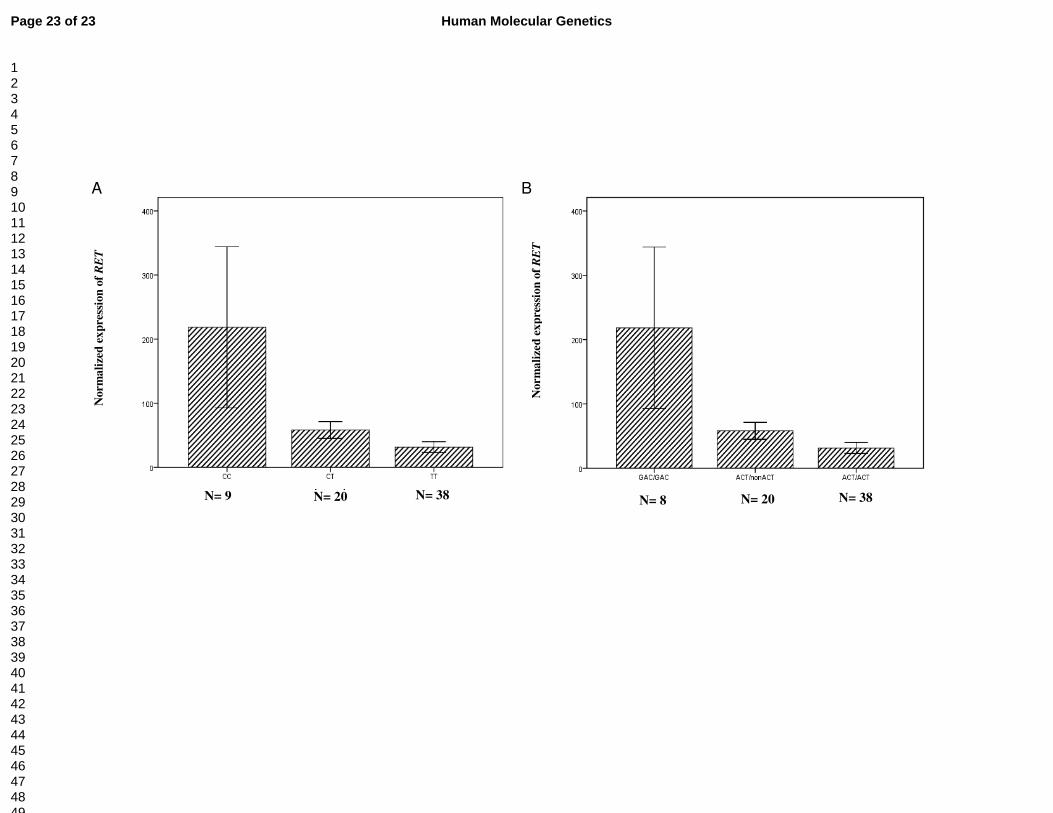
Figure 1. Associations between genetic variants in the regulatory region and normalized RET expression in the colon tissues from the normal portions of HSCR patients and non-HSCR patients. (Y axis represented the RET expression relative to PGP9.5) (A) Significant difference of normalized RET expression were observed among CC, CT and TT genotypes of intron 1 polymorphism (P =0.012, one-way ANOVA). (B) Significant difference of normalized RET expression were observed among different diplotypes ((-5G>A; -1A>C; intron 1C>T) of RET variants (P =0.018, one-way ANOVA). Graphs represent mean ± SE.
Page 18 of 23Human Molecular Genetics
123456789101112131415161718192021222324252627282930313233343536373839404142434445464748495051525354555657585960
For Peer Review
19
Table 1: Genotype distribution of the RET gene polymorphisms (percentage of individuals in brackets)
Polymorphism Genotypes Patients n = 315 Controls n = 325 X2 (Yates correction); P
-5G>A a GG 17 (5.4) 81 (24.9) reference
GA 72 (22.9) 163 (50.2) 5.58; 0.018
AA 226 (71.7) 81 (24.9) 95.67; <<0.0001
Deviation from Hardy-Weinberg equilibrium P = 0.0011 P = 0.95
-1A>C b AA 9 (2.9) 41 (12.6) reference
AC 45 (14.3) 149 (45.8) 0.36; 0.549
CC 261 (82.9) 135 (41.5) 40.67; <<0.0001
Deviation from Hardy-Weinberg equilibrium P = 0.0003 P = 0.99
Intron 1 C>T c CC 22 (7.0) 95 (29.2) reference
CT 65 (20.6) 169 (52.0) 2.91; 0.088
TT 228 (72.4) 62 (19.1) 123.38; <<0.0001
Deviation from Hardy-Weinberg equilibrium P = 0.0000007 P = 0.39
a p=5.94x10⁻³¹, Cochran-Armitage test b p=3.12 x10⁻²⁴, Cochran-Armitage test c p=5.94x10-37, Cochran-Armitage test
Page 19 of 23 Human Molecular Genetics
123456789101112131415161718192021222324252627282930313233343536373839404142434445464748495051525354555657585960
For Peer Review
20
Table 2: Frequencies and counts of RET haplotypes and diplotypes comprising -5G>A, -1A>C and intron1 C>T
Haplotypes Patients (630 chromosomes) Controls (650 chromosomes) χ2 (Yates correction); P
(-5; -1; intron 1) % counts % counts
G-A-C 9.8 62 34.9 227 reference
G-C-C 7.0 44 17.1 111 0.70; 0.40
A-C-C 1.4 9 2.6 17 1.67; 0.19
A-C-T 81.8 515 34.9 285 155.29; <<0.0001
Diplotypes Patients (315 subjects) Controls (325 subjects)
G-A-C/G-A-C a 2.9 9 12.0 39 reference
G-A-C/others a 2.2 7 14.8 48 0.32; 0.57
G-A-C/ A-C-T a 11.7 37 31.1 101 0.85; 0.36
others/ A-C-T a 10.8 34 19.7 64 3.21; 0.07
A-C-T / A-C-T a 70.5 222 18.5 60 67.43; <<0.0001
others b/others b 1.9 6 4.0 13 0.66; 0.42
a p <<0.0001, Cochran-Armitage test b represented nor G-A-C or A-C-T haplotypes
Page 20 of 23Human Molecular Genetics
123456789101112131415161718192021222324252627282930313233343536373839404142434445464748495051525354555657585960
For Peer Review
21
Figure1
No
rma
lized ex
pressio
n o
f RE
T
No
rma
lized ex
pressio
n o
f RE
T
A B
N= 8 N= 20 N= 38 N= 9 N= 20 N= 38
Page 21 of 23 Human Molecular Genetics
123456789101112131415161718192021222324252627282930313233343536373839404142434445464748495051525354555657585960
For Peer Review
22
Abbreviations
HSCR: Hirschsprung’s disease; SNP: single nucleotide polymorphism; RET: receptor tyrosine kinase; NCC: neural crest cell; ENS: enteric
nervous system
Page 22 of 23Human Molecular Genetics
123456789101112131415161718192021222324252627282930313233343536373839404142434445464748495051525354555657585960