Appendix 4E Year Ended 1 July 2018 Lodged with the ASX under Listing Rule 4.3A 17 August 2018 The following information should be read in conjunction with the attached Annual Report. 1. DETAILS OF REPORTING PERIODS: The current reporting period is the 12 months to 1 July 2018. The previous corresponding reporting period was for the 12 months to 30 June 2017. It was determined appropriate to move to a 4-4-5 week based calendar in line with the group’s weekly reporting calendar. The consolidated statement of profit or loss and other comprehensive income and consolidated statement of financial position relates to Ashley Services Group Limited (“ASH” and its controlled entities). 2. RESULTS FOR ANNOUNCEMENT TO THE MARKET: Results: Change % Change Amount $’000 Revenue from ordinary activities Up 5.8% To 332,803 Profit / (Loss) from ordinary activities after tax attributable to members Up >100% To 4,789 Profit / (Loss) for the year attributable to members Up >100% To 4,789 Refer to Chairman and Managing Director’s review in the Annual Report and separate results presentation for commentary on the results. For personal use only
Transcript
Appendix 4E
Year Ended 1 July 2018
Lodged with the ASX under Listing Rule 4.3A
17 August 2018
The following information should be read in conjunction with the attached Annual Report.
1. DETAILS OF REPORTING PERIODS: The current reporting period is the 12 months to 1 July 2018. The previous corresponding reporting period was for the 12 months to 30 June 2017. It was determined appropriate to move to a 4-4-5 week based calendar in line with the group’s weekly reporting calendar. The consolidated statement of profit or loss and other comprehensive income and consolidated statement of financial position relates to Ashley Services Group Limited (“ASH” and its controlled entities).
2. RESULTS FOR ANNOUNCEMENT TO THE MARKET:
Results:
Change % Change Amount $’000
Revenue from ordinary activities Up 5.8% To 332,803 Profit / (Loss) from ordinary activities after tax attributable to members Up >100% To 4,789
Profit / (Loss) for the year attributable to members Up >100% To 4,789
Refer to Chairman and Managing Director’s review in the Annual Report and separate results presentation for commentary on the results.
FY18 was a settling year for Ashley Services Group, representing our first full “business as usual” year following the significant adjustments which had materially negative impacts on both our FY16 and FY17 results. It also represents the first full year following our announced strategic repositioning back in March 2017 as a Labour Hire company with a smaller and more focused, complementary Training division.
With that in mind, our return to a full year profit in FY18, following on from a profitable second half in FY17, in many ways validates that strategic decision we reached back in mid FY17.
Our Labour Hire division has continued leading the way, delivering a pleasing lift in profit on the back of a solid lift in revenue, led by Concept Engineering. This revenue increase, an increasing Concept mix, as well as the leveraging of our overheads across all labour hire brands during this growth, has resulted in an improved level of profitability being delivered by our labour hire division.
In relation to the all-important area of Safety, I am delighted to report further improvement on what was already an impressive result, with our Lost Time Injury Frequency Rate (LTIFR) reducing further to 0.39, down from 0.42 last year. That truly is world’s best practice and something we are extremely proud of, and which is a direct consequence of our strenuous on-boarding programmes, closely partnering with our customers, and also an absolute commitment to continued innovation across our Workplace Health & Safety programmes.
Corporate costs are now down to $3.8 million, which represents an impressive year on year reduction of $1.2 million or 23%. Over the past two years we have managed to deliver a $1.9 million or 33% reduction in corporate costs (FY16: $5.7 million). We remain focused on this area and will continue to deliver on every opportunity to reduce these overheads further in the future.
Operating cash flow (from continuing operations) performed well in the second half, recovering from a $2.8 million outflow at the half, due to peak period seasonality, to end at an overall $3.2 million inflow for the year, so a strong inflow of $6.0 million across the second half. This is all despite the fact that we brought forward employee entitlement payments totaling $3.7 million to take advantage of tax planning opportunities. Without this we would have seen an overall operating cash inflow of $6.9 million for the year.
This strong cash flow performance has seen us again close the year with zero debt, a solid cash balance and a robust balance sheet which has us well positioned to take advantage of growth opportunities which may present themselves. I am particularly pleased we were able to return to the payment of dividends after an almost three-year hiatus during what was a challenging period for our organization.
For
per
sona
l use
onl
y
Chairman and Managing Director’s Review
ASHLEY SERVICES GROUP ANNUAL REPORT 2018 4
We are very proud of our organization and of our 220 strong committed internal team members, our many thousands of on-hired employees and students, and our highly valued customers, all who have all played an important role in what has been a significant turnaround of the Ashley Services Group business.
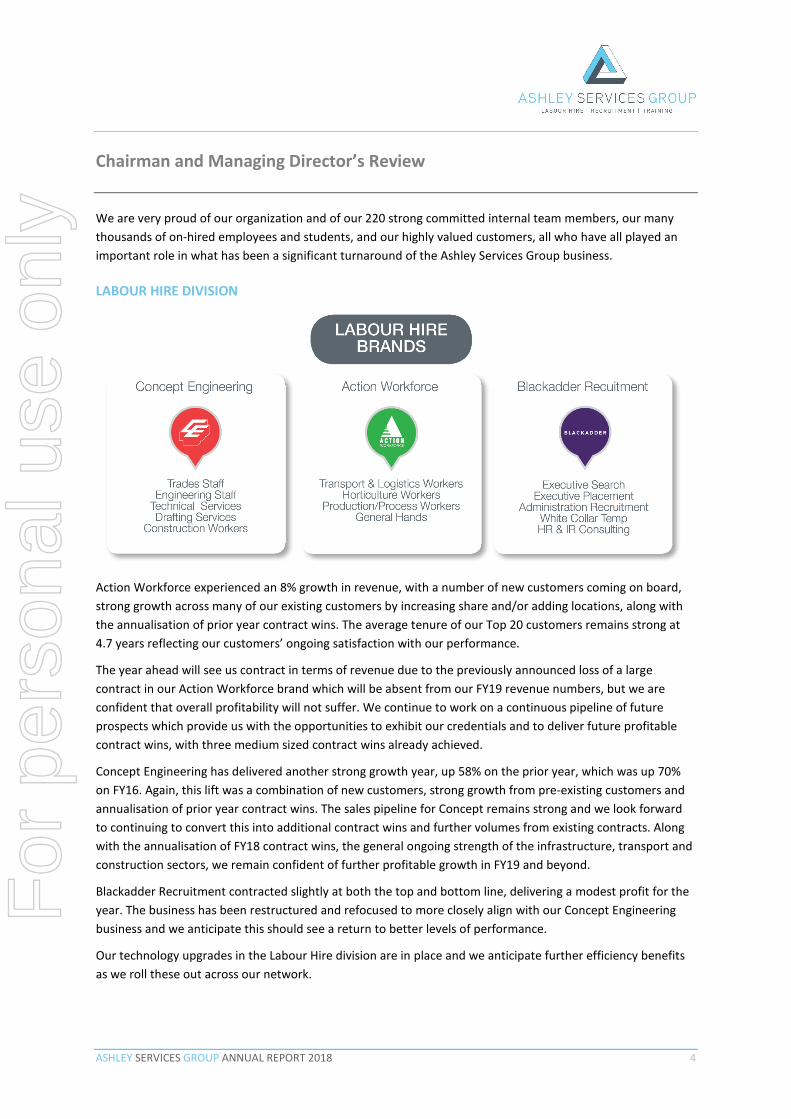
LABOUR HIRE DIVISION
Action Workforce experienced an 8% growth in revenue, with a number of new customers coming on board, strong growth across many of our existing customers by increasing share and/or adding locations, along with the annualisation of prior year contract wins. The average tenure of our Top 20 customers remains strong at 4.7 years reflecting our customers’ ongoing satisfaction with our performance.
The year ahead will see us contract in terms of revenue due to the previously announced loss of a large contract in our Action Workforce brand which will be absent from our FY19 revenue numbers, but we are confident that overall profitability will not suffer. We continue to work on a continuous pipeline of future prospects which provide us with the opportunities to exhibit our credentials and to deliver future profitable contract wins, with three medium sized contract wins already achieved.
Concept Engineering has delivered another strong growth year, up 58% on the prior year, which was up 70% on FY16. Again, this lift was a combination of new customers, strong growth from pre-existing customers and annualisation of prior year contract wins. The sales pipeline for Concept remains strong and we look forward to continuing to convert this into additional contract wins and further volumes from existing contracts. Along with the annualisation of FY18 contract wins, the general ongoing strength of the infrastructure, transport and construction sectors, we remain confident of further profitable growth in FY19 and beyond.
Blackadder Recruitment contracted slightly at both the top and bottom line, delivering a modest profit for the year. The business has been restructured and refocused to more closely align with our Concept Engineering business and we anticipate this should see a return to better levels of performance.
Our technology upgrades in the Labour Hire division are in place and we anticipate further efficiency benefits as we roll these out across our network.
For
per
sona
l use
onl
y
Chairman and Managing Director’s Review
ASHLEY SERVICES GROUP ANNUAL REPORT 2018 5
TRAINING DIVISION
During FY17 our Training division was downsized as we exited New South Wales, International and much of the Integracom business. We closed FY17 with meaningful training operations in both Western Australia and Queensland, with our Victorian operations maintained pending the outcome of the awarding of the 2018-19 funding contracts.
Our Training division emerged from FY18 with a strong Western Australian operation, far improved operations in Queensland, and a strong, highly performing compliance function. Both Western Australia and Queensland delivered pleasing full year profit results and are well positioned for better performances in the year ahead.
Overall, the Training division in FY18 delivered a breakeven result, on revenues of $6.7 million, obviously well down on the FY17 revenue level of $25.5 million, which included both the pre-restructuring level of training activity and also the progressive wind down of various operations throughout the second half of FY17.
The chief challenge during the FY18 year for the Training division has been our Victorian operation, which we traded through the first half of FY18 on both a funding train out and a fee for service basis, pending the outcome on the awarding of the 2018-19 funding contracts. This was always going to be a challenging scenario, but we recognised the absolute sense in maintaining our Victorian operations given Victoria had traditionally been the strongest performing region in our Training division and we also recognised the potential for it to again deliver solid revenue streams and material bottom line profitability.
As mentioned previously, we were successful in being awarded a modest contract for our Victorian operations as part of the 2018-19 Standard VET Funding Contract – Skills First Programme. We have started to deliver the results we require and remain committed to our Victorian Training operations.
We look forward to delivering on this turnaround of our Victorian operations to deliver a business which will then sit alongside our strongly performing operations in both Western Australia and Queensland, as part of a Training division which in future years we are hopeful will make a meaningful contribution to the overall Group result.
As always, we will continue to ensure a culture of compliance sits above everything we do in our Training division, to make certain our processes and practices protect our position in the industry as a highly trusted, quality training partner for our customers, students, and also for the relevant government authorities who control many aspects of the training sector and its associated government funding schemes.
For
per
sona
l use
onl
y
Chairman and Managing Director’s Review
ASHLEY SERVICES GROUP ANNUAL REPORT 2018 6
DISCUSSION ON RESULTS
Earnings and result
Earnings
Net profit after tax (“NPAT”) for the financial year of the Group was a profit of $4.8 million, which represented a significant turnaround of $10.8 million on the prior corresponding period (2017: $6.0 million loss).
The prior year loss included a $0.5m loss from discontinued operations and a $10.7 million net expense before tax for various significant items including impairment of intangible assets ($5.5m), impairment of PP&E ($3.5m), Training division refunds from prior periods relating mainly to Victorian rectification activity ($1.4m), Training division restructuring expenses ($0.7m) and Settlement of ongoing performance monitoring matters with the NSW Department ($0.7m), partially offset by a $1.1 million profit arising from the cancellation of shares issued on acquisition.
Revenues
Revenue from continuing operations at $332.8 million grew by $18.1 million (6%) from the prior period.
Labour hire revenues increased by $36.9 million (13%) to $326.1 million, with 58% growth in the Concept Engineering brand adding to a strong lift of 8% for Action Workforce.
Training revenues decreased $18.8 million (-74%) to $6.7 million with declines across all locations but most significantly in Victoria and NSW with the conclusion of their funding contracts in early Q3 FY17.
Earnings before interest taxes depreciation and amortisation (“EBITDA”)
Statutory EBITDA was a profit of $8.0 million, which again represented a significant turnaround of $13.0 million on the prior corresponding period (2017: loss of $5.0 million).
The prior year result includes the various adjustments outlined above and again in the table below. Excluding these adjustments, underlying EBITDA for the prior period was a $5.7 million profit.
FY18 $million
FY17 $million
Statutory EBITDA1 8.0 (5.0)
Impairment of Intangible assets/other assets - 9.0
Restructuring expense - 0.7
Cancellation of Shares issued on acquisition - (1.1)
Training division refunds from prior periods relating mainly to Victorian rectification activity
-
1.4
NSW Department finalisation costs - 0.7
Net underlying adjustments - 10.7
Underlying EBITDA 8.0 5.7 NOTES:
1. EBITDA is a non IFRS measure used internally by management to assess the performance of the business. It has been derived from the IFRS figures in the financial report.
EBITDA for the current period was a $8.0 million profit (FY17: underlying EBITDA of $5.7 million) comprising:
a. Labour hire. EBITDA of $11.8 million was $4.0 million (51%) above the prior period (FY17: $7.8 million profit) on the back of a revenue lift of 13% (FY18 $326.1m v FY17 $289.2m) with an 8% lift for Action Workforce and a significant 58% lift in revenue for the Concept Engineering brand.
For
per
sona
l use
onl
y
Chairman and Managing Director’s Review
ASHLEY SERVICES GROUP ANNUAL REPORT 2018 7
b. Training. EBITDA of $0.0 million (FY17: $2.9 million underlying EBITDA profit), a continuation of the 2H17 breakeven result following the scaling back of the Training division.
c. Corporate costs for FY18 at $3.8 million saw a significant full year reduction of $1.2m or 23% (FY17 $5.0m) with significant reductions across almost all major expense categories.
Statement of financial position
The Group balance sheet has strengthened overall by $4.8 million, in line with the year’s net profit after tax, with net assets at $24.8 million (30 June 2017: $20.0 million). Net tangible assets at end 1 July 2018 represent $21.7m or 15.0c per share (30 June 2017: $16.7m or 11.6c per share).
As at 1 July 2018, the Group had a $5 million working capital facility through Shrimpton Holdings Pty Limited, a company associated with Ross Shrimpton, Managing Director, and with shareholders of the Group. Shrimpton Holdings Pty Limited has fixed and floating charges over the Group’s assets, subject to conditions outlined by a separate agreement between Ashley Services Group Limited and Shrimpton Holdings Pty Limited and in line with the conditions outlined in the ASX Listing Rule Waiver as subsequently revised on 6 August 2018, following the extension of the Facility Agreement out until 31 January 2020.
As at 1 July 2018, the working capital facility was undrawn (30 June 2017, Nil).
Cash Flow
Operating cash flow (from continuing operations) recovered well in the second half, recovering from a $2.8 million outflow at the half due to peak period seasonality, to end at an overall $3.2 million inflow for the year, so a strong inflow of $6.0 million across the second half. This is all despite the fact that we brought forward employee entitlement payments totalling $3.7 million to take advantage of tax planning opportunities. Without this we would have seen an overall operating cash inflow of $6.9 million for the year.
Capital expenditure at $0.6 million was at a similar level to the prior year, offset by a $0.2 million inflow resulting from the sale of the some surplus assets. Outflow from financing activities of $0.7 million was the result of repaying a loan to Shrimpton Holdings which previously covered the company’s property related bank guarantees.
Overall this delivered a net cash inflow for FY18 of $2.0 million.
DIVIDEND
On 26 July 2018 the Group declared a fully franked final dividend of 2.5 cents in relation to the financial year ended 1 July 2018. This represents the first dividend for three years with the last being a final dividend for FY15.
EVENTS SUBSEQUENT TO BALANCE DATE
Subsequent to year end, the Company on 6 August 2018 extended its $5 million working capital facility through Shrimpton Holdings Pty Limited, a company associated with Ross Shrimpton, Managing Director, and with shareholders of the Group, from 29 October 2018 out until 31 January 2020.
Ian Pratt Ross Shrimpton Chairman Managing Director
For
per
sona
l use
onl
y
Directors’ Report
ASHLEY SERVICES GROUP ANNUAL REPORT 2018 8
The Directors present their annual financial report on the consolidated entity, being Ashley Services Group Limited and its controlled entities (“Group”) for the financial year ended 1 July 2018.
1. GENERAL INFORMATION
a. Directors The names of the Directors in office at any time during, or since the end of the year are:
Table 1: Director Details
Names Appointed / Resigned Mr Ian Pratt Chairman Appointed 1 October 2015 Mr Ross Shrimpton Managing
Director Appointed 12 Oct 2000; Managing Director to 15 Feb 2016, Non-Executive Director 15 Feb 2016 to 23 Jan 2017 and Managing Director from 23 Jan 2017
Mr Chris McFadden Executive Director Appointed 6 April 2017
Directors’ Information
• Mr Ian Pratt | Non-Executive Chairman (since 1 October 2015)
Qualifications | CA Experience | Ian has over 40 years’ experience in the accounting profession and is a Director of a number of Public and Private companies. During this time, he has been involved in the recruitment, finance and property industries, and advises on income tax and related matters. Currently Ian is a Partner at Trood Pratt & Co Chartered Accountants and is a Director of Charter Hall Direct Property Management Limited (formerly Macquarie Direct Property Management Limited). Mr Pratt is a Member of Chartered Accountants Australia and New Zealand. Ian is Chairman of the Nominations, Audit & Risk Management and Remuneration Committees.
• Mr Ross Shrimpton | Managing Director (since 23 January 2017) (previously Non-Executive Director from 15 February 2016 and Managing Director to 15 February 2016)
Qualifications | BComm (UNSW), CA, MAICD Experience | Ross is the founder and Managing Director of Ashley Services Group and has been instrumental in the overall growth and strategic direction of Ashley Services. Ross has over 40 years’ experience in finance and management across a number of large international organisations such as CSR/Humes and David Brown, originally commencing his professional career with Deloitte Touche Tohmatsu. Overall, Ross has over 20 years of relevant experience in the labour hire and training industries. Ross is a Member of Chartered Accountants Australia and New Zealand and a member of the Australian Institute of Company Directors. Ross is a member of the Nominations, Audit & Risk Management and Remuneration Committees.
• Mr Chris McFadden | Executive Director (from 6 April 2017)
Qualifications | BBus (UTS), FCPA, GAICD Experience | Chris was appointed Chief Financial Officer of Ashley Services Group in January 2017 and was appointed Executive Director in April 2017. Chris was formerly CFO at Ross Human Directions Limited (ASX: RHD), a company principally involved in the provision of temporary labour and recruitment services. Most recently Chris was CFO of Australian fashion brand, sass & bide, a division of Myer. Chris’s previous roles include: CFO of Staples Australia, Senior Commercial Manager at Woolworths Limited and Asia Pacific CFO of The Nuance Group. Chris is a Fellow of CPA Australia and a Graduate of the Australian Institute of Company Directors. Chris is a member of the Nominations, Audit & Risk Management and Remuneration Committees.
For
per
sona
l use
onl
y
Directors’ Report
ASHLEY SERVICES GROUP ANNUAL REPORT 2018 9
Interests in shares and options
As at the date of this report, the interests of the directors in the shares of Ashley Services Group Limited were:
Table 2: Shares Held by Directors
Names • Number
of Shares Held Shareholding • %
Mr Ian Pratt 15,060 0.01
Mr Ross Shrimpton1 80,279,030 55.76
Mr Chris McFadden 76,623 0.05
Note: 1. Ross Shrimpton’s shareholding was reorganised on 30 May 2018 which resulted in a reduction of his shareholding from 86,046,305
(59.76%) ASH shares to 80,279,030 (55.76%). The reduction of 5,767,275 (4.0%) ASH shares relates to shares which are no longer held as a relevant interest of Ross Shrimpton and are presently retained by non-controlled associated family members.
Directorships of other listed companies
Directorships held in other listed companies by the Directors in the three years immediately before the end of the financial year are as follows:
Table 3: Other Directorships of listed entities
Name Company Date from Date to
Mr Ian Pratt Nil - -
Mr Ross Shrimpton Nil - -
Mr Chris McFadden Nil - -
Principal activities
The principal activities of the Group during the financial year were the provision of labour hire (including recruitment) and training services.
Company secretary
Mr Ron Hollands held the position of Company Secretary for the entire financial year.
Ron is a qualified Chartered Accountant and holds a Bachelor of Business from University of Technology, Sydney, an MBA from MGSM and a Graduate Diploma of Applied Corporate Governance from the Governance Institute of Australia.
Ron has over 25 years’ experience in a range of industries including professional practice, financial services and real estate.
For
per
sona
l use
onl
y
Directors’ Report
ASHLEY SERVICES GROUP ANNUAL REPORT 2018 10
Directors’ meetings
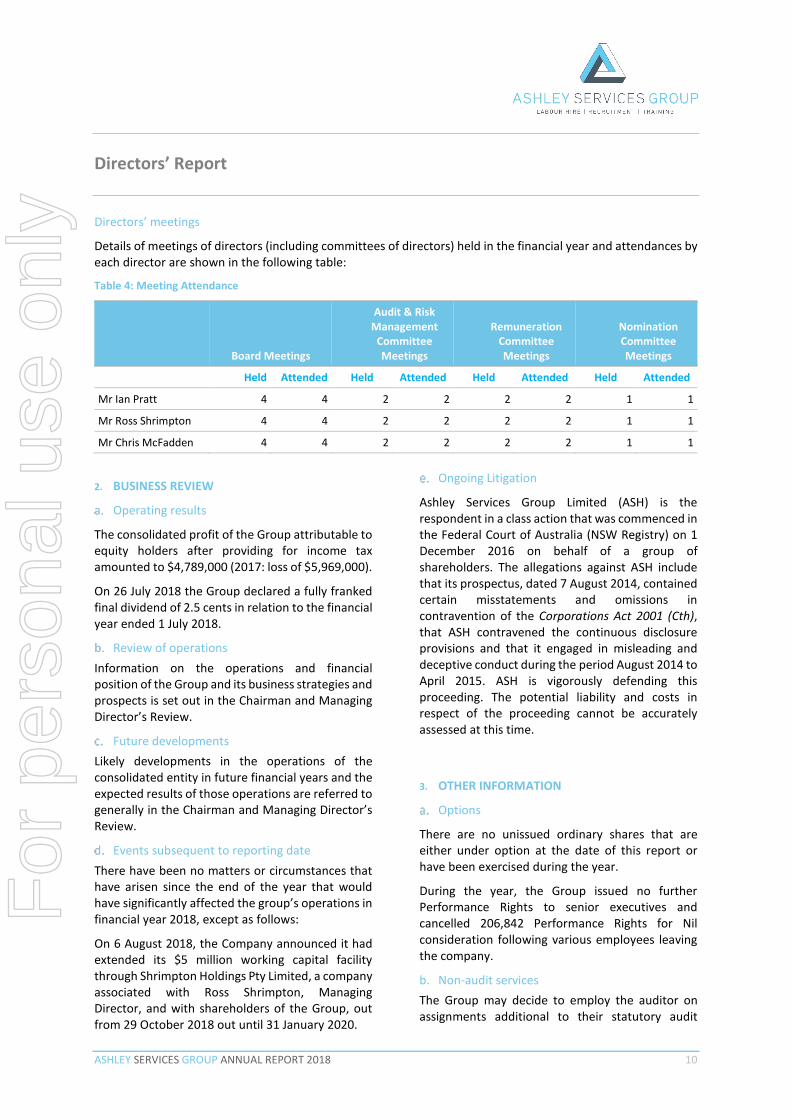
Details of meetings of directors (including committees of directors) held in the financial year and attendances by each director are shown in the following table:
Table 4: Meeting Attendance
Board Meetings
Audit & Risk Management
Committee Meetings
Remuneration Committee Meetings
Nomination Committee Meetings
Held Attended Held Attended Held Attended Held Attended
Mr Ian Pratt 4 4 2 2 2 2 1 1
Mr Ross Shrimpton 4 4 2 2 2 2 1 1
Mr Chris McFadden 4 4 2 2 2 2 1 1
2. BUSINESS REVIEW
Operating results
The consolidated profit of the Group attributable to equity holders after providing for income tax amounted to $4,789,000 (2017: loss of $5,969,000).
On 26 July 2018 the Group declared a fully franked final dividend of 2.5 cents in relation to the financial year ended 1 July 2018.
Review of operations Information on the operations and financial position of the Group and its business strategies and prospects is set out in the Chairman and Managing Director’s Review.
Future developments Likely developments in the operations of the consolidated entity in future financial years and the expected results of those operations are referred to generally in the Chairman and Managing Director’s Review.
Events subsequent to reporting date There have been no matters or circumstances that have arisen since the end of the year that would have significantly affected the group’s operations in financial year 2018, except as follows:
On 6 August 2018, the Company announced it had extended its $5 million working capital facility through Shrimpton Holdings Pty Limited, a company associated with Ross Shrimpton, Managing Director, and with shareholders of the Group, out from 29 October 2018 out until 31 January 2020.
Ongoing Litigation
Ashley Services Group Limited (ASH) is the respondent in a class action that was commenced in the Federal Court of Australia (NSW Registry) on 1 December 2016 on behalf of a group of shareholders. The allegations against ASH include that its prospectus, dated 7 August 2014, contained certain misstatements and omissions in contravention of the Corporations Act 2001 (Cth), that ASH contravened the continuous disclosure provisions and that it engaged in misleading and deceptive conduct during the period August 2014 to April 2015. ASH is vigorously defending this proceeding. The potential liability and costs in respect of the proceeding cannot be accurately assessed at this time.
3. OTHER INFORMATION
Options
There are no unissued ordinary shares that are either under option at the date of this report or have been exercised during the year.
During the year, the Group issued no further Performance Rights to senior executives and cancelled 206,842 Performance Rights for Nil consideration following various employees leaving the company.
b. Non-audit services The Group may decide to employ the auditor on assignments additional to their statutory audit
For
per
sona
l use
onl
y
Directors’ Report
ASHLEY SERVICES GROUP ANNUAL REPORT 2018 11
duties where the auditor’s expertise and experience with the Group are important.
The current auditor, HLB Mann Judd, did not provide any non-audit services during the year ended 1 July 2018.
Details of the amounts paid to either the previous or current auditors (Grant Thornton and HLB Mann Judd respectively) for audit services provided during the year are outlined in Note 4 to the financial statements.
c. Auditor’s independence declaration A copy of the auditor’s independence declaration as required under section 307c of the Corporations Act 2001 is set out on page 23 and forms part of this report.
d. Environmental issues The Group’s operations are not regulated by any significant environmental regulation under a law of the Commonwealth or of a state or territory.
e. Indemnifying officers or auditors Insurance of officers During the financial year, Ashley Services Group Limited paid a premium to insure the directors, secretaries and officers of the Group and its Australian entities.
The insurance policies prohibit disclosure of the premiums payable under the policies and details of the insured liabilities.
f. Proceedings on behalf of the Company No person has applied to the Court under section 237 of the Corporations Act 2001 for leave to bring proceedings on behalf of the Group, or to intervene in any proceedings to which the Group is a party, for the purpose of taking responsibility on behalf of the Group for all or part of those proceedings.
g. Rounding off of amounts In accordance with ASIC Corporations (Rounding in Financial / Directors’ Reports) Instrument 2016/191, amounts in the financial report are rounded off to the nearest thousand dollars unless otherwise indicated.
4. REMUNERATION REPORT – AUDITED
The directors of Ashley Services Group Limited present the remuneration report for Non-Executive Directors, Executive Directors and other key management personnel, prepared in accordance with the Corporations Act 2001 and the Corporations Regulations 2001.
The remuneration report is set out in the following main headings: • key management personnel; • principles used to determine the nature and
amount of remuneration; • Non-Executive Director remuneration; • details of remuneration; • executive service agreements; • share-based compensation; and • additional information.
a. Key management personnel The following persons acted as Directors of the Group or as key management personnel during the financial year: Executive Directors: • Ross Shrimpton • Chris McFadden Non-Executive Directors: • Ian Pratt Other key management personnel: • Paul Rixon (General Manager, Labour Hire) • Marc Shrimpton (General Manager Blackadder
Recruitment, resigned 7 July 2017) Key management personnel include both the Directors and other key management personnel named above.
b. Principles used to determine the nature and amount of remuneration
The objective of the Group’s executive reward framework is to ensure that reward for performance is competitive and appropriate for the results delivered. The framework seeks to align executive reward with achievement of strategic objectives and the creation of value for shareholders.
For
per
sona
l use
onl
y
Directors’ Report
ASHLEY SERVICES GROUP ANNUAL REPORT 2018 12
The Board seeks to ensure that executive reward satisfies the following key criteria for good reward governance practices: • competitiveness and reasonableness; • acceptability to shareholders; • performance linkage / alignment of executive
compensation; • transparency; and • capital management.
Alignment of shareholders’ interest • focuses on sustained growth in shareholder
wealth, consisting of dividends and growth in share price, and delivering a return on assets as well as focusing the executive on key non-financial drivers of value; and
• attracts and retains high-calibre executives.
Alignment to program participants’ interests • rewards capability and experience; • provides a clear structure for earning rewards;
and • provides recognition for contribution to the
business.
The framework provides a mix of fixed and variable pay, and a blend of short and long-term incentives,
albeit the LTI scheme has been temporarily suspended for the financial years 2017 and 2018.
The Board has established a Remuneration Committee which provides advice on remuneration and incentive policies and practices and specific recommendations on remuneration packages and other terms of employment for executives and Directors. The Corporate Governance Statement provides further information on the role of this committee.
Executive pay The executive pay and reward framework has three components: • base pay and benefits, including
in cash; and • long-term incentives provided through
participation in the Ashley Services Group Performance Rights Share Plan, albeit the LTI scheme has been temporarily suspended for the financial years 2017 and 2018.
The combination of these comprises the executive’s total remuneration.
For
per
sona
l use
onl
y
Directors’ Report
ASHLEY SERVICES GROUP ANNUAL REPORT 2018 13
Table 5: Key components of senior executive remuneration framework in place during the year ended 30 June 2018.
Remuneration Elements
Fixed Remuneration/Base Pay Short Term Incentive (STI) Long Term Incentive (LTI)
• Base pay is determined by reference to appropriate benchmark information, taking into account an individual’s responsibilities, performance, qualifications and experience, the broad objective being to pitch fixed remuneration at median market levels.
• ‘At risk’ award opportunity for the achievement of annual performance objectives linked to annual financial targets and non-financial goals set by individual.
• In light of the loss for financial years ended 30 June 2016 and 2017 and the reduced share price, the Board and the Remuneration Committee have temporarily suspended the LTI scheme for the financial years 2017 and 2018. Accordingly there was no award of performance rights to senior executives in relation to the year ended 2018.
• Base pay is structured as a package, which may be delivered as a mix of cash and other benefits, such as the provision of a motor vehicle, at the executive’s discretion.
• Financial targets in line with budgets set for the individual’s area of influence for the financial year, coupled with non-financial key performance measures.
• There are no guaranteed base pay increases in any executives’ employment contracts.
• Paid in cash within 30 days of finalisation of Audited Annual Report.
Table 6: Key features of the senior executive STI plan for FY18
Overview of the senior executive STI plan
Who participates in the Senior Executive STI plan?
Senior executives participate in the senior executive STI plan.
How much can executives earn?
STI opportunity for senior executives ranges from zero to 100% of target STI for significant out-performance.
Thresholds and performance conditions Is there a threshold level of performance required?
Yes. There are threshold levels for EBITDA that must be met to receive an STI payment. Achievement of the thresholds does not automatically entitle executives to an STI award. Financial performance measures must also be met to earn an STI payment.
What are the performance conditions?
Measures Senior Executives
Financial measures (80% of STI opportunity) Non-Financial measures (20% of STI opportunity)
Assessed against: • Budget EBITDA for the individual’s area of influence
for the financial year. • 20% payable for achievement of 90% of budget.
Remaining 80% payable on a straight-line pro rata basis for performance from 90% to 130% of budget.
• Individually set Key Performance Indicators.
For
per
sona
l use
onl
y
Directors’ Report
ASHLEY SERVICES GROUP ANNUAL REPORT 2018 14
Table 7: Key features of the senior executive FY16 LTI plan Note that LTI plan has been suspended for both FY17 and FY18
Overview of the LTI plan for FY16
Who participates in the Senior Executive LTI?
Senior executives, including the MD, participate in the senior executive LTI plan.
What was awarded under the LTI plan in FY16?
On 25 September 2015 senior executives received an LTI award of 1,561,688 performance rights, the vesting of which is subject to the performance condition outlined below. The number of rights awarded was calculated by dividing the remuneration value of the award by the volume weighted average price of ASH shares for the 5 day trading period prior to the approval to grant their award.
Performance conditions
What are the performance conditions?
Senior executive LTI awards are earned only upon achievement of the following performance hurdles:
• Earnings Per Share growth (EPS): 50% of the LTI grant • Total Shareholder Return (TSR): 50% of the LTI grant
Over what period is performance measured?
The Board has determined that the FY16 LTI plan will be subject to the performance condition over a three year period, commencing 1 July 2015.
How are the performance conditions assessed? Performance condition 1) EPS
Absolute EPS performance condition - measured as the compound annual underlying EPS growth over the 3 year performance period. The EPS target is:
EPS EPS Target
Actual proforma EPS for the financial year ended 30 June 2015 8.7 cents
10% growth FY16 10% growth FY17 10% growth FY18
9.6 cents 10.5 cents 11.6 cents
If actual EPS for the year ended 30 June 2018 exceeds 11.6 cents per share, 50% of the performance rights granted to each employee will vest as follows: 50% of performance rights granted to each employee vest at end of third year (25 September 2018) The remaining 50% vest at the end of the fourth year (25 September 2019), provided the executive is still employed at this vesting date.
Performance condition 2) TSR
The TSR performance condition is a measure of ASH’s TSR compared to the TSR of a comparator group of twenty competing and industry related companies at the beginning of the respective performance periods. TSR is measured by the change in value of the ASH’s cumulative TSR over the performance period compared to the TSR performance of the comparator group over the 3 year performance period. If actual TSR for ASH is top quartile for the 3 year performance period, 50% of the performance rights granted to each employee will vest. If actual TSR for ASH is 2nd quartile for the 3 year performance
Setting and assessing performance
Who sets and assesses performance?
The MD sets and assesses performance and short term incentive outcomes for senior executives with guidance from the Remuneration Committee. The Remuneration Committee sets the targets for MD and assesses performance against those targets.
How is the STI delivered?
100% of any STI award is paid in cash within 30 days of finalisation of the audited Annual Report.
For
per
sona
l use
onl
y
Directors’ Report
ASHLEY SERVICES GROUP ANNUAL REPORT 2018 15
Overview of the LTI plan for FY16 period 25% of the performance rights granted to each employee will vest. If actual TSR for ASH is below 2nd quartile, none of the performance rights attributed to this performance hurdle will vest. Vesting of TSR related performance rights is as follows:
• 50% of performance rights granted to each employee vest at end of third year (25 September 2018)
• The remaining 50% vest at the end of the fourth year (25 September 2019), provided the executive is still employee at this vesting date.
Why were the performance measures chosen?
The Board considers two performance conditions to be appropriate because they ensure that a proportion of each executive’s remuneration is linked to the generation of profits (expressed on a per share basis) and shareholder value through the combined application of both absolute and relative performance criteria.
In particular, the use of a relative TSR based hurdle: • Ensures alignment between comparative shareholder return and reward for the executive;
and • Provides a relative, external market performance measure, having regard to those
companies with which the Group competes for capital, customers and talent.
An absolute underlying EPS growth based hurdle: • Links executive reward to a fundamental indicator of financial performance that is directly
connected to shareholders; and • Links directly to ASH’s long term objectives of improving and maintaining earnings
performance.
The use of dual performance measures combines a strong external market based focus through share price growth and dividends (TSR), and a non-market based internal measure aimed at driving improved Company earnings results (EPS).
Is performance subject to retesting?
No, retesting of performance is not permitted.
Who assesses performance against targets?
The Remuneration Committee based on financial information (EPS measure) and share price performance (the TSR measure).
Does the executive receive dividends and voting rights on unvested awards?
No, there are no voting rights or entitlements to dividends on unvested awards under the LTI plan.
Cessation of employment and change of control
What happens in the event of a change of control?
Upon a change of control event, the Board may determine to vest some or all of the LTI awards. In making this determination, the Board will consider all relevant circumstances, including the performance against the EPS measure up to the date of the change of control event and the portion of the performance period that has expired.
What happens in the event of cessation of employment?
In general, unvested LTI awards are forfeited.
In limited circumstances, such as upon a senior executive’s death, serious injury or incapacity during the performance period or other reason approved by the Board, any unvested performance shares will vest at the end of the performance period if the relevant performance conditions have been satisfied.
For
per
sona
l use
onl
y
Directors’ Report
ASHLEY SERVICES GROUP ANNUAL REPORT 2018 16
STI and LTI plans for the financial year ended 1 July 2018
The remuneration committee has approved a similar Short Term Incentive (STI) plan for the year ended 1 July 2018, based upon budget targets for that annual period.
In light of the loss for the financial years ended 30 June 2016 and 2017 and the reduced share price, the Board and the Remuneration Committee have temporarily suspended the LTI scheme for the financial years 2017 and 2018. Accordingly there was no award of performance rights to senior executives in relation to the year ended 2018 nor were any awarded in relation to the year 2017.
c. Non-executive Director remuneration and Board performance review
Non-executive Directors’ remuneration are reviewed annually and are determined by the Board based on recommendations from the Remuneration Committee. In making its recommendations, the Remuneration Committee takes into account remuneration paid to other non-executive Directors of comparable companies and where necessary will seek external advice. No remuneration consultants were used during the financial year.
In accordance with the Company’s Constitution, the Directors are entitled to receive an annual fee and for participation in Board sub-committees. For non-executive Directors, fees are not linked to performance.
The Company does not operate equity plans for non-executive Directors.
Non-executive Directors are entitled to statutory superannuation included as part of their Directors’ fees. There are no other schemes for retirement benefits for non-executive Directors.
No review of the Board’s performance occurred in the financial year ended 30 June 2017 due to the focus during FY17, in line with the outcomes of the strategic review announced on 1 March 2017, on the repositioning of the Company as a Labour Hire company, albeit one with a small, focused, complementary Training division.
d. Details of remuneration
Details of remuneration of the Directors and other key management personnel of Ashley Services Group are set out in the tables on pages 16 to 18.
The key management personnel of Ashley Services Group are listed on page 11. The key management personnel have authority and responsibility for planning, directing and controlling activities of the Group.
Remuneration and other terms of employment for the Executive Directors and other Key Management Personnel are formalised in a service agreement. The major provisions of the agreements relating to remuneration are set out below:
Table 8: Executive and Key Management Personnel Service Agreements
Name Base Salary $1 Target STI %2 Target LTI %2, 3 Term of agreement Notice Period
Ross Shrimpton 300,000 - - Ongoing 6 months Chris McFadden 450,000 50 50 Ongoing 6 months Paul Rixon 275,000 50 50 Ongoing 6 months Note: 1. Base salary is on an annual basis and includes superannuation contributions. 2. Maximum annual award as a percentage of annual salary. 3. This plan has been suspended for the financial years ended 30 June 2017 and 1 July 2018.
For
per
sona
l use
onl
y
Directors’ Report
ASHLEY SERVICES GROUP ANNUAL REPORT 2018 17
Table 9: Statutory key performance indicators of the group over the last four years1
2018
2017
2016
2015
Profit / (Loss) for the year attributable to members ($000) 4,789 (5,969) (69,626) 13,676 Basic earnings per share (cents) 3.33 (4.08) (46.42) 9.65 Dividend payments ($000)2 3,600 - - 6,150 Dividend payout ratio (%) - - - 45.0 Increase / (decrease) in share price (%)3 304.7 (70.9) (63.0) (64.2) Total KMP incentives as percentage of profit/(loss) for the year (%) 3.1 - - 1.8 Note: 1. Four years used since Ashley Services Group Pty Limited listed on 21 August 2014. 2. 2018 Dividend declared 26 July 2018 in relation to the 2018 financial year, with payment date of 17 August 2018. 3. Decrease in share price (%) is year-end share price relative to prior year-end, other than 2015 which is relative to IPO price $1.66.
Table 10: 2018 – Remuneration of Key Management Personnel
$ $ $ % Non-executive Directors Ian Pratt5 150,685 - - 14,315 - 165,000 - Executive Director Ross Shrimpton 279,951 - - 20,049 - 300,000 - Chris McFadden 429,951 - 50,000 20,049 - 500,000 10.0 Other key management personnel
Marc Shrimpton6 127,867 - - 505 - 128,372 - Paul Rixon 254,951 - 99,829 20,049 374,829 26.6 Total 1,243,405 - 149,829 74,967 1,468,201 10.2 Note: 1. ST – Short-term. 2. PE – Post-employment. 3. LT – Long-term. Details of the long term incentive plan are included in the Directors’ report, pages 16 to 17. Management have
assessed the probability of the performance hurdles for the 2015 and 2016 plans being met as Nil and no expense has been recognised in the profit and loss account for the year ended 1 July 2018.
4. Amounts included in the above table include amounts paid to key management from all entities. 5. During the year tax advisory fees have also been paid to Trood Pratt & Co (Company in which Ian Pratt is a Partner). 6. Marc Shrimpton resigned as an Executive Director on 20 April 2017 but continued on as General Manager Blackadder Recruitment
for the balance of FY17. Marc resigned 7 July 2017 as General Manager Blackadder Recruitment, with the above payments representing his final payment inclusive of accrued entitlements. F
or p
erso
nal u
se o
nly
Directors’ Report
ASHLEY SERVICES GROUP ANNUAL REPORT 2018 18
Table 11: 2017 – Remuneration of Key Management Personnel
2017 ST1 employee benefits PE2 benefits
LT3 employee
benefit Total4
Performance based Remuner
ation
Name
Cash salary & fees
$
Salary non-cash
$
ST1 employee bonus
S
Super- annuation
$ $ $ % Non-executive Directors Ian Pratt5 150,685 - - 14,315 - 165,000 Executive Director Ross Shrimpton6 173,300 - - 16,464 - 189,764 - Chris McFadden7 191,780 - - 18,219 - 209,999 - Marc Shrimpton8 255,384 - - 19,616 - 275,000 - Stewart Cummins9 238,472 - - 6,538 - 245,010 - Other key management personnel
Brett O’Connor10 176,502 - - 4,904 181,406 - Paul Rixon11 259,803 - - 19,616 279,419 - Paul Brittain12 343,890 - - 13,077 356,967 - Total 1,789,816 - - 112,749 1,902,565 Note: 1. ST – Short-term. 2. PE – Post-employment. 3. LT – Long-term. Details of the long term incentive plan are included in the Directors’ report, pages 16 to 17. Management have
assessed the probability of the performance hurdles for the 2015 and 2016 plans being met as Nil and no expense has been recognised in the profit and loss account for the year ended 30 June 2017.
4. Amounts included in the above table include amounts paid to key management from all entities. 5. During the year tax advisory fees have also been paid to Trood Pratt & Co (Company in which Ian Pratt is a Partner). 6. Reappointed Managing Director 23 January 2017, previously Non-Executive Director from 15 February 2016. These amounts
represent remuneration earned across both roles during the 2017 financial year. 7. Chris McFadden commenced as Chief Financial Officer on 13 January 2017 and moved to Executive Director on 6 April 2017.
These amounts represent remuneration from the date he commenced with the Group, rather than the date he was appointed Director.
8. Marc Shrimpton resigned as an Executive Director on 20 April 2017 but continued on as General Manager Blackadder Recruitment for the balance of FY17. These amounts represent remuneration earned across both roles during the 2017 financial year. Subsequent to year end, Marc resigned 7 July 2017 as General Manager Blackadder Recruitment.
9. Resigned 26 September 2016. 10. Resigned 20 September 2016. 11. Novated car lease refund of $4,419 included in these figures. 12. Resigned 17 February 2017.
Other transactions with key management personnel Information on share-based payments and other transactions with key management personnel is set out on the previous pages.
For
per
sona
l use
onl
y
Directors’ Report
ASHLEY SERVICES GROUP ANNUAL REPORT 2018 19
e. Shares held by key management personnel
The number of ordinary shares in the Company during the 2018 reporting period held by each of the Group’s key management personnel, including their related parties are set out below:
Table 12: Shares held by Key Management Personnel
Name Balance at start of
the year Shares Disposed Change from KMP Balance at end of the year Ian Pratt 15,060 - - 15,060 Ross Shrimpton1 86,046,305 - (5,767,275) 80,279,030 Chris McFadden - - 76,623 76,623 Paul Rixon 41,416 - - 41,416
Total 86,102,781 - (5,690,652) 80,412,129 Note: 1. The changes in Ross Shrimpton’s holding are as advised to the ASX on 30 May 2018 following a reorganisation of the Shrimpton Family’s
holding which left 5,767,275 shares which since this time are no longer held as a relevant interest of Ross Shrimpton and are presently retained by non-controlled associated family members.
f. Executive service agreements
On appointment to the Board, all non-executive Directors sign a letter of appointment with the Company. The letter summarises the terms including compensation, relevant to the office of Director.
All contracts with executives may be terminated by either party with a notice period as outlined in Table 8. Executives are typically restricted for twelve months after termination from conducting or engaging in competing businesses and from solicitation of customers and employees of the Company.
g. Share-based compensation
Senior Executive Share Plan The Company established the Performance Rights Share Plan on 31 July 2014. The Performance Rights Share Plan is intended to provide incentives to attract motivate and retain key executives whose present and potential contributions are important to the success of the Group by offering them an opportunity to participate in ownership of the Company. The Performance Rights Share Plan is administered by the Board in its discretion. The terms and conditions of the Performance Rights Share Plan are summarised below.
During the financial year the Board issued Nil performance rights (2017: Nil).
The number of Performance Rights awarded to executive directors and Key Management Personnel is set out below:
Table 13: Performance Rights held by Key Management Personnel
Name Balance at start of the year Performance Rights Cancelled Balance at end of the year Marc Shrimpton1 206,842 (206,842) - Paul Rixon 344,736 - 344,736 Total 551,578 (206,842) 344,736 Note: 1. Marc Shrimpton resigned 7 July 2017 as General Manager Blackadder Recruitment and his 206,842 Performance Rights were cancelled
for Nil consideration.
The offer of rights to Shares under the Employee Performance Rights Plan did not exceed 5% of the total number of issued shares in that class.
For
per
sona
l use
onl
y
Directors’ Report
ASHLEY SERVICES GROUP ANNUAL REPORT 2018 20
Consideration for the Shares is provided in the form of services to or for the benefit of the Company and as such performance conditions may be attached to any rights under the Employee Performance Rights Plan. An eligible employee who has contracted with Ashley Services (under the Employee Performance Rights Plan) for the right to Shares in the Company (Participant), holds those rights on the following terms:
• disposal of rights is not permitted without the permission of the Board; • any new issue of shares to existing shareholders will only apply to the Participant if the rights to shares have
vested in the Participant and the Participant has become a shareholder in the Company at the relevant record date (as defined in the ASX Listing Rules);
• in the event there is a bonus issue to Ashley Services shareholders, the number of shares a Participant is entitled to under the Employee Performance Rights Plan will be increased by the number of Shares the Participant would have received had they been a shareholder before the record date (as defined in the ASX Listing Rules) for the bonus issue; and
• in the event of a reconstruction of the issued capital of the Company prior to a Participant’s rights under the Employee Performance Rights Plan vesting in the Participant, the rights and Shares to which the Participant is entitled will be reconstructed in accordance with ASX Listing Rules.
Rights under the Employee Performance Rights Plan will vest in a Participant at a determined date subject to the Participant’s continued employment with Ashley Services and the satisfaction of any performance conditions and other terms and conditions imposed by the Board. Shares allotted under the plan are held under the following conditions: • shares issued under the plan will rank equally to shares issued in Ashley Services; and • compliance with Ashley Services’ Share Trading Policy is required.
Management have assessed the probability of the performance hurdles for the 2015 and 2016 plans being met as Nil and no expense has been recognised in the profit and loss account for either the year ended 1 July 2018 or 30 June 2017.
End of audited Remuneration Report.
Signed in accordance with a resolution of the Board of Directors made pursuant to section 298(2) of the Corporations Act 2001
Ian Pratt
Chairman
Sydney, 17 August 2018
For
per
sona
l use
onl
y
ASHLEY SERVICES GROUP ANNUAL REPORT 2018 21
AUDITOR’S INDEPENDENCE DECLARATION As lead auditor for the audit of the consolidated financial report of Ashley Services Group Limited for the year ended 1 July 2018, I declare that, to the best of my knowledge and belief, there have been no contraventions of: (a) the auditor independence requirements as set out in the Corporations Act 2001 in relation to the
audit; and (b) any applicable code of professional conduct in relation to the audit. This declaration is in relation to the Ashley Services Group Limited and the entities it controlled during the period. Sydney, NSW S P James 17 August 2018 Director
For
per
sona
l use
onl
y
Corporate Governance Statement
ASHLEY SERVICES GROUP ANNUAL REPORT 2018 22
A Corporate Governance Statement has been adopted by the Board on 30 August 2016 and can be found at
The Board has adopted a suite of governance materials which are available in the Corporate Governance section of the Company’s website (www.ashleyservicesgroup.com.au), under “Investor Centre”. The governance materials have been prepared and adopted on the basis that corporate governance procedures can add to the performance of the Company and the creation of shareholder value, and help to engender the confidence of the investment market.
Diversity
To date, the board or a committee have not set measurable objectives for achieving gender diversity and to assess annually both the objectives and the company’s progress in achieving them.
The Company provides the following information on the proportion of women employees in the whole
organisation, women in Senior Executive positions and women on the Board of the Company.
Female Male Directors & Senior Management 28% 72% Corporate & Administration 90% 10% Labour Hire 74% 26% Recruitment 60% 40% Training 60% 40% Total 67% 33%
During the financial year ending 1 July 2018 the Company submitted its annual report to the Workplace Gender Equality Agency and is again compliant with the Workplace Gender Equality Act 2012 (Act).
The performance of the Board and Senior Executives in the 2018 financial year has been reviewed against both quantitative and qualitative measures and Directors and Senior Executives provided feedback on the discharge of their responsibilities.
1. In the opinion of the Directors of Ashley Services Group Limited:
a. The consolidated financial statements and notes of Ashley Services Group Limited are in accordance with the Corporations Act 2001, including: i. Giving a true and fair view of its financial position as at 1 July 2018 and of its performance
for the financial year ended on that date; and ii. Complying with Australian Accounting Standards (including the Australian Accounting
Interpretations) and the Corporations Regulations 2001;
b. There are reasonable grounds to believe that Ashley Services Group Limited will be able to pay its debts as and when they become due and payable; and
c. At the date of this declaration, there are reasonable grounds to believe that the members of the Extended Closed Group will be able to meet any obligations or liabilities to which they are, or may become, subject by virtue of the deed of cross guarantee described in note 26 to the financial statements.
2. The Directors have been given the declarations required by Section 295A of the Corporations Act 2001 from the Managing Director and Chief Financial Officer for the financial year ended 1 July 2018.
3. Note 1 confirms that the consolidated financial statements also comply with International Financial Reporting Standards.
Signed in accordance with a resolution of the Directors.
Ian Pratt Chairman Sydney, 17 August 2018
For
per
sona
l use
onl
y
ASHLEY SERVICES GROUP ANNUAL REPORT 2018 24
ASHLEY SERVICES GROUP LIMITED ABN: 92 094 747 510
INDEPENDENT AUDITOR’S REPORT
To the Members of Ashley Services Group Limited REPORT ON THE AUDIT OF THE FINANCIAL REPORT Opinion We have audited the financial report of Ashley Services Group Limited (“the Company”) and its controlled entities (“the Group”), which comprises the consolidated statement of financial position as at 1 July 2018, the consolidated statement of profit or loss and other comprehensive income, the consolidated statement of changes in equity and the consolidated statement of cash flows for the year then ended, and notes to the financial statements, including a summary of significant accounting policies, and the directors’ declaration for the Group. In our opinion, the accompanying financial report of the Group is in accordance with the Corporations Act 2001, including: (a) giving a true and fair view of the Group’s financial position as at 1 July 2018 and of their financial
performance for the year then ended; and (b) complying with Australian Accounting Standards and the Corporations Regulations 2001. Basis for Opinion We conducted our audit in accordance with Australian Auditing Standards. Our responsibilities under those standards are further described in the Auditor’s Responsibilities for the Audit of the Financial Report section of our report. We are independent of the Group in accordance with the auditor independence requirements of the Corporations Act 2001 and the ethical requirements of the Accounting Professional and Ethical Standards Board’s APES 110 Code of Ethics for Professional Accountants (“the Code”) that are relevant to our audit of the financial report in Australia. We have also fulfilled our other ethical responsibilities in accordance with the Code. We believe that the audit evidence we have obtained is sufficient and appropriate to provide a basis for our opinion. Key Audit Matters Key audit matters are those matters that, in our professional judgement, were of most significance in our audit of the financial report of the current period. These matters were addressed in the context of our audit of the financial report as a whole, and in forming our opinion thereon, and we do not provide a separate opinion on these matters.
For
per
sona
l use
onl
y
ASHLEY SERVICES GROUP ANNUAL REPORT 2018 25
ASHLEY SERVICES GROUP LIMITED ABN: 92 094 747 510
INDEPENDENT AUDITOR’S REPORT (Continued)
Key Audit Matters (continued) Key Audit Matter How our audit addressed the key audit matter
Revenue recognition Refer to Note 1 (Accounting policies) and Note 2 (Revenue and other income)
Labour hire revenue is the most significant account balance in the Consolidated Statement of Profit or Loss and Other Comprehensive Income.
Total revenue of $333.6 million comprises a number of streams including:
• labour hire revenue ($326.1 million);
• training revenue ($6.7 million); and
• other income ($0.8 million).
We focussed on this matter due to the size and magnitude of labour hire revenue, as well as the higher level of inherent risk due to the manual processes for inputting, calculating, reviewing, and recording of the labour hire revenue.
We assessed whether the Group’s accounting policies were in compliance with Australian Accounting Standards. We tested the Group’s process for recognising labour hire revenue. We tested labour hire revenue recognised in the period by agreeing to timesheets, payroll reports, amounts billed and subsequently received. We issued audit confirmation requests to a sample of customers to test the total revenue invoiced by the Group. We tested the process for raising and authorising credit notes throughout the financial year and immediately subsequent to year end. We compared the accuracy of hours on-billed as labour hire revenue to amounts paid to employees, refer to employment costs below. We tested the correct cut-off and accrual of labour hire revenue at year end.
Employment costs Refer to Note 1 (Accounting policies)
Employment costs, both internal and allocated externally, is one of the most significant account balances in the Consolidated Statement of Profit or Loss and Other Comprehensive Income.
Total employment costs amount to
$319.0 million.
We focussed on this matter due to the size and magnitude of employment costs, as well as the higher level of inherent risk due to the manual processes for the volume of inputting, calculating, reviewing, and recording of the employment costs.
We tested the Group’s process for recognising employment costs.
We tested the controls surrounding the authorisation of changes in employee details, such as pay rates.
We tested employment costs recognised in the period by agreeing to timesheets, payroll reports, and amounts subsequently paid.
We analytically reviewed the labour hire margins from the current and prior year.
We tested the cut-off and accrual of employment costs at year end.
We tested whether PAYG amounts were deducted and subsequently paid to the Australian Taxation Office.
We tested superannuation amounts paid by recalculation and comparison to gross wages. We tested the subsequent payment to the superannuation clearing house.
Information Other than the Financial Report and Auditor’s Report Thereon The directors are responsible for the other information. The other information comprises the information included in the Group’s annual report for the year ended 1 July 2018, but does not include the financial report and our auditor’s report thereon. Our opinion on the financial report does not cover the other information and accordingly we do not express any form of assurance conclusion thereon.
For
per
sona
l use
onl
y
ASHLEY SERVICES GROUP ANNUAL REPORT 2018 26
ASHLEY SERVICES GROUP LIMITED ABN: 92 094 747 510
INDEPENDENT AUDITOR’S REPORT (Continued)
Information Other than the Financial Report and Auditor’s Report Thereon (continued) In connection with our audit of the financial report, our responsibility is to read the other information and, in doing so, consider whether the other information is materially inconsistent with the financial report or our knowledge obtained in the audit or otherwise appears to be materially misstated. If, based on the work we have performed, we conclude that there is a material misstatement of this other information, we are required to report that fact. We have nothing to report in this regard. Responsibilities of the Directors for the Financial Report The directors of the Company are responsible for the preparation of the financial report that gives a true and fair view in accordance with Australian Accounting Standards and the Corporations Act 2001 and for such internal control as the directors determine is necessary to enable the preparation of the financial report that gives a true and fair view and is free from material misstatement, whether due to fraud or error. In preparing the financial report, the directors are responsible for assessing the ability of the Group to continue as a going concern, disclosing, as applicable, matters related to going concern and using the going concern basis of accounting unless the directors either intend to liquidate the Group or to cease operations, or have no realistic alternative but to do so. Auditor’s Responsibilities for the Audit of the Financial Report Our objectives are to obtain reasonable assurance about whether the financial report as a whole is free from material misstatement, whether due to fraud or error, and to issue an auditor’s report that includes our opinion. Reasonable assurance is a high level of assurance, but is not a guarantee that an audit conducted in accordance with Australian Auditing Standards will always detect a material misstatement when it exists. Misstatements can arise from fraud or error and are considered material if, individually or in the aggregate, they could reasonably be expected to influence the economic decisions of users taken on the basis of this financial report. As part of an audit in accordance with the Australian Auditing Standards, we exercise professional judgement and maintain professional scepticism throughout the audit. We also: • Identify and assess the risks of material misstatement of the financial report, whether due to fraud
or error, design and perform audit procedures responsive to those risks, and obtain audit evidence that is sufficient and appropriate to provide a basis for our opinion. The risk of not detecting a material misstatement resulting from fraud is higher than for one resulting from error, as fraud may involve collusion, forgery, intentional omissions, misrepresentations, or the override of internal control.
• Obtain an understanding of internal control relevant to the audit in order to design audit procedures that are appropriate in the circumstances, but not for the purpose of expressing an opinion on the effectiveness of the Group’s internal control.
• Evaluate the appropriateness of accounting policies used and the reasonableness of accounting estimates and related disclosures made by the directors.
• Conclude on the appropriateness of the directors’ use of the going concern basis of accounting and, based on the audit evidence obtained, whether a material uncertainty exists related to events or conditions that may cast significant doubt on the Group’s ability to continue as a going concern. If we conclude that a material uncertainty exists, we are required to draw attention in our auditor’s report to the related disclosures in the financial report or, if such disclosures are inadequate, to modify our opinion. Our conclusions are based on the audit evidence obtained up to the date of our auditor’s report. However, future events or conditions may cause the Group to cease to continue as a going concern.
For
per
sona
l use
onl
y
ASHLEY SERVICES GROUP ANNUAL REPORT 2018 27
ASHLEY SERVICES GROUP LIMITED ABN: 92 094 747 510
INDEPENDENT AUDITOR’S REPORT (Continued)
Auditor’s Responsibilities for the Audit of the Financial Report (continued) • Evaluate the overall presentation, structure and content of the financial report, including the
disclosures, and whether the financial report represents the underlying transactions and events in a manner that achieves fair presentation.
• Obtain sufficient appropriate audit evidence regarding the financial information of the entities or business activities within the Group to express an opinion on the financial report. We are responsible for the direction, supervision and performance of the Group audit. We remain solely responsible for our audit opinion.
We communicate with the directors regarding, among other matters, the planned scope and timing of the audit and significant audit findings, including any significant deficiencies in internal control that we identify during our audit. We also provide the directors with a statement that we have complied with relevant ethical requirements regarding independence, and to communicate with them all relationships and other matters that may reasonably be thought to bear on our independence, and where applicable, related safeguards. From the matters communicated with the directors, we determine those matters that were of most significance in the audit of the financial report of the current period and are therefore the key audit matters. We describe these matters in our auditor’s report unless law or regulation precludes public disclosure about the matter or when, in extremely rare circumstances, we determine that a matter should not be communicated in our report because the adverse consequences of doing so would reasonably be expected to outweigh the public interest benefits of such communication. REPORT ON THE REMUNERATION REPORT Opinion on the Remuneration Report We have audited the Remuneration Report included in pages 11 to 20 of the directors’ report for the year ended 1 July 2018. In our opinion, the Remuneration Report of Ashley Services Group Limited for the year ended 1 July 2018 complies with section 300A of the Corporations Act 2001. Responsibilities The directors of the Company are responsible for the preparation and presentation of the Remuneration Report in accordance with section 300A of the Corporations Act 2001. Our responsibility is to express an opinion on the Remuneration Report, based on our audit conducted in accordance with Australian Auditing Standards. HLB Mann Judd Assurance (NSW) Pty Ltd S P James Chartered Accountants Director Sydney, NSW 17 August 2018
For
per
sona
l use
onl
y
Consolidated Statement of Profit or Loss and Other Comprehensive Income For the financial year ended 1 July 2018
ASHLEY SERVICES GROUP ANNUAL REPORT 2018 28
Note
1 Jul 2018
$000
30 Jun 2017
$000
Revenue 2 332,803 314,696
Other income 2 830 719
Employment costs (318,951) (300,849)
Depreciation and amortisation expense 3 (660) (1,854)
Finance costs 3 (574) (717)
Other expenses (6,610) (10,079)
Impairment of intangibles 12 - (5,486)
Impairment of property, plant and equipment 12 - (3,530)
Restructuring expense - (678)
Cancellation of shares issued on acquisition - 1,114
NSW finalisation cost - (738)
Profit / (Loss) before income tax from continuing operations 6,838 (7,402)
Income tax expense / (credit) 5 2,048 (1,967)
Profit / (Loss) for the year from continuing operations 4,789 (5,435)
Profit / (Loss) for the year from discontinued operations 21 - (534)
Profit / (Loss) for the year 4,789 (5,969)
Other comprehensive income - -
Total comprehensive Profit / (Loss) for the year 4,789 (5,969)
Basic earnings per share (cents) from continuing operations 19 3.33 (3.72)
Diluted earnings per share (cents) from continuing operations 19 3.33 (3.72)
Basic earnings per share (cents) from discontinued operations 19 0.00 (0.36)
Diluted earnings per share (cents) from discontinued operations 19 0.00 (0.36)
Basic earnings per share (cents) Total 19 3.33 (4.08)
Diluted earnings per share (cents) Total 19 3.33 (4.08)
The accompanying notes form part of these financial statements.
For
per
sona
l use
onl
y
Consolidated Statement of Financial Position As at 1 July 2018
ASHLEY SERVICES GROUP ANNUAL REPORT 2018 29
Note
1 Jul 2018 $000
30 Jun 2017 $000
Assets
Current assets
Cash and cash equivalents 7 6,364 4,376
Trade and other receivables 8 29,767 26,383
Current tax receivable 13 - 285
Other assets 9 927 1,450
Total current assets 37,058 32,494
Non-current assets
Property, plant and equipment 10 1,347 1,259
Deferred tax assets 13 5,398 7,281
Intangible assets 11, 12 3,148 3,277
Total non-current assets 9,893 11,817
Total assets 46,951 44,311
Liabilities
Current liabilities
Trade and other payables 14 15,713 17,184
Borrowings 15 - 724
Provisions 16 2,773 3,117
Total current liabilities 18,486 21,025
Non-current liabilities
Deferred tax liabilities 13 1,782 1,616
Provisions 16 1,884 1,660
Total non-current liabilities 3,666 3,276
Total liabilities 22,152 24,301
Net assets 24,799 20,010
Equity
Share capital 17 148,815 148,815
Common control reserve 18 (57,687) (57,687)
Accumulated losses (66,329) (71,118)
Total equity 24,799 20,010 The accompanying notes form part of these financial statements. F
or p
erso
nal u
se o
nly
Consolidated Statement of Changes in Equity For the financial year ended 1 July 2018
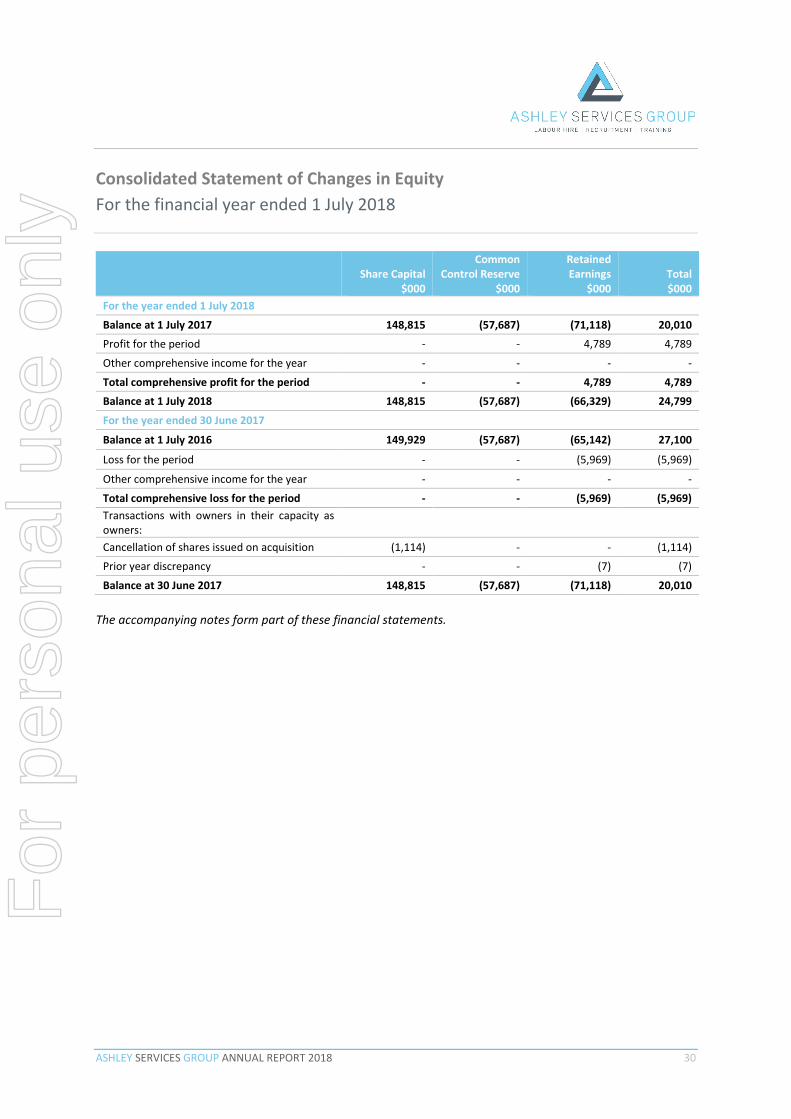
ASHLEY SERVICES GROUP ANNUAL REPORT 2018 30
Share Capital $000
Common Control Reserve
$000
Retained Earnings
$000 Total $000
For the year ended 1 July 2018
Balance at 1 July 2017 148,815 (57,687) (71,118) 20,010
Profit for the period - - 4,789 4,789
Other comprehensive income for the year - - - -
Total comprehensive profit for the period - - 4,789 4,789
Balance at 1 July 2018 148,815 (57,687) (66,329) 24,799
For the year ended 30 June 2017
Balance at 1 July 2016 149,929 (57,687) (65,142) 27,100
Loss for the period - - (5,969) (5,969)
Other comprehensive income for the year - - - -
Total comprehensive loss for the period - - (5,969) (5,969) Transactions with owners in their capacity as owners:
Cancellation of shares issued on acquisition (1,114) - - (1,114)
Prior year discrepancy - - (7) (7)
Balance at 30 June 2017 148,815 (57,687) (71,118) 20,010 The accompanying notes form part of these financial statements.
For
per
sona
l use
onl
y
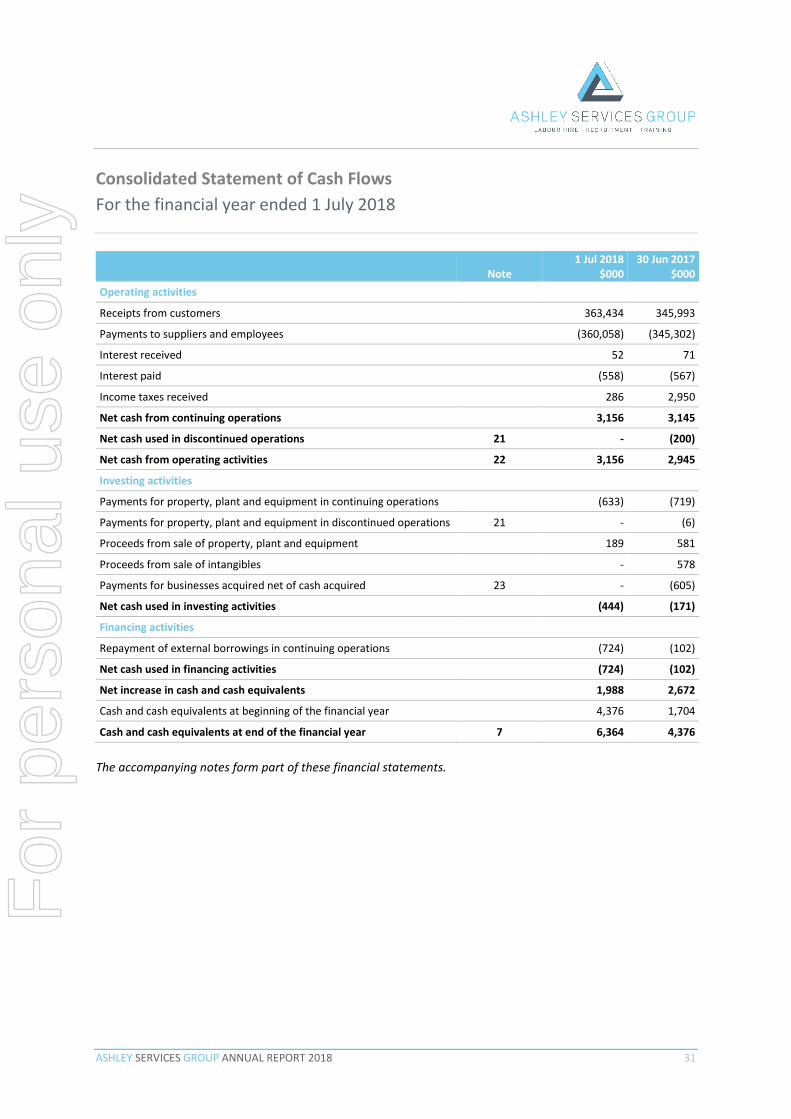
Consolidated Statement of Cash Flows For the financial year ended 1 July 2018
ASHLEY SERVICES GROUP ANNUAL REPORT 2018 31
Note 1 Jul 2018
$000 30 Jun 2017
$000 Operating activities
Receipts from customers 363,434 345,993
Payments to suppliers and employees (360,058) (345,302)
Interest received 52 71
Interest paid (558) (567)
Income taxes received 286 2,950
Net cash from continuing operations 3,156 3,145
Net cash used in discontinued operations 21 - (200)
Net cash from operating activities 22 3,156 2,945
Investing activities
Payments for property, plant and equipment in continuing operations (633) (719)
Payments for property, plant and equipment in discontinued operations 21 - (6)
Proceeds from sale of property, plant and equipment 189 581
Proceeds from sale of intangibles - 578
Payments for businesses acquired net of cash acquired 23 - (605)
Net cash used in investing activities (444) (171)
Financing activities
Repayment of external borrowings in continuing operations (724) (102)
Net cash used in financing activities (724) (102)
Net increase in cash and cash equivalents 1,988 2,672
Cash and cash equivalents at beginning of the financial year 4,376 1,704
Cash and cash equivalents at end of the financial year 7 6,364 4,376
The accompanying notes form part of these financial statements.
For
per
sona
l use
onl
y
Notes to the Financial Statements
ASHLEY SERVICES GROUP ANNUAL REPORT 2018 32
Table of Contents 1. SUMMARY OF SIGNIFICANT ACCOUNTING POLICIES ---------------------------------------------------- 34
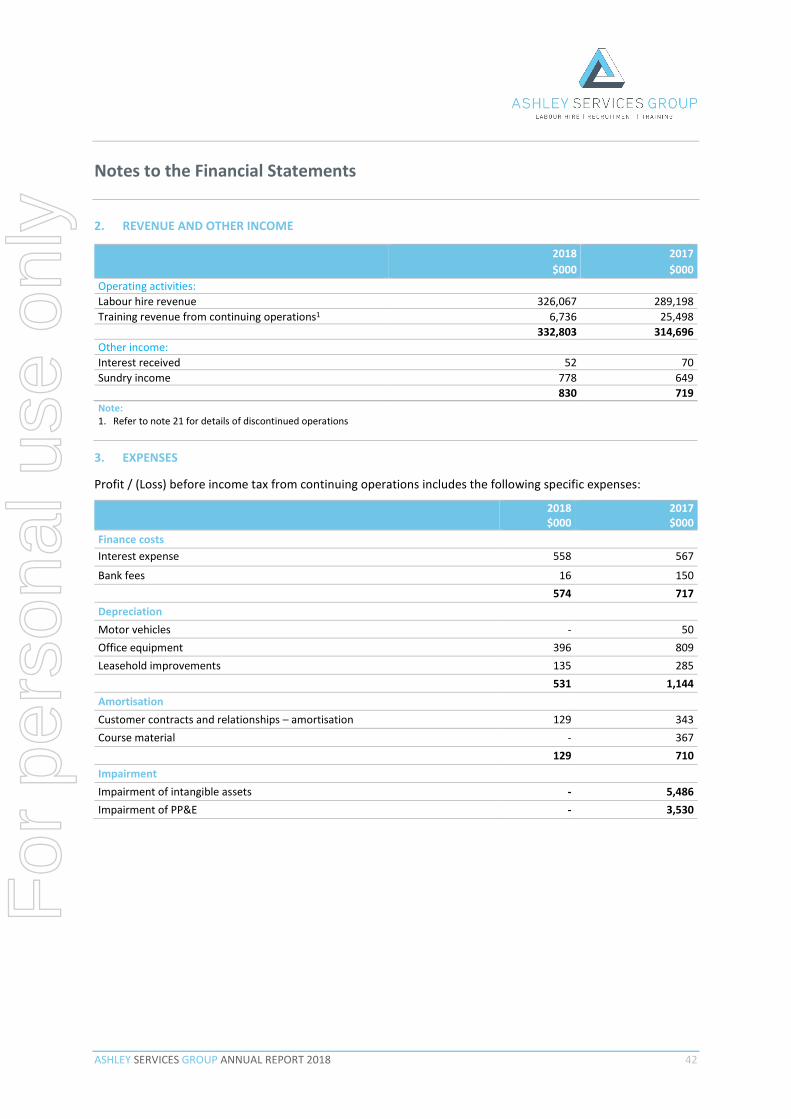
2. REVENUE AND OTHER INCOME ------------------------------------------------------------------------------- 42
a. General information The financial statements for the financial year ended 1 July 2018 cover Ashley Services Group Limited and its controlled entities (“Ashley Services” or the “Group”). Ashley Services Group is a public Company listed on the Australian Securities Exchange (trading under the symbol “ASH”), incorporated and domiciled in Australia.
The following is a summary of the material accounting policies adopted by the Group in the preparation of the consolidated financial statements. The accounting policies have been consistently applied unless otherwise stated.
b. Statement of compliance The consolidated financial statements are general purpose financial statements which have been prepared in accordance with the Corporations Act 2001 and Australian Accounting Standards (including Australian Accounting Interpretations) adopted by the Australian Accounting Standards Board. The consolidated financial statements of the Group also comply with International Financial Reporting Standards (‘IFRS’) adopted by the International Accounting Standards Board. The Group is a for-profit entity for the purposes of preparing the financial statements.
The consolidated financial statements were authorised for issue by the Board of Directors on 17 August 2018.
c. Basis of preparation The consolidated financial statements have been prepared on an accruals basis and are based on historical costs, except for the measurement at fair value of selected non-current assets, financial assets and financial liabilities as disclosed in this note. Cost is based on the fair values of the consideration given in exchange for assets. All amounts are presented in Australian dollars, unless otherwise noted.
In accordance with ASIC Corporations (Rounding in Financial / Directors’ Reports) Instrument 2016/191, amounts in the financial report are rounded off to the nearest thousand dollars unless otherwise indicated.
d. Going concern The consolidated financial statements have been prepared on a going concern basis.
e. Adoption of new and revised Accounting Standards
The Group adopted all of the new, revised or amended Accounting Standards and Interpretations issued by the Australian Accounting Standards Board (“AASB”) that are mandatory for the current reporting period. The adoption of these Accounting Standards and Interpretations did not have any significant impact on the financial performance or position of the Group.
f. New Accounting Standard and Interpretations not yet adopted
Certain new accounting standards and interpretations have been published that are not mandatory for 1 July 2018 reporting periods and have not been early adopted by the Group. The Group’s assessment of the impact of these new standards and interpretations is set out below.
There are no other standards that are not yet effective and that are expected to have a material impact on the entity in the current or future reporting periods and on foreseeable future transactions.
AASB 9: Financial Instruments
AASB 9 introduces new requirements for the classification and measurement of financial assets and liabilities. These requirements improve and simplify the approach for classification and measurement of financial assets compared with the requirements of AASB 139. The main changes are:
a) Financial assets that are debt instruments will be classified based on: (i) the objective of the entity’s business model for managing the financial assets; and (ii) the characteristics of the contractual cash flows.
b) Allows an irrevocable election on initial recognition to present gains or losses on investments in equity instruments that are not held for trading in other comprehensive income (instead of in profit or loss). Dividends in respect of these investments that are a return on investment can be recognised in profit or loss
For
per
sona
l use
onl
y
Notes to the Financial Statements
ASHLEY SERVICES GROUP ANNUAL REPORT 2018 35
and there is no impairment or recycling on disposal of the instrument.
c) Introduces a ‘fair value through other comprehensive income’ measurement category for particular simple debt instruments.
d) Financial assets can be designated and measured at fair value through profit or loss at initial recognition if doing so eliminates or significantly reduces a measurement or recognition inconsistency that would arise from measuring assets or liabilities, or recognising the gains or losses on them, on different bases.
e) Where the fair value option is used for financial liabilities the change in fair value is to be accounted for as follows:
• the change attributable to changes in credit risk are presented in Other Comprehensive Income (‘OCI’); and
• the remaining change is presented in profit or loss.
If this approach creates or enlarges an accounting mismatch in the profit or loss, the effect of the changes in credit risk are also presented in profit or loss. Otherwise, the following requirements have generally been carried forward unchanged from AASB 139 into AASB 9:
• classification and measurement of financial liabilities; and
• derecognition requirements for financial assets and liabilities.
This standard and its consequential amendments are applicable to annual reporting periods beginning on or after 1 January 2018 (i.e. the Group’s 30 June 2019 year-end). Management’s assessment of these amendments is that they will have no material impact on the Group’s transactions or balances recognised in the financial statements.
AASB 15: Revenue from Contracts with Customers
AASB 15 replaces AASB 118: Revenue, AASB 111: Construction Contracts and some revenue-related Interpretations:
• Establishes a new revenue recognition model; • changes the basis for deciding whether revenue
is to be recognised over time or at a point in time;
• provides new and more detailed guidance on specific topics (e.g., multiple element arrangements, variable pricing, rights of return, warranties and licensing); and
• expands and improves disclosures about revenue.
AASB 15 is applicable to annual reporting periods beginning on or after 1 January 2018 (i.e. the Group’s 30 June 2019 year-end). Management’s assessment of these amendments is that there may be a potential impact on the Training division and will undertake further work to quantify this potential impact.
AASB 16: Leases
AASB 16 replaces AASB 117: Leases, was issued in February 2016 and is effective for periods beginning on or after 1 January 2019. AASB 16:
• replaces AASB 117 Leases and some lease-related Interpretations;
• requires all leases to be accounted for ‘on-balance sheet’ by lessees, other than short-term and low value asset leases;
• provides new guidance on the application of the definition of lease and on sale and lease back accounting;
• largely retains the existing lessor accounting requirements in AASB 117; and
• requires new and different disclosures about leases.
AASB 16 is applicable to annual reporting periods beginning on or after 1 January 2019 (i.e. the Group’s 30 June 2020 year-end). Management have yet to undertake a detailed assessment of the impact of AASB 16. However, based on the entity’s preliminary assessment, the likely impact on the first time adoption of the Standard for the year ending 30 June 2020 includes:
• there will be an increase in lease assets and financial liabilities recognised on the balance sheet;
• the reported equity will reduce as the carrying amount of lease assets will reduce more quickly than the carrying amount of lease liabilities;
• EBIT in the statement of profit or loss and other comprehensive income will be higher as the implicit interest in lease payments for former off
For
per
sona
l use
onl
y
Notes to the Financial Statements
ASHLEY SERVICES GROUP ANNUAL REPORT 2018 36
balance sheet leases will be presented as part of finance costs rather than being included in operating expenses; and
• operating cash outflows will be lower and financing cash flows will be higher in the statement of cash flows as principal repayments on all lease liabilities will now be included in financing activities rather than operating activities.
g. Business combinations Business combinations occur where an acquirer obtains control over one or more businesses and result in the consolidation of its assets and liabilities.
A business combination is accounted for by applying the acquisition method, unless it is a combination involving entities or businesses under common control. The business combination will be accounted for from the date that control is attained, whereby the fair value of the identifiable assets acquired and liabilities (including contingent liabilities) assumed are recognised (subject to certain limited exceptions).
When measuring the consideration transferred in the business combination, any asset or liability resulting from a contingent consideration arrangement is also included. Subsequent to initial recognition, contingent consideration classified as equity is not remeasured and its subsequent settlement is accounted for within equity. Contingent consideration classified as an asset or liability is remeasured in each reporting period to fair value, recognising any change to fair value in profit or loss, unless the change in value can be identified as existing at acquisition date.
All transaction costs incurred in relation to the business combination are recognised as expenses in the statement of profit or loss and other comprehensive income when incurred.
The acquisition of a business may result in the recognition of goodwill or a gain from a bargain purchase.
On 1 July 2014, the group acquired a number of related entities. This business combination was treated as a common control transaction, as the conditions in AASB 3: Business Combinations (Appendix B) applied, in that all businesses were controlled by the same party before and after the
transaction, and the control was not considered transitory.
h. Basis of consolidation The Group financial statements consolidate those of Ashley Services Group Limited and all of its subsidiaries as of 1 July 2018. Ashley Services Group Limited controls a subsidiary if it is exposed, or has rights, to variable returns from its involvement with the subsidiary and has the ability to affect those returns through its power over the subsidiary. All subsidiaries have a reporting date of 1 July 2018.
All transactions and balances between Group companies are eliminated on consolidation, including unrealised gains or losses on transactions between Group companies. Where unrealised losses on intra-group asset sales are reversed on consolidation, the underlying asset is also tested for impairment from a group perspective. Amounts reported in the financial statements of subsidiaries have been adjusted where necessary to ensure consistency with the accounting policies adopted by the Group.
Profit or loss and other comprehensive income of subsidiaries acquired or disposed of during the year are recognised from the effective date of acquisition, or up to the effective date of disposal, as applicable.
Non-controlling interests, presented as part of equity, represent the portion of a subsidiary’s profit or loss and net assets that is not held by the Group. The Group attributes total comprehensive income or loss of subsidiaries between the owners of the parent and the non-controlling interests based on their respective ownership interests.
i. Revenue and other income Revenue is measured at the fair value of the consideration received or receivable after taking into account any discounts allowed. All revenue is stated net of the amount of GST. Below are the specific accounting policies adopted by the Group:
Training revenue
Revenue from training courses is recognised in proportion to the stage of completion of the training course.
Where work has been undertaken, and has not yet been billed or claimed from the relevant sponsoring
For
per
sona
l use
onl
y
Notes to the Financial Statements
ASHLEY SERVICES GROUP ANNUAL REPORT 2018 37
authority, a “Work in Progress” balance is recognised within “Other receivables” after adjusting for an estimate of potentially unsuccessful claims.
Labour hire Labour hire revenue is recognised upon delivery of the service to the customers or in the instance of placement fees at the time the employee has been placed.
Interest revenue Interest revenue is recognised using the effective interest method, which for floating rate financial assets is the rate inherent in the instrument.
Dividend revenue Dividend revenue is recognised when the right to receive a dividend has been established, usually on declaration of the dividend / distribution.
Other income Other income primarily includes State funding employer rebates earned in relation to specified categories of individuals.
j. Intangible assets Goodwill Goodwill is initially recognised as the difference between the fair value of consideration, and the fair value of net assets acquired less any accumulated impairment losses.
The value of goodwill is recognised on acquisition of the business.
The Group adopts the full goodwill method. The fair value of the interests in the business is determined using valuation techniques which make the maximum use of market information where available. Under this method, goodwill attributable to the interests of the business is recognised in the financial statements.
Goodwill is tested for impairment annually and is allocated to the Group’s cash-generating units or group of cash-generating units, which represent the lowest level at which goodwill is monitored but where such level is not larger than an operating segment. Gains or losses on the disposal of equity include the carrying amount of goodwill related to the entity sold.
Changes in the ownership interest in a subsidiary are accounted for as equity transactions and do not affect the carrying amounts of goodwill.
Other intangibles Intangibles acquired by the group are stated at cost less accumulated amortisation and impairment losses. Amortisation is charged to the profit or loss on a straight line basis over the estimated useful life. Estimated useful life of intangibles is as follows: Customer relationships 7 years Licenses 5 years Intellectual property - Course material 5-7 years
Intangible assets, such as Brands, which are deemed to have an indefinite useful life are not amortised, but are assessed for impairment annually, within the CGU to which they are attributed. Where impairment is recognised, it is recorded in the profit or loss in the period the impairment is identified.
k. Income tax The income tax expense (income) for the year comprises current income tax expense (income) and deferred tax expense (income).
Current income tax expense charged to profit or loss is the tax payable on taxable income. Current tax liabilities (assets) are therefore measured at the amounts expected to be paid to (recovered from) the relevant taxation authority.
Deferred income tax expense reflects movements in deferred tax asset and deferred tax liability balances during the year as well as unused tax losses.
Current and deferred income tax expense (income) is charged or credited directly to equity instead of profit or loss when the tax relates to items that are credited or charged directly to equity.
Except for business combinations, no deferred income tax is recognised from the initial recognition of an asset or liability where there is no effect on accounting or taxable profit or loss.
Deferred tax assets and liabilities are calculated at the tax rates that are expected to apply to the period when the asset is realised or the liability is settled and their measurement also reflects the manner in which
For
per
sona
l use
onl
y
Notes to the Financial Statements
ASHLEY SERVICES GROUP ANNUAL REPORT 2018 38
management expects to recover or settle the carrying amount of the related asset or liability.
Deferred tax assets relating to temporary differences and unused tax losses are recognised only to the extent that it is probable that future taxable profit will be available against which the benefits of the deferred tax asset can be utilised.
Where temporary differences exist in relation to investments in subsidiaries, branches, associates, and joint ventures, deferred tax assets and liabilities are not recognised where the timing of the reversal of the temporary differences can be controlled and it is not probable that the reversal will occur in the foreseeable future.
Current tax assets and liabilities are offset where a legally enforceable right of set-off exists and it is intended that net settlement or simultaneous realisation and settlement of the respective asset and liability will occur. Deferred tax assets and liabilities are offset where: (a) a legally enforceable right of set-off exists; and (b) the deferred tax assets and liabilities relate to income taxes levied by the same taxation authority on either the same taxable entity or different taxable entities where it is intended that net settlement or simultaneous realisation and settlement of the respective asset and liability will occur in future periods in which significant amounts of deferred tax assets or liabilities are expected to be recovered or settled.
Tax consolidation Ashley Services Group Limited and its wholly owned Australian subsidiaries have formed an income tax consolidated group under tax consolidation legislation. Each entity in the group recognises its own current and deferred tax assets and liabilities. Such taxes are measured using the ‘standalone taxpayer’ approach to allocation. Current tax liabilities (assets) and deferred tax assets arising from unused tax losses and tax credits in the subsidiaries are immediately transferred to head entity. The group notified the Australian Taxation Office that it has formed an income tax consolidation group to apply from 1 July 2003. The income tax consolidated group has entered a tax funding arrangement whereby each company in the Group contributes to the income tax payable by the Group in proportion to their contributions to the Group’s taxable income.
Differences between the amounts of net tax assets and liabilities derecognised and the net amounts recognised pursuant to the funding arrangement are recognised as either a contribution by, or distribution, to the head entity.
l. Cash and cash equivalents Cash and cash equivalents include cash on hand, deposits held at call with banks, other short term highly liquid investments with original maturities of three months or less, and bank overdrafts. Bank overdrafts are shown with short term borrowings in current liabilities on the consolidated statement of financial position.
m. Trade and other receivables Trade and other receivables include amounts due from customers for services performed in the ordinary course of business. Receivables expected to be collected within 12 months of the end of the reporting period are classified as current assets. All other receivables are classified as non-current assets.
Trade and other receivables are initially recognised at fair value and subsequently measured at amortised cost using the effective interest method, less any provision for impairment.
The recoverability of trade receivables is reviewed on an ongoing basis. Amounts which are determined not to be recoverable are written off by reducing the carrying amount to its recoverable amount, the difference is charged to the statement of profit or loss and other comprehensive income in that period.
A provision for impairment of trade recoverable is recognised when there is objective evidence that the group is unable to collect part or all of the amounts due. Factors such as previous trading relationship, financial position, and probability of recoverability are considered when determining the extent the debtor is impaired.
n. Property, plant and equipment Each class of property, plant and equipment is carried at cost, less where applicable, any accumulated depreciation and impairment losses.
Property, plant and equipment is stated at historical cost less accumulated depreciation and any accumulated impairment losses.
For
per
sona
l use
onl
y
Notes to the Financial Statements
ASHLEY SERVICES GROUP ANNUAL REPORT 2018 39
The depreciable amount of fixed assets is depreciated on a straight line basis, over the useful asset’s life to the Group commencing from the time the assets are held ready for use.
The annual depreciation rates used for each class of depreciable assets are:
• Class of fixed assets Depreciation rate Computer equipment 20 - 33% Office equipment 20 - 33% Furniture and fittings 10% Motor vehicles 18.75 - 25% Training equipment 33.33% Leasehold improvements 20% - 50%
In the case of leasehold improvements, expected useful lives are determined by reference to comparable owned assets or over the term of the lease, if shorter.
The carrying amount of property, plant and equipment is reviewed annually at the end of the reporting period by the Directors to ensure it is not in excess of the recoverable amount of these assets.
The recoverable amount is assessed on the basis of the expected net cash flows that will be received from the asset’s employment and subsequent disposal. The expected net cash flows have been discounted to their present values in determining recoverable amounts.
An asset’s carrying amount is written down immediately to its recoverable amount if the asset’s carrying amount is greater than its estimated recoverable amount.
Gains or losses on disposals are determined by comparing proceeds with carrying amount. These gains or losses are recognised immediately in profit or loss.
o. Trade and other payables Trade and other payables represent the liabilities for goods and services received by the Group that remain unpaid at the end of the reporting period. The balance is recognised as a current liability with the amounts normally paid within 30 days of recognition of the liability.
p. Employee benefits Provision is made for the Group’s liability for the employee benefits arising from services rendered by employees to the end of the reporting period. Employee benefits that are expected to be settled within one year have been measured at the amounts expected to be paid when the liability is settled. Employee benefits payable later than one year have been measured at the present value of the estimated future cash outflows to be made for those benefits. In determining the liability, consideration is given to employee wage increases and the probability that the employee may not satisfy vesting requirements. Those cash flows are discounted using market yields on HQ corporate bonds with terms to maturity that match the expected timing of cash flows.
q. Provisions Provisions are recognised when the Group has a legal or constructive obligation, as a result of past events, for which it is probable that an outflow of economic benefits will result and that outflow can be reliably measured. Provisions are measured at the best estimate of the amounts required to settle the obligation at the end of the reporting period.
r. Borrowings Loans and borrowings are initially recognised at the fair value of the consideration received, net of transaction costs. They are subsequently measured at amortised cost using the effective interest method.
Fees paid on the establishment of loan facilities are recognised as transaction costs of the loan to the extent that it is probable that some or all of the facility will be drawn down.
s. Impairment of assets At the end of each reporting period, the Group assesses whether there is any indication that an asset may be impaired.
The assessment will include considering external sources of information and internal sources of information including dividends received from subsidiaries, deemed to be out of pre-acquisition profits. If such an indication exists, an impairment test is carried out on the asset by comparing the recoverable amount of the asset, being the higher of the asset’s fair value less costs to sell, and its value in use, to the asset’s carrying amount. Any excess of the
For
per
sona
l use
onl
y
Notes to the Financial Statements
ASHLEY SERVICES GROUP ANNUAL REPORT 2018 40
asset’s carrying value over its recoverable amount is recognised immediately in profit or loss, unless the asset is carried at a revalued amount. Any impairment loss of a revalued asset is treated as a revaluation decrease.
Where it is not possible to estimate the recoverable amount of an individual asset, the Group estimates the recoverable amount of the cash-generating unit to which the asset belongs.
Impairment testing is performed at least annually for goodwill and intangible assets with indefinite lives.
t. Comparative figures When required by Accounting Standards, comparative figures have been adjusted to conform to changes in presentation for the current financial year.
u. GST Revenues, expenses and assets are recognised net of the amount of GST, except where the amount of GST incurred is not recoverable from the ATO.
Receivables and payables are stated inclusive of the amount of GST receivable or payable. The net amount of GST recoverable from, or payable to, the ATO is included with other receivables or payables in the balance sheet.
Cash flows are presented on a gross basis. The GST components of cash flows arising from investing or financing activities which are recoverable from, or payable to, the ATO are presented as operating cash flows included in receipts from customers or payments to suppliers.
v. Significant management judgement in applying accounting policies
When preparing the financial statements, management undertakes a number of judgements, estimates and assumptions about the recognition and measurement of assets, liabilities, income and expenses. Significant management judgement The following are significant management judgements in applying the accounting policies of the Group that have the most significant effect on the financial statements.
Determination of Cash Generating Units for purpose of impairment reviews Determination of the Cash Generating Units (“CGUs”) for purpose of impairment reviews is a key judgement made by management. Management has undertaken a formal assessment of what constitutes the CGUs, by identifying the smallest identifiable group of assets that generates cash inflows that are largely independent of the cash inflows from other assets or group of assets, being Training and Labour Hire. Assessment of the Class Action against the Group Ashley Services Group Limited (ASH) is the respondent in a class action that was commenced in the Federal Court of Australia (NSW Registry) on 1 December 2016 on behalf of a group of shareholders. The allegations against ASH include that its prospectus, dated 7 August 2014, contained certain misstatements and omissions in contravention of the Corporations Act 2001 (Cth), that ASH contravened the continuous disclosure provisions and that it engaged in misleading and deceptive conduct during the period August 2014 to April 2015. ASH is vigorously defending this proceeding. The potential liability and costs in respect of the proceeding cannot be accurately assessed at this time, but the existence of this matter has entailed the necessity for disclosure as a contingent liability (Refer Note 28).
Recognition of deferred tax assets The extent to which deferred tax assets can be recognised is based on an assessment of the probability of the Group’s future taxable income against which the deferred tax assets can be utilised. Estimation uncertainty Information about estimates and assumptions that have the most significant effect on recognition and measurement of assets, liabilities, income and expenses is provided below. Actual results may be substantially different. Impairment In assessing impairment, management estimates the recoverable amount of each asset or cash-generating unit based on expected future cash flows and uses an interest rate to discount them. Estimation uncertainty relates to assumptions about future operating results and the determination of a suitable discount rate. Both future operating results and discount rates are discussed in Note 12. In 2018, the
For
per
sona
l use
onl
y
Notes to the Financial Statements
ASHLEY SERVICES GROUP ANNUAL REPORT 2018 41
Group recognised no impairment losses on goodwill and/or other intangible assets (see Note 12). Useful lives of depreciable assets Management reviews its estimate of the useful lives of depreciable assets at each reporting date, based on the expected utility of the assets. Uncertainties in these estimates relate to technical obsolescence that may change the utility of certain software and IT equipment. Long service leave provisions In determining the provision for employees’ long service leave, consideration is given to the probability an employee may not satisfy vesting requirements. In doing this, management considers the likelihood of employees reaching a qualifying period of service and adjust the valuation for these estimated probabilities. Long term incentive plan In determining the provision for senior management’s long term incentive plan, consideration is given to the probability the required “earnings per share” performance requirement being achieved to be remote, and therefore a provision has not been recognised in relation to this.
w. Dividends A liability is recognised for the amount of any dividend declared, being appropriately authorised and no longer at the discretion of the entity, on or before the end of the financial year but not distributed at balance date.
x. Earnings per share Basic earnings per share Basic earnings per share is calculated by dividing the profit attributable to equity holders of the Company, after deducting any costs of servicing equity other than ordinary shares, by the weighted average number of ordinary shares outstanding during the financial year, adjusted for bonus elements in ordinary shares issued during the year.
Diluted earnings per share Diluted earnings per share adjusts the figures used in determination of basic earnings per share to take into account the after income tax effect of interest and other financing costs associated with dilutive potential ordinary shares and the weighted average number of shares assumed to have been issued for no
consideration in relation to dilutive potential ordinary shares.
For
per
sona
l use
onl
y
Notes to the Financial Statements
ASHLEY SERVICES GROUP ANNUAL REPORT 2018 42
2. REVENUE AND OTHER INCOME
2018 $000
2017 $000
Operating activities: Labour hire revenue 326,067 289,198 Training revenue from continuing operations1 6,736 25,498 332,803 314,696 Other income: Interest received 52 70 Sundry income 778 649 830 719 Note: 1. Refer to note 21 for details of discontinued operations
3. EXPENSES
Profit / (Loss) before income tax from continuing operations includes the following specific expenses:
2018 $000
2017 $000
Finance costs Interest expense 558 567
Bank fees 16 150 574 717 Depreciation Motor vehicles - 50 Office equipment 396 809 Leasehold improvements 135 285 531 1,144 Amortisation Customer contracts and relationships – amortisation 129 343 Course material - 367 129 710 Impairment Impairment of intangible assets - 5,486 Impairment of PP&E - 3,530
For
per
sona
l use
onl
y
Notes to the Financial Statements
ASHLEY SERVICES GROUP ANNUAL REPORT 2018 43
4. AUDITOR’S REMUNERATION
2018 $
2017 $
Auditor of the parent entity – Grant Thornton and HLB Mann Judd Audit and review of financial reports under the Corporations Act 2001 - Grant Thornton1 - 95,579
Audit and review of financial reports under the Corporations Act 2001 - HLB Mann Judd2 145,000 110,0003
Total Remuneration 145,000 205,579
Other entities In addition to the above, the related entities detailed in Note 25 have also paid fees to the auditor(s) as follows:
Audit and review of financial reports under the Corporations Act 2001 - Grant Thornton1 - -
Audit of financial reports under the Corporations Act 2001 - HLB Mann Judd2 25,000 25,000
25,000 25,000 Note: 1. Grant Thornton Audit Pty Ltd resigned as auditor of the Company on 12 May 2017. 2. HLB Mann Judd Assurance (NSW) Pty Limited were appointed auditor of the Company on 12 May 2017 subject to ASIC consent (granted
20 June 2017) to the resignation of Grant Thornton Audit Pty Ltd. 3. The amount of Auditor’s remuneration disclosed doesn’t include review of financial reports under the Corporations Act 2001
5. INCOME TAX EXPENSE / (CREDIT) a. Components of tax expense / (credit) for continuing operations
2018 $000
2017 $000
Current tax expense 16 919
Deferred tax – origination and reversal of temporary differences 2,049 (1,774)
Over provision of tax in prior year (17) (1,112)
Income tax expense / (credit) 2,048 (1,967)
b. Reconciliation of prima facie tax on profit / (loss) from ordinary activities to income tax expense / (credit)
2018 $000
2017 $000
Net profit / (loss) before tax from continuing operations 6,838 (7,402)
Prima facie tax expense / (credit) on net profit / (loss) from ordinary activities before income tax at 30% (2017: 30%) 2,051 (2,221) Add / (less) Tax effect of:
– Entertainment 5 6
– Other 9 2
– Impairment of intangibles - 1,646
– Net intangibles adjustment - 46
– Profit on cancellation of shares - (334)
– Over provision of tax in prior year (17) (1,112)
Income tax expense / (credit) 2,048 (1,967)
For
per
sona
l use
onl
y
Notes to the Financial Statements
ASHLEY SERVICES GROUP ANNUAL REPORT 2018 44
The tax rate used in the above reconciliation is the corporate tax rate of 30% payable by Australian corporate entities on taxable profits under Australian tax law. There has been no change in the corporate tax rate when compared with the previous reporting period.
6. KEY MANAGEMENT PERSONNEL DISCLOSURES
a. Key management personnel compensation for the year was as follows
b. Individual director and key management personnel disclosures Detailed remuneration disclosures are included in the Directors’ Report. The relevant information can be found in the Remuneration section of the report on page 16 to 18, Tables 8 to 11.
7. CASH AND CASH EQUIVALENTS
2018 $000
2017 $000
Cash on hand 3 5
Cash at bank 6,361 4,371 6,364 4,376
8. TRADE AND OTHER RECEIVABLES
2018 $000
2017 $000
Current
Trade receivables 25,151 22,930
Allowance for impairment of trade receivables (555) (1,250)
Other receivables 5,171 4,703
29,767 26,383
a. Ageing of trade receivables (before allowing for impairment of receivables) at year end is detailed below
2018 $000
2017 $000
Current 18,371 15,954
Past due 0 – 30 days (not considered impaired) 4,834 5,118
Past due 31 – 60 days (not considered impaired) 1,085 608
Past due 60+ days (not considered impaired) 306 -
Past due 60+ days (considered impaired (b)) 555 1,250
25,151 22,930
For
per
sona
l use
onl
y
Notes to the Financial Statements
ASHLEY SERVICES GROUP ANNUAL REPORT 2018 45
b. The movement in the allowance for doubtful accounts in respect of trade receivables is detailed below
2018 $000
2017 $000
Balance at beginning of year 1,250 1,055
Increase in allowance recognised in profit or loss 62 489
Amounts written-off (757) (294)
Balance at end of year 555 1,250 9. OTHER ASSETS
2018 $000
2017 $000
Current
Prepayments 422 692
Deposits - 33
Bank guarantee1 505 725
927 1,450 Note: 1. As at balance date the company had bank guarantees of $300,873 relating to property leases. The $504,635 represents a restricted bank
account to cover the company’s total available guarantee facility of $504,635.
10. PROPERTY, PLANT AND EQUIPMENT
2018 $000
2017 $000
Motor vehicles
Cost 114 475
Accumulated impairment - (115)
Accumulated depreciation (114) (360)
- -
Office equipment
Cost 4,944 7,239
Accumulated impairment - (2,124)
Accumulated depreciation (3,911) (4,318)
1,033 797
Leasehold improvements
Cost 1,810 3,091
Accumulated impairment - (1,291)
Accumulated depreciation (1,571) (1,602)
239 198
Capital works in progress
Cost 75 264
Accumulated depreciation - -
75 264
Total property, plant and equipment 1,347 1,259
For
per
sona
l use
onl
y
Notes to the Financial Statements
ASHLEY SERVICES GROUP ANNUAL REPORT 2018 46
a. Movement in carrying amounts of property, plant and equipment
The Group’s property, plant and equipment are encumbered by a fixed and floating charge as security for the group’s working capital facility (Refer Note 15).
For
per
sona
l use
onl
y
Notes to the Financial Statements
ASHLEY SERVICES GROUP ANNUAL REPORT 2018 47
11. INTANGIBLE ASSETS
2018 $000
2017 $000
Goodwill
Cost 66,256 66,256
Reclassification (1,000) (1,000)
Impairment (note 12) (62,474) (62,474)
Net carrying value 2,782 2,782
Customer relationships/Licences
Cost 2,062 2,062
Impairment (note 12) (918) (918)
Accumulated amortisation (778) (649)
Net carrying value 366 495
Brand names Cost 3,798 3,798 Reclassification 842 842 Impairment (note 12) (4,640) (4,640) Net carrying value - - Intellectual property Cost 7,471 7,471 Purchase 204 204 Reclassification 158 158 Impairment (note 12) (3,896) (3,896) Accumulated amortisation (3,937) (3,937) Net carrying value - - Total intangible assets 3,148 3,277
Note: 1. See Note 12b. 2. Customer relationships have a remaining useful life of 5 years.
12. IMPAIRMENT
a. Impairment The consolidated entity tests whether goodwill and other intangible assets have suffered any impairment on an annual basis, or more frequently, if required.
All remaining goodwill and other intangibles are confined to the Labour Hire division, with all earlier amounts previously attributed to the Training division being fully impaired across both the FY16 and FY17 financial years.
There were no indicators of impairment in relation to the Labour Hire division at 1 July 2018.
Labour Hire division The recoverable amount of the Labour Hire division has been determined based on a value in use calculation. That calculation uses cash flow projections based on financial forecasts approved by management for FY19 and a pre-tax discount rate of 18.7 per cent. Cash flows beyond that period have been held constant, reflecting the competitive nature of the industry.
Management’s key assumption is that revenues for the Labour Hire division will decrease 12% in FY19, reflecting the net impact of the loss of a major contract as previously announced and other recent customer wins and losses. EBITDA margin is forecast at 3.6% (before corporate overhead allocations).
The recoverable amounts of the CGUs were determined based on value-in-use calculations, covering detailed forecasts for five years, followed by an extrapolation of expected cash flows for the units’ remaining useful lives using the growth rates determined by management. The present value of the expected cash flows of each segment is determined by applying a suitable discount rate.
Long term growth rates after the forecast period and discount rates used were as follows:
Terminal Growth rates Pre-tax discount rates 1 Jul 2018 30 Jun 2017 1 Jul 2018 30 Jun 2017 Labour Hire 0% 0% 18.7% 18.7%
The growth rate reflects management’s view of longer-term average growth rates for the respective sectors. The discount rate reflects appropriate adjustments relating to market risk and specific risk factors of each unit.
b. Impairment charges As a result of the analysis, there is no need for any impairment charges in the FY18 results. The same analysis in the prior year resulted in an impairment charge of $8.4 million being recorded in the FY17 results, in the Training CGU as follows:
2017 Goodwill* $’000
Other Intangibles
$’000
PP&E $’000
Total $’000
Training - 5,486 2,866 8,352
Labour Hire - - 664 664
Total impairment charge for the year ended 30 June 2017 - 5,486 3,530 9,016 * All goodwill related to the Training CGU has been impaired previously.
For
per
sona
l use
onl
y
Notes to the Financial Statements
ASHLEY SERVICES GROUP ANNUAL REPORT 2018 49
These movements have reduced the net carrying amount of goodwill and other intangibles to $3.1 million as presented in note 11.
Movements in the net carrying amount of goodwill and other intangibles are presented in note 11a.
The amount of goodwill, brand names and other intangibles remaining by CGU and subject to future impairment testing is as follows:
2018 Goodwill $’000
Customer Relationships/
Licences $’000
Brand Names $’000
Intellectual Property
$’000
Total $’000
Training - - - - -
Labour Hire 2,782 366 - - 3,148
Total 2,782 366 - - 3,148
2017 Goodwill $’000
Customer Relationships/
Licences $’000
Brand Names $’000
Intellectual Property
$’000
Total $’000
Training - - - - -
Labour Hire 2,782 495 - - 3,277
Total 2,782 495 - - 3,277
c. Sensitivity analysis Management has also run various sensitivity scenarios, primarily reviewing sensitivity of outcomes to FY19 EBITDA forecasts, long term growth rates and discount rates. In respect of reasonably possible changes in the key assumptions, major sensitivities are summarised as follows:
Change in VIU Labour hire CGU $’M
Sustainable EBITDA margin; +/- $0.5 million each CGU +/-3.0
1% increase or decrease in long term growth rate +/-2.0
1% increase or decrease in pre-tax discount rate +/-3.0 13. TAX BALANCES
2018 $000
2017 $000
Current assets
Income tax receivable - 285
Non-current assets
Deferred tax assets (a) 5,398 7,281
Current tax liabilities
Income tax payable - -
Non-current liabilities
Deferred tax liabilities (a) 1,782 1,616
For
per
sona
l use
onl
y
Notes to the Financial Statements
ASHLEY SERVICES GROUP ANNUAL REPORT 2018 50
a. Deferred tax assets and liabilities
Deferred taxes arising from temporary differences and unused tax losses can be summarised as follows:
2018
Balance at Beginning of
the Year $000
Recognised in Other
comprehensive income
$000
Recognised in Business
Combination $000
Recognised in Profit &
Loss $000
Balance at End of the
Year $000
Current assets Trade, other receivables and other assets
(1,241) - - (264) (1,505)
Non-current assets
Intangible assets - - - 26 26
Property, plant and equipment 593 - - (278) 315
Current liabilities
Trade and other payables 4,333 - - (1,491) 2,842
Provision 909 - - 488 1,397
2016 Tax loss carried forward
Deferred tax asset 1,071 - - (531) 540
Total 5,665 - - (2,049) 3,616
2017
Balance at Beginning of
the Year $000
Recognised in Other
comprehensive income
$000
Recognised in Business
Combination $000
Recognised in Profit &
Loss $000
Balance at End of the
Year $000
Current assets Trade, other receivables and other assets
(2,349) - - 1,108 (1,241)
Non-current assets
Intangible assets (860) - - 860 -
Property, plant and equipment - - - 593 593
Current liabilities
Trade and other payables 3,558 - - 775 4,333
Provision 2,365 - - (1,456) 909
2016 Tax loss carried forward
Deferred tax asset 1,176 - - (105) 1,071
Total 3,890 - - 1,775 5,665
For
per
sona
l use
onl
y
Notes to the Financial Statements
ASHLEY SERVICES GROUP ANNUAL REPORT 2018 51
14. TRADE AND OTHER PAYABLES
2018 $000
2017 $000
Current
Trade payables 1,650 2,003
Accrued expenses 5,009 5,502
GST payable 2,274 2,177
Sundry creditors 6,780 7,502
15,713 17,184
The average credit period on purchases of certain products and services is 30 days. No interest is charged on trade payables. The group has financial risk management policies in place to ensure that all payables are paid within the credit time frame.
15. BORROWINGS
2018 $000
2017 $000
Current
Secured liabilities
Bank guarantee (a) - 724
- 724
a. Group credit facility
2018 $000
2017 $000
Total facilities at reporting date Working capital facility 5,000 5,000 5,000 5,000 Used at reporting date Bank overdraft - - - - Unused at reporting date Working capital facility 5,000 5,000 5,000 5,000
Subsequent to year end FY16, the Company revised its funding arrangements by establishing an ‘evergreen’ invoice discount facility with a Big 4 bank at competitive rates. The Bankwest debt facility reduced from $15 million to $10 million in August 2016 and further reduced to $5 million from 1 December 2016.
On 30 January 2017, the Group was notified that the $5.0 million working capital facility had been assigned by Bankwest to Shrimpton Holdings Pty Limited, a company associated with Ross Shrimpton, Managing Director, and with shareholders of the Group.
As at 30 June 2017, the Group’s $5 million working capital facility through Shrimpton Holdings Pty Limited, remained in place. Shrimpton Holdings has fixed and floating charges over the Group’s assets, subject to conditions outlined by a separate agreement between Ashley Services Group Limited and Shrimpton Holdings Pty Limited in line with the ASX Listing Rule Waiver as granted 3 April 2017.
For
per
sona
l use
onl
y
Notes to the Financial Statements
ASHLEY SERVICES GROUP ANNUAL REPORT 2018 52
On 26 July 2017, the Company announced it had extended its $5 million working capital facility through Shrimpton Holdings Pty Limited, out for a further year to 29 October 2018, in line with the conditions outlined in the revised ASX Listing Rule Waiver as granted 17 July 2017.
On 6 August 2018, the Company announced it had extended its $5 million working capital facility through Shrimpton Holdings Pty Limited, out for a further period to 31 January 2020, in line with the conditions outlined in the revised ASX Listing Rule Waiver as granted 1 August 2018.
16. PROVISIONS
2018 $000
2017 $000
Current
Employee benefits (a) 2,169 2,570
Provision for discontinued operation (b) 604 547
Total 2,773 3,117
Non-current
Employee benefits (a) 722 158
Provision for discontinued operation (b) 1,162 1,502
Total 1,884 1,660
a. Reconciliation of employee provisions
2018 $000
2017 $000
Opening balance 2,728 3,561
Less: leave taken during the year (1,343) (1,502)
Add: leave provided for during the year 1,506 669
Closing balance 2,891 2,728
b. Provision for discontinued operation During the second half of financial year ended 30 June 2017, the Board approved an orderly exit from the international and domestic hospitality student business originally acquired through the SILK acquisition in April 2015. The Group has fulfilled its obligations for the remaining students and the Registered Training Organisation (“RTO”) has been deregistered through the Australian Skills Quality Authority (“ASQA”).
The $1.77 million provision at end 1 July 2018 (2017: $2.05 million) represents the discounted cost of future surplus lease obligations.
For
per
sona
l use
onl
y
Notes to the Financial Statements
ASHLEY SERVICES GROUP ANNUAL REPORT 2018 53
17. SHARE CAPITAL
The Company does not have any share options on issue as at the date of this report. Details of share capital of the group are as follows:
a. Ordinary shares The reduction in Share Capital from 150,000,000 shares ($149.9m) at 30 Jun 16 to 143,975,904 shares ($148.8m) at 1 July 2018 was the result of the cancellation of 6,024,096 shares issued by way of consideration to fund the purchase of Integracom as approved by shareholders at the AGM of 9 November 2016.
Ordinary shares confer on their holders the right to participate in dividends declared by the Board. Ordinary shares confer on their holders an entitlement to vote at any general meeting of the Company.
b. Performance rights As at 30 June 2015, the Group had issued 380,788 Performance rights. During the financial year ended 30 June 2016 the Group issued 1,561,668 Performance Rights to employees. These Performance Rights were granted on the 25th September 2015 with a fair value of 52.5 cents per right. The terms of the Performance Plan have been outlined in the Directors’ Report (Table 7) within this Annual Report.
During the financial year ended 1 July 2018 the Group cancelled 206,842 Performance Rights for Nil consideration following an employee leaving the company. This followed on from the cancellation of 1,390,878 Performance Rights during the financial year ended 30 June 2017, again for Nil consideration following various employees leaving the company.
As at 1 July 2018 their remains 344,736 Performance Rights on issue.
Management have assessed the probability of the performance hurdles for the 2015 and 2016 plans being met as Nil and no expense has been recognised in the profit and loss account for the financial years ended 30 June 2016, 30 June 2017 and 1 July 2018.
The plan has been suspended for the financial years ending 30 June 2017 and 1 July 2018.
18. COMMON CONTROL RESERVE
The common control reserve has arisen following the adoption of the pooling of interests method used to account for the 1 July 2014 acquisition of the following entities: • ADV Services Pty Limited; • Ashley Institute Holdings Pty Limited; • TBRC Holdings Pty Limited; • Tracmin Pty Limited; and • Australian Institute of Vocational Development Pty Limited.
For
per
sona
l use
onl
y
Notes to the Financial Statements
ASHLEY SERVICES GROUP ANNUAL REPORT 2018 54
19. EARNINGS PER SHARE
2018 $000
2017 $000
Net profit / (loss) after tax 4,789 (5,969) Weighted number of ordinary shares outstanding during the year used in calculating basic earnings per share (EPS) 143,975,904 146,143,917 Weighted number of ordinary shares outstanding during the year used in calculating diluted earnings per share (EPS) 143,975,904 146,143,917 Basic earnings per share (cents) from continuing operations 3.33 (3.72) Diluted earnings per share (cents) from continuing operations 3.33 (3.72) Basic earnings per share (cents) from discontinued operations - (0.36) Diluted earnings per share (cents) from discontinued operations - (0.36) Basic earnings per share (cents) Total 3.33 (4.08) Diluted earnings per share (cents) Total 3.33 (4.08)
With no likelihood of the remaining Performance Rights vesting, the 344,736 Performance Rights have not been included in the calculation.
20. SEGMENT INFORMATION
The Group’s management identifies two operating segments, Labour Hire and Training, representing the main products and services provided by the Group. During the financial year ended 1 July 2018, there have been no changes from prior periods in the measurement methods used to determine operating segments and reported segment profit or loss. The revenues and profit generated by each of the Group’s operating segments are summarised as follows:
2018 Labour Hire
$000 Training
$000 Total $000
Revenue From external customers 326,067 6,736 332,803 Segment revenue 326,067 6,736 332,803 Other income 594 182 776 Employment cost (312,006) (4,683) (316,689) Depreciation and amortisation expense (335) - (335) Finance costs (18) (4) (22) Other expenses (2,865) (2,185) (5,050) Segment Profit 11,437 46 11,483 Unallocated items (4,645) Profit before income tax 6,838 Income tax expense (2,049) Profit after income tax 4,789 Other comprehensive income - Total comprehensive income for the year from continuing operations
4,789
For
per
sona
l use
onl
y
Notes to the Financial Statements
ASHLEY SERVICES GROUP ANNUAL REPORT 2018 55
2017 Labour Hire
$000 Training
$000 Total $000
Revenue From external customers 289,198 25,498 314,696 Segment revenue 289,198 25,498 314,696 Other income 636 10 646 Employment cost (279,192) (19,332) (298,524) Depreciation and amortisation expense (385) (1,267) (1,652) Finance costs (10) - (10) Other expenses (2,833) (4,739) (7,572) Impairment of intangibles - (5,486) (5,486) Impairment of PP&E (664) (2,866) (3,530) Restructuring expense - (678) (678) Selective reduction of capital and cancellation of shares - 1,114 1,114 NSW Department finalisation costs - (738) (738) Segment Profit/(loss) 6,750 (8,484) (1,734) Unallocated items (5,668) Loss before income tax (7,402) Income tax benefit 1,967 Loss after income tax (5,435) Other comprehensive income - Total comprehensive loss for the year from continuing operations (5,435)
No segments assets or liabilities are disclosed because there is no measure of segments assets or liabilities regularly reported to Management and to the Board.
a. Information about major customers Included in revenues from external customers are revenues of $143.3 million (2017: $118.3 million) which arose from sales to 3 (2017: 3) of the Group’s customers whose individual revenue exceeds 10% of total revenue in the Labour Hire segment. Sales to these 3 customers were $57.9 million, $54.4 million and $31.0 million respectively (2017: $54.6 million, $33.1 million and $30.6 million respectively).
There are no customers whose individual revenue exceeded 10% of total revenue in the Training segment in either financial year.
For
per
sona
l use
onl
y
Notes to the Financial Statements
ASHLEY SERVICES GROUP ANNUAL REPORT 2018 56
21. DISCONTINUED OPERATIONS
a. Financial year ended 30 June 2017: SILK
During the second half of the financial year ended 30 June 2017, the Board approved an orderly exit from the international and domestic hospitality student business originally acquired through the SILK acquisition in April 2015. The Group has fulfilled its obligations for the remaining students and the Registered Training Organisation (“RTO”) has been deregistered through the Australian Skills Quality Authority (“ASQA”). The $534,000 (SILK $138,000, Cantillon $396,000) represents the after tax trading loss incurred during the financial year.
Discontinued operation 2018 $000
2017 $000
Revenue - 845 Other income - 1 Employment cost - (1,265) Depreciation and amortisation expense - (65) Finance costs - - Other expenses - (216) Surplus lease provision - - Other exit costs - - Loss before income tax - (700) Income tax credit - 166 Loss after tax - (534) Total comprehensive loss for the year - (534)
Cash flows from the discontinued operations were:
Discontinued operation 2018 $000
2017 $000
Receipts from customers - 1,769 Payments to suppliers and employees - (1,930) Income taxes paid - (39) Net cash used in operating activities - (200) Payments for property, plant and equipment - (6) Net cash used in investing activities - (6) (Repayment) of external borrowings - - Net cash used in financing activities - - Net decrease in cash and cash equivalents - (206)
For
per
sona
l use
onl
y
Notes to the Financial Statements
ASHLEY SERVICES GROUP ANNUAL REPORT 2018 57
22. CASH FLOW INFORMATION
Reconciliation of cash flow from operations to loss after income tax
2018 $000
2017 $000
Profit / (Loss) for the year
4,789 (5,969)
Cash flows excluded from profit attributable to operating activities
Adjustments for non-cash items:
- Depreciation and amortisation expense
660 1,919
- Bad and doubtful debts
62 194
- Profit on disposal of fixed assets
(3) (46)
- Gain on reassessment of deferred consideration liabilities - (338) - Impairment of intangibles - 5,486
- Impairment of PP&E - 3,530
- Cancellation of shares issued on acquisition - (1,114)
- Changes in assets and liabilities
- Decrease/(increase) in trade and other receivables
(3,148) 1,393
- Decrease/(increase) in other assets 523 205
- Decrease/(increase) in deferred tax asset 1,883 309
- (Decrease)/increase in trade and other payables (1,371) (1,798)
- (Decrease)/increase in provisions (120) (1,295)
- (Decrease)/increase in current tax receivables (285) 2,553
- (Decrease)/increase in deferred tax liabilities 166 (2,084)
Net cash from operating activities 3,156 2,945
23. BUSINESS COMBINATION
The Group made no acquisitions during the financial year ended 1 July 2018 and also the previous financial year ended 30 June 2017. Final vendor earn-out payments were made during prior year relating to acquisitions from prior periods.
For
per
sona
l use
onl
y
Notes to the Financial Statements
ASHLEY SERVICES GROUP ANNUAL REPORT 2018 58
24. CONTROLLED ENTITIES
Set out below are the controlled entities of Ashley Services Group Limited:
Country of
incorporation
2018 percentage owned
%
2017 percentage owned
% Action Arndell Park Pty Limited Australia 100 100 Action Botany Pty Limited Australia 100 100 Action James (Qld) Pty Limited Australia 100 100 Action James Mascot Pty Limited Australia 100 100 Action James NSW Pty Limited Australia 100 100 Action James Parramatta Pty Limited Australia 100 100 Action James WCF Pty Limited Australia 100 100 Action James Western Suburbs Pty Limited Australia 100 100 Action Job Support Pty Limited Australia 100 100 Action MMX Pty Limited Australia 100 100 Action Workforce AC Pty Limited Australia 100 100 Action Workforce ACT Pty Limited Australia 100 100 Action Workforce BAX1 Pty Limited Australia 100 100 Action Workforce CAT Pty Limited Australia 100 100 Action Workforce COL1 Pty Limited Australia 100 100 Action Workforce COS1 Pty Limited Australia 100 100 Action Workforce COT Pty Limited Australia 100 100 Action Workforce IMT Pty Limited Australia 100 100 Action Workforce LIN1 Pty Limited Australia 100 100 Action Workforce NSW Pty Limited Australia 100 100 Action Workforce OS Pty Limited Australia 100 100 Action Workforce OSI 1 Pty Limited Australia 100 100 Action Workforce OST Pty Limited Australia 100 100 Action Workforce Pty Limited Australia 100 100 Action Workforce T1 Pty Limited Australia 100 100 Action Workforce T2 Pty Limited Australia 100 100 Action Workforce VAPS Pty Limited Australia 100 100 Action Workforce VER1 Pty Limited Australia 100 100 Action Workforce Victoria Pty Limited Australia 100 100 Action Workforce VM Pty Limited Australia 100 100 Action Workforce VPS Pty Limited Australia 100 100 ADV Services Pty Limited Australia 100 100 ADV1 Pty Limited Australia 100 100 ADV2 Pty Limited Australia 100 100 ADV3 Pty Limited Australia 100 100 ADV4 Pty Limited Australia 100 100 ADV5 Pty Limited Australia 100 100 ADV6 Pty Limited Australia 100 100 ADV7 Pty Limited Australia 100 100
For
per
sona
l use
onl
y
Notes to the Financial Statements
ASHLEY SERVICES GROUP ANNUAL REPORT 2018 59
Country of
incorporation
2018 percentage owned
%
2017 percentage owned
% ADV8 Pty Limited Australia 100 100 ADV9 Pty Limited Australia 100 100 Advance BGT Pty Limited Australia 100 100 Advance Exchange Pty Limited Australia 100 100 Advance GW Pty Limited Australia 100 100 Advance GX Pty Ltd Australia 100 100 Advance KM Pty Limited Australia 100 100 Advance LLA Pty Limited Australia 100 100 Advance MAN Pty Limited Australia 100 100 Advance MIX Pty Limited Australia 100 100 Advance Recruitments Pty Limited Australia 100 100 Advance WL Pty Limited Australia 100 100 Advance WLE Pty Limited Australia 100 100 Advance WLT Pty Limited Australia 100 100 Advance WMPM Pty Limited Australia 100 100 AIVD Holdings Pty Limited Australia 100 100 ASG Integracom (AUST) Holdings Pty Limited Australia 100 100 ASG Integracom (AUST) Pty Limited Australia 100 100 Ash Pty Limited Australia 100 100 Ashley Apprenticeship Network Pty Limited Australia 100 100 Ashley Institute Holdings Pty Limited Australia 100 100 Australian Institute of Vocational Development Pty Limited Australia 100 100 AWF Training 1 Pty Limited Australia 100 100 AWF Training 2 Pty Limited Australia 100 100 AWF Training 3 Pty Limited Australia 100 100 AWF Training 4 Pty Limited Australia 100 100 AWF Training 5 Pty Limited Australia 100 100 Cantillon Holdings Pty Limited2 Australia 100 100 Capra Ryan Online Learning Pty Limited Australia 100 100 College of Innovation and Industry Skills Pty Limited3 Australia 100 100 Concept AWF Pty Limited (formerly Advance TR Pty Limited) Australia 100 100 Concept Employment (Aust) Pty Limited Australia 100 100 Concept Engineering (Aust) Pty Limited Australia 100 100 Concept Project Resources Pty Limited (formerly Action Workforce VPN Pty Limited)
Australia 100 100
CP Action Electronics Pty Limited Australia 100 100 CP Action Workforce Pty Limited Australia 100 100 ECA Chullora Pty Limited Australia 100 100 ECA Plastics Pty Limited Australia 100 100 Executive Careers Australia Pty Limited Australia 100 100 Global Education and Training Group Pty Limited4 Australia 100 100 Integracom Holdings Pty Limited Australia 100 100 Integracom Unit Trust1 Australia 100 100 James Personnel Pty Limited Australia 100 100 James Warehousing Pty Limited Australia 100 100 Logistics People Pty Limited (formerly Action WA Pty Limited) Australia 100 100
Silk Group Holdings Pty Limited Australia 100 100 TBRC Holdings Pty Limited Australia 100 100 The Blackadder Recruitment Company Pty Limited Australia 100 100 Tracmin Holdings Pty Limited Australia 100 100 Tracmin Pty Limited Australia 100 100 Training Support Group Pty Limited Australia 100 100 Vocational Training Australia Pty Limited Australia 100 100 Notes: 1. Integracom Unit Trust was acquired on 21 August 2014. 2. Cantillon Holdings Pty Limited was a company incorporated on 19 September 2014. 3. College of Innovation and Industry Skills Pty Limited (Cantillon) was a company acquired on 25 September 2014. 4. Global Education and Training Group Pty Limited (SILK) was a company acquired on 30 April 2015.
25. PARENT ENTITY DISCLOSURES
a. Financial position
2018 $000
2017 $000
Assets Current assets 92 92 Non-current assets 17,028 17,028 Total assets 17,120 17,120 Liabilities Current liabilities - 724 Non-current liabilities - - Total liabilities - 724 Net assets 17,120 16,396 Equity Share capital 148,815 148,815 Common control reserve (57,687) (57,687) Accumulated losses (74,008) (74,732) Total equity 17,120 16,396
b. Statement of profit or loss and other comprehensive income
2018 $000
2017 $000
Loss for the year (724) (5,095) Other comprehensive income - - Total comprehensive loss (724) (5,095)
c. Guarantees entered into by the parent entity in relation to the debts of its subsidiaries
The Parent entity and some of its subsidiaries are party to a deed of cross guarantee under which each company guarantees the debts of the others. No deficiencies of assets exist in any of these subsidiaries.
For
per
sona
l use
onl
y
Notes to the Financial Statements
ASHLEY SERVICES GROUP ANNUAL REPORT 2018 61
d. Contingent liabilities of the Parent Entity
The Parent entity had one contingent liability as at 1 July 2018.
Ashley Services Group Limited (ASH) is the respondent in a class action that was commenced in the Federal Court of Australia (NSW Registry) on 1 December 2016 on behalf of a group of shareholders (see Note 28 for more detail).
e. Commitments for expenditure for the Parent entity The Parent entity had Nil committed expenditure as at 1 July 2018 (30 June 2017: Nil).
26. DEED OF CROSS GUARANTEE
The following entities have entered into a deed of cross guarantee dated 22 February 2018 under which each company guarantees the debts of the others:
By entering into the deed, the wholly-owned entities have been relieved from the requirement to prepare financial statements and directors' report under Corporations Instrument 2016/785 issued by the Australian Securities and Investments Commission.
The above companies represent a 'Closed Group' for the purposes of the Corporations Instrument, and as there are no other parties to the deed of cross guarantee that are controlled by Ashley Services Group Limited, they also represent the 'Extended Closed Group'.
a. Statement of profit or loss and other comprehensive income
Extended Closed Group 20181 $000
Revenue 315,052 Other Income 594 Employment costs (301,657) Depreciation and amortisation expense (287) Finance costs (18) Other expenses (3,286) Profit before income tax 10,398 Income tax credit/(expense) (3,119) Profit after income tax 7,279 Other Comprehensive Income - Total comprehensive income for the year 7,279 Notes: 1. The Statement of profit or loss and other comprehensive income for the extended group is presented for the financial year ended 1 July
2018, as it is deemed that this information is more relevant to users of the financial report than if the period 22 February 2018 to 1 July 2018 was presented.
For
per
sona
l use
onl
y
Notes to the Financial Statements
ASHLEY SERVICES GROUP ANNUAL REPORT 2018 62
b. Statement of Financial position
Extended Closed Group
1 Jul 2018 $000
Assets
Current assets
Cash and cash equivalents 4,571
Trade and other receivables 28,318
Other assets 161
Total current assets 33,050
Non-current assets
Trade and other receivables 71,756
Property, plant and equipment 800
Deferred tax assets 3,485
Other 17,028
Total non-current assets 93,068
Total assets 126,118
Liabilities
Current liabilities
Trade and other payables 27,095
Current tax payable 6,783
Provisions 1,707
Total current liabilities 35,585
Non-current liabilities
Deferred tax liabilities (114)
Provisions 557
Total non-current liabilities 443
Total liabilities 36,028
Net assets 90,090
Equity
Share capital 148,815
Common control reserve (57,687)
Accumulated losses (1,038)
Total Equity 90,090
c. Equity – retained profits
Extended Closed Group
1 Jul 2018 $000
Retained profits at the beginning of the financial year (7,325) Adjustment to opening retained profits (992) Profit after income tax expense 7,279 Dividends paid - Retained profits at the end of the financial year (1,038)
For
per
sona
l use
onl
y
Notes to the Financial Statements
ASHLEY SERVICES GROUP ANNUAL REPORT 2018 63
d. Contingent liabilities of the Extended Closed Group
The Extended Closed Group had one contingent liability as at 1 July 2018.
Ashley Services Group Limited (ASH) is the respondent in a class action that was commenced in the Federal Court of Australia (NSW Registry) on 1 December 2016 on behalf of a group of shareholders (see Note 28 for more detail).
e. Commitments for expenditure for the Extended Closed Group The Extended Closed Group had Nil committed expenditure as at 1 July 2018.
f. Going Concern and Financial Support
The financial statements of the Extended Closed Group have been prepared on a going concern basis. The directors have provided a letter of financial support confirming that each of the below listed companies within the Ashley Services group Limited and controlled entities agrees to provide whatever financial support is necessary to ensure each entity will be able to continue as a going concern and pays its debts as and when they fall due and payable.
The financial support covers the following entities: • Ashley Services Group Limited; • Action Workforce Pty Limited; • Concept Engineering (Aust.) Pty Ltd; • ASH Pty Ltd; • Vocational Training Australia Pty Ltd; • Australian Institute of Vocational Development Pty Ltd; and • Tracmin Pty Ltd.
The financial support includes but is not limited to the actions as noted below:
• not calling on related party loans; • agreeing to any cost re-allocations or management fee re-charges; and • agreeing to debt forgiveness with any related entity.
The undertaking remains current until the date on which the directors approve the financial statements of the Group for the financial year ending 30 June 2019. The directors are satisfied that collectively the Group has the financial ability to provide this support.
g. Security Offered
Shrimpton Holdings has fixed and floating charges over the Extended Closed Group’s assets, subject to conditions outlined by a separate agreement between Ashley Services group Limited, the parent company, and Shrimpton Holdings Pty Limited in line with the ASX Listing Rule Waiver as granted 1 August 2018.
Ashley Services Group Limited (ASH) is the respondent in a class action that was commenced in the Federal Court of Australia (NSW Registry) on 1 December 2016 on behalf of a group of shareholders (see Note 28 for more detail).
For
per
sona
l use
onl
y
Notes to the Financial Statements
ASHLEY SERVICES GROUP ANNUAL REPORT 2018 64
27. RELATED PARTY TRANSACTIONS
a. Parent company There is no ultimate parent company for Ashley Services Group Limited.
b. Transactions with related entities Transactions between related parties are on normal commercial terms and conditions no more favourable than those available to other parties unless otherwise stated.
Transactions with related parties are as follows:
20182
$ 20172
$ Rent and outgoings paid or payable to Shrimpton Holdings Pty Limited as trustee for the Shrimpton Family Trust, an entity which is controlled by Mr Ross Shrimpton for the head office at Arndell Park, New South Wales1 3,125 436,540 Loan balances from entities associated with Mr Ross Shrimpton. These are unsecured and non-interest bearing loans and are in place as security for the Bank Guarantee facility provided through Bankwest. - 723,618 Interest and line fee paid to Shrimpton Holdings Pty Limited, an entity which is controlled by Mr Ross Shrimpton 199,706 78,402 Fees payable to Trood Pratt & Co (of which Ian Pratt is a Partner) for taxation services 83,170 97,808
Note: 1. 2018 amount is for Outgoings only whilst 2017 amount includes Rent/Outgoings payment for FY17 ($214,717) and prepayment for FY18
($221,823). 2. All amounts as shown are exclusive of GST.
28. SECURED AND CONTINGENT LIABILITIES
For assets pledged as security for borrowing facilities see Note 15.
Ashley Services Group Limited (ASH) is the respondent in a class action that was commenced in the Federal Court of Australia (NSW Registry) on 1 December 2016 on behalf of a group of shareholders. The allegations against ASH include that its prospectus, dated 7 August 2014, contained certain misstatements and omissions in contravention of the Corporations Act 2001 (Cth), that ASH contravened the continuous disclosure provisions and that it engaged in misleading and deceptive conduct during the period August 2014 to April 2015. ASH is vigorously defending this proceeding. The potential liability and costs in respect of the proceeding cannot be accurately assessed at this time, but the existence of this matter has entailed the necessity for disclosure as a contingent liability.
The Group had no other known material contingent liabilities at 1 July 2018.
29. FINANCIAL INSTRUMENTS
a. Significant accounting policies Details of the significant accounting policies and methods adopted, including the criteria for recognition, the basis of measurement and the basis on which income and expenses are recognised, in respect of each class of financial asset and financial liability are disclosed in Note 1 to the financial statement.
b. Financial risk management objectives The Board of Directors has overall responsibility for the establishment and oversight of the Group’s financial management framework. The Board has an established Audit and Risk Management Committee which is responsible for developing and monitoring the Group’s financial management policies. The Committee provides regular reports to the Board of Directors on its activities.
For
per
sona
l use
onl
y
Notes to the Financial Statements
ASHLEY SERVICES GROUP ANNUAL REPORT 2018 65
The Audit and Risk Management Committee oversees how management monitors compliance with risk management policies and procedures and reviews the adequacy of the risk management framework in relation to the risks.
The main risks arising from the Group’s financial instruments are market risk (including fair value interest rate risk), credit risk and liquidity risk. The Board reviews and approves policies for managing each of these risks.
The Audit and Risk Management Committee oversees how management monitors compliance with risk management policies and procedures and review the adequacy of the risk management framework in relation to the risks. The Group does not enter into or trade financial instruments, including derivative financial instruments, for speculative purpose.
c. Market risk Interest rate risk The Group is exposed to interest rate risk associated with borrowed funds at floating interest rates. During the financial year, risks associated with interest rate movements were monitored by the Board; however, no hedging instruments were considered necessary to manage the risk.
The Group’s exposures to interest rates on financial assets and financial liabilities are detailed in the liquidity risk management section of this note.
Interest rate sensitivity The sensitivity analyses below have been determined based on the exposure to interest rates at the reporting date and the stipulated change taking place at the beginning of the financial year and held constant throughout the reporting period. A 100 basis point increase or decrease is used when reporting interest rate risk internally to key management personnel and represents management’s assessment of the possible change in interest rates.
At the reporting date, if interest rates had been 100 basis points higher or lower and all other variables were held constant, the effect on the Group would be as follows:
2018 $000
2017 $000
Change in profit
Increase in interest rates of 1% 78 73
Decrease in interest rates of 1% (78) (73)
Change in equity
Increase in interest rates of 1% 78 73
Decrease in interest rates of 1% (78) (73)
Credit risk
Credit risk refers to the risk that a counterparty will default on its contractual obligations, resulting in financial loss to the Group. The Group has adopted a policy of only dealing with creditworthy counterparties and obtaining sufficient collateral where appropriate, as a means of mitigating the risk of financial loss from defaults.
Trade receivables consist of a large number of customers. Ongoing credit evaluation is performed on the financial condition of accounts receivable.
The carrying value of trade receivables recorded in the financial statements, net of any impairment allowances, represents the Group’s maximum exposure to credit risks.
For
per
sona
l use
onl
y
Notes to the Financial Statements
ASHLEY SERVICES GROUP ANNUAL REPORT 2018 66
The Group does not have any significant credit risk exposure to any single counterparty or any group of counterparties having similar characteristics. The credit risk on liquid funds is limited because the counter parties are a reputable bank with high quality external credit ratings.
The maximum credit risk exposure of financial assets is their carrying amount in the financial statements.
d. Liquidity risk management Ultimate responsibility for liquidity risk management rests with the Managing Director and Board of Directors, who have built an appropriate liquidity risk management framework for the management of the Group’s short, medium and long-term funding and liquidity management requirements.
The Group manages liquidity risk by maintaining adequate reserves, banking facilities and reserve borrowing facilities by continuously comparing actual cash flows with forecasts and matching the maturity profiles of financial assets and liabilities. Included in Note 15 is a listing of additional undrawn facilities that the Group has at its disposal to further reduce liquidity risk.
Liquidity and interest risk tables The following table details the Group’s remaining contractual maturity for its non-derivative financial liabilities. The table has been presented based on the undiscounted cash flows of financial liabilities based on the earliest date on which the Group may be required to pay. The table includes both interest and principal cash flows.
Financial liabilities
2018
Weighted average effective interest
rate % Within 1 year
$000 1 to 5 years
$000 Over 5 years
$000 Total $000
Trade and other payables n/a 15,713 - - 15,713 Borrowings – working capital facility 5.85% - - - - Bank guarantee (refer Note 15) 0% - - - - Total 15,713 - - 15,713
2017
Weighted average effective interest
rate % Within 1 year
$000 1 to 5 years
$000 Over 5 years
$000 Total $000
Trade and other payables n/a 17,184 - - 17,184 Borrowings – working capital facility 5.85% - - - - Bank guarantee (refer Note 15) 0% 724 724 Total 17,908 - - 17,908
Fair value of financial instruments Financial assets and financial liabilities measured at fair value in the statement of financial position are grouped into three levels of a fair value hierarchy. The three levels are defined based on the observability of significant inputs to the measurement, as follows:
• level 1 – the fair value of financial assets and financial liabilities with standard terms and conditions and traded on active liquid markets is determined with reference to quoted market prices;
• level 2 – the fair value of other financial assets and liabilities is determined in accordance with generally accepted pricing models based on discounted cash flow analysis using prices from observable current market transactions; and
For
per
sona
l use
onl
y
Notes to the Financial Statements
ASHLEY SERVICES GROUP ANNUAL REPORT 2018 67
• level 3 – where quoted prices are not available, use is made of discounted cash flow analysis using the applicable yield curve for the duration of the instruments for non-optional derivatives, and option pricing models for optional derivatives.
The Directors consider that the carrying amounts of financial assets and financial liabilities recorded at amortised cost in the financial statements approximate their fair values.
30. OPERATING LEASE COMMITMENTS
Leases as lessee Non-cancellable operating lease rentals are payable as follows:
20181 $000
20171 $000
Leases as lessee Less than one year 1,400 1,662 Between one and five years 2,588 2,249 Total 3,988 3,911
Note: 1. All amounts as shown are exclusive of GST
The Group leases a number of offices under operating leases. The leases run over varying periods, some with option periods. Some of the leases have fixed rate rental periods, and some have market rate rental adjustments.
31. EVENTS AFTER THE REPORTING DATE
No matters or circumstances have arisen since the end of the financial year which significantly affected or could significantly affect the operations of the Group, the results of those operations, or the state of affairs of the Group in future financial years, except for the following:
On 6 August 2018, the Company announced it had extended its $5 million working capital facility through Shrimpton Holdings Pty Limited, a company associated with Ross Shrimpton, Managing Director, and with shareholders of the Group, out from 29 October 2018 out until 31 January 2020.
32. EMPLOYEE SHARE RIGHTS PLAN
The Company implemented a performance rights share plan for its executives, which operated during the financial years ended 30 June 2015 and 30 June 2016. The terms of the 2016 Performance Plan have been outlined in the Directors’ Report (Table 7) within this Annual Report.
The plan has been suspended for the financial years ending 30 June 2017 and 1 July 2018. No Performance Rights were issued during the financial years ended 1 July 2018 or 30 June 2017, see Note 17b.
For
per
sona
l use
onl
y
Notes to the Financial Statements
ASHLEY SERVICES GROUP ANNUAL REPORT 2018 68
33. DIVIDENDS a. Ordinary shares On 26 July 2018 the Group declared a fully franked final dividend of 2.5 cents in relation to the financial year ended 1 July 2018. No dividends were declared or paid in relation to the previous year ended 30 June 2017.
b. Franking credits
2018 $000
2017 $000
Franking credits available for subsequent financial years based on a tax rate of 30% (2017: 30%) 742 1,027
The balance of the franking accounts includes: • franking credits that arose from the payment of the amount of the provision for income tax; • franking debits that arise from the refund of the amount of the provision for income tax; • franking debits that arise from the payment of dividends recognised as a liability at the reporting date; and • franking credits that arise from the receipt of dividends recognised as receivables at the reporting date.
For
per
sona
l use
onl
y
ASX Additional Information
ASHLEY SERVICES GROUP ANNUAL REPORT 2018 69
Set out below is additional information as required by the ASX Limited Listing Rules and not disclosed elsewhere in this report. This information is effective as at 2 August 2018.
Number of security holders and securities on issue
Quoted equity securities Ashley Services has on issue 143,975,904 fully paid ordinary shares which are held by 623 shareholders.
Voting rights
Quoted equity securities The voting rights attached to fully paid ordinary shares are that on a show of hands, every member present, in person or proxy, has one vote and upon a poll, each share shall have one vote.
Holding Number of shareholders Number of shares % 1 – 1,000 162 122,683 0.09 1,001 – 5,000 148 341,703 0.24 5,001 – 10,000 54 436,381 0.30 10,001 – 100,000 179 6,651,676 4.62 100,001 and over 80 136,423,461 94.75 Total 623 143,975,904 100.00
Unmarketable parcel of shares
The number of shareholders holding less than a marketable parcel of Fully Paid Ordinary shares is 224 with a total number of shares held is 197,306.
Substantial Shareholders
The number of securities held by substantial shareholders and their associates are set out below:
Fully Paid Ordinary Shares Name Number % Ross Shrimpton 80,279,030 55.76% JP Morgan Nominees Australia Limited ATF Viburnum Funds Pty Ltd 10,492,852 7.29%
Unquoted equity securities
There are no unquoted shares.
On-market buy-back
There is no current on-market buy-back.
For
per
sona
l use
onl
y
ASX Additional Information
ASHLEY SERVICES GROUP ANNUAL REPORT 2018 70
Twenty largest shareholders
Fully paid ordinary shares Details of the 20 largest shareholders of quoted securities (grouped) by registered shareholding are:
Name Number of shares % Ross Shrimpton 80,279,030 55.76% JP Morgan Nominees Australia Limited 10,529,117 7.31% JJC Group (Aust) Pty Ltd 3,755,832 2.61% Moat Investments Pty Ltd 3,300,000 2.29% Hishenk Pty Ltd 2,650,000 1.84% Action James Holdings Pty Limited 2,220,970 1.54% HSBC Custody Nominees (Australia) Limited 2,163,341 1.50% BNP Paribas Nominees Pty Ltd 1,675,743 1.16% Aust Executor Trustees Ltd 1,582,009 1.10% Mr Andrew Douglas Shrimpton 1,500,000 1.04% Mr Dean Michael Shrimpton 1,500,000 1.04% Mr Marc Shrimpton 1,500,000 1.04% Kingston Properties Pty Limited 1,390,122 0.97% Wide Eagle Pty Ltd 1,000,000 0.69% Mr Marcus Andrew Levy and Vanessa Sanchez-Levy 1,000,000 0.69% Mr Richard Ewan Bromley Mews & Mrs Wee Khoon Mews 820,001 0.57% Ms Hui Tan 800,000 0.56% Mast Financial Pty Ltd 773,357 0.54% Mr Richard Ewan Bromley Mews 750,000 0.52% Huntingdale Management Pty Ltd 609,650 0.42% Total 119,799,172 83.21%
Annual General Meeting
The annual general meeting of the Company will be held at the company’s offices at Level 10, 92 Pitt Street Sydney NSW 2000 at 10.00am on Thursday 25 October 2018. Shareholders who are unable to attend the meeting are encouraged to complete and return their proxy form that will accompany the notice of meeting.
For
per
sona
l use
onl
y
Corporate Directory
ASHLEY SERVICES GROUP ANNUAL REPORT 2018 71
Non-Executive Directors
Mr Ian Pratt (Chairman)
Executive Directors
Mr Ross Shrimpton – Managing Director Mr Chris McFadden
Company Secretary
Mr Ron Hollands
Registered Office
Level 10 92 Pitt Street Sydney NSW 2000
Australian Company Number
094 747 510
Australian Business Number
92 094 747 510
Auditors
HLB Mann Judd Level 19 207 Kent Street Sydney NSW 2000 Telephone: + 61 2 9020 4000 Facsimile: + 61 2 9020 4190
Bankwest Level 16 45 Clarence Street Sydney NSW 2000 Telephone: + 61 2 9276 8000 Facsimile: 1300 453 796
Share Registry
Link Market Services Limited Central Park, Level 4 152 St Georges Terrace Perth WA 6000 Telephone: +61 1300 554 474 Facsimile: +61 2 9287 0303 Website: www.linkmarketservices.com.au