80
Hastie Group Limited ACN 112 803 040 Annual financial report for the year ended 30 June 2011 For personal use only

Hastie Group Limited ACN 112 803 040
Annual financial report for the year
ended 30 June 2011
For
per
sona
l use
onl
y

��
Annual financial report for the year ended 30 June 2011 �������
Page �
Corporate governance statement 2
Directors’ report 3
Auditor’s independence declaration 21
Independent auditor’s report 22
Directors’ declaration 24
Annual financial statements
Income statement 25
Statement of comprehensive income 26
Statement of financial position 27
Statement of cash flows 28
Statement of changes in equity 29
Notes to the financial statements 30
Additional stock exchange information 78
�
For
per
sona
l use
onl
y

�������� ���������������������������
��
Corporate governance summary CORPORATE GOVERNANCE STATEMENT
Hastie Group’s Directors and management are committed to conducting the company’s business in an ethical manner and in accordance with the highest standards of corporate governance.
This statement outlines Hastie Group’s commitment to the ASX Corporate Governance Council’s Principles and Recommendations 2nd Edition.
The Board believes that Hastie Group complies with the Corporate Governance Council’s “Corporate Governance Principles and Recommendations”.
RISK MANAGEMENT
The Hastie Group is committed to the effective management of risk. This commitment is demonstrated through the establishment and implementation of the Hastie Group’s Risk Management Policy and Risk Management Framework. In addition, the Audit and Risk Management Committee ensures the Board fulfils its corporate governance and oversight responsibilities relating to:
� the quality and reliability of financial management and reporting; � ethical compliance; � risk management and internal control systems; and � external reporting.
These responsibilities include:
� promoting a culture of risk control and minimisation; � identification of existing and potential risks; � monitoring and reviewing the Group’s policies regarding risk management; � ensuring risk management processes are documented and compliant with Group policies; � reviewing and improving the Group’s financial and audit programs; � reviewing the outcomes of these independent audits; and � monitoring and reviewing the appropriateness of the internal control systems adopted by the Group and
operating businesses. Risk Profile, and assessment of effectiveness In accordance with the Risk Management Framework, the Hastie Group’s risk management systems promote the need for informed and measured decision making on risk issues firmly embedded in operational reviews and processes. At the operational level, risk is recognised, assessed, monitored and managed through a combination of delegations of authority, project review and project delivery. Based on a systematic approach, the process ensures risk control systems are implemented appropriately and effectively to mitigate the risk throughout all Group operations. To support internal resources, the Group periodically undertakes a formal, externally facilitated, review and update of the Group’s risk profile in accordance with ISO 31000. This review assists the Group in the identification, analysis, control, monitoring and management of risks within the Group and its operating businesses. Integrity of financial statements The Group Managing Director and CEO and Finance Director have stated in writing to the Board, at the time the financial statements were being considered for approval by the Board, that the financial statements present a true and fair position, and that this assertion is founded on a sound system of financial risk management and internal control in accordance with the policies adopted by the Board. To the best of their knowledge, the Hastie Group’s financial risk management and control systems are compliant with relevant Hastie Group policies and procedures and are operating efficiently and effectively in all material respects. A table comparing the list of the ASX Corporate Governance Council’s Corporate Governance Principles and Recommendations together with a summary of how Hastie Group complies with these recommendations will be included in the 2011 Annual Report. The various charters and policies are all available on the Hastie Group website: http://www.hastiegroup.com.au
For
per
sona
l use
onl
y

�������� ���������������������������
��
Directors’ Report The Board of Directors encourages full participation by shareholders at its AGM to ensure accountability and transparency. The external auditor attends the AGM to answer shareholder questions about the auditor’s report. The Directors of Hastie Group Limited submit herewith the annual financial report of the company for the financial year ended 30 June 2011. In order to comply with the provisions of the Corporations Act 2001 (Cth), the directors report as follows: The names and particulars of the directors of the company during or since the end of the financial year are:
Directors
Trevor Bourne B.Sc. (Mech Eng), MBA, FAICD Chairman, Non-Executive, Independent
Trevor was appointed chairman of Hastie Holdings Pty Ltd (“Hastie Holdings”) in November 2004, and subsequently Hastie Group Limited upon its incorporation on 4 February 2005, following a long career with some of Australia’s foremost industrial companies.
From 1999 to 2003, Trevor served as the CEO of Tenix Industries. Prior to this, he spent 15 years at Brambles Industries, including 6 years as CEO of Brambles Australia and held a number of other directorships on various Brambles subsidiaries and joint ventures.
Trevor is chair of Hastie Group’s Nomination Committee and is a member of the Audit and Risk Management and Remuneration Committees.
Other Listed Company Directorships in the previous 3 years: Origin Energy Limited February 2000 to present Caltex Australia Limited March 2006 to present
David Harris B.Sc. (Chem Eng), MBA, MAICD Group Managing Director and Chief Executive Officer, Executive
David was appointed Group Managing Director and Chief Executive Officer in June 2007. David is also Chairman of the Hastie European Advisory Board and the Hastie Middle East and International Markets Management Board. David brings with him over 20 years experience in senior leadership roles with large multinational organisations, successfully growing these across the UK, Asia Pacific and the US.
David was previously chief executive of United Group’s Services Division. Prior to this he held several senior management roles with Inchcape plc both in the UK and in Asia and Millicom International Cellular in Asia and earlier was a consultant in McKinsey’s London industrial practice for six years. He has both operational and strategy development skills and has had extensive experience in managing decentralised organisations across multiple geographies. He has also been involved in acquiring and integrating companies in Australia and overseas.
David tendered his resignation from Hastie Group on 19 August 2011, which will take effect from 30 November 2011.
Phillip Anderson CPA, FCIS, MAICD Director, Non-Executive, Independent
Phillip was appointed a director of Hastie Holdings in December 2004, and subsequently Hastie Group Limited upon its incorporation on 4 February 2005, following a long career with a range of large Australian industrial and property companies.
Phillip was a senior executive with the Lend Lease Group until 2004 and held roles such as finance director of Civil and Civic Pty Ltd and Lend Lease Property Group, and CEO of Lend Lease Development Pty Ltd. Prior to Lend Lease, Phillip spent 15 years with Hooker Corporation in varying roles including deputy CEO for LJ Hooker Ltd and Hooker Housing Group.
Phillip is chair of Hastie Group’s Audit and Risk Management Committee and is a member of the Nomination Committee.
Other Company Directorships in the previous 3 years: Aevum Limited May 2007 to November 2010 Sakkara Holdings Pty Limited May 2006 to present (currently Chairman) Penrith Lakes Development September 2006 to present (currently Chairman) Corporation Limited Isis Group Holdings Pty Limited January 2004 to present (currently Chairman) Espreon Limited July 2004 to November 2009 AMP Capital Office & September 2010 to present Industrial Pty Limited
For
per
sona
l use
onl
y

�������� ���������������������������
��
Harry Boon LLB (Hons), B.Com. Director, Non-Executive, Independent
Harry was appointed a director of Hastie Holdings in December 2004, and subsequently Hastie Group Limited upon its incorporation on 4 February 2005, and brings to the role his experience as a senior executive in one of Australia’s leading listed companies.
Harry’s executive career culminated with the position of CEO of Ansell Limited from April 2002 to June 2004, having previously been president, chief executive officer and managing director of Ansell Healthcare since February 1989.
Harry is chair of Hastie Group’s Remuneration Committee and is also a member of the Audit and Risk Management and Nomination Committees.
Other Listed Company Directorships in the previous 3 years: Tatts Group Limited May 2005 to present (currently Chairman) Toll Holdings Limited November 2006 to present PaperlinX Limited May 2008 to present Gale Pacific Limited August 2005 to November 2009
John Gaskell B.Sc. (Hons) (Elec Eng), C Eng. FIET Director, Non-Executive, Independent
John was appointed to the Board of Hastie Group Limited in August 2008. He was formerly Chief Executive Officer of ABB Australia Pty Ltd, responsible for ABB’s operations in Australia and New Zealand. He has had a long career in Managing Director roles with ABB and its predecessor companies, with Rolls-Royce and with Kennedy and Donkin across Europe, the Middle East, North America and Asia. John was a member of the Business Council of Australia’s working group on business reform and he was a NSW Councillor of the Australian Industry Group. He was also a member of the Great Barrier Reef Foundation’s Chairman’s panel. John is Director of the Electrical and Information Engineering Foundation of the University of Sydney and is a Governor of the Warren Centre for advanced Engineering, also at the University of Sydney. John is a member of the Remuneration and Nomination Committees.
Other Company Directorships in the previous 3 years: ABB Australia Pty Ltd February 2002 to May 2010 ABB Group Holdings Limited February 2002 to May 2010 ABB Group Investment February 2002 to May 2010 Management Limited
David Martin Director, Non-Executive
David started his career in the air conditioning industry in 1957 with Bernard Hastie & Co Ltd in the UK, progressing to London manager before arriving in Australia to found Hastie Australia Pty Limited (“Hastie Australia”) in 1970.
David was formerly the executive chairman of Hastie Holdings, the executive chairman of Hastie Australia and a non-executive director of various other Hastie Group companies.
David resigned from all executive positions held with Hastie Group on 1 August 2004 and was appointed a non-executive director of Hastie Group Limited upon its incorporation on 4 February 2005. David has provided consultancy services to Hastie Group, assisting Hastie Group’s senior management with general mentoring and industry advice. This consultancy arrangement terminated on 30 June 2008.
David is a member of the Remuneration and Nomination Committees.
Lindsay Phillips B.Com., CA. Director, Non-Executive
Lindsay was appointed a director of Hastie Group Limited on 4 August 2011. Lindsay is Managing Director of Lazard Australia Private Equity Pty Ltd which he has managed (with John Wylie and Mark Carnegie) since 2007. Lindsay has been involved in private equity for over 20 years, commencing in 1987 with MJH Nightingale & Co. Limited in London and subsequently Australia from 1995. Prior to this, Lindsay was a Chartered Accountant with PricewaterhouseCoopers for 7 years in Perth, Sydney and London.
Lindsay is Chairman of ASX listed company, Flat Glass Industries Limited, and is a board member of many of the companies in which funds managed by Lazard Australia Private Equity have invested, including Hastie Group.
Lindsay is a member of the Audit and Risk Management Committee and the Nomination Committees.
Other Company Directorships in the previous 3 years: Flat Glass Industries Limited December 2003 to present Provet Holdings Limited October 2009 to August 2010 Datasquirt Limited April 2006 to December 2008
For
per
sona
l use
onl
y

�������� ���������������������������
��
Chris Woodward MBA (Aston), FCIMA, MAICD Finance Director
Chris joined Hastie Group in April 2004 in the role of chief financial officer following a long career in management and finance roles with ALSTOM, one of the world’s largest operators in the transport, power and marine sectors.
Over his 23 years with ALSTOM, Chris served in a number of general management and senior finance roles in Europe, Asia, and, most recently, Australia. His previous role was country finance director, ALSTOM Australia and New Zealand.
He is also responsible for Hastie Group IT. Chris was appointed to the Board of Hastie Group Limited as finance director in June 2007. He is also a member of the European Advisory Board.
Company Secretary
Anne Griegg LLB (Hons), ACIS, B.Econ. General Counsel & Company Secretary
Anne joined Hastie Group in February 2007 as General Counsel & Company Secretary.
Anne has substantial experience as a corporate lawyer having worked over 20 years at companies including Transurban Limited, Bluescope Steel Limited, Coles Myer Limited and a number of law firms.
Anne also brings corporate secretarial and governance skills to Hastie Group.
PRINCIPAL ACTIVITIES
Hastie Group Limited is a leading international designer, installer and maintainer of technical services - mechanical, electrical, commercial plumbing, fire and refrigeration - to the building and infrastructure sectors. The Group has well established operations in Australia and New Zealand, the UK and the Middle East, with around 8,000 employees based at multiple locations. The group operates under brands which are well recognised in their markets, and customers include many of the largest construction companies, shopping centre groups, industrial corporations and facility managers. Hastie Group Limited is a member of the S&P/ASX300 Index.
REVIEW OF OPERATIONS
The group incurred a net loss before tax of $94.2 million in the current year, compared to a net profit before tax of $51.9 million for the prior corresponding period, being the year ended 30 June 2010.
The loss after tax was $87.8 million compared to a net profit after tax of $39.8 million in the prior corresponding period (after deduction of minority interests).
The trading results for Hastie for the year were adversely impacted by:
• depressed market demand, coupled with legacy contracts negotiated during the GFC, contributed to downward pressure on margins;
• project delays; • adverse weather conditions and natural disasters – a mild summer in Australia adversely impacting air
conditioning service volumes, floods in Australia and the earthquake in Christchurch, New Zealand; • losses in Hastie’s plumbing businesses, in particular in Queensland (where the two businesses have now been
integrated); • continuing low discretionary maintenance spending; • low capital investment in supermarket refrigeration systems; and • working capital increased significantly during the year as creditors tightened their trading terms and customers
under certified works completed, resulting in an increase in work in progress, during the bank standstill agreement period.
In addition uncertainty with respect to Hastie’s protracted ASX trading halt and voluntary suspension, from 16 February 2011 through to 12 April 2011, and financial position adversely impacted Hastie’s operations in the second half of the year. In particular, during the standstill period, which commenced on 8 April 2011; where delays in issuing project bonds for new projects and trade letters of credit in the Middle East led to delays in commencing new projects and delayed site progress on existing projects leading to a delay in sales and also profit recognition.
For
per
sona
l use
onl
y

�������� ���������������������������
��
Furthermore the profit for the year was also adversely impacted by:
• $33.5 million of significant doubtful debt provisions (an impact on after tax profits of $32.2 million), $69.1 million of goodwill impairment (mainly in respect of the international operations of our Rotary business, in particular in the Middle East), $1.3 million write-down in the Rotary brand value (again in the Middle East) and $2.3 million of standstill costs (representing costs of advisors appointed by Hastie’s Banking Group during the standstill period, paid by the Company); and
• significant refinancing costs, bank fees, related legal costs (relating to the standstill period and subsequent refinancing of Hastie’s debt and binding facilities).
For a comprehensive review of the company’s operational performance, refer to the Chairman and Group Managing Director and CEO’s report which is summarised in the company’s Annual Report.
FINANCIAL POSITION
The financial report has been prepared on the going concern basis, which assumes continuity of normal business activities and the realisation of assets and the settlement of liabilities in the ordinary course of business. Hastie incurred a net loss from continuing operations after tax of $87.8 million for the year ended 30 June 2011. However, as of that date, the consolidated entity’s current assets exceeded its current liabilities by $150.2 million.
Pursuant to the terms of its bilateral financing facilities detailed in notes 13 and 14, Hastie was required to comply with certain banking covenants which are assessed at the end of each quarter. While Hastie was in compliance with these covenants for the quarter ended 31 December 2010, ongoing challenging market conditions resulted in Hastie being at risk of breaching certain of its banking covenants subsequent to 31 December 2010. In the event of such a covenant breach, each financier would have had the right to demand or accelerate repayment of amounts owed to them.
As a result of the above situation, Hastie’s Banking Group committed to support Hastie to continue trading as a going concern. As a consequence, on 8 April 2011 Hastie entered into:
• a Standstill Deed; and • a new syndicated Funding Agreement
with its Banking Group comprising: ANZ Banking Group Limited, ANZ National Bank, Bank of Scotland International, Commonwealth Bank of Australia, HSBC Australia, HSBC Middle East, National Australia Bank, Ulster Bank and Westpac Banking Corporation.
The key features of these agreements included that during the standstill period, and subject to Hastie meeting certain conditions and financial and other performance targets:
(a) ongoing funding, bonding and working capital facilities would be provided on a syndicated basis to support business requirements;
(b) covenant calculations would not be undertaken during the standstill period, including as at 30 June 20ll; and (c) the Banking Group would not demand or accelerate repayment of any amounts under Hastie’s bilateral
facilities, or take any enforcement action by reason of any breach of the financial covenants in each bilateral facility.
The standstill period was due to end on 1 August 2011 unless extended by agreement with each bank.
Following the conclusion of this process:
(a) on 8 June 2011, Hastie signed new syndicated debt facilities with its Banking Group, including:
• a $146 million term debt facility; • a revolving credit facility of $113.9 million, expected to be initially drawn to c.$50 million; and • committed project bonding and letter of credit facilities of $300 million,
where all facilities have a staggered maturity profile, with two thirds of the committed amounts maturing on 31 July 2013, and the balance on 31 July 2014. The first draw down on these new syndicated debt facilities was subject to Hastie satisfying a number of conditions, including repaying a minimum of $102 million of its existing debt facilities. F
or p
erso
nal u
se o
nly

�������� ���������������������������
��
(b) on 14th June 2011 Hastie announced that it would raise approximately $160 million by way of:
• $7.2 million through an initial share placement to funds managed by Lazard Australia Private Equity Pty Ltd;
• $110 million through a 2.85 for 1 fully underwritten accelerated renounceable entitlement offer; and • $42.8 million through a fully underwritten conditional placement to institutional investors, subject to
shareholder approval at an Extraordinary General meeting of Hastie Group to be held on 22 July 2011.
Hastie intended to apply the net proceeds received from the initial share placement and upon settlement of its accelerated renounceable entitlement offer to repay at least $102 million of existing debt facilities and thereby bring the new syndicated debt facilities in to force.
At 30 June 2011:
• the initial share placement and the institutional component of the accelerated renounceable entitlement offer had been completed raising $43.5 million ($40.0 million net of equity raising fees and costs);
• following receipt of the funds from the initial share placement, on 17 June 2011 and the institutional component of the accelerated renounceable entitlement offer, on 27 June 2011, Hastie repaid $25.0 million to its Banking Group;
• the retail element of the entitlement offer had been fully underwritten, but not completed, totalling $73.7 million; and
• the conditional placement had also been conducted, totalling $42.8 million, but where completion remained subject to shareholder approval.
Since 30 June 2011:
• on 18 July 2011 Hastie announced the successful completion of the retail component of its fully underwritten 2.85 for 1 accelerated renounceable entitlement offer, raising $73.7 million; which represented the completion of the final stage of the entitlement offer announced on 14 June 2011;
• following receipt of the funds from the retail component of the entitlement offer, on 19 July 2011, Hastie repaid a further $81.1 million to its Banking Group ($106.1 million in aggregate, including $25.0 million repaid in June 2011 out of the proceeds of the institutional component of the entitlement offer) thereby bringing the new syndicated debt facilities in to force. Drawings under these new facilities were then used to repay all previous bilateral debt facilities and all bonds and trade letters of credit issued under bilateral or syndicated standstill facilities were novated to the new syndicated debt facilities; following which the previous bilateral facilities and the syndicated standstill funding agreement, signed on 8 April 2011, were cancelled. From 18 July 2011 Hastie was no longer subject to the terms of the standstill deed entered in to on 8 April 2011 and it’s relations with its Banking Group are now solely governed by the terms of the new syndicated debt facilities signed on 8 June 2011;
• on 22 July 2011 at Hastie’s Extraordinary General Meeting shareholders voted in favour of the conditional placement totalling $42.8 million, where the funds, net of equity raising fees and costs, were received on 26 July 2011 and used to further pay down debt; this represented the completion of the final stage of Hastie’s $160 million equity raising; and
• on 11 August 2011 an offer to participate in the Hastie Group Share Purchase Plan was dispatched to existing Australian and New Zealand shareholders on the register as at 7pm (Sydney time) on 5 August 2011 inviting each of them to participate up to a maximum amount of $15,000 based on a share price of $0.14 per share. The offer will close at 5pm (Sydney time) on 1 September 2011 with shares allotted on 12 September 2011.
The Directors consider that there are reasonable grounds to believe that Hastie will be able to pay its debts as and when they become due and payable. In forming this view, the Directors have given consideration to the following matters:
(i) the successful $160 million equity raising noted above; (ii) The new syndicated banking facilities which came in to force on 18 July 2011, noted above; (iii) Hastie continues to trade profitably (excluding the impact of non cash significant items: doubtful debt
provisions and goodwill impairment); and (iv) Hastie’s profit forecast and cash requirements through to the end of September 2012.
CHANGES IN STATE OF AFFAIRS
During the financial year there was no significant change in the state of affairs of the Group other than that referred to in the financial statements or notes thereto.
For
per
sona
l use
onl
y

�������� ���������������������������
��
FUTURE DEVELOPMENTS
As permitted by the Corporations Act 2001 (Cth), information which may be unreasonably prejudicial, regarding likely future developments in and the expected results of the operations of the Group or its strategies and prospects has been omitted.
ENVIRONMENTAL REGULATIONS
There were no known breaches of environmental laws, regulations or permits during the period. The consolidated entity is subject to a range of environmental regulations in respect of the manufacturing, installation and services activities.
DIVIDENDS
In respect of the financial year ended 30 June 2010, a final dividend of 4 cents per share franked to 100% at 30% corporate income tax rate was paid to the holders of fully paid ordinary shares on the record date of 3 September 2010 and paid on 18 October 2010.
In respect of the financial year ended 30 June 2011, no interim dividend or final dividend was declared.
INDEMNIFICATION OF OFFICERS AND AUDITORS
During the financial period ended 30 June 2011, the company paid a premium in respect of a contract insuring the directors of the company (as named above), the company secretary, and all executive officers of the company and of any related body corporate against a liability incurred as such a director, secretary or executive officer to the extent permitted by the Corporations Act 2001(Cth). The contract of insurance prohibits disclosure of the nature of the liability and the amount of the premium.
The company has not otherwise, during or since the financial period, indemnified or agreed to indemnify an officer or auditor of the company or of any related body corporate against a liability incurred as such an officer or auditor.
DIRECTORS’ MEETINGS
The following table sets out the number of directors’ meetings (including meetings of Committees of directors) held during the financial year and the number of meetings attended by each director (while they were a director or Committee member). During the financial year, 43 Board meetings (33 more meetings than scheduled at the beginning of the year), 3 Remuneration Committee meetings, 5 Audit and Risk Management Committee meetings and 1 Nomination Committee meeting were held.
Audit and Risk Board of Remuneration Management Nomination Directors Committee Committee Committee Directors Held Attended Held Attended Held Attended Held Attended
Mr Trevor Bourne 43 42 3 3 5 5 1 1
Mr David Harris 43 42 – – – – – –
Mr David Martin 43 40 3 3 – – 1 1
Mr Harry Boon 43 31 3 3 5 5 1 1
Mr Phillip Anderson 43 36 – – 5 5 1 1
Mr John Gaskell 43 39 3 3 – – 1 1
Mr Lindsay Phillips1 n/a n/a n/a n/a n/a n/a n/a n/a
Mr Chris Woodward 43 40 – – – – – –
1 Mr Lindsay Phillips was not a Director during the financial year ending 30 June 2011 and was appointed to the Board on 4 August 2011.
For
per
sona
l use
onl
y

�������� ���������������������������
��
DIRECTORS’ SHAREHOLDINGS
The following table sets out each director’s relevant interest in shares and performance rights of the company, as at the date of this report.
Directors Shares Performance Rights
Mr Trevor Bourne 677,639 –
Mr David Harris 575,143 559,554
Mr David Martin 6,007,525 –
Mr Harry Boon 1,075,976 –
Mr Phillip Anderson 155,094 –
Mr John Gaskell 192,500 –
Mr Lindsay Phillips – –
Mr Chris Woodward 395,019 229,075
NON-AUDIT SERVICES
The directors are satisfied that the provision of non-audit services, during the year, by the auditor (or by another person or firm on the auditor’s behalf) is compatible with the general standard of independence for auditors imposed by the Corporations Act 2001 (Cth).
Details of amounts paid or payable to the auditor for non-audit services provided during the year by the auditor are outlined in note 36 to the financial statements.
The directors are of the opinion that the services as disclosed in note 36 to the financial statements do not compromise the external auditor’s independence, based on advice received from the Audit Committee, for the following reasons:
• all non-audit services have been reviewed and approved to ensure that they do not impact the integrity and objectivity of the auditor, and
• none of the services undermine the general principles relating to auditor independence as set out in Code of Conduct APES 110 Code of Ethics for Professional Accountants issued by the Accounting Professional & Ethical Standards Board, including reviewing or auditing the auditor’s own work, acting in a management or decision-making capacity for the company, acting as advocate for the company or jointly sharing economic risks and rewards.
AUDITOR’S INDEPENDENCE DECLARATION
The auditor’s independence declaration is included on page 21 of the financial report.
ROUNDING OFF OF AMOUNTS
The company is a company of the kind referred to in ASIC Class Order 98/0100, dated 10 July 1998, and in accordance with that Class Order amounts in the directors’ report and the financial report are rounded off to the nearest thousand dollars, unless otherwise indicated.
Audited Remuneration Report INTRODUCTION
The directors of Hastie Group Limited present the Remuneration Report prepared in accordance with section 300A of the Corporations Act 2001 for Hastie Group Limited and the consolidated entity for the financial year ended 30 June 2011.
The Remuneration Report forms part of the Directors' Report.
REMUNERATION POLICY – NON-EXECUTIVE DIRECTORS
The remuneration policy of the company is to attract and retain competent and suitably qualified non-executive directors. Non-executive director remuneration is set by the company’s Board based on recommendations made by the Remuneration Committee. The Remuneration Committee’s recommendations are determined by comparison with the market, based on independent external advice with regard to market practice, relativities, and director duties and accountability. Details of non-executive director remuneration for the year ended 30 June 2011 can be found on page 16. All non-executive directors held their position for the full financial year.
For
per
sona
l use
onl
y

�������� ���������������������������
���
FEE POOL
Non-executive directors’ fees are determined within an annual aggregate directors’ fee pool limit, which is periodically approved by shareholders. At the date of this report the pool limit is set at $700,000. During the year ended 30 June 2011, $644,000 of the fee pool (92%) was utilised.
FEES
Non-executive directors receive a fixed fee which is not linked to the performance of the company so as to maintain independence and impartiality.
For the financial years ended 30 June 2011 and 30 June 2012, non-executive directors’ fees comprised and will comprise:
• a base fee of $90,000 per annum for non-executive directors (other than the Chairman) • an all-inclusive fee of $220,000 per annum for the Chairman which includes his attendance at all Committee
meetings • a chair fee of $20,000 per annum payable to the chairs of the Audit and Risk Management Committee and the
Remuneration Committee • a member fee of $8,000 per annum payable to the members of those Committees (other than the Board
Chairman)
No other fees were paid to non-executive directors.
EQUITY PARTICIPATION
Non-executive directors have no entitlement to options or performance rights. No options or performance rights were issued to non-executive directors during the financial year ended 30 June 2011 and none are held by any non-executive director at the date of this report.
Directors are encouraged to purchase shares, either on-market or through the Deferred Share Plan. Under the terms of the Deferred Share Plan, non-executive director fees may be sacrificed for shares purchased or issued at market price. For the financial year ended 30 June 2011, there was no minimum share purchase requirement for non-executive directors.
RETIRING ALLOWANCE
No retiring allowances are paid to non-executive directors.
SUPERANNUATION
Where required, the company has complied with the obligation to pay the minimum superannuation guarantee support for directors in respect of director fees. Messrs Martin and Anderson invoice the company for services provided and as such no superannuation payment is required to be made to these directors. Messrs Bourne, Boon and Gaskell receive superannuation payments from the company. Where the company pays superannuation guarantee support, it is included in the fees above, and is not an additional payment.
BOARD PERFORMANCE
Board performance was evaluated based on input from individual Board members and the executive management team in an open and constructive manner in July 2011. At the same time, a review of the performance of individual directors who are standing for re-election at the 2011 Annual General Meeting was undertaken. Board performance will continue to be reviewed on a regular basis.
For
per
sona
l use
onl
y

�������� ���������������������������
���
COMPANY PERFORMANCE
The tables below set out summary information about the consolidated entity’s earnings and movements in shareholder wealth for the five years to June 2011:
30 June 2007 $’000
30 June 2008 $’000
30 June 2009 $’000
30 June 2010 $’000
30 June 2011 $’000
Revenue 778,633 1,270,672 1,781,049 1,651,081 1,848,843
Net (loss)/profit before tax 31,431 47,086 68,888 51,909 (94,170)
Net (loss)/profit after tax 22,531 38,388 58,698 40,578 (87,826)
30 June 2007
30 June 2008
30 June 2009
30 June 2010
30 June 2011
Share price at start of year $ per share 1.45 3.41 2.78 1.27 1.38
Share price at end of year $ per share 3.41 2.78 1.27 1.38 0.14
Interim dividend cents per share1 5.5 7.0 7.0 5.0 -
Final dividend cents per share1, 2 6.0 9.0 5.0 4.0 -
Basic earnings per share3 17.5 26.1 30.9 16.1 (34.6)
Diluted earnings per share3 17.0 25.5 30.5 15.8 (34.6)
1 Franked to 100% at 30% corporate income tax rate. 2 Declared in respect of the period but after the balance date so reflected as a payment in the financial statements of the
following year. 3.Adjusted to reflect the Initial Placement to the Cornerstone Investor on 17 June 2011 and the Institutional Entitlement
Offer on 28 June 2011.
REMUNERATION POLICY – SENIOR EXECUTIVES
Throughout this Remuneration Report, Senior Executives refers to:
• the 5 most highly remunerated company/Group executives (excluding executive directors); and • all other executives (including executive directors but excluding non-executive directors) who fall within the
definition of Key Management Personnel of the Group (being those persons with authority and responsibility for planning, directing and controlling the activities of the Group).
The remuneration policy of the company is designed to attract, retain, develop and motivate appropriately qualified and experienced Senior Executives. It is also set to reward Senior Executives for increasing shareholder value and for achieving financial targets and business strategies. Hastie Group’s remuneration policy is reviewed on a regular basis using independent external remuneration consultants, and is set by the Board upon recommendations from the Remuneration Committee.
The remuneration policy is intended to be consistent with Principle 8 in the ASX Corporate Governance Council’s Corporate Governance Principles and Recommendations (2nd Edition) which requires that the company remunerate fairly and responsibly. Broadly, the policy is intended to ensure, for each role, that:
• the balance between fixed and at risk or performance related components (comprising both short and long term incentives) is appropriate having regard to all relevant factors;
• individual objectives set will lead to beneficial outcomes for both Hastie Group and the individual; • all performance based remuneration components are appropriately linked to measurable personal, Divisional or
Hastie Group performances; and • total compensation (that is the sum of fixed and at risk components) for each executive is fair, reasonable and
market competitive. For
per
sona
l use
onl
y

�������� ���������������������������
���
COMPONENTS OF SENIOR EXECUTIVE REMUNERATION
Generally, the three components of Senior Executive remuneration are: fixed annual remuneration comprising salary and benefits, including superannuation; short-term performance incentives in the form of a cash bonus payable if performance objectives are met; and long-term equity incentives, generally through participation in the company's Performance Rights Plan. The combination of these three components comprises a Senior Executive’s total remuneration.
The short term incentive bonus and the long term incentive plan together represent remuneration which is at risk as it is performance based. For the financial year ended 30 June 2011, the table below shows that, generally, up to 47% of Senior Executives' total maximum remuneration is at risk and up to 54% of the total maximum remuneration of the Group Managing Director & CEO and Finance Director is at risk.
Senior Executives - Proportion of fixed and at-risk remuneration – FY2010 and FY2011
% of Total Potential Maximum Remuneration1
Fixed 'At risk' - performance-based
FR STI LTI
Mr David Harris Group MD & CEO
2011 46 27 27
2010 46 27 27
Mr Chris Woodward Finance Director
2011 53 26 21
2010 53 26 21
Mr David Hammond CEO Electrical Division
2011 53 26 21
2010 53 26 21
Mr Joseph Farrugia CEO Services Division
2011 53 26 21
2010 53 26 21
Mr Ian McGregor2
CEO Middle East Division 2011 73 27 -
2010 - - -
Mr Phill Laidlaw CEO UK Operations
2011 53 26 21
2010 62 19 19
Mr Jerry Collins CEO Republic of Ireland and International Operations
2011 69 17 14
2010 69 17 14
1 These amounts are based on ‘maximum’ performance being achieved as set out in contracts of employment. 2 Mr Ian McGregor’s role changed due to a restructure of Hastie Group’s Middle East operation. With effect from 16
September 2010 he reports directly to the Group Managing Director & CEO as CEO of the Middle East Division.
INDEPENDENT REMUNERATION ADVICE
During the financial year ended 30 June 2011, Guerdon Associates Pty Ltd was retained directly by the Remuneration Committee to provide independent remuneration advice and data on Senior Executive remuneration. They were paid $23,027 for their services to the Remuneration Committee. Guerdon Associates were also paid a total of $57,867 for remuneration advice to Divisional CEO’s. Guerdon Associates Pty Ltd does not provide any services other than remuneration advice to the company.
For
per
sona
l use
onl
y

�������� ���������������������������
���
FIXED ANNUAL REMUNERATION
Senior Executives’ remuneration is benchmarked against the market median for similar roles in similarly sized companies. Remuneration is reviewed on a regular basis, generally effective 1 January each year. Adjustments to remuneration including base salary may be made based on promotion or significant role responsibility changes, pay relativities to market and relative performance in the role.
SHORT TERM INCENTIVES
Short Term Incentives (STI) in the form of cash bonuses are paid to Senior Executives based upon Key Performance Indicators (KPI’s) which are agreed with each Senior Executive at the beginning of the period and measured against agreed targets which determine the value, if any, of cash bonuses paid. The STI targets and KPI measures have been chosen to ensure a strong link between executive reward and company performance, and are directly linked to the strategic direction of the company. The STI program is designed to put a significant proportion of Senior Executive remuneration at risk against meeting financial and non-financial targets linked to the company's business objectives. The Board approves the STI targets and KPI measures for all Senior Executives.
1. Financial Performance Targets
Financial measures for Senior Executives are generally weighted at 60% to 70% of the overall STI target. Financial performance targets are set at both threshold and stretch levels. The threshold level is set at an acceptable minimum outcome for each budgeted goal with the stretch target set at a level regarded by the Board as an outstanding yet realistic achievement. The key financial measures for the Group MD & CEO and Finance Director were earnings before interest and tax (EBIT), earnings per share (EPS) and working capital management. For the other Senior Executives, EBIT, working capital management and order backlog were the key financial measures.
For the 2011/12 financial year, the percentage weighting of the financial performance targets will increase to 80% of the overall STI target, with an increased weighting towards cash generation from operations and working capital reduction.
2. OH&S Performance Targets
OH&S objectives and targets are set for each Senior Executive across the Group, with a STI weighting of 10%. Key to these is the expectation of further reducing injuries to our people, while at the same time fostering a safety culture that will ensure workplace risk faced by our employees is appropriately controlled. For the year ended 30 June 2011, development of measurable lead indicators to further assist in reducing workplace injury was a priority.
For the 2011/12 financial year, OH&S objectives will continue to constitute 10% of overall STI measures.
3. Other Targets
Targets specific to individual businesses and individuals are also set and weighted around 10% of STI. These include:
• succession planning, management development and performance management • research and development culminating in alternative energy efficient technologies
The Group Managing Director & CEO assesses the performance of Senior Executives against STI targets at the end of each financial year and confers with the Chairman, the Remuneration Committee and the Board regarding his recommendations. The Chairman, in consultation with the Remuneration Committee and the Board, determines the Group Managing Director & CEO's and Finance Director’s targets at the beginning of each financial year and assesses performance against those targets at the end of each financial year.
Relationship between the remuneration policy and company performance
The relationship between Hastie Group’s remuneration policy and the company’s performance is indicated in the table below, which sets out the percentage of the STI paid and forfeited for each of the Senior Executives in respect of the financial years ended 30 June 2010 and 2011. F
or p
erso
nal u
se o
nly

�������� ���������������������������
���
Short Term Incentive payments FY2010 and FY2011
FY20101 FY20112
Paid %
Forfeited %
Paid %
Forfeited %
Mr David Harris Group MD & CEO
49 51 - 100
Mr Chris Woodward Finance Director
60 40 - 100
Mr David Hammond CEO Electrical Division
56 44 33 67
Mr Joseph Farrugia CEO Services Division
37 63 43 57
Mr Ian McGregor3 CEO Middle East Division
- - 36 64
Mr Phill Laidlaw
CEO UK Operations 95 5 48 52
Mr Jerry Collins
CEO Republic of Ireland and International Operations
38 62 35 65
1 In respect of the 2010 financial year and to be paid in the 2011 financial year. 2 In respect of the 2011 financial year and payable in the 2012 financial year and on the basis that reported EBIT was used for
measuring performance against STI objectives. 3 Mr Ian McGregor joined the Senior Executive team on 16 September 2010 and his STI is only shown for the financial year
ended 30 June 2011.
LONG TERM INCENTIVES
The purpose of the long-term incentive (LTI) plan is to align the performance of Senior Executives to the achievement of sustainable long term shareholder value. Providing executives with the opportunity to earn equity in Hastie Group through the LTI plan fosters retention and builds ownership by the senior team.
All Senior Executives named in this report are eligible to receive performance rights under the LTI plan as they have been identified as being able to directly impact the company's performance. Each performance right is an entitlement to one fully paid ordinary share in the company for nil consideration subject to achievement of vesting conditions (including service and performance) over 4 financial years, with 1/3 of the performance rights vesting at the end of the 2nd financial year following award, 1/3 at the end of the 3rd financial year and the remaining 1/3 at the end of the 4th financial year. The first performance period commences from the end of the financial year immediately preceding the date of grant. The value of the performance rights at the date of grant for the previous two financial years is shown in the table on page 19. Performance rights are offered at no cost to executives and carry no voting or dividend rights. Participating executives, however, do not receive any value from their grants unless and until vesting conditions are met. If vesting conditions are met, the ordinary shares issued carry usual voting and dividend rights.
While the Board is of the view that regular allocations will focus executives on the achievement of long-term performance and reinforce the importance of maintaining and increasing shareholder value, Hastie Group’s financial circumstances during the financial year ended 30 June 2011 were such that there were no new performance rights issued during the financial year ended 30 June 2011.
DEALING WITH PERFORMANCE RIGHTS
Performance rights granted subject to a vesting condition must not be transferred, encumbered or otherwise dealt with until the earlier of 10 business days after the date on which the Board determines the extent (if any) to which the condition has been satisfied or 4 months after the end of the applicable measurement period.
For
per
sona
l use
onl
y

�������� ���������������������������
���
EXERCISE OF RIGHTS FOLLOWING DEATH OR OTHER CESSATION OF EMPLOYMENT
All unvested rights become exercisable following the death or permanent incapacity of a participant, whether or not the applicable performance conditions have been satisfied at the date of death or cessation of employment.
If a participant’s employment by a Hastie Group company is terminated for cause or a participant resigns as a Hastie Group employee before the end of the applicable measurement period, their rights will generally lapse. If a participant resigns as a Hastie Group employee after the last day of the applicable measurement period but before the rights have vested, then subject to satisfaction of the applicable performance conditions, their rights may be exercised.
If a participant ceases to be employed by a Hastie Group company because of redundancy or permanent retirement before the last 6 months of the applicable measurement period, their rights will generally lapse. Where a participant ceases to be employed by a Hastie Group company because of redundancy or permanent retirement within the last 6 months of the applicable measurement period, then, subject to satisfaction of the applicable performance conditions, their rights may be exercised.
RETESTING AND CHANGE IN CONTROL
No Performance Rights were granted during the financial year ended 30 June 2011.
For performance rights granted during the financial year ended 30 June 2010, the performance hurdles (equally weighted) were Total Shareholder Return (TSR) and Relevant Earnings per Share (Relevant EPS).
Total Shareholder Return (TSR) measures the return a shareholder obtains from the company's shares in the defined period and takes into account the changes in the market value of the company’s shares as well as the dividends paid on the shares (adjusted for any rights or bonus issues and capital reconstructions). This performance measure compares the company's TSR over the performance period to the TSR performance of other companies in the S & P ASX Small Ordinaries Accumulation Index.
Earnings Per Share (EPS) measures the growth in earnings per share over the specified measurement period. The Board believes TSR and EPS growth were appropriate measures because they ensure that a proportion of each executive's remuneration is linked to company profits and shareholder value and those executives only benefit when there is a corresponding benefit to shareholders.
Performance rights granted during the financial year ended 30 June 2010 which do not vest will lapse.
For those performance rights granted in November 2007 and tested during the financial year ended 30 June 2011
(a) 10% compound EPS growth was not achieved, and these rights have lapsed; (b) the required degree of TSR performance against the ASX Small Ordinaries index was not achieved, and these
rights have lapsed.
DEALING IN COMPANY SECURITIES
In respect of performance rights and unvested shares held in the company’s Deferred Share Plan, Hastie Group’s Dealing in Securities Policy prohibits Directors, Senior Management and other employees from entering into any arrangement which would have the effect of eliminating, reducing or transferring to any other person the risk of any fluctuation in their value. These sorts of arrangements are commonly referred to as hedging. Examples of hedging arrangements are put and call options, warrants, and cap and collar transactions. Under the policy, vested securities may be hedged, provided the company is notified in advance of the arrangement being entered into coupled with post hedging confirmation.
Directors are also required to notify the company promptly if they or their related parties individually put in place any margin borrowing arrangements which, together with any of their previous arrangements, apply to more than 2% of Hastie’s share capital.
For
per
sona
l use
onl
y

�������� ���������������������������
���
DETAILS OF REMUNERATION
The directors and other members of Key Management Personnel of the company and the Group during the year were:
Mr Trevor Bourne Chairman (non-executive) Mr David Harris Group Managing Director & CEO Mr Phillip Anderson Director (non-executive) Mr Harry Boon Director (non-executive) Mr David Martin Director (non-executive) Mr John Gaskell Director (non-executive) Mr Chris Woodward Finance Director
Mr David Hammond CEO Electrical Division Mr Joseph Farrugia CEO Services Division Mr Ian McGregor CEO Middle East Division Mr Phill Laidlaw CEO UK Operations Mr Jerry Collins CEO Republic of Ireland and International Operations
Details of the remuneration of each Hastie Group Limited non-executive director and Senior Executive are set out in the tables below:
Non-executive directors' remuneration
Short-term
$
Post employment
$
Long Term $ Total
$ Salary & fees
paid Super-
annuation Retirement
benefits
Mr Trevor Bourne 2011 201,835 18,165 – 220,000
2010 183,486 16,514 – 200,000
Mr Phillip Anderson 2011 110,000 – – 110,000
2010 96,000 – – 96,000
Mr Harry Boon 2011 109,069 8,931 – 118,000
2010 95,413 8,587 – 104,000
Mr David Martin 2011 98,000 – – 98,000
2010 88,000 – – 88,000
Mr John Gaskell 2011 89,908 8,092 – 98,000
2010 46,333 41,667 – 88,000
Total 2011 608,812 35,188 – 644,000
2010 509,232 66,768 – 576,000
For
per
sona
l use
onl
y

�������� ���������������������������
���
Senior Executives remuneration
Short-term $
Post employment
$
Long Term Benefits $
Total $
Salaries Bonus Payable1,2
Super–annuation
Deferred Share Plan
Performance rights 4
Mr David Harris 2011 700,000 - 50,000 - 125,645 875,645
2010 635,000 210,000 50,000 55,3853 104,214 1,054,599
Mr Chris Woodward
2011 475,000 - 25,000 - 54,003 554,003
2010 437,500 144,000 25,021 - 38,587 645,108
Mr David Hammond
2011 375,602 77,550 35,151 - 46,654 534,957
2010 372,750 115,000 37,275 - 45,269 570,294
Mr Joseph Farrugia 2011 371,560 87,075 33,440 - 47,118 539,193
2010 345,000 75,000 50,000 - 42,750 512,750
Mr Ian McGregor5 2011 423,265 36,011 - - - 459,276
2010 - - - - - -
Mr Phill Laidlaw 2011 300,176 71,588 42,499 - 30,301 444,564
2010 277,234 92,657 36,136 - 30,201 436,228
Mr Jerry Collins 2011 287,887 26,836 25,679 - 23,014 363,416
2010 266,520 21,494 26,652 - 23,566 338,232
TOTAL 2011 2,933,490 299,060 211,769 - 326,735 3,771,054
2010 2,334,004 658,151 225,084 55,385 284,587 3,557,211
1 FY2011 bonuses represent those amounts approved by the directors and payable during the financial year ended 30 June 2012 for services performed in relation to the financial year ended 30 June 2011.
2 FY2010 bonuses represent those amounts approved by the directors and paid during the financial year ended 30 June 2011 for services performed in relation to the financial year ended 30 June 2010.
3 Mr David Harris was granted 150,000 shares in June 2007 when joining the company. These shares vest in 3 equal tranches depending on continued service. $55,385 represents the amortisation of the sign on benefit over the vesting period for FY2010.
4 The value of performance rights represents the expensed value of rights issued in prior years which is amortised over the vesting period. No performance rights were issued during the financial year ended 30 June 2011.
5 Mr Ian McGregor joined the Senior Executive team on 16 September 2010.
EQUITY INSTRUMENT DISCLOSURES RELATING TO SENIOR EXECUTIVES - Options, Performance rights or shares provided as remuneration
No options have been issued to or are held by Senior Executives.
Details of performance rights over unissued ordinary shares in Hastie Group Limited provided as remuneration to Senior Executives are set out below. No performance rights were granted to Senior Executives during the financial year ended 30 June 2011.
No performance rights were granted to, or are held by, non-executive directors.
For
per
sona
l use
onl
y

�������� ���������������������������
���
The amounts disclosed for remuneration relating to performance rights is the assessed fair value at grant date allocated over the period from grant date to vesting date. Fair values at grant date have been independently determined using a Black-Scholes option pricing model that takes into account the exercise price, the expected life of the performance right, the market based vesting and performance criteria, the impact of dilution, the share price on grant date, expected price volatility of the underlying share, the expected dividend yield and risk free interest rate for the life of the performance right.
Details of the movements in the number of performance rights over ordinary shares in Hastie Group Limited held during the financial year by each of the Senior Executives of the consolidated entity, including their related parties, are set out below:
Performance Rights – number
Senior Executives
Balance at start of period
Granted during period
as compensation
Vested during period
Other changes
Balance at end of period
Mr David Harris 2011 559,554 - - - 559,554
2010 235,971 373,584 (16,667) (33,334) 559,554
Mr Chris Woodward 2011 229,075 - - - 229,075
2010 136,651 167,924 (32,000) (43,500) 229,075
Mr David Hammond 2011 197,198 - - - 197,198
2010 127,338 154,076 (63,147) (21,069) 197,198
Mr Joseph Farrugia 2011 197,877 - - - 197,877
2010 58,468 149,321 (3,304) (6,608) 197,877
Mr Ian McGregor1 2011 - - - - -
2010 - - - - -
Mr Phill Laidlaw 2011 115,771 - - - 115,771
2010 15,000 100,771 - - 115,771
Mr Jerry Collins 2011 91,219 - - - 91,219
2010 15,000 76,219 - - 91,219
1 Mr Ian McGregor became a Senior Executive on 16 September 2010.
For
per
sona
l use
onl
y

�������� ���������������������������
���
Value of performance rights issued to Senior Executives
The value of performance rights granted, exercised or lapsed during the financial years ended 30 June 2011 and 30 June 2010 is set out below:
Rights granted Value at
grant date
$
Rights exercised Value at exercise date (1)
$
Rights lapsed
Value at time of lapse
$
Value of rights included in
remuneration for the year (2)
$
Mr David Harris 2011 - - - 125,645
2010 397,867 60,835 101,293 104,214
Mr Chris Woodward 2011 - - - 54,003
2010 178,840 80,470 127,210 38,587
Mr David Hammond 2011 - - - 46,654
2010 154,727 123,291 68,615 45,269
Mr Joseph Farrugia 2011 - - - 47,118
2010 154,727 12,060 20,080 42,750
Mr Ian McGregor 2011 - - - -
2010 - - - -
Mr Phill Laidlaw 2011 - - - 30,301
2010 106,217 - - 30,201
Mr Jerry Collins 2011 - - - 23,014
2010 80,069 - - 23,566
TOTAL 2011 - - - 326,735
2010 1,072,447 276,656 317,198 284,587
1 Value at exercise date has been independently determined using a Black-Scholes option pricing model and is not based on the Volume Weighted Average Price.
2 The value of performance rights included in the remuneration year represents the expensed value of rights issued in prior years which is amortised over the vesting period. No performance rights were issued in the financial year ended 30 June 2011.
For
per
sona
l use
onl
y
�������� ���������������������������
���
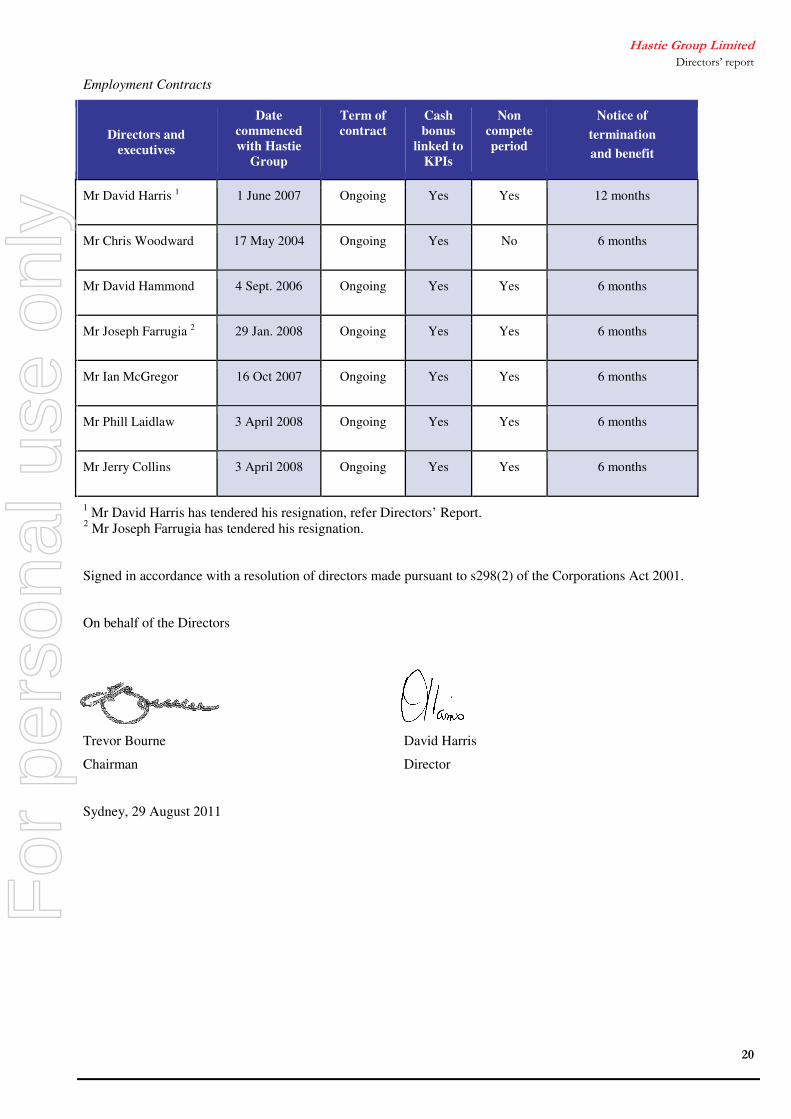
Employment Contracts
Directors and executives
Date commenced with Hastie
Group
Term of contract
Cash bonus
linked to KPIs
Non compete period
Notice of
termination and benefit
Mr David Harris 1 1 June 2007 Ongoing Yes Yes 12 months
Mr Chris Woodward 17 May 2004 Ongoing Yes No 6 months
Mr David Hammond 4 Sept. 2006 Ongoing Yes Yes 6 months
Mr Joseph Farrugia 2 29 Jan. 2008 Ongoing Yes Yes 6 months
Mr Ian McGregor 16 Oct 2007 Ongoing Yes Yes 6 months
Mr Phill Laidlaw 3 April 2008 Ongoing Yes Yes 6 months
Mr Jerry Collins 3 April 2008 Ongoing Yes Yes 6 months
1 Mr David Harris has tendered his resignation, refer Directors’ Report. 2 Mr Joseph Farrugia has tendered his resignation.
Signed in accordance with a resolution of directors made pursuant to s298(2) of the Corporations Act 2001.
On behalf of the Directors
Trevor Bourne David Harris
Chairman Director
Sydney, 29 August 2011
For
per
sona
l use
onl
y

Liability limited by a scheme approved under Professional Standards Legislation. Member of Deloitte Touche Tohmatsu 21
29 August 2011 Dear Board Members
Hastie Group Limited In accordance with section 307C of the Corporations Act 2001, I am pleased to provide the following declaration of independence to the directors of Hastie Group Limited. As lead audit partner for the audit of the financial statements of Hastie Group Limited for the financial year ended 30 June 2011, I declare that to the best of my knowledge and belief, there have been no contraventions of:
(i) the auditor independence requirements of the Corporations Act 2001 in relation to the audit; and
(ii) any applicable code of professional conduct in relation to the audit. Yours sincerely DELOITTE TOUCHE TOHMATSU R G Saayman Partner Chartered Accountants
The Board of Directors Hastie Group Limited Level 5, 20 Highgate Street AUBURN NSW 2144
Deloitte Touche Tohmatsu A.B.N. 74 490 121 060 The Barrington Level 10 10 Smith Street Parramatta NSW 2150 PO Box 38 Parramatta NSW 2124 Australia DX 28485 Tel: +61 (0) 2 9840 7000 Fax: +61 (0) 2 9840 7001 www.deloitte.com.au
For
per
sona
l use
onl
y

Liability limited by a scheme approved under Professional Standards Legislation Member of Deloitte Touche Tohmatsu 22
Independent Auditor’s Report to the members of Hastie Group Limited
Report on the Financial Report We have audited the accompanying financial report of Hastie Group Limited, which comprises the statement of financial position as at 30 June 2011, the income statement, the statement of comprehensive income, the statement of cash flows and the statement of changes in equity for the year ended on that date, notes comprising a summary of significant accounting policies and other explanatory information, and the directors’ declaration of the consolidated entity, comprising the company and the entities it controlled at the year’s end or from time to time during the financial year as set out on pages 24 to 77. Directors’ Responsibility for the Financial Report The directors of the company are responsible for the preparation of the financial report that gives a true and fair view in accordance with Australian Accounting Standards and the Corporations Act 2001 and for such internal control as the directors determine is necessary to enable the preparation of the financial report that is free from material misstatement, whether due to fraud or error. In Note 1, the directors also state, in accordance with Accounting Standard AASB 101 Presentation of Financial Statements, that the consolidated financial statements comply with International Financial Reporting Standards. Auditor’s Responsibility Our responsibility is to express an opinion on the financial report based on our audit. We conducted our audit in accordance with Australian Auditing Standards. Those standards require that we comply with relevant ethical requirements relating to audit engagements and plan and perform the audit to obtain reasonable assurance whether the financial report is free from material misstatement. An audit involves performing procedures to obtain audit evidence about the amounts and disclosures in the financial report. The procedures selected depend on the auditor’s judgement, including the assessment of the risks of material misstatement of the financial report, whether due to fraud or error. In making those risk assessments, the auditor considers internal control, relevant to the entity’s preparation of the financial report that gives a true and fair view, in order to design audit procedures that are appropriate in the circumstances, but not for the purpose of expressing an opinion on the effectiveness of the entity’s internal control. An audit also includes evaluating the appropriateness of accounting policies used and the reasonableness of accounting estimates made by the directors, as well as evaluating the overall presentation of the financial report. We believe that the audit evidence we have obtained is sufficient and appropriate to provide a basis for our audit opinion.
Deloitte Touche Tohmatsu A.B.N. 74 490 121 060 The Barrington Level 10 10 Smith Street Parramatta NSW 2150 PO Box 38 Parramatta NSW 2124 Australia DX 28485 Tel: +61 (0) 2 9840 7000 Fax: +61 (0) 2 9840 7001 www.deloitte.com.au
For
per
sona
l use
onl
y

23
Auditor’s Independence Declaration In conducting our audit, we have complied with the independence requirements of the Corporations Act 2001. We confirm that the independence declaration required by the Corporations Act 2001, which has been given to the directors of Hastie Group Limited, would be in the same terms if given to the directors as at the time of this auditor’s report. Opinion In our opinion: (a) the financial report of Hastie Group Limited is in accordance with the Corporations Act 2001,
including:
(i) giving a true and fair view of the consolidated entity’s financial position as at 30 June 2011 and of its performance for the year ended on that date; and
(ii) complying with Australian Accounting Standards and the Corporations Regulations 2001; and
(b) the consolidated financial statements also comply with International Financial Reporting
Standards as disclosed in Note 1.
Report on the Remuneration Report We have audited the Remuneration Report included in pages 9 to 20 of the directors’ report for the year ended 30 June 2011. The directors of the company are responsible for the preparation and presentation of the Remuneration Report in accordance with section 300A of the Corporations Act 2001. Our responsibility is to express an opinion on the Remuneration Report, based on our audit conducted in accordance with Australian Auditing Standards. Opinion In our opinion the Remuneration Report of Hastie Group Limited for the year ended 30 June 2011, complies with section 300A of the Corporations Act 2001. DELOITTE TOUCHE TOHMATSU R G Saayman Partner Chartered Accountants Sydney, 29 August 2011
For
per
sona
l use
onl
y

�������� �����������������������������
�
���
Directors’ declaration
The directors declare that in their opinion:
(a) there are reasonable grounds to believe that the company will be able to pay its debts as and when they become due and payable;
(b) the attached financial statements and notes are in accordance with the Corporations Act 2001, including compliance with accounting standards and give a true and fair view of the financial position and performance of the consolidated entity;
(c) the attached financial statements are in compliance with International Financial Reporting Standards, as stated in note 1 to the financial statements; and
(d) they have been given the declarations required by s.295A of the Corporations Act 2001.
At the date of this declaration, the company is within the class of companies affected by ASIC Class Order 98/1418. The nature of the deed of cross guarantee is such that each company which is party to the deed guarantees to each creditor payment in full of any debt in accordance with the deed of cross guarantee.
In the directors’ opinion, there are reasonable grounds to believe that the companies to which the ASIC Class Order applies, as detailed in note 26 to the financial statements will, as a group, be able to meet any obligations or liabilities to which they are, or may become, subject by virtue of the deed of cross guarantee.
Signed in accordance with a resolution of the directors.
On behalf of the Directors
Trevor Bourne David Harris
Chairman Director
Sydney, 29 August 2011
For
per
sona
l use
onl
y

�������� ���������� ���������������
���
Income statement for the year ended 30 June 2011
Consolidated
Note 2011 $’000
2010 $’000
Revenue from sale of goods and services 1,848,843 1,651,081 Cost of sales (1,574,199) (1,369,715) Gross profit 274,644 281,366
Other income 3,142 3,720 Marketing expenses (2,374) (1,737) Occupancy expenses (18,862) (16,754) Administration expenses (193,956) (175,282) Depreciation and amortisation expense 34 (15,070) (13,498)
Earnings before interest, tax and significant items 47,524 77,815 Significant items - doubtful debt provisions 3 (33,450) (4,694) - goodwill impairment 3 (69,129) - - write-off of brand value 3 (1,348) - - standstill costs 3 (2,304) - Gain on acquisition 27 - 1,579 Acquisition-related costs 27 (321) (2,154)
(Loss) / Earnings before interest and tax (59,028) 72,546
Interest income 4 459 1,009 Finance costs 4 (35,601) (21,646) (Loss) / Profit before tax 34 (94,170) 51,909
Income tax benefit / (expense) 5 6,344 (11,331) (Loss) / Profit for the year (87,826) 40,578
(Loss) / Profit is attributable to:
Owners of the parent (87,826) 39,835 Non-controlling interests - 743
(87,826) 40,578
Cents Cents (Loss) / Earnings per share: Basic (1) 21 (34.6) 16.1 Diluted (1) 21 (34.6) 15.8 (1) Earnings per share for 2010 have been restated, as required by AASB 133 ‘Earnings per Share.’ Refer note 21. Notes to the financial statements are included on pages 30 to 77
For
per
sona
l use
onl
y

�������� ����������!���������"�"����������������
����
Statement of comprehensive income for the year ended 30 June 2011
Consolidated
Note 2011 $’000
2010 $’000
(Loss) / Profit for the year (87,826) 40,578 Other comprehensive income Gain / (loss) recognised on: Interest rate swaps 18 1,033 2,984 Forward exchange contracts 18 (326) (2,789) 707 195 Related deferred tax 18 (142) (128) 565 67 Foreign currency translation 18 (51,185) (4,060) Increase / (decline) in value of pension plan assets 18 432 (432)
Other comprehensive expense for the year (50,188) (4,425) Total comprehensive (loss) / income for the year
(138,014) 36,153
Total comprehensive (loss) / income is attributable to: Owners of the parent (138,014) 35,410 Non-controlling interests - 743
(138,014) 36,153
Notes to the financial statements are included on pages 30 to 77
For
per
sona
l use
onl
y

�������� ����������!���������"�"����������������
����
Statement of financial position as at 30 June 2011
Consolidated
Note
2011 $’000
2010 $’000
Current assets Cash 71,665 84,051 Trade and other receivables 6 387,898 406,501 Inventories 7 83,001 34,450 Current tax assets 9,026 168 Prepayments 6,938 8,510 Other financial assets 8 - 1,022 Total current assets 558,528 534,702 Non-current assets Property, plant and equipment 9 49,790 54,967 Deferred tax assets 5 24,851 23,120 Goodwill 10 320,056 424,039 Other intangible assets 11 10,232 14,777 Other financial assets 8 2,244 2,324 Total non-current assets 407,173 519,227 Total assets 965,701 1,053,929 Current liabilities Trade and other payables 12 306,894 322,953 Borrowings 13 34,705 9,478 Current tax liabilities 2,295 6,443 Provisions 16 58,155 53,439 Financial instruments 15 3,716 4,722 Contingent consideration 2,597 1,761 Total current liabilities 408,362 398,796 Non-current liabilities Borrowings 13 278,718 263,033 Provisions 16 3,168 2,905 Contingent consideration - 1,967 Total non-current liabilities 281,886 267,905 Total liabilities 690,248 666,701 Net assets 275,453 387,228 Equity Issued capital 17 340,691 299,688 Reserves 18 (60,557) (6,753) (Accumulated losses) / retained earnings 19 (4,681) 92,734 Parent owners interest 275,453 385,669 Non-controlling interest 20 - 1,559 Total equity 275,453 387,228
Notes to the financial statements are included on pages 30 to 77
For
per
sona
l use
onl
y

�������� ����������!���������"���#�"��$��
� � � � ���
Statement of cash flows for the year ended 30 June 2011
Consolidated
Note 2011 $’000
2010 $’000
Cash flows from operating activities
Receipts from customers 2,036,831 1,796,977 Payments to suppliers and employees (2,056,579) (1,737,251)
Cash from operations (19,748) 59,726
Income tax paid (7,438) (8,117)
Net cash (used)/generated by operating activities 29(a) (27,186) 51,609 Cash flows from investing activities
Payment for businesses - current year acquisitions 27 (3,311) (17,730) - acquisition of minority interest (4,887) - - prior year acquisitions (153) (107) Payment of contingent consideration for businesses (4,069) (5,845) Payment for property, plant and equipment (9,201) (10,837) Payment for intangible assets (Software) (1,923) (1,711) Proceeds from sale of property, plant and equipment 976 1,833 Advances to related parties 80 (1,336)
Net cash used in investing activities (22,488) (35,733) Cash flows from financing activities
Proceeds from issues of shares 43,504 - Payment for share issue costs (3,492) (114) Proceeds from borrowings 108,173 24,396 Repayment of borrowings (68,363) (9,387) Interest received 459 1,009 Interest and other costs of finance paid (33,975) (21,083) Dividends paid to - owners of the parent entity (9,589) (14,467) - non-controlling interests - (298)
Net cash generated/(used) by financing activities 36,717 (19,944) Net decrease in cash (12,957) (4,068) Cash at the beginning of the year 80,835 87,599 Effect of exchange rate changes on cash held in foreign currencies (5,784) (2,696) Cash at the end of the year
62,094 80,835
Reconciliation to related items in the statement of financial position: Cash 71,665 84,051 Bank overdraft (note 13) (9,571) (3,216) 62,094 80,835 Notes to the financial statements are included on pages 30 to 77
For
per
sona
l use
onl
y

�������� ����������!���������"��#�%�������&���'
� � � � ���
Statement of changes in equity for the year ended 30 June 2010
Consolidated
Note
2011 $’000
2010 $’000
Total comprehensive (loss) / income for the year
Attributable to:
Owners of the parent (138,014) 35,410
Non-controlling interests - 743
(138,014) 36,153
Transactions with owners in their capacity as owners
Shares issued for cash 17 43,504 -
Share issue costs 17 (3,492) (114)
Related income tax 17 868 34
Shares issued pursuant to dividend reinvestment plans 17 - 9,045
Share based payment 18 328 520
Shares purchased - (1,122)
Acquisition of minority interest (4,887) -
Dividends paid
- owners of the parent 22 (9,589) (23,511)
- non-controlling interest 20 (493) (298)
Net change in total equity (111,775) 20,707
Equity at the beginning of the year 387,228 366,521
Equity at the end of the year 275,453 387,228
Reconciliation of changes in equity by components Issued capital 17
Opening balance 299,688 290,093
Net change 41,003 9,595
Closing balance 340,691 299,688
Reserves 18
Opening balance (6,753) (1,096)
Net change (53,804) (5,657)
Closing balance (60,557) (6,753)
Retained earnings 19
Opening balance 92,734 76,410
Net change (97,415) 16,324
Closing balance (4,681) 92,734
Non-controlling interest 20
Opening balance 1,559 1,114
Net change (1,559) 445
Closing balance - 1,559
Equity at the end of the year 275,453 387,228
Notes to the financial statements are included on pages 30 to 77
For
per
sona
l use
onl
y

�������� ����������(���������#��"����������������
� � � � ���
Notes to the financial statements for the year ended 30 June 2011
Note Contents Note Contents
1 Significant accounting policies 21 Earnings per share
2 Segment information 22 Dividends
3 Significant items 23 Commitments for expenditure
4 Net finance costs 24 Contingent liabilities
5 Income taxes 25 Leases
6 Trade and other receivables 26 Subsidiaries
7 Inventories 27 Business acquisitions
8 Other financial assets 28 Jointly controlled operations and assets
9 Property, plant and equipment 29 Cash flows
10 Goodwill 30 Financial instruments
11 Other intangible assets 31 Performance rights
12 Trade and other payables 32 Key management personnel compensation
13 Borrowings 33 Related party disclosures
14 Financing facilities 34 (Loss) / profit for the year
15 Other financial liabilities 35 Employee benefit expense
16 Provisions 36 Remuneration of auditors
17 Issued capital 37 Parent entity information
18 Reserves 38 Subsequent events
19 (Accumulated losses) / retained earnings 39 General information
20 Non-controlling interests
For
per
sona
l use
onl
y

�������� ����������(���������#��"����������������
� � � � ���
1. Significant accounting policies
Statement of compliance
These general purpose financial statements have been prepared in accordance with the Corporations Act 2001, Accounting Standards and Interpretations, and comply with other requirements of the law.
The financial statements comprise the consolidated financial statements of the Group.
Accounting Standards include Australian equivalents to International Financial Reporting Standards (‘A-IFRS’). Compliance with the A-IFRS ensures that the financial statements comply with International Financial Reporting Standards.
The financial statements were authorised for issue by the directors on 29 August 2011.
Basis of preparation The financial statements have been prepared on an historical cost basis, except for the revaluation of
certain financial instruments. Cost is based on the fair values of the consideration given in exchange for assets.
The preparation of financial statements in conformity to Australian Accounting Standards require the Directors to make judgments, estimates and assumptions about carrying values of assets and liabilities that are not readily apparent from other sources. The estimates and associated assumptions are based on historical experience and various other factors that are believed to be reasonable under the circumstance, the results of which form the basis of making the judgments. Actual results may differ from these estimates.
The estimates and underlying assumptions are reviewed on an ongoing basis. Revisions to accounting estimates and underlying assumptions are recognised in the period in which the estimate is revised if the revision affects only that period, or in the period and future periods if the revision affects both current and future periods.
The estimates and judgments that have a significant risk of material adjustments in the next financial year are disclosed as appropriate in the notes to the financial statements.
Accounting policies are selected and applied in a manner which ensures that the resulting financial information satisfies the concepts of relevance and reliability, thereby ensuring that the substance of the underlying transactions or other events is reported.
All amounts are presented in Australian dollars, unless otherwise noted.
The company is of a kind referred to in ASIC Class Order 98/0100 and in accordance with that Class Order amounts in the financial report are rounded off to the nearest $’000, unless otherwise indicated.
Going concern
The financial report has been prepared on the going concern basis, which assumes continuity of normal business activities and the realisation of assets and the settlement of liabilities in the ordinary course of business. The Hastie Group (“Hastie”) incurred a net loss from continuing operations after tax of $87,826,000 and experienced a net decrease in cash before the effect of exchange rate changes on cash held in foreign currencies of $12,957,000 during the year ended 30 June 2011. However, as of that date, the consolidated entity’s current assets exceeded its current liabilities by $150,166,000. Pursuant to the terms of its bilateral financing facilities detailed in notes 13 and 14, Hastie was required to comply with certain banking covenants which are assessed at the end of each quarter. While Hastie was in compliance with these covenants for the quarter ended 31 December 2010, ongoing challenging market conditions resulted in Hastie being at risk of breaching certain of its banking covenants subsequent to 31 December 2010. In the event of such a covenant breach, each financier would have had the right to demand or accelerate repayment of amounts owed to them.
For
per
sona
l use
onl
y

�������� ����������(���������#��"����������������
� � � � ���
1 Significant accounting policies (continued) As a result of the above situation, Hastie approached its Banking Group who committed to support Hastie
to continue trading as a going concern. As a consequence, on 8 April 2011 Hastie entered into: • a Standstill Deed; and • a new syndicated Funding Agreement
with its Banking Group comprising: ANZ Banking Group Limited, ANZ National Bank, Bank of Scotland International, Commonwealth Bank of Australia, HSBC Australia, HSBC Middle East, National Australia Bank, Ulster Bank and Westpac Banking Corporation. The key features of these agreements included that during the standstill period, and subject to Hastie meeting certain conditions and financial and other performance targets:
(a) ongoing funding, bonding and working capital facilities would be provided on a syndicated basis to support business requirements;
(b) covenant calculations would not be undertaken during the standstill period, including as at 30 June 20ll; and
(c) the Banking Group would not demand or accelerate repayment of any amounts under Hastie’s bilateral facilities, or take any enforcement action by reason of any breach of the financial covenants in each bilateral facility.
The standstill period was due to end on 1 August 2011 unless extended by agreement with each bank. Following the conclusion of this process:
(a) on 8 June 2011, Hastie signed new syndicated debt facilities with its Banking Group, including:
• a $146 million term debt facility; • a revolving credit facility of $113.9 million, expected to be initially drawn to c.$50 million; and • committed project bonding and letter of credit facilities of $300 million,
where all facilities have a staggered maturity profile, with two thirds of the committed amounts maturing on 31 July 2013, and the balance on 31 July 2014. The first draw down on these new syndicated debt facilities was subject to Hastie satisfying a number of conditions, including repaying a minimum of $102 million of its existing debt facilities.
(b) on 14th June 2011 Hastie announced that it would raise approximately $160 million by way of:
• $7.2 million through an initial share placement to funds managed by Lazard Australia Private Equity Pty Ltd;
• $110 million through a 2.85 for 1 fully underwritten accelerated renounceable entitlement offer; and
• $42.8 million through a fully underwritten conditional placement to institutional investors, subject to shareholder approval at an Extraordinary General meeting of Hastie Group to be held on 22 July 2011.
Hastie intended to apply the net proceeds received from the initial share placement and upon settlement of its accelerated renounceable entitlement offer to repay at least $102 million of existing debt facilities and thereby bring the new syndicated debt facilities in to force.
For
per
sona
l use
onl
y

�������� ����������(���������#��"����������������
� � � � ���
1 Significant accounting policies (continued)
At 30 June 2011:
• the initial share placement and the institutional component of the accelerated renounceable entitlement offer had been completed raising $43.5 million ($40.0 million net of equity raising fees and costs);
• following receipt of the funds from the initial share placement, on 17 June 2011 and the institutional component of the accelerated renounceable entitlement offer, on 27 June 2011, Hastie repaid a $25.0 million to its Banking Group;
• the retail element of the entitlement offer had been fully underwritten, but not completed, totalling $73.7 million; and
• the conditional placement had also been conducted, totalling $42.8 million, but where completion remained subject to shareholder approval.
Since 30 June 2011:
• on 18 July 2011 Hastie announced the successful completion of the retail component of its fully underwritten 2.85 for 1 accelerated renounceable entitlement offer, raising $73.7 million; which represented the completion of the final stage of the entitlement offer announced on 14 June 2011;
• Following receipt of the funds from the retail component of the entitlement offer Hastie, on 18 July 2011, Hastie repaid a further $81 million to its Banking Group ($106 million in aggregate, including $25 million repaid in June 2011 out of the proceeds of the institutional component of the entitlement offer) thereby bringing the new syndicated debt facilities in to force. Drawings under these new facilities were then used to repay all previous bilateral debt facilities and all bonds and trade letters of credit issued under bilateral or syndicated standstill facilities were novated to the new syndicated debt facilities; following which the previous bilateral facilities and the syndicated standstill funding agreement, signed on 8 April 2011, were cancelled. From 18 July 2011 Hastie was no longer subject to the terms of the standstill deed entered in to on 8 April 2011 and it’s relations with its Banking Group are now solely governed by the terms of the new syndicated debt facilities signed on 8 June 2011;
• on 22nd July 2011 at Hastie’s Extraordinary General Meeting shareholders voted in favour of the conditional placement totalling $42.8 million, where the funds, net of equity raising fees and costs, were received on 26 July 2011 and used to further pay down debt; this represented the completion of the final stage of Hastie’s $160 million equity raising; and
• on 11 August 2011 an offer to participate in the Hastie Group Share Purchase Plan was dispatched to existing Australian and New Zealand shareholders on the register as at 7pm (Sydney time) on 5 August 2011 inviting each of them to participate up to a maximum amount of $15,000 based on a share price of $0.14 per share. The offer will close at 5pm (Sydney time) on 1 September 2011 with shares allotted on 12 September 2011.
The Directors consider that there are reasonable grounds to believe that Hastie will be able to pay its debts as and when they become due and payable. In forming this view, the Directors have given consideration to the following matters:
(i) the successful $160 million equity raising noted above; (ii) The new syndicated banking facilities which came in to force on 18 July 2011, noted above; (iii) Hastie continues to trade profitably (excluding the impact of non cash significant items: doubtful
debt provisions and goodwill impairment); and (iv) Hastie’s profit forecast and cash requirements through to the end of September 2012.
For
per
sona
l use
onl
y

�������� ����������(���������#��"����������������
� � � � ���
1 Significant accounting policies (continued) The following significant accounting policies have been applied in the preparation and presentation of the
financial statements:
(a) Basis of consolidation
The consolidated financial statements incorporate the financial statements of the Company and entities controlled by the Company (its subsidiaries). Control exists where the Company has the power to govern the financial and operating policies of an entity so as to obtain benefits from its activities. Subsidiaries are fully consolidated from the date control commences until the date that control ceases. A list of subsidiaries appears in note 26.
Consistent accounting policies are employed in the preparation and presentation of the consolidated financial statements, and all intra-group balances, transactions, income and expenses are eliminated in full on consolidation.
The interest of non-controlling shareholders consists of their share of the fair values of the assets and liabilities recognised at the time of the original acquisition and their share of the changes in equity since that time.
(b) Changes in accounting policies on initial application of Accounting Standards
No amending Standards adopted during the year had a material impact on the financial report.
(c) Foreign currency
All foreign currency transactions during the financial year are translated at the exchange rate ruling at the date of the transaction. Foreign currency monetary assets (including goodwill) and liabilities at reporting date are translated at the exchange rates ruling at that date. Non-monetary assets and liabilities that are measured in terms of historical cost in a foreign currency are translated using the exchange rate at the date of the transaction.
On consolidation, the assets and liabilities of the Group’s foreign operations are translated to Australian dollars at exchange ruling at balance date, while income and expenses are translated at the average exchange rates for the year. Exchange differences arising are recognised in the foreign currency translation reserve.
(d) Financial assets
Investments in subsidiaries, associates and other investments are measured at cost.
Trade receivables, loans, and other receivables are recorded at amortised cost less impairment losses.
(e) Derivative Financial instruments
The Group uses derivative financial instruments such as forward foreign exchange contracts and interest rate swaps to hedge its exposure to interest rate and foreign exchange rate risk.
The effective portion of changes in the fair value of cash flow hedges are recognised in equity in the hedging reserve, while the ineffective portion is recognised immediately in profit or loss.
Amounts deferred in equity are recycled in profit or loss in the periods when the hedged item is recognised in profit or loss. However, when the forecast transaction that is hedged results in the recognition of a non-financial asset, the amounts previously deferred in equity are transferred and included in the initial measurement of the cost of the asset.
Hedge accounting is discontinued when the hedging instrument expires or is sold, terminated, or exercised, or no longer qualifies for hedge accounting. At that time, any cumulative gain amount deferred in equity remains in equity and is recognised when the forecast transaction is ultimately recognised in profit or loss. When a forecast transaction is no longer expected to occur, the cumulative amount in equity is recognised immediately in profit or loss.
Debt and equity instruments are classified as either liabilities or as equity in accordance with the substance of the contractual arrangement.
For
per
sona
l use
onl
y

�������� ����������(���������#��"����������������
� � � � ���
1. Significant accounting policies (continued) (f) Revenue recognition
Sale of goods
Revenue from the sale of goods is recognised when the Group has transferred to the buyer the significant risks and rewards of ownership of the goods.
Rendering of services
Revenue from services rendered is recognised in proportion to the stage of completion of the transaction. The stage of completion is determined by reference to work performed.
Construction contracts
Revenue from contracts is generally recognised on an individual contract basis by reference to the recoverable costs incurred during the financial period plus the percentage of margin earned. Percentage of margin earned is measured by the proportion that costs incurred to date bear to the estimated costs of the contract. Where a loss is expected to occur it is recognised immediately and is made for both work in progress to date and for future work on the contract. Variations in contract work, claims and incentive payments are included to the extent it is probable the customer will approve and accept them.
(g) Joint ventures Interests in jointly controlled assets and operations are reported in the financial statements by
including in their respective classification categories the Group’s share of assets employed, liabilities incurred and income and expenses.
(h) Property, plant and equipment
Plant and equipment, leasehold improvements and equipment under finance lease are stated at cost less accumulated depreciation and impairment. Cost includes expenditure that is directly attributable to the acquisition of the item.
Depreciation is calculated on a straight line basis so as to write off the net cost of each asset over its estimated useful life as follows:
Buildings 50 years Leasehold improvements Term of lease Plant and equipment 4 - 15 years Motor vehicles 4 - 5 years Office furniture and equipment 5 - 15 years
The estimated useful lives, residual values and depreciation method are reviewed at each financial year end.
(i) Leased assets
The Group enters into leases as a lessee, in respect of both finance and operating leases.
Finance lease assets are initially recognised as assets at their fair value at the inception of the lease or, if lower, at the present value of the minimum lease payments. The corresponding liability to the lessor is included in the statement of financial position as a finance lease liability.
Finance lease payments are apportioned between finance charges and reduction of the lease liability so as to achieve a constant periodic rate of interest on the outstanding lease liability. Finance charges are recognised as an expense in profit or loss.
Finance leased assets are amortised on a straight line basis over the estimated useful life of the asset.
Operating lease payments are recognised as an expense on a straight-line basis over the lease term.
For
per
sona
l use
onl
y

�������� ����������(���������#��"����������������
� � � � ���
1. Significant accounting policies (continued) (j) Business acquisitions
Acquisition of subsidiaries and businesses are accounted for using the acquisition method, where cost is compared with the net assets acquired. Cost is measured as the fair values of assets given, liabilities incurred or assumed, and equity instruments issued. The acquiree’s identifiable assets and liabilities are recognised at their fair values at the acquisition date.
The excess of the cost over the fair value of the net assets acquired is recorded as goodwill.
Acquisition related costs are expensed as incurred.
Where settlement of any part of cash consideration is deferred, the future amounts payable are discounted to their present value as at the date of exchange, using the Group’s incremental borrowing rate as the discount rate.
The interest of minority shareholders in the acquiree is initially measured at the minority’s proportion of the net fair value of the assets and liabilities recognised.
Specific intangible assets are recognised at the time of a business acquisition where it is probable that the expected future economic benefits that are attributable to the asset will flow to the Group, and the cost of the asset can be measured reliably.
Contractual customer relationships acquired in a business acquisition are identified and recognised separately from goodwill where they satisfy the definition of an intangible asset and their fair values can be measured reliably. The fair value is determined by way of an excess earnings approach and amortised over the expected life of the contractual relationship.
Brand names acquired in a business acquisition are identified and recognised separately from goodwill where they satisfy the definition of an intangible asset and their fair values can be measured reliably.
Brand names recognised by the Group are considered to have indefinite lives and are not amortised. Each period, the useful life is reviewed to determine whether events and circumstances continue to support an indefinite useful life assessment for the asset. Such assets are tested for impairment at least annually or more frequently if events or circumstances indicate that the asset might be impaired.
(k) Goodwill
Goodwill arising in a business acquisition represents the excess of the cost of acquisition over the fair value of the Group’s share of the net identifiable assets acquired.
If the Group’s share of the net identifiable assets acquired exceeds the cost of acquisition, the excess is recognised immediately in profit or loss as a bargain purchase gain.
Goodwill is not amortised, but is allocated to the Group’s cash generating units and is tested for impairment annually, and whenever an indication of impairment exists.
An impairment of goodwill is not subsequently reversed.
For
per
sona
l use
onl
y

�������� ����������(���������#��"����������������
� � � � ���
1. Significant accounting policies (continued) (l) Impairment of assets
Financial assets, other than those at fair value through profit of loss, are assessed for indicators of impairment at each balance sheet date. Financial assets are impaired where there is objective evidence that, as a result of one or more events that occurred after the initial recognition of the financial asset, the estimated future cash flows of the investment have been impacted.
The carrying amounts of the Group’s tangible and intangible assets, including goodwill, are assessed annually for impairment. An impairment loss is recognised in the profit and loss for the amount by which the assets carrying amount exceeds its recoverable amount.
Recoverable amount is the higher of fair value less costs to sell and value in use. In assessing value in use, the estimated future cash flows are discounted to their present value using a pre-tax discount rate that reflects current market assessments of the time value of money and the risks specific to the asset for which the estimates of future cash flows have not been adjusted.
For an impaired trade receivable the carrying amount is reduced through the use of an allowance account. When a trade receivable is uncollectible, it is written off against the allowance account. Subsequent recoveries of amounts previously written off are credited against the allowance account. Changes in the carrying amount of the allowance are recognised in profit or loss.
An impairment of goodwill is not subsequently reversed.
Where an impairment loss on other assets subsequently reverses, the carrying amount is increased to the revised estimated recoverable amount, but only to the extent that the increased carrying amount does not exceed the original carrying amount.
(m) Income tax
Current tax
Current tax is the tax payable on the taxable income for the year, using tax rates and laws that have been enacted or substantively enacted by reporting date, and any adjustment to tax payable in respect of prior years. Current tax for current and prior periods is recognised as a liability (or asset) to the extent that it is unpaid (or refundable).
Deferred tax
Deferred tax is recognised on temporary differences between the tax bases of assets and liabilities and their carrying amounts in the financial statements.
Deferred tax is not recognised if the temporary differences arise from the initial recognition of assets and liabilities (other than as a result of a business acquisition) which affects neither taxable income nor accounting profit, nor is a deferred tax liability recognised in relation to the initial recognition of goodwill. Deferred tax assets are recognised only to the extent that it is probable that sufficient taxable amounts will be available to utilise the temporary differences.
Deferred tax is determined using tax rates and laws that have been enacted or substantively enacted by reporting date, and that are expected to apply when the related asset is realised or the liability is settled.
Deferred tax assets and liabilities are offset when they relate to income taxes levied by the same taxation authority and the Group intends to settle its current tax assets and liabilities on a net basis.
Current and deferred tax for the year
Current and deferred tax is recognised in the income statement, except when it relates to items recognised directly in equity, in which case it is recognised there. Where it arises from the initial accounting for a business acquisition, it is taken into account in determining goodwill.
For
per
sona
l use
onl
y

�������� ����������(���������#��"����������������
� � � � ���
1. Significant accounting policies (continued) (n) Intangible assets – Software
Software represents principally the investment in the Group’s ERP systems, including some internally generated cost, and is recorded at cost less accumulated amortisation and impairment. Amortisation is charged on a straight line basis over the estimated useful lives of five years. The estimated useful life and amortisation method are reviewed annually.
(o) Inventories
Inventories are stated at the lower of cost and net realisable value. Costs, including an appropriate portion of fixed and variable overhead expenses, are assigned to inventory on hand by the method most appropriate to each particular class of inventory, with the majority being valued on a first in first out basis. Net realisable value is the estimated selling price less the estimated costs of completion and selling expenses.
(p) Construction work in progress
Construction work in progress represents the total of costs incurred to date plus recognised profits less recognised losses and progress billings. On contracts where billings exceed the total costs incurred plus profit margins, the net amounts are presented under trade and other payables.
(q) Cash
Cash comprises cash on hand and in banks.
Bank overdrafts are shown within borrowings under current liabilities in the statement of financial position.
(r) Provisions
Provisions are recognised when the Group has a present obligation as a result of a past event, it is probable that the Group will be required to settle the obligation, and the amount of the provision can be reliably estimated.
The amount recognised as a provision is the best estimate of the consideration required to settle the present obligation at reporting date, taking into account the risks and uncertainties surrounding the obligation.
(s) Employee benefits
Provision has been made for benefits accruing to employees in respect of wages and salaries, annual leave, long service leave, and sick leave when it is probable that settlement will be required and they are capable of being reliably measured.
Provisions made in respect of employee benefits expected to be settled within one year are measured at the amount of expected payment to the employee.
The portions of provisions expected to be settled later than one year are measured as the present value of the estimated future cash outflows to be made by the Group in respect of services provided by employees up to reporting date.
Contributions to defined contribution superannuation plans are expensed when incurred.
(t) Goods and services tax
Revenues, expenses and assets are recognised net of the amount of GST, except:
i. where the GST incurred is not recoverable from the taxation authority, it is recognised as part of the cost of acquisition of an asset or as part of an item of expense; or
ii. receivables and payables are stated inclusive of GST.
The net amount of GST payable to the taxation authority is included as part of payables.
Cash flows are included in the Statement of Cash Flows on a gross basis, and the GST component of cash flows arising from investing and financing activities which is recoverable from, or payable to, the taxation authority is classified as operating cash flows.
For
per
sona
l use
onl
y

�������� ����������(���������#��"����������������
� � � � ���
1. Significant accounting policies (continued) (u) Share-based payments
Equity-settled share-based payments are measured at fair value at the grant date. Fair value is measured by use of a Black-Scholes and Barrier Pricing model. The expected life used in the model has been adjusted, based on management’s best estimate, for the effects of non-transferability, exercise restrictions and behavioural considerations.
The fair value determined at the grant date of the equity-settled share-based payments is expensed on a straight-line basis over the vesting period, based on the Group’s estimate of shares that will eventually vest.
(v) Standards and Interpretations issued not early adopted
At the date of authorisation of these financial statements, a number of Standards and Interpretations were in issue but not yet effective.
Initial application of the following Standards applicable to the Group is not expected to have any material impact on the financial report of the Group and the company:
Standard/Interpretation
Effective and will be initially applied by Hastie Group in the financial year ending
• AASB 124 Related Party Disclosures (revised December 2009), AASB 2009-12 Amendments to Australian Accounting Standards
30 June 2012
• Interpretation – Prepayments of a Minimum Funding Requirement
30 June 2012
• AASB 9 Financial Instruments, AASB 2009-11 and AASB 2010-7 Amendments to Australian Accounting Standards arising from AASB 9
30 June 2014
• AASB 2010-5 Amendments to Australian Accounting Standards
30 June 2012
• AASB 2010-6 Amendments to Australian Accounting Standards – Disclosures on Transfers of Financial Assets
30 June 2012
• AASB 2010-8 Amendments to Australian Accounting Standards – Deferred Tax: Recovery of Underlying Assets
30 June 2013
For
per
sona
l use
onl
y

�������� ����������(���������#��"����������������
� � � � ���
2. Segment information
The principal products and services of each of Hastie’s segments are as follows:
• Mechanical, Electrical & Plumbing
Design, engineering, assembly and installation of :
- commercial and industrial air conditioning
- electrical, communications and data services
- fire protection systems
- commercial plumbing and drainage systems
- commercial and industrial refrigeration
Principally in Australasia. • Services Preventative maintenance and breakdown repair services for commercial and
industrial air conditioning and related systems, and fire and electronic security services.
Solely in Australasia. • Rotary Design, engineering, assembly and installation of commercial and industrial air
conditioning, electrical and plumbing products and systems, in UK, Ireland, and selected overseas markets.
• Middle East Design, engineering, assembly and installation of commercial and industrial air conditioning, electrical and plumbing products and systems, in the Middle East region, including Dubai, Abu Dhabi, Oman and Qatar.
Following an operational/management restructure, from 1 July 2010 there are no longer separate Mechanical & Hydraulics and Electrical segments, with the operations combined into a single Mechanical, Electrical & Plumbing (MEP) segment. Middle East operations, previously reported in Mechanical & Hydraulics and Rotary Segments, are now shown as a separate segment. The 2010 comparatives below have been adjusted to reflect this.
The chief operating decision maker assesses performance of the operating segments based on the operations of the segment, without allocation of interest receivable and central other income. Segment results represents the profit earned by each segment after allocating central costs, based on a measure of segment revenue and operations, without allocation of net finance costs, acquisition related costs expensed in accordance with AASB 3 Business Combinations and income tax expenses.
Segment revenues
External revenue
Other
Total
2011 $’000
2010 $’000
2011 $’000
2010 $’000
2011 $’000
2010 $’000
Mechanical, Electrical & Plumbing 1,139,524 1,041,393 985 2,345 1,140,509 1,043,738 Services 305,102 217,774 392 523 305,494 218,297 Rotary 240,918 294,264 1,765 570 242,683 294,834 Middle East 163,299 97,650 - 282 163,299 97,932 Total of segment revenues 1,848,843 1,651,081 3,142 3,720 1,851,985 1,654,801 Unallocated - - 459 1,009 459 1,009 Consolidated 1,848,843 1,651,081 3,601 4,729 1,852,444 1,655,810
For
per
sona
l use
onl
y

�������� ����������(���������#��"����������������
� � � � ���
2. Segment information (continued)
Segment results
Operating Earnings
2011 $’000
Significant Items
(see note 3) 2011 $’000
Total
Earnings 2011 $’000
Total
Earnings 2010 $’000
Mechanical, Electrical & Plumbing 27,193 (3,963) 23,230 52,861 Services 10,635 (3,288) 7,347 9,438 Rotary 7,574 (24,593) (17,019) 6,280 Middle East 2,122 (72,083) (69,961) 4,542 Segment results 47,524 (103,927) (56,403) 73,121
Net finance costs (35,142) (20,637) Standstill costs (2,304) - Gain on acquisition - 1,579 Acquisition-related costs (321) (2,154) (Loss) / Profit before tax (94,170) 51,909
The amounts provided to the chief operating decision maker with respect to assets are measured based on the operations of the segment and the physical location of the asset, without allocation of those assets maintained centrally and tax assets. Liabilities are measured based on the operations of the segment, without allocation of those liabilities managed centrally and tax liabilities.
Segment assets and liabilities
Assets
Liabilities
2011
$’000 2010 $’000
2011 $’000
2010 $’000
Mechanical, Electrical & Plumbing 525,712 479,130 242,750 196,423 Services 132,881 140,975 36,867 44,099 Rotary 187,252 251,547 78,221 91,145 Middle East 77,899 143,617 68,832 55,673 Segment totals 923,744 1,015,269 426,670 387,340 Unallocated (1) 41,957 38,660 263,578 279,361 Consolidated total assets and liabilities 965,701 1,053,929 690,248 666,701 (1) Unallocated assets and liabilities are predominantly cash and borrowings, respectively, managed centrally.
Other segment information
Additions to Non-current assets
Depreciation
and amortisation
2011 $’000
2010 $’000
2011 $’000
2010 $’000
Mechanical, Electrical & Plumbing 7,786 16,282 7,130 6,732 Services 1,645 8,097 4,303 3,045 Rotary 8,254 105 1,099 1,161 Middle East 482 143 472 665 Unallocated 1,368 1,866 2,066 1,895 19,535 26,493 15,070 13,498
For
per
sona
l use
onl
y

�������� ����������(���������#��"����������������
� � � � ���
2. Segment information (continued)
Geographical information
Geographical segments
Revenue from
external customers
Non-current assets
2011 $’000
2010 $’000
2011 $’000
2010 $’000
Australia 1,345,963 1,148,431 384,115 387,363 United Kingdom 237,041 255,723 17,194 127,476 Other Overseas 265,839 246,927 5,864 4,388 1,848,843 1,651,081 407,173 519,227
3. Significant Items
Doubtful debts provision
Due to continued difficult trading conditions, in particular in the Middle East and Republic of Ireland, significant provisions for aged debts totalling $33,450,000 have been made in the 2011 annual results. (2010: significant provisions for aged debts totalling $4,694,000, in the Turks & Caicos).
Goodwill impairment
Due to continued difficult trading conditions, and uncertainties around cash flows in the Middle East, a charge of $69,129,000 for goodwill impairment has been taken in respect of Rotary businesses in the Middle East in the 2011 annual results.
Write-off of Rotary brand name
Due to continued difficult trading conditions, and uncertainties around cash flows in the Middle East, a charge of $1,348,000, to write-down the value of Rotary brand names in the Middle East and other international markets, has been taken in the 2011 annual results.
Standstill costs
On 11 April 2011 Hastie entered into a syndicated Standstill Facilities Agreement with its Banking Group. Costs incurred during the standstill period and directly associated with the syndicated Standstill Facilities Agreement were $2,304,000 and were predominantly fees for independent accounting services required by the Banking Group at Hastie’s cost and legal fees.
In addition, on 19 July 2011 Hastie paid to the Banking Group $2,557,000 of fees incurred during the standstill period and directly associated with the syndicated Standstill Facilities Agreement, which are included in finance costs, refer note 4.
For
per
sona
l use
onl
y

�������� ����������(���������#��"����������������
� � � � ���
2011
$’000 2010 $’000
4. Net finance costs
Interest income from: Bank deposits 459 844 Other - 165 459 1,009
Finance costs: Loan interest and fees (20,985) (17,105) Interest on contingent consideration (344) (122) Bank and guarantee fees (5,761) (2,654) Loan establishment fees (i) (5,080) (1,513) Bank standstill fees (2,557) - Net foreign exchange loss (874) (252) (35,601) (21,646) Net finance costs (35,142) (20,637)
(i) On 18 July 2011 new syndicated financing facilities came into force, refer note 1. This required loan
establishment fees in respect of the prior bilateral facilities, not previously amortised, of $3,802,000 be expensed in the period.
5. Income taxes (a) Income tax recognised in the income statement The income tax expense reconciles to the accounting profit as follows: (Loss) / profit before tax (94,170) 51,909 Prima facie tax at the Australian tax rate of 30% (28,251) 15,573 Adjusted for: Research & development allowance (4,035) (1,995) Deductible expenses (367) (1,036) Non-deductible expenses 7,112 776 Tax exempt income 18,783 (1,015) Overseas tax rate differential 4,215 1,362 Over provisions in prior years Research & development allowance (2,130) (2,158) Other (1,671) (176) Income tax (benefit) / expense (6,344) 11,331
Tax (benefit) / expense comprises Current income tax Current year (1,970) 13,124 Adjustments for prior years (3,320) (2,779) Deferred income tax Current year (573) 541 Adjustments for prior years (481) 445 Income tax (benefit) / expense (6,344) 11,331
For
per
sona
l use
onl
y

�������� ����������(���������#��"����������������
� � � � ���
2011
$’000 2010 $’000
5. Income taxes (continued)
(b) Deferred tax assets recognised directly in equity Relating to amortisation of share issue costs 868 34 (c) Deferred tax assets recognised in other comprehensive income Relating to revaluations of cash flow hedges (142) (128) (d) Deferred tax balances Provisions
& accruals
Share issue costs Hedging Retentions Other Total
$’000 $’000 $’000 $’000 $’000 $’000
Balance at 1 July 2009 20,644 1,581 1,385 (1,063) (93) 22,454 Addition from business acquisitions (45) - - - 391 346 Tax expense 251 (482) - (59) 1,440 1,150 Charged to equity - 34 - - - 34 Other comprehensive income recognised - - (128) - - (128) Transfer to goodwill (40) - - - - (40) Foreign currency translation (248) - - - (3) (251) Other (468) - - - 23 (445) Balance at 30 June 2010 20,094 1,133 1,257 (1,122) 1,758 23,120 Addition from business acquisitions 333 - - - - 333 Tax expense 3,730 (655) - (59) (1,962) 1,054 Charged to equity - 868 - - - 868 Other comprehensive income recognised - - (142) - - (142) Foreign currency translation (409) - - 57 (30) (382) Balance at 30 June 2011 23,748 1,346 1,115 (1,124) (234) 24,851
(e) Tax consolidation Tax consolidation within the Group
The company and its wholly-owned Australian resident subsidiaries have formed a tax consolidated group with effect from 1 April 2005 and are therefore taxed as a single entity from that date. Hastie Group Limited is the head entity within the tax consolidated group, and the group members are identified in note 26.
Nature of tax funding arrangements and tax sharing agreements
Entities within the tax consolidated group have entered into tax funding and tax-sharing agreements with the head entity. Under the tax funding arrangement, Hastie Group Limited and each of the subsidiaries in the tax consolidated group has agreed to make a tax equivalent payment to or from the head entity, based on the subsidiary’s current tax liability or asset; in addition to its own current and deferred tax amounts.
The tax sharing agreement provides for the determination of the allocation of income tax liabilities between the entities should the head entity default on its tax payment obligations.
For
per
sona
l use
onl
y

�������� ����������(���������#��"����������������
� � � � ���
2011 $’000
2010 $’000
6. Trade and other receivables Trade receivables 408,042 405,036 Allowance for doubtful debts (36,164) (10,574) 371,878 394,462 Other receivables 16,020 12,039 387,898 406,501
Trade receivables are generally regarded as past due when the invoices are unpaid after 90 days after the end of the month raised.
As at 30 June 2011 trade receivables of $ 44,230,000 (2010: $83,288,000) were past due but not impaired.
The Group has not provided for these as there has not been a significant change in credit quality and the Group believes that the amounts are still considered recoverable. These receivables are on average 38 days (2010: 40 days) past due. The Group does not hold any collateral over these balances.
The Group has adopted a policy of only dealing with creditworthy counterparties as a means of mitigating the risk of financial loss from defaults.
Allowance for doubtful debts: Opening balance (10,574) (5,260) Additional allowances from business acquisitions (865) (1,844) Net amount recognised in profit and loss (31,704) (6,306) Write offs against allowance 5,797 2,353 Foreign currency translation 1,182 483 Closing balance (36,164) (10,574)
In determining the recoverability of a trade receivable the Group considers any change in the credit quality of the
trade receivable from the date credit was initially granted up to the reporting date. The concentration of credit risk is limited due to the customer base being large and unrelated.
7. Inventories
Raw materials 18,914 18,354 Work in progress – service 8,582 15,851
Work in progress – construction (see below) 54,106 - Finished goods 1,399 245 83,001 34,450
Construction contracts Construction work in progress 2,913,506 2,130,874 Progress billings and advances received (1) (2,859,400) (2,134,047) 54,106 (3,173)
(1) The net construction work in progress amount for 2011 is included in inventories (refer above). For 2010 the net construction work in progress amount is included in trade and other payables, see note 12.
For
per
sona
l use
onl
y

�������� ����������(���������#��"����������������
� � � � ���
2011 $’000
2010 $’000
8. Other financial assets
Current Foreign currency forward contracts (note 30(c)) - 1,022 Non-current Shares in non-controlled entities at cost 604 604 Non-interest bearing advance to a related but non-controlled entity 1,640 1,720 2,244 2,324 9. Property, plant and equipment
Land and buildings
Leasehold Improve-
ments Plant and
Equipment Motor
Vehicles
Office furniture & Equipment Total
$’000 $’000 $’000 $’000 $’000 $’000 Movement in net book value Balance at 1 July 2009 14,778 8,041 13,444 11,906 8,534 56,703 Reallocation to intangibles - - - - (1,053) (1,053) Additions from business acquisitions - 823 876 993 544 3,236 Other additions - 1,540 3,566 1,930 4,228 11,264 Disposals - (327) (450) (727) (54) (1,558) Depreciation & amortisation expense (238) (1,479) (2,803) (3,498) (3,048) (11,066) Foreign currency translation (2,054) (146) (19) (181) (159) (2,559) Balance at 30 June 2010 12,486 8,452 14,614 10,423 8,992 54,967 Additions from business acquisitions - - - 281 39 320 Other additions - 2,397 3,141 2,668 2,133 10,339 Disposals - (19) (161) (672) (10) (862) Depreciation & amortisation expense (201) (1,677) (3,079) (3,795) (3,655) (12,407) Foreign currency translation (1,861) (188) (179) (196) (143) (2,567) Balance at 30 June 2011 10,424 8,965 14,336 8,709 7,356 49,790 Balances As at 30 June 2010 Cost 12,982 12,855 30,271 18,341 19,379 93,828 Accumulated depreciation (496) (4,403) (15,657) (7,918) (10,387) (38,861) Net book value 12,486 8,452 14,614 10,423 8,992 54,967 As at 30 June 2011
Cost 11,033 14,818 31,943 16,830 20,561 95,185 Accumulated depreciation (609) (5,853) (17,607) (8,121) (13,205) (45,395) Net book value at 30 June 2011 10,424 8,965 14,336 8,709 7,356 49,790 Included in the Group’s motor vehicles at 30 June 2011 are assets under finance leases with a net book value of
$3,210,000 (2010: $3,338,000).
Depreciation expense is included in the line item ‘Depreciation and amortisation expense’ in the Income Statement and disclosed in note 34.
For
per
sona
l use
onl
y

�������� ����������(���������#��"����������������
� � � � ���
2011 $’000
2010 $’000
10. Goodwill
Net carrying amount Opening balance 424,039 413,763 Additional amounts recognised from : business acquisitions occurring during the year (note 27) 6,079 12,040
business acquisitions occurring in prior years 1,074 - additional costs re prior year acquisitions 153 64 Impairment of goodwill (69,129) - Reassessment of deferred consideration for prior year acquisitions - (1,879) Foreign currency translation (42,160) 51 Closing balance 320,056 424,039 During the year, the carrying value of goodwill was reduced by an impairment charge of $69,129,000, due to
uncertainty around cash flows in the Middle East, and foreign exchange movements of $42,160,000. Following an operational/management restructure, from 1 July 2010 Middle East operations, previously reported in
Mechanical & Hydraulics and Rotary cash-generating units, have been identified as a separate cash generating unit. The 2010 comparatives below have been adjusted to reflect this
Allocation of goodwill to cash-generating units For impairment testing purposes the allocation is: Mechanical & Plumbing 167,165 166,024 Electrical 59,989 59,989 Rotary 65,483 111,809 Middle East - 57,123 Services 27,419 29,094 320,056 424,039
Key assumptions
The key assumptions used in the value in use calculations are as follows:
EBITDA Budgeted EBITDA has been based on full year 2011/2012 expectations in light of past experience, short-term and long-term growth factors and expected efficiency improvements, which are consistent with the Group’s plans for focusing business operations within each identified cash-generating unit. The Group expects forecast growth factors and efficiency improvements to be reasonably achievable over the value in use assessment period. There is nil adjustment for depreciation/amortisation, as replacement capital expenditure is broadly in line with depreciation over the long-term. Rotary EBITDA has been converted at a foreign exchange rate applicable at balance date of A$1 equals GBP 0.67 over the value in use assessment period, as required by accounting standards. Middle East EBITDA has been converted at a foreign exchange rate applicable at balance date of A$1 equals AED 3.94 over the value in use assessment period, as required by accounting standards.
Long-term growth rate Five years of plan data has been used for the Group’s value in use calculations. A long-term growth rate into perpetuity has been determined by reference to the nominal GDP rates and forecast long-term compound annual growth rates in EBITDA.
For
per
sona
l use
onl
y

�������� ����������(���������#��"����������������
� � � � ���
10. Goodwill (continued)
Discount factor The discount rate applied to the cash flows of the Group’s operations is based on the risk
free rate for ten year bonds issued by the government in the respective market, where possible adjusted for a risk premium to reflect both the increased risk of investing in equities and the systematic risk of the specific Group’s operations. In making this adjustment, inputs required are the equity market risk premium (that is the required increased return required over and above a risk free rate by an investor who is investing in the market as a whole) and the risk adjustment, beta, applied to reflect the risk of the Group’s operations relative to the market as a whole. In determining the discount factor, the Group has applied an adjustment for systematic risk to the Group’s operations determined by reference to average betas determined as appropriate for the Group’s specific industries, territories and market risk profile by independent economists. The Group has used a forward looking risk premium that takes into consideration the average equity market risk premium.
Sensitivity to changes in assumptions
Other than as disclosed below, the Company believes that no reasonably possible change in any of the above key assumptions would cause the carrying value of any cash generating unit to exceed its recoverable amount.
30 June 2011
The estimated recoverable amount of the Group’s operations exceeded their carrying value in each identified cash-generating unit, applicable at 30 June 2011, by approximately $188,790,000 in aggregate.
The table below shows the key assumptions used in the value in use calculation:
Mechanical & Plumbing
Electrical
Rotary
Services
Recoverable amount exceeding carrying value ($’000) 74,446 53,874 13,405 47,065 Discount factor 9.9% 9.9% 10.7% 9.9% Long-term growth rate 3.5% 3.5% 2.5% 3.5% Budgeted EBIT (1) 19.6% -1.1% 8.1% 12.0% Notes: (1) Budgeted EBIT is expressed as the compound annual growth rates in the initial five years for all cash generating
units of the plans used for impairment testing The amount by which each key assumption must change in isolation in order for the estimated recoverable amount
to be equal to its carrying value is shown in the table below:
Mechanical & Plumbing
Electrical
Rotary
Services
pps(2) pps(2) pps(2) pps(2)
Discount factor 2.1 4.7 0.9 3.1 Long-term growth rate (2.9) (7.0) (0.9) (4.3) Budgeted EBIT (1) (6.8) (10.5) (2.5) (8.3) Notes: (1) Budgeted EBIT is expressed as the compound annual growth rates in the initial five years for all cash generating
units of the plans used for impairment testing
(2) The percentage points movement to the key assumption
For
per
sona
l use
onl
y

�������� ����������(���������#��"����������������
� � � � ���
10. Goodwill (continued)
30 June 2010
The estimated recoverable amount of the Group’s operations exceeded their carrying value in each identified cash-generating unit by approximately $645,533,000 in aggregate.
The table below shows the key assumptions used in the value in use calculation
Mechanical & Plumbing
Electrical
Rotary
Services
Recoverable amount exceeding carrying value ($’000) 301,539 191,142 30,048 122,804 Discount factor 10.53% 10.53% 11.01% 10.53% Long-term growth rate 3.5% 3.5% 3.5% 3.5% Budgeted EBIT (1) 5.0% 6.6% 16.9% 15.0% The amount by which each key assumption must change in isolation in order for the estimated recoverable amount to
be equal to its carrying value is shown in the table below:
Mechanical & Plumbing
Electrical
Rotary
Services pps(2) pps(2) pps(2) pps(2)
Discount factor 8.8 19.6 1.0 8.6 Long-term growth rate (16.4) (81.8) (1.4) (15.6) Budgeted EBIT (1) (20.8) (32.4) (2.9) (20.2) Notes: (1) Budgeted EBIT is expressed as the compound annual growth rates in the initial five years for all cash generating units
of the plans used for impairment testing
(2) The percentage points movement to the key assumption
11. Other intangible assets
Software Brand names
Customer contracts Total
$’000 $’000 $’000 $’000
Movement in net book value
Balance at 1 July 2009 5,667 7,662 1,144 14,473
Reallocation from property, plant & equipment 1,053 - - 1,053
Additions from business acquisitions 6 - - 6
Other additions 1,711 - - 1,711
Disposals (32) - - (32)
Amortisation expense (2,219) - (213) (2,432)
Foreign currency translation (10) - 8 (2)
Balance at 30 June 2010 6,176 7,662 939 14,777
Additions 1,923 - - 1,923
Amortisation expense (2,425) - (238) (2,663)
Write-down of brand value - (1,348) - (1,348)
Foreign currency translation (70) (2,112) (275) (2,457)
Balance at 30 June 2011 5,604 4,202 426 10,232
For
per
sona
l use
onl
y

�������� ����������(���������#��"����������������
� � � � ���
11. Other intangible assets (continued)
Software
Brand names
Customer contracts Total
$’000 $’000 $’000 $’000
Balances As at 30 June 2010
Cost 12,583 7,662 1,479 21,724
Accumulated amortisation (6,407) - (540) (6,947)
Net book value 6,176 7,662 939 14,777
As at 30 June 2011
Cost 14,283 4,202 1,071 19,556
Accumulated amortisation (8,679) - (645) (9,324)
Net book value 5,604 4,202 426 10,232
Amortisation expense is included in the line item ‘Depreciation and amortisation expense’ in the Income Statement and disclosed in note 34.
2011 $’000
2010 $’000
12. Trade and other payables
Trade payables 247,459 269,227 Amounts due to customers under construction contracts (note 7) - 3,173 Goods and services tax payable 9,968 9,006 Accruals and other payables 49,467 41,547 306,894 322,953
13. Borrowings
Secured
Current Bank overdrafts (i) 9,571 3,216 Bank loans (i) 22,729 3,266 Hire purchase contracts (ii) 1,348 1,566 Finance lease liabilities (iii) (note 25) 1,057 1,430 Total current borrowings(iv) 34,705 9,478
Non-current Bank loans (i) 275,389 258,827 Hire purchase contracts (ii) 1,354 2,144 Finance lease liabilities (iii) (note 25) 1,975 2,062 Total non-current borrowings(iv) 278,718 263,033 (i) Secured by a fixed and floating charge over all tangible assets of the wholly owned subsidiaries of the
Group, the current market value of which exceeds the value of the loans. (ii) Secured by the assets financed, the current market value of which exceeds the value of the liability. (iii) Secured by the assets leased, the current market value of which exceeds the value of the liability. (iv) All borrowings are shown at amortised cost.
For
per
sona
l use
onl
y

�������� ����������(���������#��"����������������
� � � � ���
2011 $’000
2010 $’000
14. Financing facilities Secured bank overdraft facility, reviewed annually and payable at call: (ii)
• amount used (i) - -
• amount unused (iii) 18,510 19,311 18,510 19,311 Secured bank loan facilities with various maturity dates through to 2018
and which may be extended by mutual agreement: (ii)
• amount used 298,118 262,093
• amount unused (iii) - 148,670 298,118 410,763
(i) The Group has a gross overdraft facility contracted by Hastie Holdings Pty Ltd, and although some company accounts in the Group were in overdraft these accounts are subject to an offset arrangement, being set-off against the positive bank balances in the group. As the positive balances exceeded the overdraft balances, the net overdraft facility used is shown as zero.
(ii) The maturity and interest rate risk of financing facilities are disclosed at note 30. (iii) During the standstill period, facilities limits were set to the used amounts. On 18 July 2011 new syndicated
financing facilities came into force, refer the Directors’ Report, note 1 “Going Concern” and note 38 “Subsequent Events.”
15. Other financial liabilities
Current Interest rate swaps (note 30(d)) 3,689 4,722 Forward exchange contracts 27 - Financial Instruments 3,716 4,772 Contingent consideration for business acquisitions 2,597 1,761 6,313 6,483
Non-current
Contingent consideration for business acquisitions - 1,967 16. Provisions
Current Employee benefits 45,943 42,895 Warranty 8,252 8,372 Other 3,960 2,172 58,155 53,439
Non-current
Employee benefits 3,168 2,905
� Movement in provisions : Warranty 2011
Other 2011
� $’000 $’000 Opening balance 8,372 2,172 Additional provisions recognised 3,517 4,031 Reductions due to payments (3,462) (1,427) Foreign currency translation (175) (816)
For
per
sona
l use
onl
y

�������� ����������(���������#��"����������������
� � � � ���
Closing balance 8,252 3,960
2011 $’000
2010 $’000
17. Issued capital
Opening balance 299,688 290,093 Shares issued for cash 43,504 - Shares issued pursuant to dividend reinvestment plans - 9,045 Shares issued pursuant to exercise of rights 123 630 Share issue costs (3,492) (114) Related income tax 868 34 Closing balance 340,691 299,688 2011 2010
No. ’000
No. ’000
Fully paid ordinary shares Opening balance 239,717 234,085 Shares issued for cash 295,330 - Shares issued pursuant to dividend reinvestment plans - 5,366 Shares issued pursuant to exercise of rights 64 266 Closing balance 535,111 239,717 Holders of ordinary shares are entitled to receive dividends as declared and are entitled to one vote per share at
shareholders’ meetings.
The issued shares do not have a par value.
Performance rights
Executives have performance rights on issue, refer note 31, over:
At 30 June 2011, 4,069,213 ordinary shares
At 30 June 2010, 4,682,638 ordinary shares
2011
$’000 2010 $’000
18. Reserves
Equity Reserve (5,158) (1,337) Foreign currency translation reserve (53,782) (2,597) Pension reserve (936) (1,368) Employee equity-settled benefits reserve 1,920 1,715 Hedging reserve (2,601) (3,166) (60,557) (6,753)
Equity reserve Opening balance (1,337) (1,337) Acquisition of minority interest (3,821) - Closing balance (5,158) (1,337) This reserve arises from changes in the ownership interests of the group’s subsidiaries. Where the amount paid
to acquire an additional ownership interest in a subsidiary is different to the aggregate of the additional goodwill so recognised and the non-controlling interest in the net assets of the subsidiary previously recognised in respect of that interest, the excess or deficiency is recognised directly in this reserve.
For
per
sona
l use
onl
y

�������� ����������(���������#��"����������������
� � � � ���
2011 $’000
2010 $’000
18. Reserves (continued)
Foreign currency translation reserve
Opening balance (2,597) 1,463 Translation of foreign operations (51,185) (4,060) Closing balance (53,782) (2,597) This reserve represents exchange differences relating to the translation from the functional currencies of the
Group’s foreign subsidiaries into Australian dollars.
Deferred consideration equity reserve
Opening balance - 1,050 Shares purchased - (1,050) Closing balance - - This reserve represented the fair value at award date of options granted to the vendors of an acquired business.
Pension reserve Opening balance (1,368) (936) Increase / (decline) in value of pension plan assets 432 (432) Closing balance (936) (1,368) This reserve represents the change in fair value of the assets of a UK based defined benefit pension scheme for
some employees of a business acquired in 2008. The scheme is closed to new members.
Employee equity-settled benefits reserve Opening balance 1,715 1,897 Share-based payment 328 520 Transfer to share capital (123) (630) Shares purchased - (72) Closing balance 1,920 1,715 This reserve represents the fair value at award date of performance rights granted to managers of the Hastie
Group and brought to account over the vesting period. Amounts are transferred out of the reserve when rights are vested.
Hedging reserve
Opening balance (3,166) (3,233) Gain / (loss) on recognised : Forward exchange contracts (326) (2,789) Interest rate swaps 1,033 2,984 Related deferred tax (142) (128) Closing balance (2,601) (3,166) This reserve represents hedging gains and losses recognised on the effective portion of cashflow hedges. The
cumulative deferred gain or loss on the hedge is recognised in profit or loss when the hedged transaction impacts the profit or loss.
For
per
sona
l use
onl
y

�������� ����������(���������#��"����������������
� � � � ���
2011 $’000
2010 $’000
19. (Accumulated losses) / retained earnings
Opening balance 92,734 76,410 (Loss) / profit attributable to owners of the parent (87,826) 39,835 Dividends paid (note 22) (9,589) (23,511) Closing balance (4,681) 92,734 20. Non-controlling interests
Opening balance 1,559 1,114 Profit attributable to non-controlling interests - 743 Dividends paid (493) (298)
Retained earnings attributable to owners on acquisition of minority interest
(1,066) -
Closing balance - 1,559 21. Earnings per share
(a) Earnings used in calculating earnings per share $’000 $’000
For both basic and diluted calculations the earnings used are: (Loss) / profit attributable to owners of the parent (87,826) 39,835
(b) Weighted average number of shares No.’000
No.’000
Weighted average number of shares for basic EPS 253,559 247,044 Effect of dilution due to Performance Rights - 4,378 Weighted average number of shares for diluted EPS 253,559 251,422
(c) Earnings per share Cents
Cents
Basic (34.6) 16.1 Diluted (34.6) 15.8 As required by AASB 133 ‘Earnings per Share’, to reflect the effect of the Initial Placement to the Cornerstone
Investor on 17 June 2011 and the Institutional Entitlement Offer on 28 June 2011: • the earnings per share for 2011 would have been (36.2) cents based on a simple weighted average
number of shares; and • the earnings per share for 2010 have been restated from the 16.9 cents and 16.6 cents, respectively in the
2010 Financial Report.
F
or p
erso
nal u
se o
nly
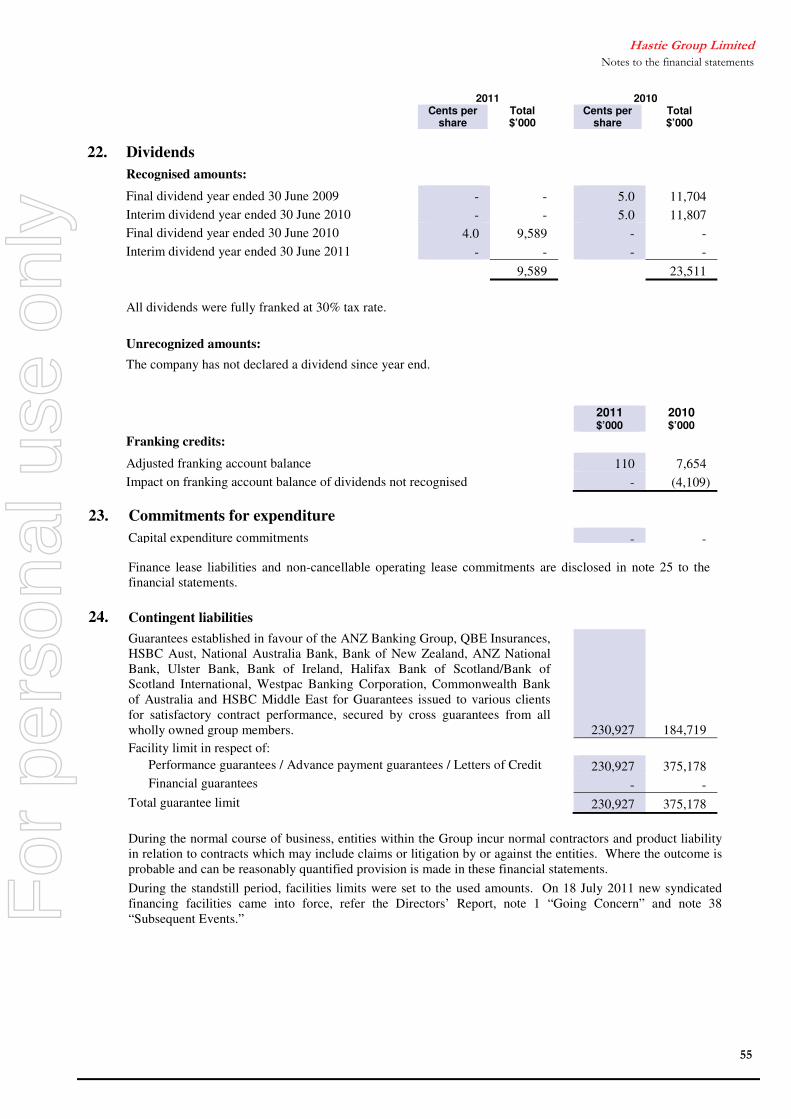
�������� ����������(���������#��"����������������
� � � � ���
2011 2010 Cents per
share Total $’000
Cents per share
Total $’000
22. Dividends
Recognised amounts: Final dividend year ended 30 June 2009 - - 5.0 11,704 Interim dividend year ended 30 June 2010 - - 5.0 11,807 Final dividend year ended 30 June 2010 4.0 9,589 - - Interim dividend year ended 30 June 2011 - - - - 9,589 23,511
All dividends were fully franked at 30% tax rate.
Unrecognized amounts:
The company has not declared a dividend since year end.
2011 $’000
2010 $’000
Franking credits:
Adjusted franking account balance 110 7,654 Impact on franking account balance of dividends not recognised - (4,109) 23. Commitments for expenditure
Capital expenditure commitments - - Finance lease liabilities and non-cancellable operating lease commitments are disclosed in note 25 to the
financial statements.
24. Contingent liabilities
Guarantees established in favour of the ANZ Banking Group, QBE Insurances, HSBC Aust, National Australia Bank, Bank of New Zealand, ANZ National Bank, Ulster Bank, Bank of Ireland, Halifax Bank of Scotland/Bank of Scotland International, Westpac Banking Corporation, Commonwealth Bank of Australia and HSBC Middle East for Guarantees issued to various clients for satisfactory contract performance, secured by cross guarantees from all wholly owned group members.
230,927 184,719 Facility limit in respect of: Performance guarantees / Advance payment guarantees / Letters of Credit 230,927 375,178 Financial guarantees - - Total guarantee limit 230,927 375,178 During the normal course of business, entities within the Group incur normal contractors and product liability
in relation to contracts which may include claims or litigation by or against the entities. Where the outcome is probable and can be reasonably quantified provision is made in these financial statements.
During the standstill period, facilities limits were set to the used amounts. On 18 July 2011 new syndicated financing facilities came into force, refer the Directors’ Report, note 1 “Going Concern” and note 38 “Subsequent Events.”
For
per
sona
l use
onl
y

�������� ����������(���������#��"����������������
� � � � ���
25. Leases Finance leases Leasing arrangements
Finance leases relate to motor vehicles and some plant and equipment with lease terms of between 3 to 5 years. The Group has options to purchase the assets at the conclusion of the lease agreements.
Finance lease liabilities
Minimum future lease
payments
Present value of minimum future lease
payments
2011 $’000
2010 $’000
2011 $’000
2010 $’000
Payable: Not later than 1 year 1,278 1,680 1,057 1,430 Later than 1 year but not later than 5 years 2,178 2,293 1,975 2,062 Minimum lease payments (i) 3,456 3,973 3,032 3,492 Less future finance charges (424) (481) - - Present value of minimum lease payments 3,032 3,492 3,032 3,492 Included in the financial statements as: (note 13) Current borrowings 1,057 1,430 Non-current borrowings 1,975 2,062 3,032 3,492 (i) Minimum future lease payments include the aggregate of all lease payments and any guaranteed residual. Operating leases
Leasing arrangements
Operating leases relate to premises with lease terms of between 1 to 6 years, with options to extend for further periods, and motor vehicle leases with terms generally of 3 years.
The Group does not have an option to purchase the leased asset at the expiry of the lease period.
2011 $’000
2010 $’000
Non-cancellable operating lease payments - Premises Payable: Not later than 1 year 12,335 10,184 Later than 1 year but not later than 5 years 25,981 28,332 Later than 5 years 2,427 329 40,743 38,845 Non-cancellable operating lease payments - Other Payable: Not later than 1 year 9,904 8,197 Later than 1 year but not later than 5 years 16,001 10,934 Later than 5 years 204 - 26,109 19,131
For
per
sona
l use
onl
y

�������� ����������(���������#��"����������������
� � � � ���
26. Subsidiaries
Name of subsidiary Country of
incorporation
Ownership interest
2011 %
2010 %
A McFarlane & Company Limited Northern Ireland 100% 100% AFA Air Conditioning Pty Limited (i) (ii) (iii) Australia 100% 100% Airducter Pty Limited (i) (ii) (iii) Australia 100% 100% Aquaheat Industries Limited (i) New Zealand 100% 60% Austral International Pty Limited (ii) Australia 100% 100% Austral Refrigeration (Qld) Pty Limited (v) Australia - 100% Austral Refrigeration (Suzhou) Co. Ltd China 100% 100% Austral Refrigeration Holdings Pty Limited (ii) (iii) Australia 100% 100% Austral Refrigeration Pty Limited (ii) (iii) Australia 100% 100% Beavis &Bartels Pty Limited (i) (ii) (iii) Australia 100% 100% Border Stainless Steel Pty Limited (i) (ii) (iii) Australia 100% 100% C A Sothers Limited England 100% - Cobco 925 Limited England 100% - Comcool Refrigeration Pty Limited (ii) Australia 100% 100% Comfort Solutions Aust Pty Limited (ii) (iii) Australia 100% 100% Cooke & Carrick Pty Limited (i) (ii) (iii) Australia 100% 100% Cooke & Carrick (VIC) Pty Limited (ii) (iii) Australia 100% 100% Cowley Koolhire Limited New Zealand 100% 100% D&E Air Conditioning Pty Limited (ii) (iii) Australia 100% 100% D&E Mechanical Services Pty Limited (i) (ii) (iii) Australia 100% 100% Direct Engineering Services Pty Limited (ii) (iii) Australia 100% 100% Direct Engineering Services Marine & Offshore Pte Ltd Singapore 100% 100%
Direct Engineering Marine & Offshore Services Pty Limited (i) (ii) (iii)
Australia 100% 100%
Gordon Brothers Industries Pty Limited (ii) (iii) Australia 100% 100% Gordon Refrigeration Limited England 100% 100% GTS Plumbing (Qld) Pty Limited (i) (ii) (iii) Australia 100% 100% Hastie Air Conditioning Pty Limited (ii) (iii) Australia 100% 100% Hastie Air Conditioning (ACT) Pty Limited (i) (ii) (iii) Australia 100% 100% Hastie Australia Pty Limited (ii) (iii) Australia 100% 100% Hastie Group Services Pty Limited (ii) (iii) Australia 100% 100% Hastie Engineering Services Private Limited (i) India 100% 100% Hastie Finco Pty Limited (i) (ii) (iii) Australia 100% 100% Hastie Holdings Pty Limited (ii) (iii) Australia 100% 100% Hastie Holdings (NZ) Pty Limited(i) New Zealand 100% 100% Hastie India Pty Limited (i) (ii) (iii) Australia 100% 100% Hastie International Pty Limited (ii) (iii) Australia 100% 100% Hastie International Qatar LLC (iv) Qatar 49% 49% Hastie Mechanical Services Pty Limited (ii) (iii) Australia 100% 100% Hastie New Zealand Limited New Zealand 100% 100% Hastie Refrigeration Limited (vii) New Zealand 100% 100% Hastie Saudi Arabia Pty Limited (i) (ii) Australia 100% 100% Hastie Oman LLC Oman 100% 100% Hastie Services Pty Limited (ii) (iii) Australia 100% 100% Hastie Services Limited New Zealand 100% - Hastie (UK) Limited (i) England 100% 100% Heyday Group Pty Limited (i) (ii) (iii) Australia 100% 100% Interfridge Limited New Zealand 100% 100% James + More Pty Limited Australia 100% 100% Kysor Warren Australia Pty Limited (v) Australia - 100% Lawrence Refrigeration Pty Limited (ii) Australia 100% 100% Longley Mechanical Services Pty Limited (ii) (iii) Australia 100% 100% M&H Air Conditioning Pty Limited (ii) (iii) Australia 100% 100% Medical Gases Pty Limited (ii) (iii) Australia 100% 100% Nisbet & Durney Pty Limited (i) (ii) (iii) Australia 100% 100% Norfolk Maintenance Holdings Pty Limited (ii) (iii) Australia 100% 100% North Sea Ventilation Limited England 100% 100% NSV Engineering Limited England 100% 100%
For
per
sona
l use
onl
y

�������� ����������(���������#��"����������������
� � � � ���
26. Subsidiaries (continued) Optimus Pty Limited (ii) (iii) Australia 100% 100% Project Piping Limited New Zealand 100% 100% QAL Refrigeration (WA) Pty Limited Australia 100% 100% RLH (Gibraltar) Limited Gibraltar 100% 100% Rotary Limited Northern Ireland 100% 100% Rotary Australia Limited (i) (ii) (iii) Australia 100% 100% Rotary Facilities Management Limited Northern Ireland 100% 100% Rotary Firematic Limited Northern Ireland 100% 100% Rotary (Gibraltar) Limited Gibraltar 100% 100% Rotary (Gulf) Limited Northern Ireland 100% 100% Rotary (Hong Kong) Limited Hong Kong 100% 100% Rotary Humm (M&E) Services Limited Northern Ireland 100% 100% Rotary (International)Limited Northern Ireland 100% 100% Rotary International Spol Sr.o. Czech Republic 100% 100% Rotary M & E Services (Ireland) Limited Republic of Ireland 100% 100% Rotary Northern Limited England 100% 100% Rotary North West Limited England 100% 100% Rotary (Qatar) Limited Northern Ireland 100% 100% Rotary (Scotland) Limited Scotland 100% 100% Rotary Services Limited Northern Ireland 100% 100% Rotary Southern Limited England 100% 100% Rotary Yorkshire Limited England 100% 100% Sharp & Pendrey Pty Limited (ii) (iii) Australia 100% 100% Sharp & Pendrey Services Pty Limited (ii) (iii) Australia 100% 100% Sharpen Engineering Pty Limited (ii) (iii) Australia 100% 100% Sothers (Holdings) Limited England 100% - Sothers Building Services Limited England 100% - Spectrum Fire & Security Pty Limited(iii) Australia 100% 100% Techni Doors Pty Limited (ii) Australia 100% 100% Watters Electrical (Aust) Pty Limited (i)(ii)(iii) Australia 100% 100% (i) These companies are direct subsidiaries of Hastie Group Limited. (ii) These companies are members of the tax consolidated group, of which Hastie Group Limited is the head
entity. (iii) These wholly-owned Australian subsidiaries have entered into a deed of cross guarantee with Hastie Group
Limited pursuant to ASIC Class Order 98/1418 and are relieved from the requirement to prepare or lodge audited financial statements.
(iv) Whilst the Group owns less than 50% of the shares, pursuant to the management agreement, it controls the Board and management of the entity and is entitled to 70% of its results. Therefore, the results of the entity have been included in the consolidated results for the Group on a proportional basis.
(v) Dormant companies now liquidated. (vi) Formerly Emac Services Pty Limited (vii) Formerly Aquaheat Property & Facility Services Limited (viii) Formerly Hastie Services Limited
The consolidated income statement and statement of financial position of
entities which are party to the deed of cross guarantee are: 2011 $’000
2010 $’000
Income statement
Revenue 1,441,490 1,218,810 Finance costs (36,866) (23,473) Other expenses (1,432,236) (1,156,716) (Loss) / Profit before tax (27,612) 38,621 Income tax benefit / (expense) 11,960 (5,947) (Loss) / Profit for the year (15,652) 32,674 Other comprehensive income - 67 Total comprehensive (loss) / income for the year (15,652) 32,741
For
per
sona
l use
onl
y

�������� ����������(���������#��"����������������
� � � � ���
26. Subsidiaries (continued)
2011 $’000
2010 $’000
Retained earnings Opening balance 68,959 59,796 Net profit / (loss) (15,652) 32,674 Dividends paid (9,589) (23,511) Closing balance 43,718 68,959
Statement of financial position
Current assets Cash 58,060 54,625 Trade and other receivables 394,169 366,382 Inventories 37,616 29,589 Current tax assets 7,868 - Prepayments 4,520 7,817 Other financial assets - 1,022
Total current assets 502,233 459,435
Non-current assets Property, plant and equipment 31,472 36,346 Deferred tax assets 31,425 24,449 Goodwill 248,171 246,943 Other intangible assets 5,252 5,668 Other financial assets 79,756 82,736
Total non-current assets 396,076 396,142
Total assets 898,309 855,577
Current liabilities Trade and other payables 190,765 199,883 Borrowings 20,184 2,591 Current tax liabilities - 4,010 Provisions 49,290 49,915 Other financial liabilities 6,313 6,483
Total current liabilities 266,552 262,882
Non-current liabilities Borrowings 248,546 221,334 Provisions 3,168 2,905 Other financial liabilities - 1,967
Total non-current liabilities 251,714 226,206
Total liabilities 518,266 489,088
Net assets 380,043 366,489
Equity Issued capital 340,691 299,688 Reserves (4,366) (2,158) Retained earnings 43,718 68,959
Total equity 380,043 366,489
For
per
sona
l use
onl
y

�������� ����������(���������#��"����������������
� � � � ���
27. Business acquisitions
(a) Acquisitions during 2011:
Acquisition of CA Sothers On 1 October 2010 the Hastie Group acquired 100% of the issued share capital of the Sothers (Holdings) Limited Group, trading as CA Sothers, for a cost of $7,340,000. CA Sothers is a Mechanical and Electrical design and installation business based in Birmingham, UK and was established in 1926.
$’000 Cost of acquisition comprises Cash 5,709 Contingent consideration paid in cash in February 2011 1,631 7,340
Net cash outflow on acquisition: Cash paid 5,709 Less net cash balances acquired (2,398) 3,311
Fair value at acquisition
$’000 Cost of acquisition comprises Cash 2,398 Trade and other receivables 6,110 Inventories 641 Property, plant and equipment 320 Deferred tax asset 333 Prepayments 223 Trade and other payables (8,559) Borrowings (130) Current tax payables (75) Net assets at date of acquisition 1,261 Goodwill arising on acquisition 6,079 Cost of acquisition 7,340
The acquired Trade and Other Receivables include Gross Contractual Amounts of $6,963,000. Of this amount
$853,000 is not expected to be collected. The Group has paid a premium above net assets of the acquiree as it believes the acquisition will introduce additional
synergies to its existing operations, revenue growth, future market development and assembled workforces. These benefits are not recognised separately from goodwill as the future economic benefits arising from them cannot be reliably measured.
The Group’s current year results include Revenue of $22,572,000 and nil EBIT Contribution as a result of this
acquisition.
For
per
sona
l use
onl
y

�������� ����������(���������#��"����������������
� � � � ���
27. Business acquisitions (continued) Had this business acquisition been effected at 1 July 2010, the estimated revenue of the Group would have been
$1,859,049,000, and the estimated loss before interest and tax $59,062,000 The directors of the Group consider these estimated numbers to represent an approximate measure of the performance of the combined Group on an annualised basis and provide a reference point for comparison for future periods, but note that the acquired business was not under Hastie Group guidance or management during the pre-acquisition periods.
$’000 Acquisition-related costs expensed: Re the above acquisition 149 Other 172 321
Acquisition of minority interest in subsidiary During the period the Group acquired the remaining 40% interest in Aquaheat Industries Limited, increasing its
ownership to 100%. Net asset value of minority interest acquired 1,066 Movement on equity reserve 3,821 Cash consideration 4,887
(b) Acquisitions during 2010:
Names of businesses acquired
Principal activity
Date of acquisition
Proportion of shares acquired
(%)
Cost of acquisition
$’000
Spectrum Fire & Security Fire & security services 4 May 10 100% of
business assets 7,000
Cool-it Air conditioning installation & service
20 Oct 09 100% of business assets
6,361
Godfrey Hydraulic services 1 Jul 09 100% of business assets
3,680
James + More Air conditioning service 17 Nov 09 100% 2,491 A E Smith Air conditioning service 1 Oct 09 100% of
business and related contracts
522
20,054
Spectrum
Cool-it
Godfrey
James + More
A E Smith
Total
$’000 $’000 $’000 $’000 $’000 $’000 Cost of acquisition comprises: Cash 7,000 4,500 3,680 1,500 363 17,043
Contingent consideration to be paid in cash
- 1,861 - 991 159 3,011
Total 7,000 6,361 3,680 2,491 522 20,054
Net cash outflow on acquisition: Cash consideration 17,043 Add net overdraft balances acquired 687 17,730
For
per
sona
l use
onl
y
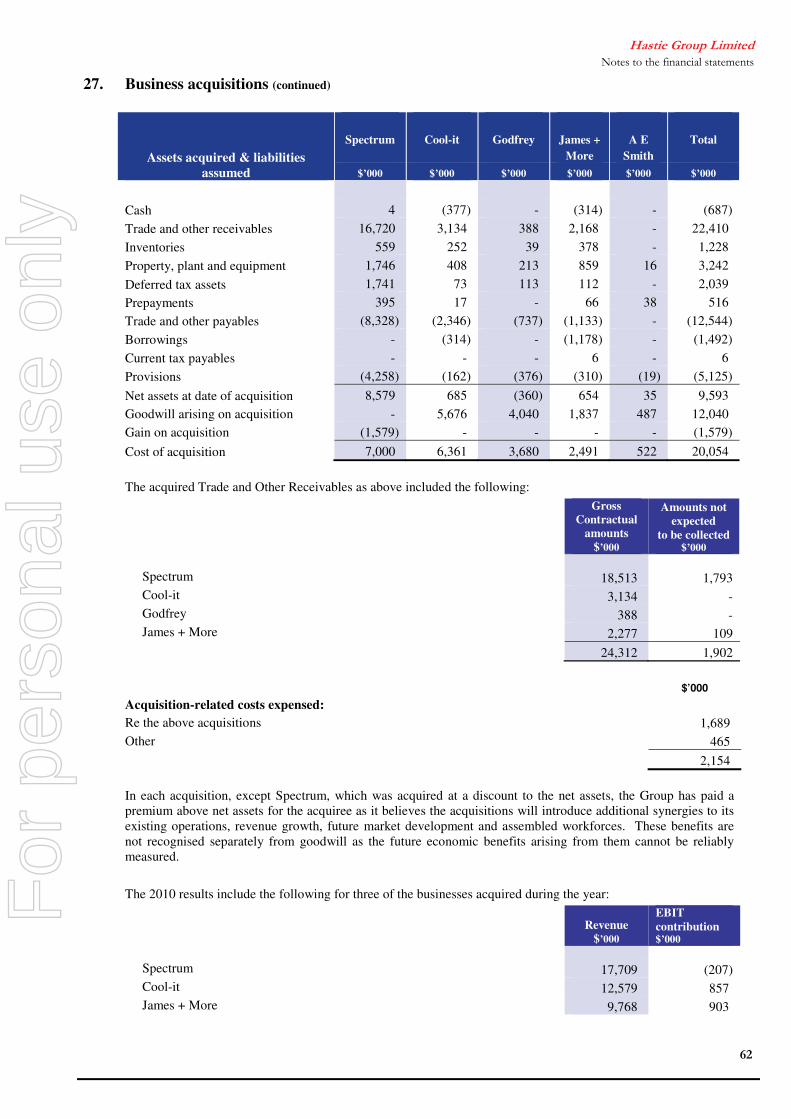
�������� ����������(���������#��"����������������
� � � � ���
27. Business acquisitions (continued)
Assets acquired & liabilities assumed
Spectrum
Cool-it
Godfrey
James +
More
A E
Smith
Total
$’000 $’000 $’000 $’000 $’000 $’000 Cash 4 (377) - (314) - (687) Trade and other receivables 16,720 3,134 388 2,168 - 22,410 Inventories 559 252 39 378 - 1,228 Property, plant and equipment 1,746 408 213 859 16 3,242 Deferred tax assets 1,741 73 113 112 - 2,039 Prepayments 395 17 - 66 38 516 Trade and other payables (8,328) (2,346) (737) (1,133) - (12,544) Borrowings - (314) - (1,178) - (1,492) Current tax payables - - - 6 - 6 Provisions (4,258) (162) (376) (310) (19) (5,125) Net assets at date of acquisition 8,579 685 (360) 654 35 9,593 Goodwill arising on acquisition - 5,676 4,040 1,837 487 12,040 Gain on acquisition (1,579) - - - - (1,579) Cost of acquisition 7,000 6,361 3,680 2,491 522 20,054
The acquired Trade and Other Receivables as above included the following:
Gross Contractual
amounts $’000
Amounts not expected
to be collected $’000
Spectrum 18,513 1,793 Cool-it 3,134 - Godfrey 388 - James + More 2,277 109 24,312 1,902
$’000 Acquisition-related costs expensed: Re the above acquisitions 1,689 Other 465 2,154
In each acquisition, except Spectrum, which was acquired at a discount to the net assets, the Group has paid a premium above net assets for the acquiree as it believes the acquisitions will introduce additional synergies to its existing operations, revenue growth, future market development and assembled workforces. These benefits are not recognised separately from goodwill as the future economic benefits arising from them cannot be reliably measured.
The 2010 results include the following for three of the businesses acquired during the year:
Revenue
$’000
EBIT contribution $’000
Spectrum 17,709 (207) Cool-it 12,579 857 James + More 9,768 903
For
per
sona
l use
onl
y

�������� ����������(���������#��"����������������
� � � � ���
28. Jointly controlled operations and assets
Name of entity Principal activity
Output interest 2011
% 2010
% Kens JV Installation of air conditioning systems 50 50 Parramatta Justice Centre JV Installation of air conditioning systems 50 50 Wellington Hospital JV Installation of air conditioning systems 50 50 Romaha JV Maintenance of vehicle testing facilities 50 50 RK JV Installation of building services 50 50 BKG Atlantis JV Installation of building services 20 20 Zayad University JV Installation of building services 50 50 Dubai Festival City JV Installation of building services 50 50 Duhail & Umm JV Installation of building services 50 50 Traders’ Hotel JV Installation of building services 50 50 The Group’s interest in assets employed in the above jointly controlled operations is detailed below, and these
amounts are included in the consolidated financial statements under their respective asset categories: �
� 2011
$’000 2010 $’000
Current assets Cash 3,571 7,963 Receivables 8,193 15,727 Inventories 23,007 127 Prepayments 4 - Total current assets 34,775 23,817 Total assets 34,775 23,817
Contingent liabilities The contingent liabilities arising from the Group’s interests in joint ventures are included in note 24.
For
per
sona
l use
onl
y

�������� ����������(���������#��"����������������
� � � � ���
(a) Reconciliation of (loss) / profit for the year to net cash flows
from operating activities
(Loss) / profit for the year (87,826) 40,578 Gain on sale of property, plant and equipment (114) (243) Depreciation and amortisation 15,070 13,498 Goodwill impairment 69,129 - Write-off of brand value 1,348 - Interest received (459) (1,009) Interest and other finance costs paid 34,727 20,931 Equity settled share-based payment 328 520 Non-cash interest expense - 463 Foreign exchange loss 874 252 (Decrease)/Increase in current tax liability (10,919) 649 (Increase)/Decrease in deferred tax asset (1,054) 986 Movements in working capital, net of effects from business acquisitions: (Increase)/decrease in assets: Trade and other receivables (8,260) (80,172) Inventories (50,551) 8,161 Prepayments 1,143 (354) Increase/(decrease) in liabilities: Trade and other payables 80 44,591 Provisions 9,298 2,758 Net cash used by operating activities (27,186) 51,609
(b) Non-cash financing During the year the Group acquired $1,138,000 of equipment under finance lease facilities. This acquisition will be
reflected in the cash flow statement over the terms of the finance leases via lease repayments.
2011
$’000 2010 $’000
29. Cash flows
For
per
sona
l use
onl
y

�������� ����������(���������#��"����������������
� � � � ���
30. Financial instruments
(a) Financial risk management objectives
The Group’s finance function provides services to the business, co-ordinates access to domestic financial markets, and manages the financial risks relating to the operations of the Group.
The Group does not enter into or trade financial instruments, including derivative financial instruments, for speculative purposes. The use of financial derivatives is governed by the Group’s policies approved by the board of directors, which provide written principles on the use of financial derivatives. Compliance with policies and exposure limits is reviewed on a continuous basis.
(b) Market risk The Group’s activities expose it primarily to the financial risks of changes in foreign currency exchange rates and
interest rates. The Group enters into derivative financial instruments to manage its exposure to interest rate and foreign currency risk, in particular foreign currency forward sale and purchase contracts and interest rate swaps.
(c) Foreign currency risk management
The Group undertakes certain transactions denominated in foreign currencies, hence exposures to exchange rate fluctuations arise. The Group’s policy is to hedge all of its project specific foreign exchange rate risk using forward contracts and swaps, except where natural hedges exist. However, the Group does not hedge the impact of exchange rate exposures on intercompany assets and liabilities with foreign subsidiaries.
The carrying amount of the Group’s foreign currency denominated monetary intercompany assets and liabilities at the
reporting date is as follows:
Liabilities Assets 2011
FC’000 2010
FC’000 2011
FC’000 2010
FC’000
NZD 20,894 8,108 - - GBP 73,922 53,735 - - AED 11,374 49,358 - - SGD 337 293 - - USD - - 567 1,892 INR 26,394 13,546 - - OMR 229 330 - - QAR - 2,452 766 - CNY 17,037 - - -
Forward currency sensitivity
At reporting date, if the Australian dollar had been 5% higher or lower against all other currencies with all other variables held constant:
• the Group’s after tax profit for the year would increase/decrease by $1,867,000 (2010: $1,245,000) • equity would increase / decrease by $257,000 (2010: $1,093,000)
Forward foreign exchange contracts
It is Group policy to enter into forward foreign exchange contracts to cover specific foreign currency payments and receipts for purchase or sales commitments greater than Australian dollars 20,000 in value, which are designated as cash flow hedges.
For
per
sona
l use
onl
y
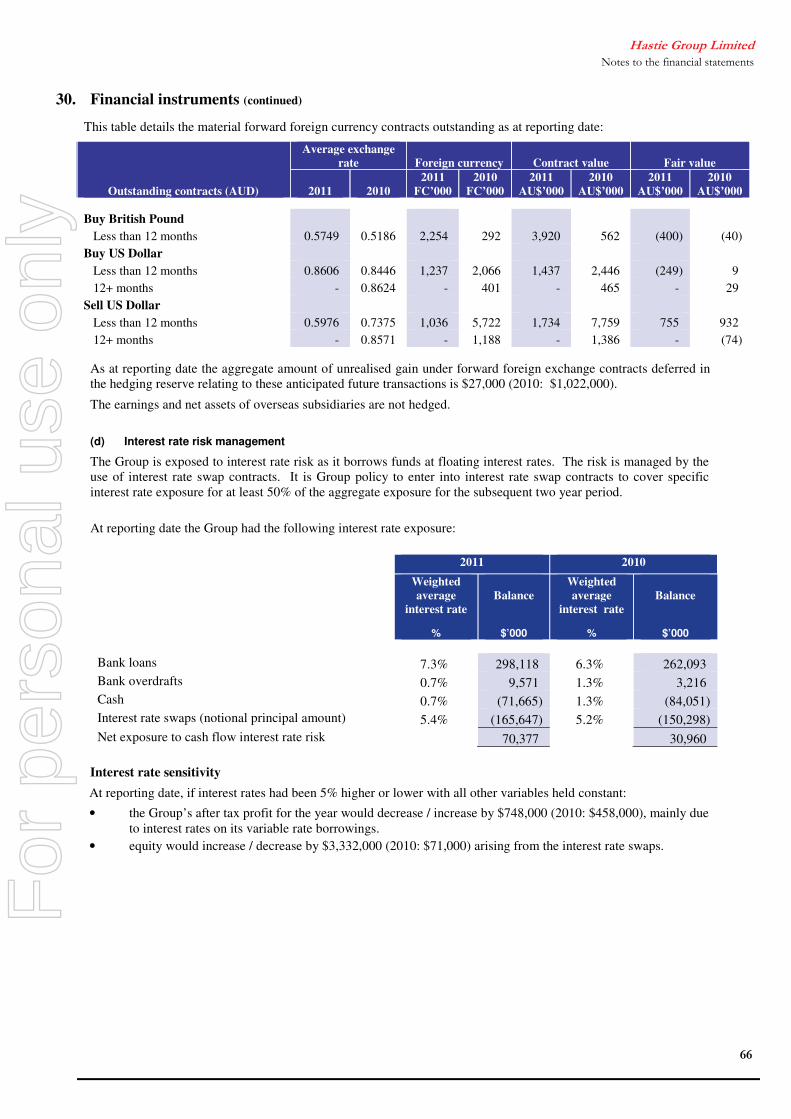
�������� ����������(���������#��"����������������
� � � � ���
30. Financial instruments (continued)
This table details the material forward foreign currency contracts outstanding as at reporting date:
Outstanding contracts (AUD)
Average exchange rate Foreign currency Contract value Fair value
2011 2010
2011 FC’000
2010 FC’000
2011 AU$’000
2010 AU$’000
2011 AU$’000
2010 AU$’000
Buy British Pound Less than 12 months 0.5749 0.5186 2,254 292 3,920 562 (400) (40) Buy US Dollar Less than 12 months 0.8606 0.8446 1,237 2,066 1,437 2,446 (249) 9 12+ months - 0.8624 - 401 - 465 - 29 Sell US Dollar Less than 12 months 0.5976 0.7375 1,036 5,722 1,734 7,759 755 932 12+ months - 0.8571 - 1,188 - 1,386 - (74)
As at reporting date the aggregate amount of unrealised gain under forward foreign exchange contracts deferred in the hedging reserve relating to these anticipated future transactions is $27,000 (2010: $1,022,000).
The earnings and net assets of overseas subsidiaries are not hedged.
(d) Interest rate risk management
The Group is exposed to interest rate risk as it borrows funds at floating interest rates. The risk is managed by the use of interest rate swap contracts. It is Group policy to enter into interest rate swap contracts to cover specific interest rate exposure for at least 50% of the aggregate exposure for the subsequent two year period.
At reporting date the Group had the following interest rate exposure:
� 2011 2010
� Weighted average
interest rate
Balance
Weighted average
interest rate
Balance
% $’000 % $’000 Bank loans 7.3% 298,118 6.3% 262,093 Bank overdrafts 0.7% 9,571 1.3% 3,216 Cash 0.7% (71,665) 1.3% (84,051) Interest rate swaps (notional principal amount) 5.4% (165,647) 5.2% (150,298) Net exposure to cash flow interest rate risk 70,377 30,960
Interest rate sensitivity
At reporting date, if interest rates had been 5% higher or lower with all other variables held constant:
• the Group’s after tax profit for the year would decrease / increase by $748,000 (2010: $458,000), mainly due to interest rates on its variable rate borrowings.
• equity would increase / decrease by $3,332,000 (2010: $71,000) arising from the interest rate swaps.
For
per
sona
l use
onl
y

�������� ����������(���������#��"����������������
� � � � ���
30. Financial instruments (continued)
Interest rate swap contracts
Under interest rate swap contracts, the Group agrees to exchange the difference between fixed and floating rate interest amounts calculated on agreed notional principal amounts. Such contracts enable the Group to mitigate the risk of changing interest rates on debt held. The fair value of interest rate swaps are based on market values of equivalent instruments at the reporting date and are disclosed below.
This table details the notional principal amounts and remaining terms of interest rate swap contracts outstanding as at reporting date:
Outstanding floating for fixed contracts
Contracted fixed base interest rate
Notional principal amount Fair value
2011 %
2010 %
2011 $’000
2010 $’000
2011 $’000
2010 $’000
AUD Swaps Less than 1 year 0.01% 3.22% 5,000 60,000 - 799 1 to 2 years 7.41% - 55,000 - (2,204) - 2 to 5 years 5.2% 7.41% 75,000 55,000 (226) (3,410) GBP Swaps Less than 1 year - 5.03% - 17,649 - (539) 1 to 2 years 5.03% - 14,999 - (996) - 2 to 5 years 2.23% 5.03% 7,500 17,649 (124) (1,572) USD Swaps 2 to 5 years 1.40% - 8,148 - (139) 165,647 150,298 (3,689) (4,722) Interest rate swap contracts exchanging floating rate interest for fixed rate interest are designated and effective as
cash flow hedges in respect of interest rates.
(e) Price risk
The Group has no exposure to equity securities price risk.
The Group’s exposure to commodity price risk is immaterial.
(f) Credit risk management
Credit risk refers to the risk that a counterparty will default on its contractual obligations resulting in financial loss to the Group. The Group has adopted a policy of only dealing with creditworthy counterparties as a means of mitigating the risk of financial loss from defaults. The Group’s exposure and the credit ratings of its counterparties are continuously monitored and the aggregate value of transactions concluded is spread amongst approved counterparties.
Trade accounts receivable consist of a large number of customers, spread across diverse industries and geographical areas and therefore, the group does not have any significant credit risk exposure to any single counterparty or any group of counterparties having similar characteristics. Ongoing credit evaluation is performed on the financial condition of accounts receivable. The credit risk on trade and other receivables have been detailed in note 6.
The carrying amount of financial assets recorded in the financial statements, net of any allowances for losses, represents the consolidated entity’s maximum exposure to credit risk without taking account of the value of any collateral obtained.
For
per
sona
l use
onl
y

�������� ����������(���������#��"����������������
� � � � ���
30. Financial instruments (continued)
(g) Liquidity risk management
The Group manages liquidity risk by maintaining adequate reserves, banking facilities and reserve borrowing facilities, by monitoring forecast and actual cash flows, and matching the maturity profiles of financial assets and liabilities.
Maturity of financial liabilities
These tables detail the remaining contractual maturity for the financial liabilities and have been drawn up based on the contractual undiscounted cash flows, including future interest payable and based on the remaining period at the balance date to the contractual maturity date.
Less than 1
year
1-2 years
2-3 years
3-4 years
4-5 years
5+ years
Total contractual cash flows
$’000 $’000 $’000 $’000 $’000 $’000 $’000 2011 Non – derivatives Trade payables 247,459 - - - - - 247,459 Bank overdraft 9,571 - - - - - 9,571 Bank loans 156,384 10,523 102,293 53,840 321 5,477 328,838 Hire purchase contracts 1,341 891 611 127 16 - 2,986 Finance lease liabilities 1,278 1,057 661 319 141 - 3,456 Contingent Consideration 2,650 - - - - - 2,650 418,683 12,471 103,565 54,286 478 5,477 594,960 Derivatives 2,497 2,322 (168) (56) - - 4,595 421,180 14,793 103,397 54,230 478 5,477 599,555 2010 Non – derivatives Trade payables 269,227 - - - - - 269,227 Bank overdraft 3,216 - - - - - 3,216 Bank loans 16,738 19,970 180,335 86,922 408 6,432 310,805 Hire purchase contracts 1,765 1,186 616 477 59 - 4,103 Finance lease liabilities 1,680 1,083 762 403 45 - 3,973 Contingent Consideration 1,476 2,650 4,126 292,626 22,239 181,713 87,802 512 6,432 591,324 Derivatives 2,947 2,025 1,758 - - - 6,730 295,573 24,264 183,471 87,802 512 6,432 598,054
For
per
sona
l use
onl
y

�������� ����������(���������#��"����������������
� � � � ���
30. Financial instruments (continued)
(h) Fair value of financial instruments The directors consider that the carrying amount of financial assets and financial liabilities recorded in the financial
statements approximates their fair values.
The fair values of financial assets and financial liabilities are determined as follows:
• the fair value of financial assets and financial liabilities with standard terms and conditions and traded on active liquid markets are determined with reference to quoted market prices;
• the fair value of other financial assets and financial liabilities are determined in accordance with generally
accepted pricing models based on discounted cash flow analysis; and • the fair value of derivative instruments, included in hedging assets and liabilities, are calculated using
quoted prices. Where such prices are not available use is made of discounted cash flow analysis using the applicable yield curve for the duration of the instruments.
Fair value measurement
The fair value of financial instruments and the methods used to estimate the fair values are as follows:
Level 1 - The fair value is calculated using quoted prices in active markets for identical instruments Level 2 - The fair value is estimated using inputs other than quoted prices included in Level 1 that are
observable, either directly (as prices) or indirectly (derived from prices) Level 3 - The fair value is estimated using inputs that are not based on observable market data
Level 1 Level 2 Level 3 Total
$’000 $’000 $’000 $’000
2011 Derivative Financial Assets Forward exchange contracts - (27) - (27) Derivative Financial Liabilities Interest rate swaps - (3,689) - (3,689) 2010 Derivative Financial Assets Forward exchange contracts - 1,022 - 1,022 Derivative Financial Liabilities Interest rate swaps - (4,722) - (4,722)
(i) Capital risk management
The Group manages its capital to ensure that entities in the Group will be able to continue as a going concern while maximising the return to stakeholders through the optimisation of debt and equity balances.
The Group’s overall strategy remains unchanged from 2010. The capital structure of the Group consists of debt, which includes the borrowings disclosed in note 13, cash and equity attributable to equity holders of the parent comprising issued capital, reserves and retained earnings as disclosed in notes 17, 18 and 19, respectively.
For
per
sona
l use
onl
y
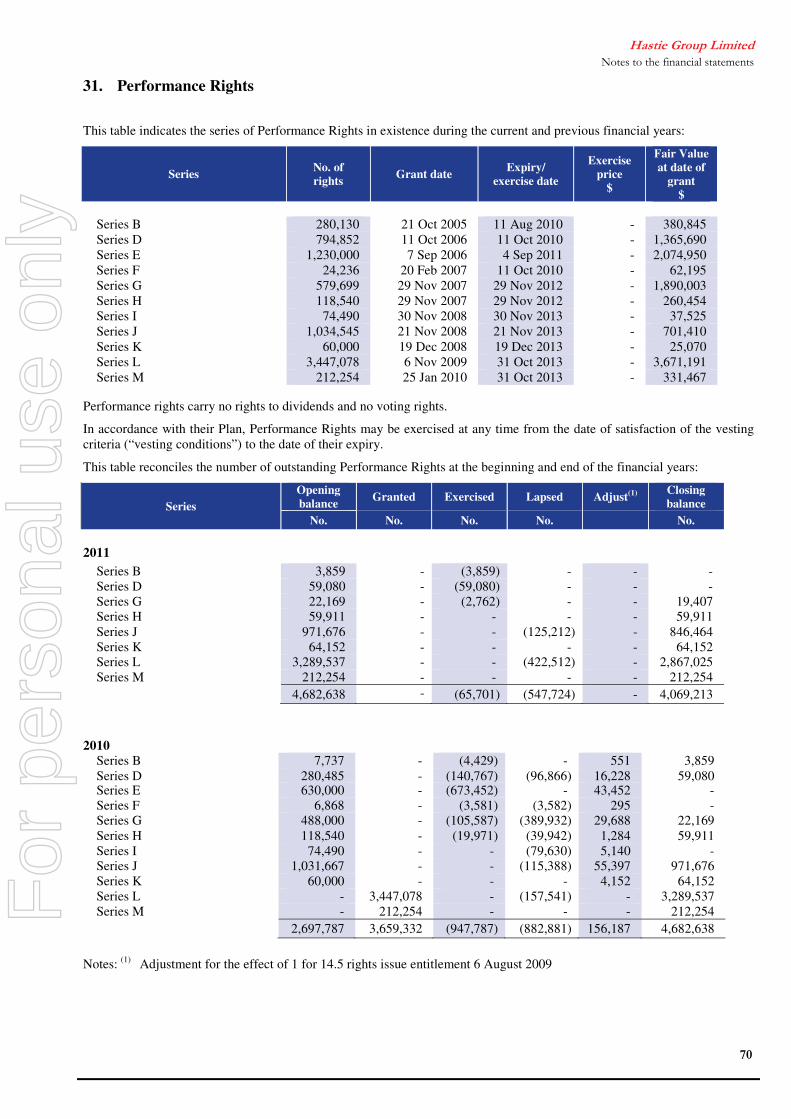
�������� ����������(���������#��"����������������
� � � � ���
31. Performance Rights
This table indicates the series of Performance Rights in existence during the current and previous financial years:
Series No. of rights Grant date Expiry/
exercise date
Exercise price
$
Fair Value at date of
grant $
Series B 280,130 21 Oct 2005 11 Aug 2010 - 380,845 Series D 794,852 11 Oct 2006 11 Oct 2010 - 1,365,690 Series E 1,230,000 7 Sep 2006 4 Sep 2011 - 2,074,950 Series F 24,236 20 Feb 2007 11 Oct 2010 - 62,195 Series G 579,699 29 Nov 2007 29 Nov 2012 - 1,890,003 Series H 118,540 29 Nov 2007 29 Nov 2012 - 260,454 Series I 74,490 30 Nov 2008 30 Nov 2013 - 37,525 Series J 1,034,545 21 Nov 2008 21 Nov 2013 - 701,410 Series K 60,000 19 Dec 2008 19 Dec 2013 - 25,070 Series L 3,447,078 6 Nov 2009 31 Oct 2013 - 3,671,191 Series M 212,254 25 Jan 2010 31 Oct 2013 - 331,467
Performance rights carry no rights to dividends and no voting rights.
In accordance with their Plan, Performance Rights may be exercised at any time from the date of satisfaction of the vesting criteria (“vesting conditions”) to the date of their expiry.
This table reconciles the number of outstanding Performance Rights at the beginning and end of the financial years:
Series Opening balance Granted Exercised Lapsed Adjust(1) Closing
balance No. No. No. No. No.
2011 Series B 3,859 - (3,859) - - - Series D 59,080 - (59,080) - - - Series G 22,169 - (2,762) - - 19,407 Series H 59,911 - - - - 59,911 Series J 971,676 - - (125,212) - 846,464 Series K 64,152 - - - - 64,152 Series L 3,289,537 - - (422,512) - 2,867,025 Series M 212,254 - - - - 212,254
l4,682,638 - (65,701) (547,724) - 4,069,213
2010 Series B 7,737 - (4,429) - 551 3,859 Series D 280,485 - (140,767) (96,866) 16,228 59,080 Series E 630,000 - (673,452) - 43,452 - Series F 6,868 - (3,581) (3,582) 295 - Series G 488,000 - (105,587) (389,932) 29,688 22,169 Series H 118,540 - (19,971) (39,942) 1,284 59,911 Series I 74,490 - - (79,630) 5,140 - Series J 1,031,667 - - (115,388) 55,397 971,676 Series K 60,000 - - - 4,152 64,152 Series L - 3,447,078 - (157,541) - 3,289,537 Series M - 212,254 - - - 212,254 2,697,787 3,659,332 (947,787) (882,881) 156,187 4,682,638 Notes: (1) Adjustment for the effect of 1 for 14.5 rights issue entitlement 6 August 2009
For
per
sona
l use
onl
y
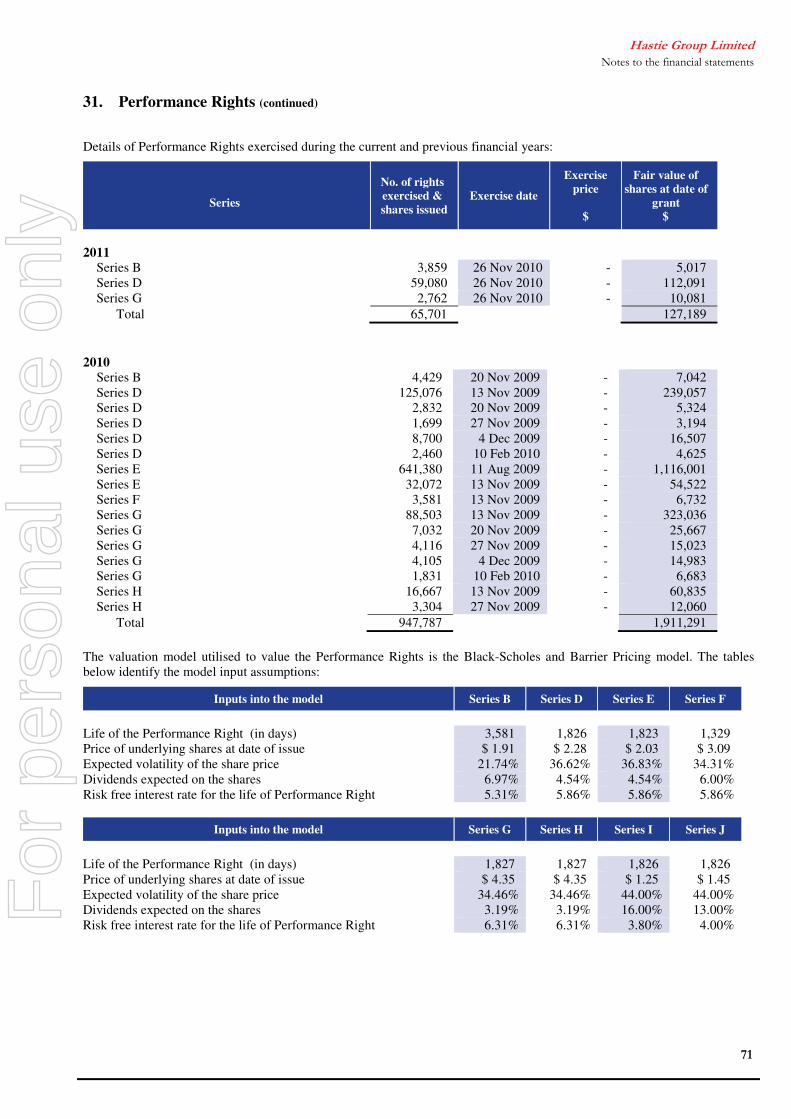
�������� ����������(���������#��"����������������
� � � � ���
31. Performance Rights (continued)
Details of Performance Rights exercised during the current and previous financial years:
Series
No. of rights exercised & shares issued
Exercise date
Exercise price
$
Fair value of shares at date of
grant $
2011 Series B 3,859 26 Nov 2010 - 5,017 Series D 59,080 26 Nov 2010 - 112,091 Series G 2,762 26 Nov 2010 - 10,081 Total 65,701 127,189 2010 Series B 4,429 20 Nov 2009 - 7,042 Series D 125,076 13 Nov 2009 - 239,057 Series D 2,832 20 Nov 2009 - 5,324 Series D 1,699 27 Nov 2009 - 3,194 Series D 8,700 4 Dec 2009 - 16,507 Series D 2,460 10 Feb 2010 - 4,625 Series E 641,380 11 Aug 2009 - 1,116,001 Series E 32,072 13 Nov 2009 - 54,522 Series F 3,581 13 Nov 2009 - 6,732 Series G 88,503 13 Nov 2009 - 323,036 Series G 7,032 20 Nov 2009 - 25,667 Series G 4,116 27 Nov 2009 - 15,023 Series G 4,105 4 Dec 2009 - 14,983 Series G 1,831 10 Feb 2010 - 6,683 Series H 16,667 13 Nov 2009 - 60,835 Series H 3,304 27 Nov 2009 - 12,060 Total 947,787 1,911,291 The valuation model utilised to value the Performance Rights is the Black-Scholes and Barrier Pricing model. The tables below identify the model input assumptions:
Inputs into the model Series B Series D Series E Series F
Life of the Performance Right (in days) 3,581 1,826 1,823 1,329 Price of underlying shares at date of issue $ 1.91 $ 2.28 $ 2.03 $ 3.09 Expected volatility of the share price 21.74% 36.62% 36.83% 34.31% Dividends expected on the shares 6.97% 4.54% 4.54% 6.00% Risk free interest rate for the life of Performance Right 5.31% 5.86% 5.86% 5.86%
Inputs into the model Series G Series H Series I Series J
Life of the Performance Right (in days) 1,827 1,827 1,826 1,826 Price of underlying shares at date of issue $ 4.35 $ 4.35 $ 1.25 $ 1.45 Expected volatility of the share price 34.46% 34.46% 44.00% 44.00% Dividends expected on the shares 3.19% 3.19% 16.00% 13.00% Risk free interest rate for the life of Performance Right 6.31% 6.31% 3.80% 4.00%
For
per
sona
l use
onl
y

�������� ����������(���������#��"����������������
� � � � ���
31. Performance Rights (continued)
Inputs into the model Series K Series L Series M
Life of the Performance Right (in days) 1,826 1,341 1,268 Price of underlying shares at date of issue $ 1.11 $ 2.01 $ 1.99 Expected volatility of the share price 44.00% 50.00% 50.00% Dividends expected on the shares 18.00% 6.10% 6.90% Risk free interest rate for the life of Performance Right 3.50% 5.20% 4.90% 32. Key management personnel compensation Details of key management personnel The directors and other members of key management personnel of the company and the Group during the year were:
• Mr Trevor Bourne Chairman (non-executive) • Mr David Harris Group Managing Director & CEO • Mr Phillip Anderson Director (non-executive) • Mr David Martin Director (non-executive) • Mr Harry Boon Director (non-executive) • Mr John Gaskell Director (non-executive) • Mr Chris Woodward Finance Director • Mr David Hammond CEO Mechanical, Electrical and Plumbing Division • Mr Joe Farrugia CEO Services Division • Ian McGregor CEO Middle East Division • Mr Phill Laidlaw CEO UK Operations • Mr Jerry Collins CEO Republic of Ireland and International Operations
Key management personnel compensation The aggregate of compensation is:
2011
$ 2010
$ Short-term employee benefits 3,268,089 2,992,155 Post-employment benefits 176,230 225,084 Long term benefits 326,735 339,972 Total –payable 3,771,054 3,557,211
Total – paid * 4,185,285 3,723,060
* The total amount paid for 2011 and 2010 includes bonus entitlements for the financial years ended 30 June 2010 and 2009 respectively.
For
per
sona
l use
onl
y

�������� ����������(���������#��"����������������
� � � � ���
33. Related party disclosures (a) Equity interests in related parties Equity interests in subsidiaries Details of the percentage of ordinary shares held in subsidiaries are disclosed in note 26. Equity interests in associates and joint ventures Details of interests in shares of associates and joint ventures are disclosed in notes 8 and 28. (b) Key management personnel compensation, options and performance rights Details of key management personnel compensation, options and performance rights are disclosed in the Directors’
Report which accompanies these financial statements.
Information in the report has been prepared in accordance with AASB 124. (c) Key management personnel shareholdings Details of the movements in the number of ordinary shares in Hastie Group Limited held during the financial
year by each director and each of the key management personnel, including their related parties, are set out below:
Directors Opening balance
Received during
period on exercise of
rights
Other changes
during year
Closing balance
Changes since year-
end
Current balance
2011 Mr Trevor Bourne 302,639 - - 302,639 375,000 677,639 Mr David Harris 307,963 - 19,110 327,073 248,070 575,143 Mr David Martin 4,542,420 - - 4,542,420 1,465,105 6,007,525 Mr Harry Boon 163,003 - 380,744 543,747 532,229 1,075,976 Mr Phillip Anderson 20,284 - 20,000 40,284 114,810 155,094 Mr John Gaskell 20,654 - 29,346 50,000 142,500 192,500 Mr Lindsay Phillips - - - - - - Mr Chris Woodward 927,999 - (532,980) 395,019 - 395,019 2010 Mr Trevor Bourne 285,909 - 16,730 302,639 Mr David Harris 286,642 16,667 4,654 307,963 Mr David Martin 4,542,420 - - 4,542,420 Mr Harry Boon 163,003 - - 163,003 Mr Phillip Anderson 19,162 - 1,122 20,284 Mr John Gaskell - - 20,654 20,654 Mr Lindsay Phillips - - - Mr Chris Woodward 895,999 32,000 - 927,999
Executives Opening balance
Received during
period on exercise of
rights
Other changes
during year
Closing balance
Changes since year-
end
Current balance
2011 Mr David Hammond 759,553 - - 759,553 - 759,553 Mr Joe Farrugia 69,714 - 6,407 76,121 178,571 254,692 2010 Mr David Hammond 995,590 63,147 (299,184) 759,553 Mr Joe Farrugia 61,775 3,304 4,635 69,714
For
per
sona
l use
onl
y

�������� ����������(���������#��"����������������
� � � � ���
33. Related party disclosures (continued)
(d) Key management personnel performance rights Details of the movements in the number of performance rights in Hastie Group Limited held during the
financial year by each director and each of the key management personnel, including their related parties, are set out below:
Directors Opening balance
Granted as compensation Exercised Lapsed
Closing Balance
Balance vested at 30 June (i)
Vested during year
2011
Mr David Harris 559,554 - - - 559,554 - -
Mr Chris Woodward 229,075 - - - 229,075 - - (i) All performance rights vested are exercisable at date of vesting
(ii) Since year end and to the date of this report no changes to director’s performance rights have taken place
2010
Mr David Harris 235,971 373,584 (16,667) (33,334) 559,554 - 16,667
Mr Chris Woodward 136,651 167,924 (32,000) (43,500) 229,075 - 32,000
Executives Opening balance
Granted as compensation Exercised Lapsed Closing
Balance
Balance vested at 30 June (i)
Vested during year
2011 Mr David Hammond 197,198 - - - 197,198 - - Mr Joe Farrugia 197,877 - - - 197,877 - - Mr Ian McGregor - - - - - - - Mr Phill Laidlaw 115,771 - - - 115,771 - - Mr Jerry Collins 91,219 - - - 91,219 - -
(i) All performance rights vested are exercisable at date of vesting (ii) Since year end and to the date of this report no changes to executive’s performance rights have taken place
2010 Mr David Hammond 127,338 154,076 (63,147) (21,069) 197,198 - 63,147 Mr Joe Farrugia 58,468 149,321 (3,304) (6,608) 197,877 - 3,304 Mr Ian McGregor - - - - - - - Mr Phill Laidlaw 15,000 100,771 - - 115,771 - - Mr Jerry Collins 15,000 76,219 - - 91,219 - -
(e) Loans to key management personnel No loans have been made to any of the key management personnel, including their related parties. (f) Transactions with other related parties No key management personnel has entered in to any material contract, loan or other transaction with any
entity in the Hastie Group during the year ended 30 June 2011 (2010: nil).
During the year a number of Hastie Directors have been Directors of other Companies, see pages 3 and 4, with whom Hastie Group entities may have business relationships but all such transactions are on normal and arms length terms and conditions.
The Board undertakes a detailed review of related party transactions on a regular basis.
A company, ADR Properties Pty Limited, directly controlled by David Martin, a non - executive director, provided business premises and facilities during the period under normal terms and conditions to a Group entity totaling $220,520 (2010: $221,000).
A company, MQP Investments Pty Limited, of which David Hammond, a key management person, holds a non-controlling interest, provided business premises and facilities during the period under normal terms and conditions to a Group entity totaling $825,279 (2010: $770,556).
For
per
sona
l use
onl
y

�������� ����������(���������#��"����������������
� � � � ���
33. Related party disclosures (continued)
A company, Lazard Australia Private Equity Pty Ltd, of which Lindsay Phillips, a non – executive director appointed on 4 August 2011, is the Managing Director, received sub-underwriting fees in respect of the Retail Entitlement Offer which opened on 23 June 2011, of $598,000 (2010: $nil).
2011
$’000 2010 $’000
34. (Loss) / Profit for the year
(Loss) / profit for the year includes the following items of gains/(expenses):
Gain on sale of property, plant & equipment 114 243
Net finance costs (note 4) (35,142) (20,637) Inventory: Write-down of inventory to net realisable value (343) (213) Depreciation Property, plant and equipment Buildings (201) (238) Leasehold improvements (1,677) (1,479) Plant and equipment (3,079) (2,803) Motor vehicles (2,893) (2,518) Office furniture and equipment (3,655) (3,048) (11,505) (10,086) Amortisation Leased motor vehicles (902) (980) Software (2,425) (2,219) Customer contracts (238) (213) (3,565) (3,412) Operating lease rental expenses (22,795) (16,245) 35. Employee benefit expense
Post employment benefits: Defined contribution plans (30,905) (26,757) Share-based payments: Equity settled share-based payments (328) (520) Other employee benefits (522,190) (445,138) (553,423) (472,415) F
or p
erso
nal u
se o
nly
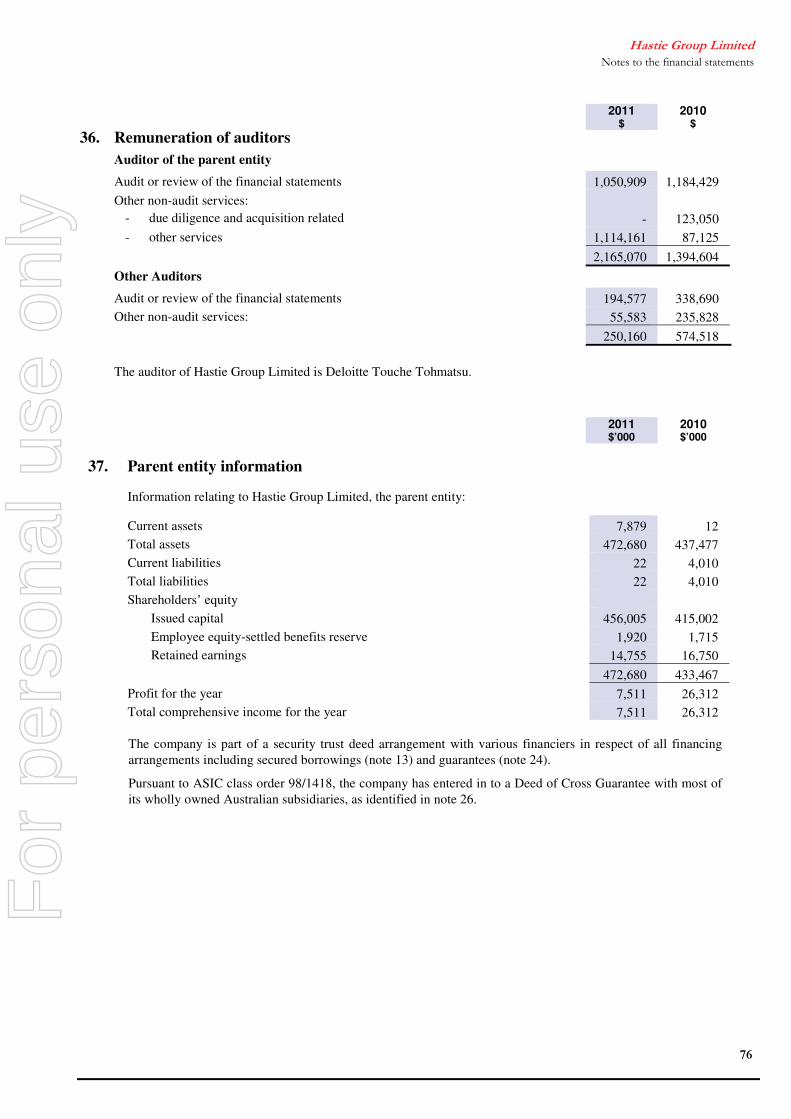
�������� ����������(���������#��"����������������
� � � � ���
2011 $
2010 $
36. Remuneration of auditors
Auditor of the parent entity
Audit or review of the financial statements 1,050,909 1,184,429
Other non-audit services:
- due diligence and acquisition related
-
123,050 - other services 1,114,161 87,125
2,165,070 1,394,604
Other Auditors
Audit or review of the financial statements 194,577 338,690 Other non-audit services: 55,583 235,828 250,160 574,518 The auditor of Hastie Group Limited is Deloitte Touche Tohmatsu.
2011 $’000
2010 $’000
37. Parent entity information
Information relating to Hastie Group Limited, the parent entity:
Current assets 7,879 12 Total assets 472,680 437,477 Current liabilities 22 4,010 Total liabilities 22 4,010 Shareholders’ equity Issued capital 456,005 415,002 Employee equity-settled benefits reserve 1,920 1,715 Retained earnings 14,755 16,750 472,680 433,467 Profit for the year 7,511 26,312 Total comprehensive income for the year 7,511 26,312 The company is part of a security trust deed arrangement with various financiers in respect of all financing
arrangements including secured borrowings (note 13) and guarantees (note 24).
Pursuant to ASIC class order 98/1418, the company has entered in to a Deed of Cross Guarantee with most of its wholly owned Australian subsidiaries, as identified in note 26.
For
per
sona
l use
onl
y

�������� ����������(���������#��"����������������
� � � � ���
38. Subsequent events On 18 July 2011 Hastie announced the successful completion of the retail component of its fully underwritten
2.85 for 1 accelerated renounceable entitlement offer, raising $73.7 million; which represented the completion of the final stage of the entitlement offer announced on 14 June 2011. Following receipt of the funds from the retail component of the entitlement offer, on 18 July 2011, Hastie repaid a further $81.1 million to its Banking Group ($106.1 million in aggregate, including $25.0 million repaid in June 2011 out of the proceeds of the institutional component of the entitlement offer) thereby bringing the new syndicated debt facilities in to force. Drawings under these new facilities were then used to repay all previous bilateral debt facilities and all bonds and trade letters of credit issued under bilateral or syndicated standstill facilities were novated to the new syndicated debt facilities; following which the previous bilateral facilities and the syndicated standstill funding agreement, signed on 8 April 2011, were cancelled. From 18 July 2011 Hastie was no longer subject to the terms of the standstill deed entered into on 8 April 2011 and it’s relations with its Banking Group are now solely governed by the terms of the new syndicated debt facilities signed on 8 June 2011. On 22nd July 2011 at Hastie’s Extraordinary General Meeting shareholders voted in favor of the conditional placement totaling $42.8 million, where the funds, net of equity raising fees and costs, were received on 26 July 2011 and used to further pay down debt. This represented the completion of the final stage of Hastie’s $160 million equity raising. On 11 August 2011 an offer to participate in the Hastie Group Share Purchase Plan was dispatched to existing Australian and New Zealand shareholders on the register as at 7pm (Sydney time) on 5 August, inviting each of them to participate up to a maximum amount of $15,000, based on a share price of $0.14 per share. The offer will close at 5pm (Sydney time) on 1 September 2011, with shares allotted on 12 September 2011.
39. General information
Hastie Group Limited is a listed public company, incorporated in Australia, and operating primarily in Australia, United Kingdom, New Zealand, and United Arab Emirates.
Its registered office and principal place of business is Level 5, 20 Highgate Street, Auburn NSW 2144.
For
per
sona
l use
onl
y

�������� ����������(���������#��"����������������
� � � � ���
Additional Stock Exchange information Number of holders of equity securities as at 15 August 2011
Ordinary share capital 1,367,511,426 fully paid ordinary shares are held by 9,951 individual shareholders. All issued ordinary shares carry one vote per share.
Performance rights 4,069,213 performance rights are held by 75 individual holders. Performance rights do not carry a right to vote.
Distribution of holders of equity securities
Ordinary shares
Performance rights
Number % Number %
1 - 1,000 1,463 14.7 1 1.3 1,001 - 5,000 2,832 28.5 2 2.7 5,001 - 10,000 1,670 16.8 - -
10,001 - 100,000 3,376 33.9 63 84.0 100,001 and over 610 6.1 9 12.0
9,951 100.0 75 100.0
Holding less than a marketable parcel
3,582 36.0
Substantial shareholders
Ordinary shareholders
Ordinary shares Number %
Lazard Australia Private Equity 341,728,338 25.0 Perennial Growth Management 154,221,214 11.3 Thorney Investments 131,276,726 9.6 Schroder Investment Management 105,724,199 7.7
732,950,477 53.6
For
per
sona
l use
onl
y

�������� ����������(���������#��"����������������
� � � � ���
Additional stock exchange information (Cont’d)
Twenty largest holders of quoted equity securities
Ordinary shares Number % Citicorp Nominees Pty Limited 153,127,781 11.2 CWC COFA Pty Limited <CWC Corp Opportunity 1A A/C> 137,592,507 10.1 CWC COFB Pty Limited <CWC Corp Opportunity 1B A/C> 137,592,507 10.1 JP Morgan Nominees Australia Limited 118,280,588 8.6 UBS Nominees Pty Limited 108,361,369 7.9 National Nominees Limited 99,167,168 7.2 HSBC Custody Nominees (Australia) Limited 83,560,868 6.1 JP Morgan Nominees Australia Limited <Cash Income A/C> 69,906,624 5.1 CWC Investors Pty Limited <CWC Investment Unit A/C> 30,576,112 2.2 Masfen Securities Limited 29,203,196 2.1 Cogent Nominees Pty Limited 20,209,447 1.5 CWC COFA Pty Limited <CWC Corporate Opportunity 1A Trust A/C> 16,185,245 1.2 CWC COFB Pty Limited <CWC Corporate Opportunity 1B Trust A/C> 16,185,245 1.2 Morgan Stanley Australia Securities (Nominee) Pty Limited <No 1 Account> 6,285,403 0.5 Queensland Investment Corporation 5,003,090 0.4 P & T Carrick <Carrick Family S/Fund A/C> 3,850,000 0.3 UBS Wealth Management Australia Nominees Pty Limited 3,738,507 0.3 CWC Investors Pty Limited <CWC Investment Unit Trust A/C> 3,596,722 0.3 Peveril Investments Pty Limited 3,387,451 0.2 Klip Pty Limited >Beirne Super Fund A?C> 3,074,419 0.2 1,048,882,249 76.7
Company secretary
Anne Griegg Registered office Level 5, 20 Highgate Street, Auburn NSW 2144
Share registry Link Market Services Limited
For
per
sona
l use
onl
y


