30
SHAVER SHOP GROUP LIMITED RESULTS PRESENTATION 24 AUGUST 2020 For personal use only

SH
AV
ER
SH
OP
GR
OU
P L
IMIT
ED
R
ES
ULT
S P
RE
SE
NT
AT
ION
24
AU
GU
ST
20
20
For
per
sona
l use
onl
y

01
02
03
04
05
FY2020 HIGHLIGHTS
FY2020 FINANCIAL RESULTS SUMMARY
OMNI RETAIL CATEGORY LEADERSHIP
TRADING UPDATE & OUTLOOK
INVESTMENT SUMMARY F
or p
erso
nal u
se o
nly

3
FY2020 HIGHLIGHTS
For
per
sona
l use
onl
y
INVESTOR PRESENTATION AUGUST 2020 4
> Total sales up 16.4% to $194.9m with LFL sales up 15.3%
– Adapted quickly to meet COVID-19 challenges & opportunity
– Exceptional in-store service metrics
> Online sales up 103.5% to $47.8m (now 22.7% of sales)
> Gross profit margin 42.6% (consistent with FY2019)
> Exceeded guidance, comparable (AASB 117) EBITDA up 36.0% to $18.4m
– Previous guidance $17.25m to $18.25m
> Comparable NPAT up 44.6% to $10.6m
> Operating cash flow up 131% to $28.9m
> Net cash $12.6m with no debt ($30 million undrawn facility)
> New Zealand growth accelerating - driving region profit
> Foundational CRM and ERP platforms launched and fully integrated - technology transformation driving sales growth and operational efficiency
> Announced 100% franked final dividend of 2.7 cents per share (FY2020 dividends – 4.8 cents per share)
RECORD SALES AND PROFIT GIVEN OMNI
RETAIL STRENGTH
FY2020 HIGHLIGHTS
For
per
sona
l use
onl
y
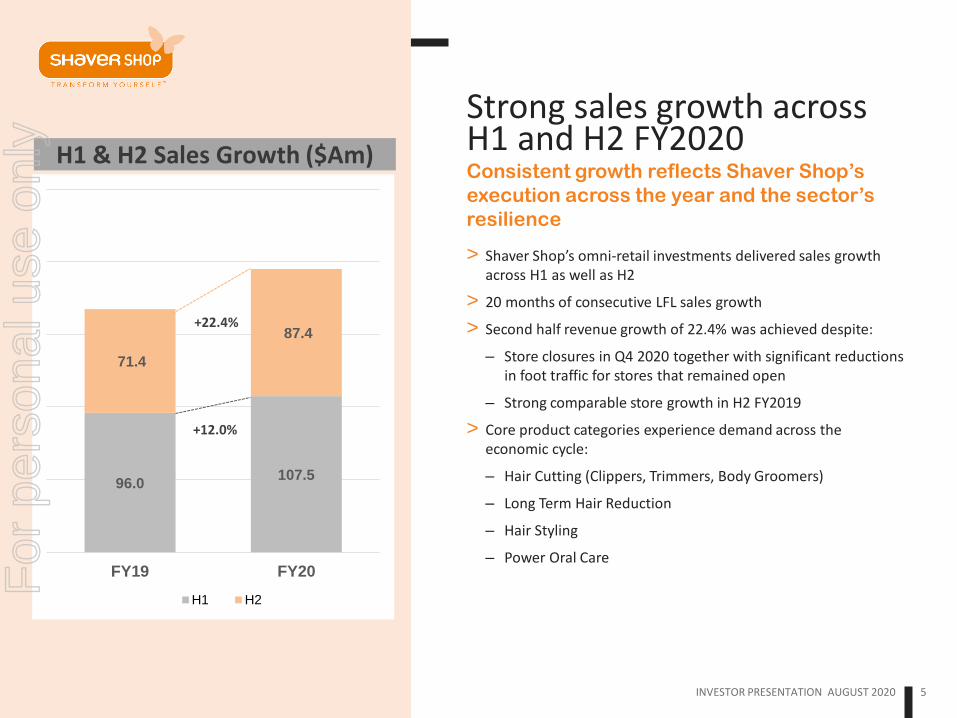
96.0 107.5
71.4
87.4
FY19 FY20
H1 H2
+12.0%
+22.4%
Strong sales growth across H1 and H2 FY2020
> Shaver Shop’s omni-retail investments delivered sales growth across H1 as well as H2
> 20 months of consecutive LFL sales growth
> Second half revenue growth of 22.4% was achieved despite:
– Store closures in Q4 2020 together with significant reductions in foot traffic for stores that remained open
– Strong comparable store growth in H2 FY2019
> Core product categories experience demand across the economic cycle:
– Hair Cutting (Clippers, Trimmers, Body Groomers)
– Long Term Hair Reduction
– Hair Styling
– Power Oral Care
Consistent growth reflects Shaver Shop’s
execution across the year and the sector’s
resilience
H1 & H2 Sales Growth ($Am)
INVESTOR PRESENTATION AUGUST 2020 5
For
per
sona
l use
onl
y
INVESTOR PRESENTATION AUGUST 2020 6
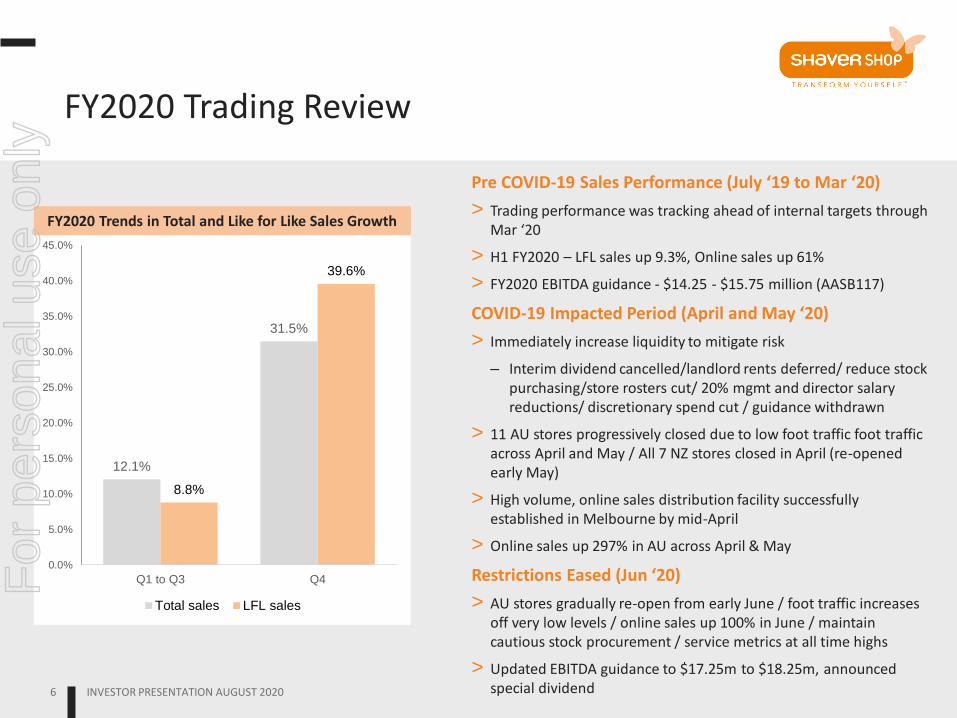
Pre COVID-19 Sales Performance (July ‘19 to Mar ‘20)
> Trading performance was tracking ahead of internal targets through Mar ‘20
> H1 FY2020 – LFL sales up 9.3%, Online sales up 61%
> FY2020 EBITDA guidance - $14.25 - $15.75 million (AASB117)
COVID-19 Impacted Period (April and May ‘20)
> Immediately increase liquidity to mitigate risk
– Interim dividend cancelled/landlord rents deferred/ reduce stock purchasing/store rosters cut/ 20% mgmt and director salary reductions/ discretionary spend cut / guidance withdrawn
> 11 AU stores progressively closed due to low foot traffic foot traffic across April and May / All 7 NZ stores closed in April (re-opened early May)
> High volume, online sales distribution facility successfully established in Melbourne by mid-April
> Online sales up 297% in AU across April & May
Restrictions Eased (Jun ‘20)
> AU stores gradually re-open from early June / foot traffic increases off very low levels / online sales up 100% in June / maintain cautious stock procurement / service metrics at all time highs
> Updated EBITDA guidance to $17.25m to $18.25m, announced special dividend
FY2020 Trading Review
12.1%
31.5%
8.8%
39.6%
0.0%
5.0%
10.0%
15.0%
20.0%
25.0%
30.0%
35.0%
40.0%
45.0%
Q1 to Q3 Q4
Total sales LFL sales
FY2020 Trends in Total and Like for Like Sales Growth
For
per
sona
l use
onl
y
COVID-19 UPDATE
> Health and wellbeing of our customers and team members has always been, and will remain, our top priority
> Social distancing and related restrictions has accelerated adoption of DIY personal care and grooming appliances
> Digital investments and strategies of the last 24 months has enabled Shaver Shop to successfully manage customers’ transition to, and the surge in, online spend
> In-store teams have delivered exceptional levels of customer service throughout pandemic and remain a core competitive advantage
> No JobKeeper contribution to FY2020 results ($0.2m NZ wage subsidy contribution)
> Managed strong H2 sales growth while significantly reducing stock levels – improved liquidity and risk mitigation
> Support office successfully working from home since late March 2020
INVESTOR PRESENTATION AUGUST 2020 7
Successfully navigating challenges while
maintaining growth
For
per
sona
l use
onl
y
8
FY2020 FINANCIAL RESULTS SUMMARY
For
per
sona
l use
onl
y
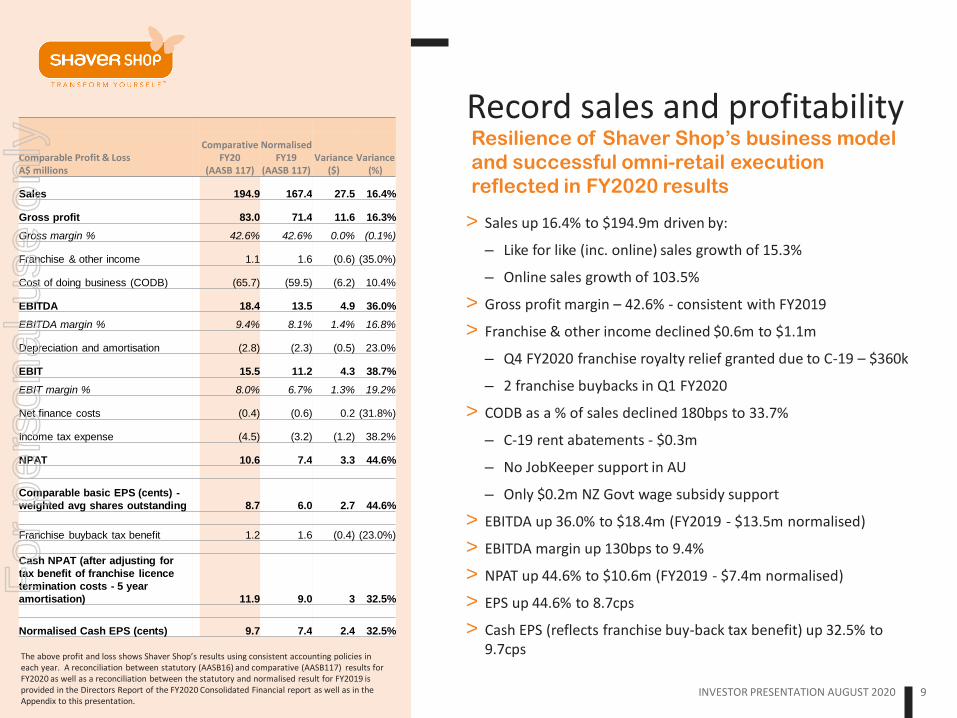
Record sales and profitability Resilience of Shaver Shop’s business model
and successful omni-retail execution
reflected in FY2020 results
INVESTOR PRESENTATION AUGUST 2020 9
> Sales up 16.4% to $194.9m driven by:
– Like for like (inc. online) sales growth of 15.3%
– Online sales growth of 103.5%
> Gross profit margin – 42.6% - consistent with FY2019
> Franchise & other income declined $0.6m to $1.1m
– Q4 FY2020 franchise royalty relief granted due to C-19 – $360k
– 2 franchise buybacks in Q1 FY2020
> CODB as a % of sales declined 180bps to 33.7%
– C-19 rent abatements - $0.3m
– No JobKeeper support in AU
– Only $0.2m NZ Govt wage subsidy support
> EBITDA up 36.0% to $18.4m (FY2019 - $13.5m normalised)
> EBITDA margin up 130bps to 9.4%
> NPAT up 44.6% to $10.6m (FY2019 - $7.4m normalised)
> EPS up 44.6% to 8.7cps
> Cash EPS (reflects franchise buy-back tax benefit) up 32.5% to 9.7cps
Comparable Profit & Loss A$ millions
Comparative FY20
(AASB 117)
Normalised FY19
(AASB 117) Variance
($) Variance
(%)
Sales 194.9 167.4 27.5 16.4%
Gross profit 83.0 71.4 11.6 16.3%
Gross margin % 42.6% 42.6% 0.0% (0.1%)
Franchise & other income 1.1 1.6 (0.6) (35.0%)
Cost of doing business (CODB) (65.7) (59.5) (6.2) 10.4%
EBITDA 18.4 13.5 4.9 36.0%
EBITDA margin % 9.4% 8.1% 1.4% 16.8%
Depreciation and amortisation (2.8) (2.3) (0.5) 23.0%
EBIT 15.5 11.2 4.3 38.7%
EBIT margin % 8.0% 6.7% 1.3% 19.2%
Net finance costs (0.4) (0.6) 0.2 (31.8%)
Income tax expense (4.5) (3.2) (1.2) 38.2%
NPAT 10.6 7.4 3.3 44.6%
Comparable basic EPS (cents) -
weighted avg shares outstanding 8.7 6.0 2.7 44.6%
Franchise buyback tax benefit 1.2 1.6 (0.4) (23.0%)
Cash NPAT (after adjusting for
tax benefit of franchise licence
termination costs - 5 year
amortisation) 11.9 9.0 3 32.5%
Normalised Cash EPS (cents) 9.7 7.4 2.4 32.5%
The above profit and loss shows Shaver Shop’s results using consistent accounting policies in each year. A reconciliation between statutory (AASB16) and comparative (AASB117) results for FY2020 as well as a reconciliation between the statutory and normalised result for FY2019 is provided in the Directors Report of the FY2020 Consolidated Financial report as well as in the Appendix to this presentation.
For
per
sona
l use
onl
y
INVESTOR PRESENTATION AUGUST 2020 10
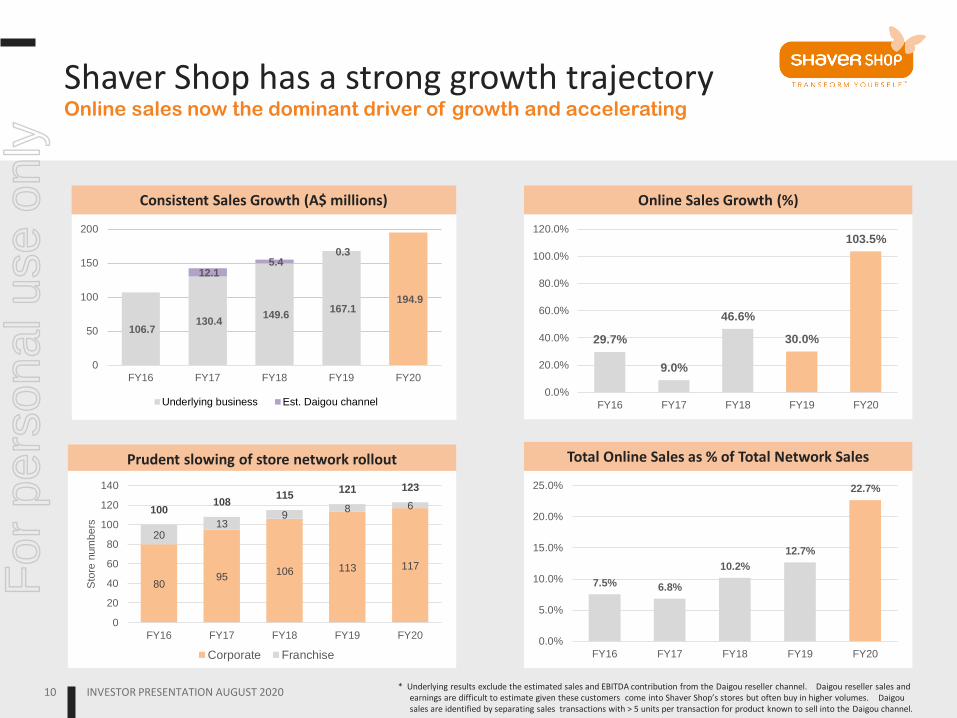
Online sales now the dominant driver of growth and accelerating
Shaver Shop has a strong growth trajectory
Consistent Sales Growth (A$ millions)
106.7 130.4
149.6 167.1
194.9
12.1 5.4
0.3
0
50
100
150
200
FY16 FY17 FY18 FY19 FY20
Underlying business Est. Daigou channel
Online Sales Growth (%)
7.5% 6.8%
10.2%
12.7%
22.7%
0.0%
5.0%
10.0%
15.0%
20.0%
25.0%
FY16 FY17 FY18 FY19 FY20
Total Online Sales as % of Total Network Sales Prudent slowing of store network rollout
80 95
106 113 117
20 13
9 8 6 100
108 115
121 123
0
20
40
60
80
100
120
140
FY16 FY17 FY18 FY19 FY20
Sto
re n
um
bers
Corporate Franchise
29.7%
9.0%
46.6%
30.0%
103.5%
0.0%
20.0%
40.0%
60.0%
80.0%
100.0%
120.0%
FY16 FY17 FY18 FY19 FY20
* Underlying results exclude the estimated sales and EBITDA contribution from the Daigou reseller channel. Daigou reseller sales and earnings are difficult to estimate given these customers come into Shaver Shop’s stores but often buy in higher volumes. Daigou sales are identified by separating sales transactions with > 5 units per transaction for product known to sell into the Daigou channel.
For
per
sona
l use
onl
y
INVESTOR PRESENTATION AUGUST 2020 11
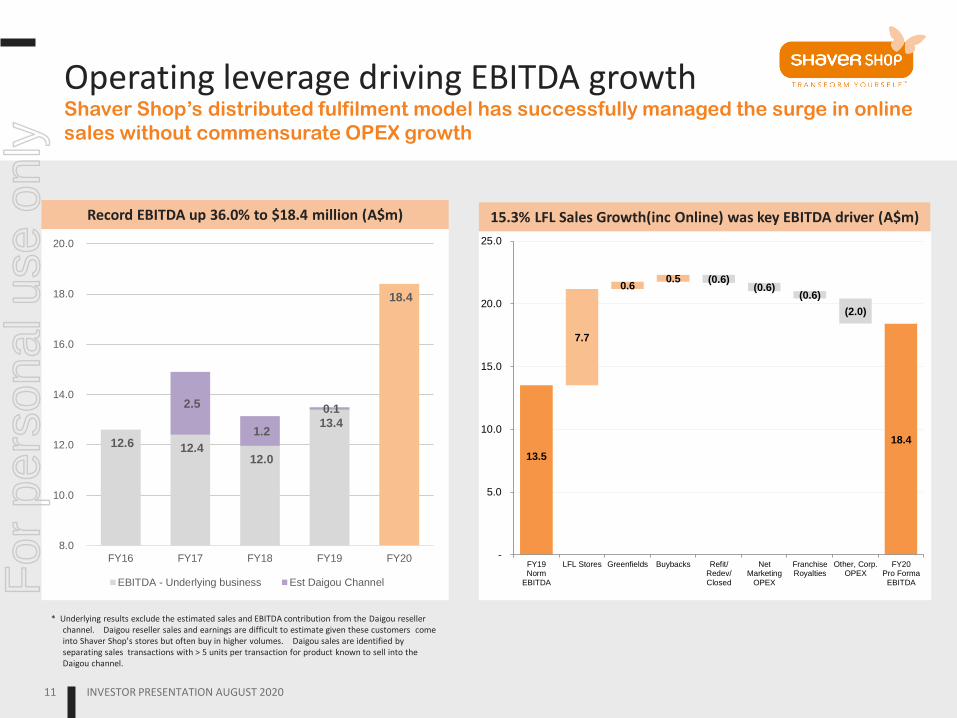
Shaver Shop’s distributed fulfilment model has successfully managed the surge in online
sales without commensurate OPEX growth
Operating leverage driving EBITDA growth
Record EBITDA up 36.0% to $18.4 million (A$m) 15.3% LFL Sales Growth(inc Online) was key EBITDA driver (A$m)
12.6 12.4 12.0
13.4
18.4
2.5
1.2
0.1
8.0
10.0
12.0
14.0
16.0
18.0
20.0
FY16 FY17 FY18 FY19 FY20
EBITDA - Underlying business Est Daigou Channel
13.5
18.4
7.7
0.6 0.5 (0.6)
(0.6) (0.6)
(2.0)
-
5.0
10.0
15.0
20.0
25.0
FY19Norm
EBITDA
LFL Stores Greenfields Buybacks Refit/Redev/Closed
NetMarketing
OPEX
FranchiseRoyalties
Other, Corp.OPEX
FY20Pro Forma
EBITDA
* Underlying results exclude the estimated sales and EBITDA contribution from the Daigou reseller channel. Daigou reseller sales and earnings are difficult to estimate given these customers come into Shaver Shop’s stores but often buy in higher volumes. Daigou sales are identified by separating sales transactions with > 5 units per transaction for product known to sell into the Daigou channel.
For
per
sona
l use
onl
y
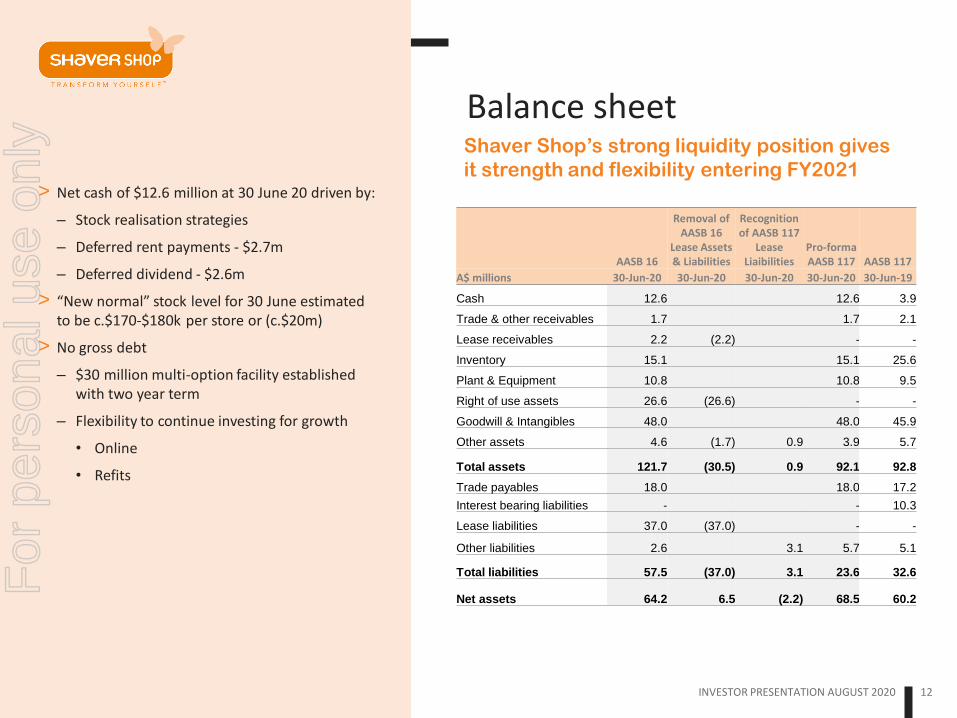
Balance sheet Shaver Shop’s strong liquidity position gives
it strength and flexibility entering FY2021
INVESTOR PRESENTATION AUGUST 2020 12
> Net cash of $12.6 million at 30 June 20 driven by:
– Stock realisation strategies
– Deferred rent payments - $2.7m
– Deferred dividend - $2.6m
> “New normal” stock level for 30 June estimated to be c.$170-$180k per store or (c.$20m)
> No gross debt
– $30 million multi-option facility established with two year term
– Flexibility to continue investing for growth
• Online
• Refits
AASB 16
Removal of AASB 16
Lease Assets & Liabilities
Recognition of AASB 117
Lease Liaibilities
Pro-forma AASB 117 AASB 117
A$ millions 30-Jun-20 30-Jun-20 30-Jun-20 30-Jun-20 30-Jun-19
Cash 12.6 12.6 3.9
Trade & other receivables 1.7 1.7 2.1
Lease receivables 2.2 (2.2) - -
Inventory 15.1 15.1 25.6
Plant & Equipment 10.8 10.8 9.5
Right of use assets 26.6 (26.6) - -
Goodwill & Intangibles 48.0 48.0 45.9
Other assets 4.6 (1.7) 0.9 3.9 5.7
Total assets 121.7 (30.5) 0.9 92.1 92.8
Trade payables 18.0 18.0 17.2
Interest bearing liabilities - - 10.3
Lease liabilities 37.0 (37.0) - -
Other liabilities 2.6 3.1 5.7 5.1
Total liabilities 57.5 (37.0) 3.1 23.6 32.6
Net assets 64.2 6.5 (2.2) 68.5 60.2
For
per
sona
l use
onl
y
13 INVESTOR PRESENTATION AUGUST 2020
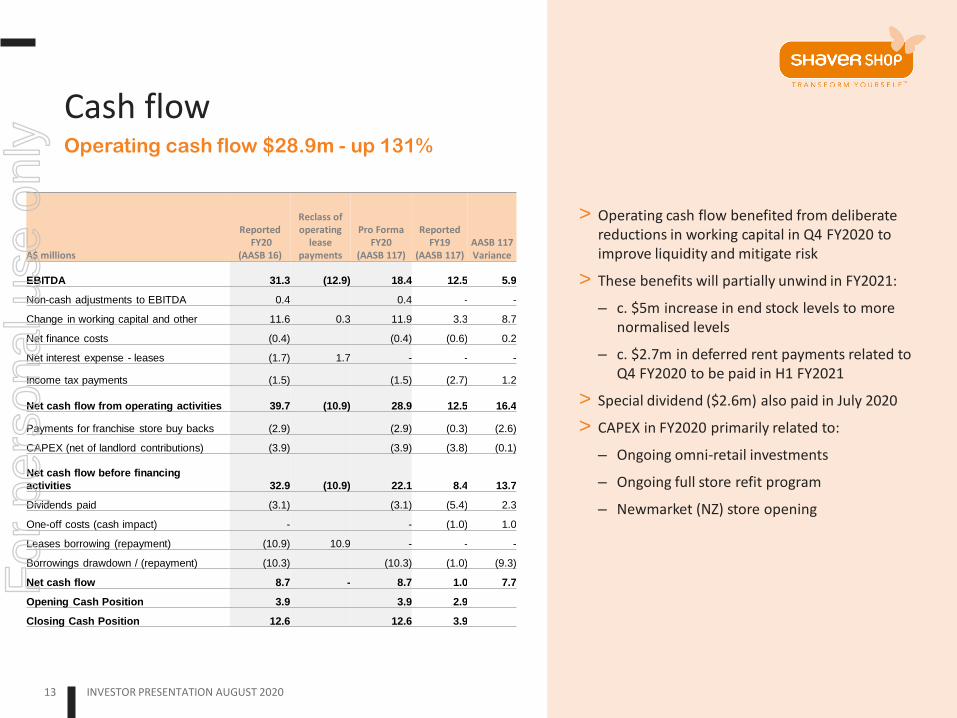
Operating cash flow $28.9m - up 131%
Cash flow
> Operating cash flow benefited from deliberate reductions in working capital in Q4 FY2020 to improve liquidity and mitigate risk
> These benefits will partially unwind in FY2021:
– c. $5m increase in end stock levels to more normalised levels
– c. $2.7m in deferred rent payments related to Q4 FY2020 to be paid in H1 FY2021
> Special dividend ($2.6m) also paid in July 2020
> CAPEX in FY2020 primarily related to:
– Ongoing omni-retail investments
– Ongoing full store refit program
– Newmarket (NZ) store opening
A$ millions
Reported FY20
(AASB 16)
Reclass of operating
lease payments
Pro Forma FY20
(AASB 117)
Reported FY19
(AASB 117) AASB 117 Variance
EBITDA 31.3 (12.9) 18.4 12.5 5.9
Non-cash adjustments to EBITDA 0.4 0.4 - -
Change in working capital and other 11.6 0.3 11.9 3.3 8.7
Net finance costs (0.4) (0.4) (0.6) 0.2
Net interest expense - leases (1.7) 1.7 - - -
Income tax payments (1.5) (1.5) (2.7) 1.2
Net cash flow from operating activities 39.7 (10.9) 28.9 12.5 16.4
Payments for franchise store buy backs (2.9) (2.9) (0.3) (2.6)
CAPEX (net of landlord contributions) (3.9) (3.9) (3.8) (0.1)
Net cash flow before financing
activities 32.9 (10.9) 22.1 8.4 13.7
Dividends paid (3.1) (3.1) (5.4) 2.3
One-off costs (cash impact) - - (1.0) 1.0
Leases borrowing (repayment) (10.9) 10.9 - - -
Borrowings drawdown / (repayment) (10.3) (10.3) (1.0) (9.3)
Net cash flow 8.7 - 8.7 1.0 7.7
Opening Cash Position 3.9 3.9 2.9
Closing Cash Position 12.6 12.6 3.9
For
per
sona
l use
onl
y
INVESTOR PRESENTATION AUGUST 2020 14
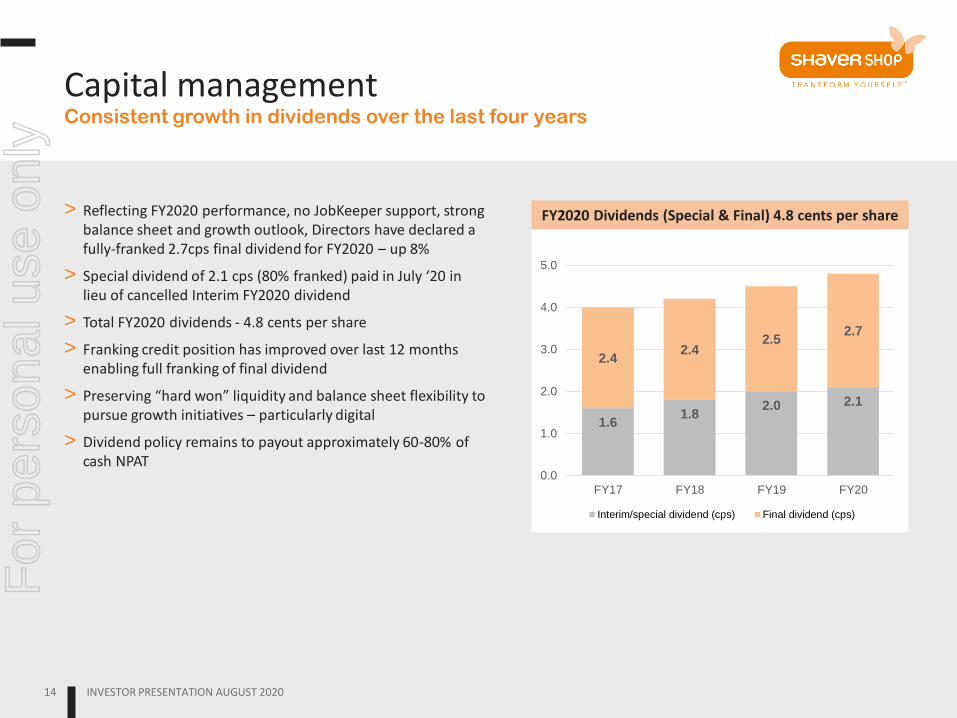
Consistent growth in dividends over the last four years
> Reflecting FY2020 performance, no JobKeeper support, strong balance sheet and growth outlook, Directors have declared a fully-franked 2.7cps final dividend for FY2020 – up 8%
> Special dividend of 2.1 cps (80% franked) paid in July ‘20 in lieu of cancelled Interim FY2020 dividend
> Total FY2020 dividends - 4.8 cents per share
> Franking credit position has improved over last 12 months enabling full franking of final dividend
> Preserving “hard won” liquidity and balance sheet flexibility to pursue growth initiatives – particularly digital
> Dividend policy remains to payout approximately 60-80% of cash NPAT
Capital management
FY2020 Dividends (Special & Final) 4.8 cents per share
1.6 1.8
2.0 2.1
2.4 2.4
2.5 2.7
0.0
1.0
2.0
3.0
4.0
5.0
FY17 FY18 FY19 FY20
Interim/special dividend (cps) Final dividend (cps)
For
per
sona
l use
onl
y

15
OMNI RETAIL CATEGORY LEADERSHIP
For
per
sona
l use
onl
y
16 INVESTOR PRESENTATION AUGUST 2020
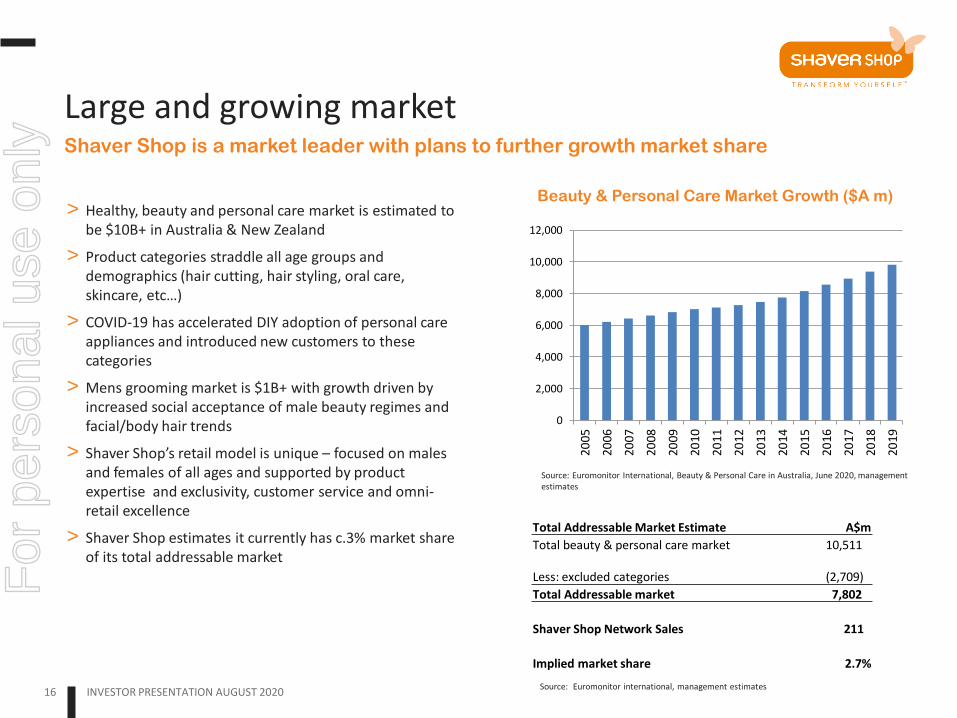
> Healthy, beauty and personal care market is estimated to be $10B+ in Australia & New Zealand
> Product categories straddle all age groups and demographics (hair cutting, hair styling, oral care, skincare, etc…)
> COVID-19 has accelerated DIY adoption of personal care appliances and introduced new customers to these categories
> Mens grooming market is $1B+ with growth driven by increased social acceptance of male beauty regimes and facial/body hair trends
> Shaver Shop’s retail model is unique – focused on males and females of all ages and supported by product expertise and exclusivity, customer service and omni-retail excellence
> Shaver Shop estimates it currently has c.3% market share of its total addressable market
Shaver Shop is a market leader with plans to further growth market share
Beauty & Personal Care Market Growth ($A m)
Large and growing market
0
2,000
4,000
6,000
8,000
10,000
12,000
2005
2006
2007
2008
2009
2010
2011
2012
2013
2014
2015
2016
2017
2018
2019
Source: Euromonitor International, Beauty & Personal Care in Australia, June 2020, management estimates
Source: Euromonitor international, management estimates
Total Addressable Market Estimate A$m
Total beauty & personal care market 10,511
Less: excluded categories (2,709)
Total Addressable market 7,802
Shaver Shop Network Sales 211
Implied market share 2.7%
For
per
sona
l use
onl
y
INVESTOR PRESENTATION AUGUST 2020 17
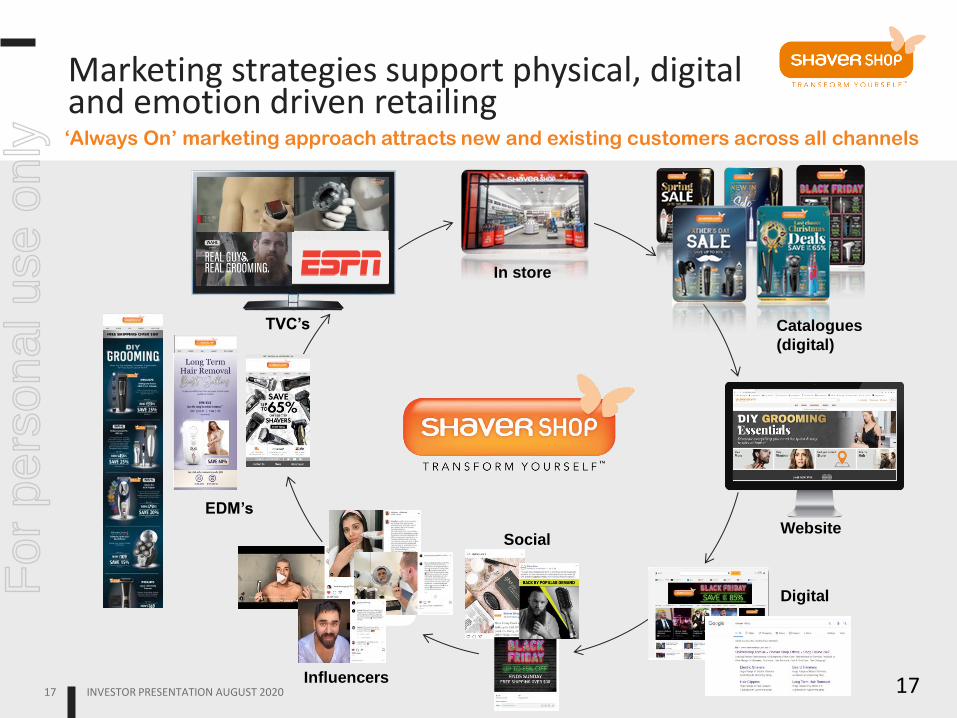
‘Always On’ marketing approach attracts new and existing customers across all channels
Marketing strategies support physical, digital and emotion driven retailing
In store
Website
Digital
Social
EDM’s
TVC’s
Influencers 17
Catalogues
(digital)
For
per
sona
l use
onl
y
INVESTOR PRESENTATION AUGUST 2020 18
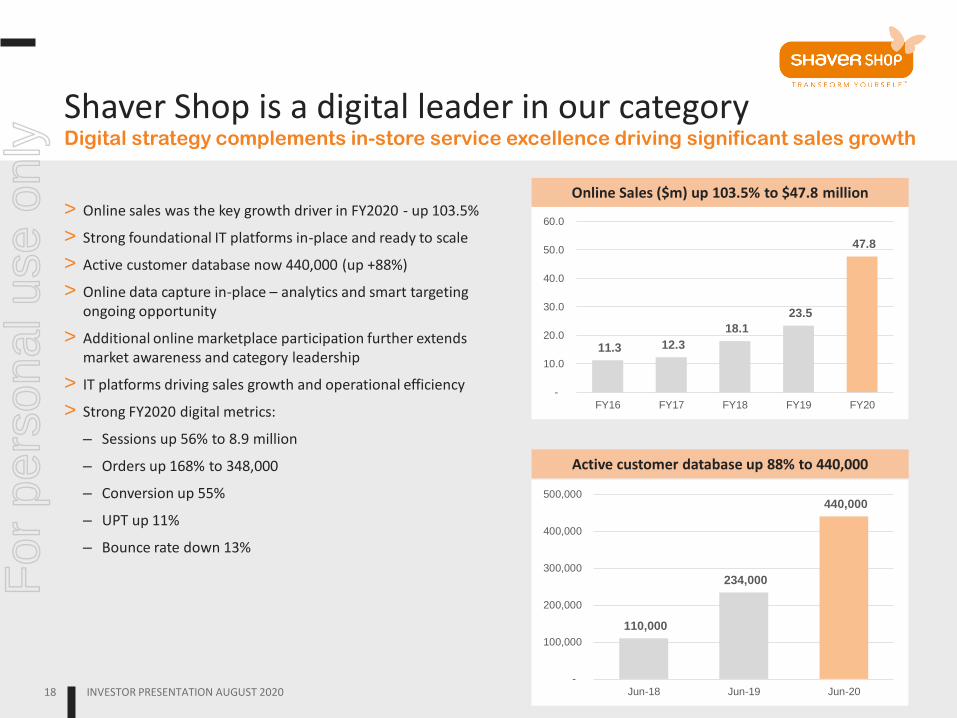
Digital strategy complements in-store service excellence driving significant sales growth
> Online sales was the key growth driver in FY2020 - up 103.5%
> Strong foundational IT platforms in-place and ready to scale
> Active customer database now 440,000 (up +88%)
> Online data capture in-place – analytics and smart targeting ongoing opportunity
> Additional online marketplace participation further extends market awareness and category leadership
> IT platforms driving sales growth and operational efficiency
> Strong FY2020 digital metrics:
– Sessions up 56% to 8.9 million
– Orders up 168% to 348,000
– Conversion up 55%
– UPT up 11%
– Bounce rate down 13%
Shaver Shop is a digital leader in our category
Online Sales ($m) up 103.5% to $47.8 million
110,000
234,000
440,000
-
100,000
200,000
300,000
400,000
500,000
Jun-18 Jun-19 Jun-20
Active customer database up 88% to 440,000
11.3 12.3
18.1
23.5
47.8
-
10.0
20.0
30.0
40.0
50.0
60.0
FY16 FY17 FY18 FY19 FY20
For
per
sona
l use
onl
y
INVESTOR PRESENTATION AUGUST 2020 19
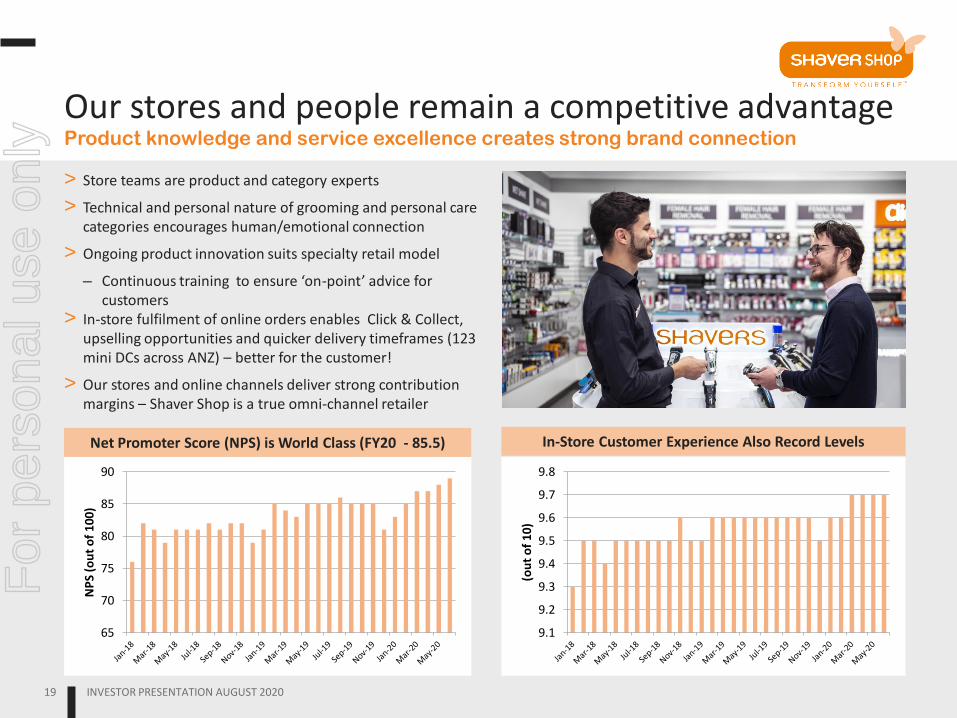
Product knowledge and service excellence creates strong brand connection
> Store teams are product and category experts
> Technical and personal nature of grooming and personal care categories encourages human/emotional connection
> Ongoing product innovation suits specialty retail model
– Continuous training to ensure ‘on-point’ advice for customers
> In-store fulfilment of online orders enables Click & Collect, upselling opportunities and quicker delivery timeframes (123 mini DCs across ANZ) – better for the customer!
> Our stores and online channels deliver strong contribution margins – Shaver Shop is a true omni-channel retailer
Our stores and people remain a competitive advantage
In-Store Customer Experience Also Record Levels
9.1
9.2
9.3
9.4
9.5
9.6
9.7
9.8
(ou
t o
f 10
)
Net Promoter Score (NPS) is World Class (FY20 - 85.5)
65
70
75
80
85
90
NP
S (o
ut
of
100)
For
per
sona
l use
onl
y

20
TRADING UPDATE AND OUTLOOK
For
per
sona
l use
onl
y
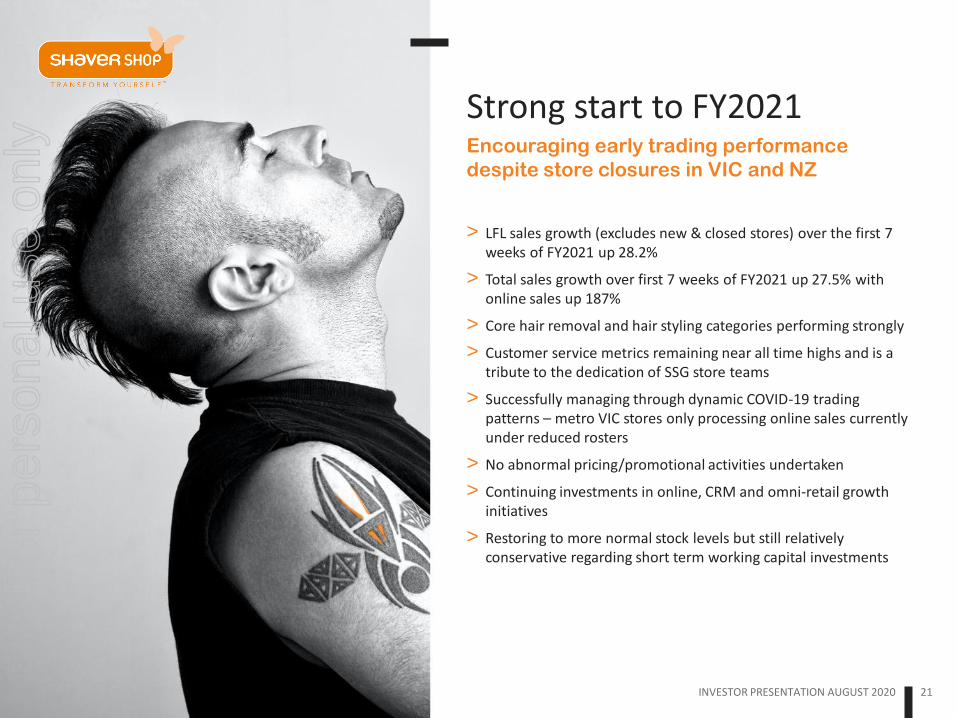
Strong start to FY2021
> LFL sales growth (excludes new & closed stores) over the first 7 weeks of FY2021 up 28.2%
> Total sales growth over first 7 weeks of FY2021 up 27.5% with online sales up 187%
> Core hair removal and hair styling categories performing strongly
> Customer service metrics remaining near all time highs and is a tribute to the dedication of SSG store teams
> Successfully managing through dynamic COVID-19 trading patterns – metro VIC stores only processing online sales currently under reduced rosters
> No abnormal pricing/promotional activities undertaken
> Continuing investments in online, CRM and omni-retail growth initiatives
> Restoring to more normal stock levels but still relatively conservative regarding short term working capital investments
INVESTOR PRESENTATION AUGUST 2020 21
Encouraging early trading performance
despite store closures in VIC and NZ
For
per
sona
l use
onl
y
INVESTOR PRESENTATION AUGUST 2020 22
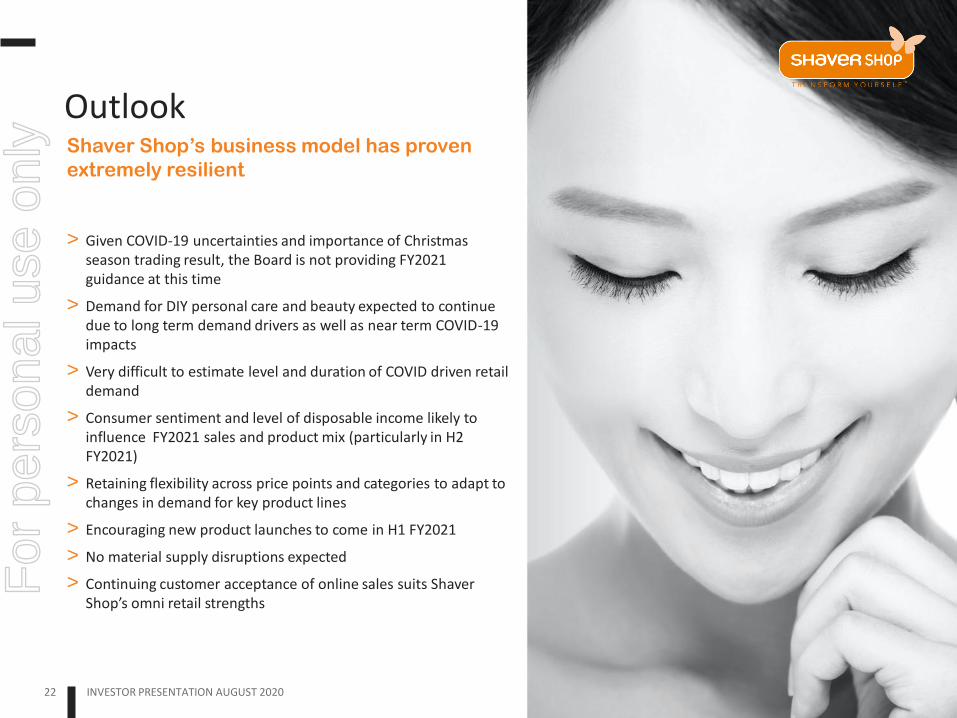
> Given COVID-19 uncertainties and importance of Christmas season trading result, the Board is not providing FY2021 guidance at this time
> Demand for DIY personal care and beauty expected to continue due to long term demand drivers as well as near term COVID-19 impacts
> Very difficult to estimate level and duration of COVID driven retail demand
> Consumer sentiment and level of disposable income likely to influence FY2021 sales and product mix (particularly in H2 FY2021)
> Retaining flexibility across price points and categories to adapt to changes in demand for key product lines
> Encouraging new product launches to come in H1 FY2021
> No material supply disruptions expected
> Continuing customer acceptance of online sales suits Shaver Shop’s omni retail strengths
Shaver Shop’s business model has proven
extremely resilient
Outlook
For
per
sona
l use
onl
y
23 INVESTOR PRESENTATION AUGUST 2020
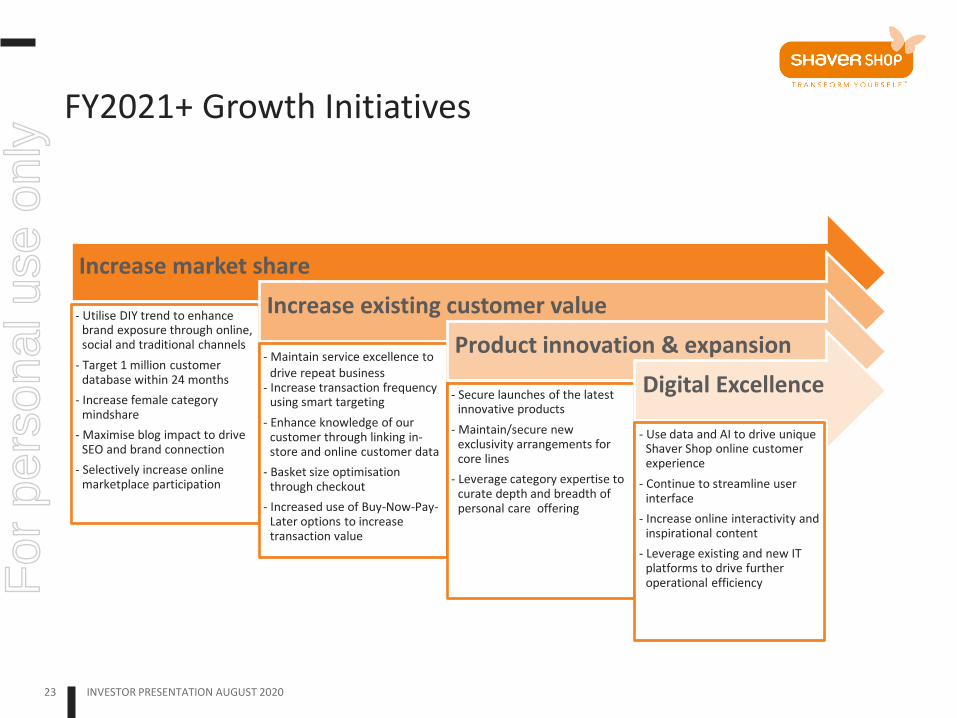
FY2021+ Growth Initiatives
Increase market share
- Utilise DIY trend to enhance brand exposure through online, social and traditional channels
- Target 1 million customer database within 24 months
- Increase female category mindshare
- Maximise blog impact to drive SEO and brand connection
- Selectively increase online marketplace participation
Increase existing customer value
- Maintain service excellence to drive repeat business
- Increase transaction frequency using smart targeting
- Enhance knowledge of our customer through linking in-store and online customer data
- Basket size optimisation through checkout
- Increased use of Buy-Now-Pay-Later options to increase transaction value
Product innovation & expansion
- Secure launches of the latest innovative products
- Maintain/secure new exclusivity arrangements for core lines
- Leverage category expertise to curate depth and breadth of personal care offering
Digital Excellence
- Use data and AI to drive unique Shaver Shop online customer experience
- Continue to streamline user interface
- Increase online interactivity and inspirational content
- Leverage existing and new IT platforms to drive further operational efficiency
For
per
sona
l use
onl
y

24
INVESTMENT SUMMARY
For
per
sona
l use
onl
y

Investment Summary
Large and growing market driven by changing consumer preferences and new product innovation
Significant potential to further increase market share
Strong brand awareness in Australia
Differentiated & resilient specialty retail business model
– Service excellence and unparalleled product knowledge
– Product exclusivity
– Competitive pricing
Leading omni-retailer in the category with strong online sales growth
Clean balance sheet – no debt – with strong cash conversion
Experienced management team
Strong focus on investing for growth and improving total shareholder returns
INVESTOR PRESENTATION AUGUST 2020 25
For
per
sona
l use
onl
y

26
Appendices
For
per
sona
l use
onl
y
INVESTOR PRESENTATION AUGUST 2020 27
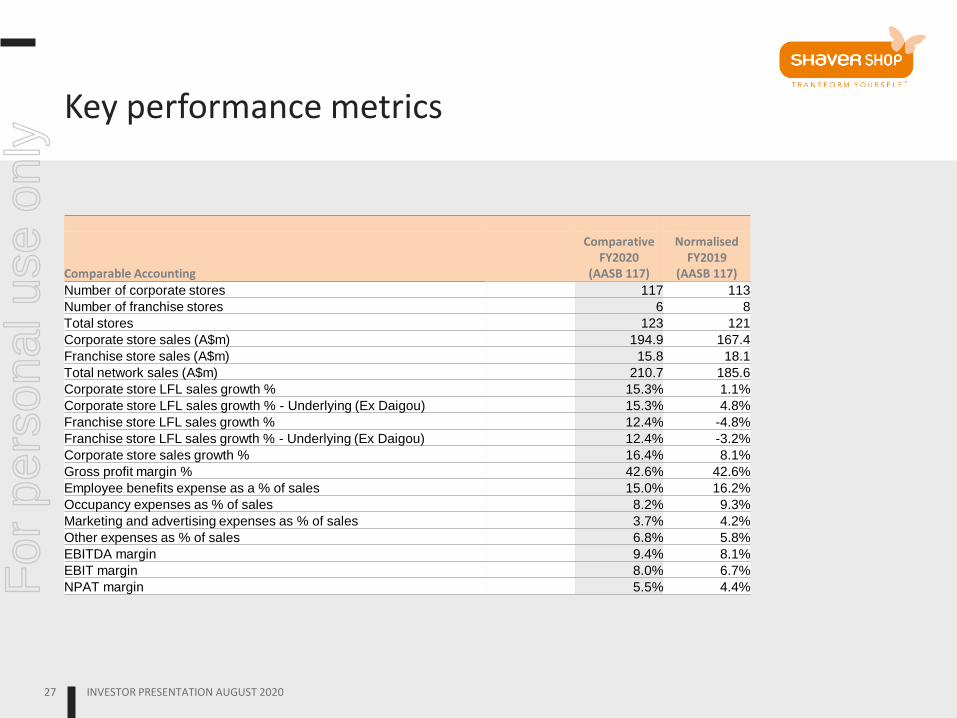
Key performance metrics
Comparable Accounting
Comparative FY2020
(AASB 117)
Normalised FY2019
(AASB 117)
Number of corporate stores 117 113
Number of franchise stores 6 8
Total stores 123 121
Corporate store sales (A$m) 194.9 167.4
Franchise store sales (A$m) 15.8 18.1
Total network sales (A$m) 210.7 185.6
Corporate store LFL sales growth % 15.3% 1.1%
Corporate store LFL sales growth % - Underlying (Ex Daigou) 15.3% 4.8%
Franchise store LFL sales growth % 12.4% -4.8%
Franchise store LFL sales growth % - Underlying (Ex Daigou) 12.4% -3.2%
Corporate store sales growth % 16.4% 8.1%
Gross profit margin % 42.6% 42.6%
Employee benefits expense as a % of sales 15.0% 16.2%
Occupancy expenses as % of sales 8.2% 9.3%
Marketing and advertising expenses as % of sales 3.7% 4.2%
Other expenses as % of sales 6.8% 5.8%
EBITDA margin 9.4% 8.1%
EBIT margin 8.0% 6.7%
NPAT margin 5.5% 4.4% For
per
sona
l use
onl
y
INVESTOR PRESENTATION AUGUST 2020 28
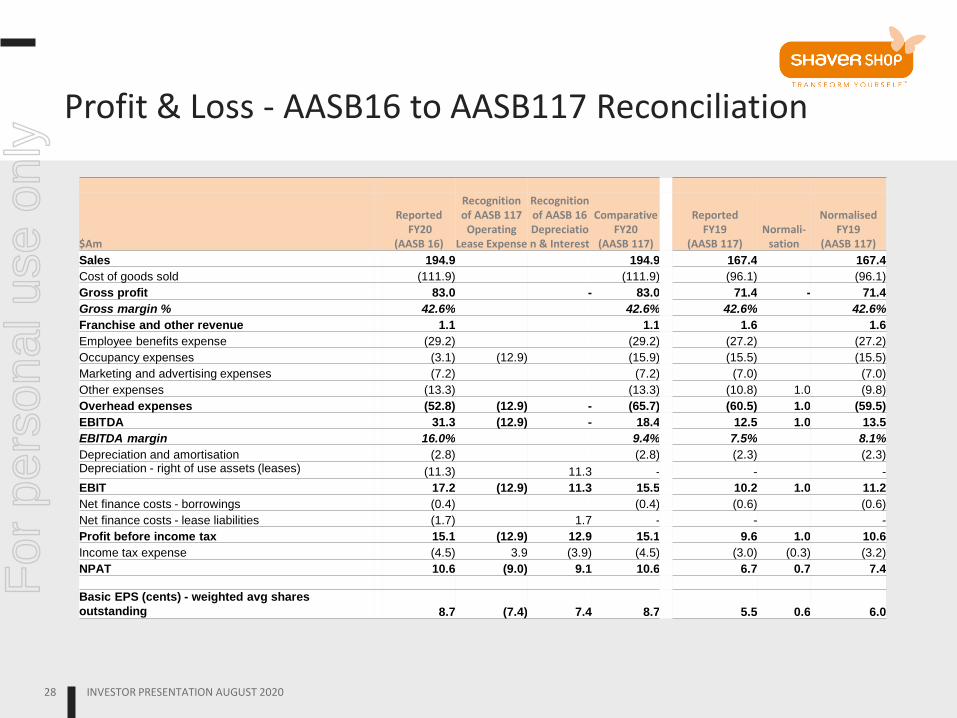
Profit & Loss - AASB16 to AASB117 Reconciliation
$Am
Reported FY20
(AASB 16)
Recognition of AASB 117
Operating Lease Expense
Recognition of AASB 16 Depreciation & Interest
Comparative FY20
(AASB 117)
Reported FY19
(AASB 117) Normali-
sation
Normalised FY19
(AASB 117)
Sales 194.9 194.9 167.4 167.4
Cost of goods sold (111.9) (111.9) (96.1) (96.1)
Gross profit 83.0 - 83.0 71.4 - 71.4
Gross margin % 42.6% 42.6% 42.6% 42.6%
Franchise and other revenue 1.1 1.1 1.6 1.6
Employee benefits expense (29.2) (29.2) (27.2) (27.2)
Occupancy expenses (3.1) (12.9) (15.9) (15.5) (15.5)
Marketing and advertising expenses (7.2) (7.2) (7.0) (7.0)
Other expenses (13.3) (13.3) (10.8) 1.0 (9.8)
Overhead expenses (52.8) (12.9) - (65.7) (60.5) 1.0 (59.5)
EBITDA 31.3 (12.9) - 18.4 12.5 1.0 13.5
EBITDA margin 16.0% 9.4% 7.5% 8.1%
Depreciation and amortisation (2.8) (2.8) (2.3) (2.3) Depreciation - right of use assets (leases) (11.3) 11.3 - - -
EBIT 17.2 (12.9) 11.3 15.5 10.2 1.0 11.2
Net finance costs - borrowings (0.4) (0.4) (0.6) (0.6)
Net finance costs - lease liabilities (1.7) 1.7 - - -
Profit before income tax 15.1 (12.9) 12.9 15.1 9.6 1.0 10.6
Income tax expense (4.5) 3.9 (3.9) (4.5) (3.0) (0.3) (3.2)
NPAT 10.6 (9.0) 9.1 10.6 6.7 0.7 7.4 Basic EPS (cents) - weighted avg shares
outstanding 8.7 (7.4) 7.4 8.7 5.5 0.6 6.0
For
per
sona
l use
onl
y
Important notice and disclaimer
29 29
This management presentation (“Presentation”) has been prepared by Shaver Shop Group Limited ACN 150 747 649 (“Shaver Shop”) and contains general background information about Shaver Shop, its subsidiaries and their activities which is current at the date of this Presentation.
Summary Information
The information contained in this Presentation is of a general nature and does not purport to be complete nor does it contain all the information which a prospective investor may require in evaluating a possible investment in Shaver Shop or that would be required in a prospectus or product disclosure statement prepared in accordance with the requirements of the Corporations Act 2001 (Cth). This Presentation should be read in conjunction with Shaver Shop’s other periodic and continuous disclosure announcements lodged with ASX, which are available at www.asx.com.au (Shaver Shop ASX Code: SSG). This Presentation is not intended to be relied upon as advice to investors or potential investors in Shaver Shop and does not take into account the investment objectives, financial situation or needs of any particular investor. These should be considered, with our without professional advice, when deciding if an investment is appropriate.
Disclaimer
Neither Shaver Shop, its related bodies corporate nor any of their respective officers, directors, employees, advisers and agents (Shaver Shop Parties) warrant the accuracy or reliability of the information contained in this Presentation. To the maximum extent permitted by law, each of the Shaver Shop Parties disclaims any responsibility and liability flowing from the use of the information contained in this Presentation by any party. To the maximum extent permitted by law, the Shaver Shop Parties do not accept any liability to any person, organisation or entity for any loss or damage suffered as a result of reliance on this Presentation.
Past performance
Past performance, including past share price performance and historical information in this Presentation, is given for illustrative purposes only and cannot be relied upon as an indicator of, and provides no guidance as to, future performance of Shaver Shop, including future share price performance. The historical information contained in this Presentation is not represented as being indicative of Shaver Shop’s views on its future financial condition and/or performance.
Forward looking statements
This Presentation contains certain forward looking statements and comments about future events, including Shaver Shop’s expectations about the performance of its business. Forward looking statements can generally be identified by the use of forward looking words such as ‘expect’, ‘anticipate’, ‘likely’, ‘intend’, ‘should’, ‘could’, ‘may’, ‘predict’, ‘plan’, ‘propose’, ‘will’, ‘believe’, ‘forecast’, ‘estimate’, ‘target’ and other similar expressions. Indications of and any guidance on future earnings or financial position or performance of Shaver Shop are also forward looking statements.
Forward looking statements involve inherent risks and uncertainties, both general and specific, and there is a risk that such predictions, forecasts, projections and other forward looking statements will not be achieved. Shaver Shop’s 2019 Consolidated Financial Report contains details of a number of key risks associated with an investment in Shaver Shop. Many of these risks are beyond the control of Shaver Shop. Should one or more of these or other risks or uncertainties materialise, or should any assumption underlying any forward looking statement contained in this Presentation prove incorrect, Shaver Shop’s actual results may differ materially from the plans, objectives, expectations, estimates, and intentions expressed in the forward looking statements contained in this Presentation. As such, undue reliance should not be placed on any forward looking statement.
Shaver Shop is providing the information contained in this Presentation as at the date of this Presentation and, except as required by law or regulation (including the ASX Listing Rules), does not assume any obligation to update any forward-looking statements contained in this Presentation as a result of new information, future events or developments or otherwise.
Pro forma and normalised financial information
This Presentation contains pro forma and normalised financial information. The pro forma and normalised financial information and past information provided in this Presentation is for illustrative purposes only and is not represented as being indicative of Shaver Shop’s views on its future financial condition and/or performance. This financial information has been prepared by Shaver Shop in accordance with the measurement and recognition requirements, but not the disclosure requirements, of applicable accounting standards and other mandatory reporting requirements in Australia.
Shaver Shop uses certain measures to manage and report on its business that are not recognised under Australian Accounting Standards. These measures are referred to as non-IFRS financial information. Shaver Shop considers that this non-IFRS financial information is important to assist in evaluating Shaver Shop’s performance. The information is presented to assist in making appropriate comparisons with prior periods and to assess the operating performance of the business. In particular this information is important for comparative purposes with normalised results across financial periods..
For a reconciliation of the non-IFRS financial information contained in this Presentation to IFRS-compliant comparative information, refer to the Directors Report that forms part of the Shaver Shop Group Limited Consolidated Financial Report that has been lodged with the ASX. All dollar values in this Presentation are in Australian dollars (A$), unless otherwise specified.
29
For
per
sona
l use
onl
y

SH
AV
ER
SH
OP
GR
OU
P L
IMIT
ED
F
Y2
02
0 R
ES
ULT
S P
RE
SE
NT
AT
ION
24
AU
GU
ST
20
20
For
per
sona
l use
onl
y


