51
Australian Worldwide Exploration www.awexp.com.au August/September 2007 For personal use only

Australian Worldwide Exploration
www.awexp.com.au
August/September 2007
For
per
sona
l use
onl
y

overviewfinancial summarycornerstone projects a year of deliveryfuture outlook
For
per
sona
l use
onl
y

Overview
For
per
sona
l use
onl
y

Overview of AWE ASX200 E&P operating company
market cap. = A$1,410m (@ $3.15 per share)
reserves = 56 mmboe (2P)
strong financial position
4 cornerstone projects in production
captured growth potential
exploration :- NZ, Indonesia and Australia
future growth options
For
per
sona
l use
onl
y
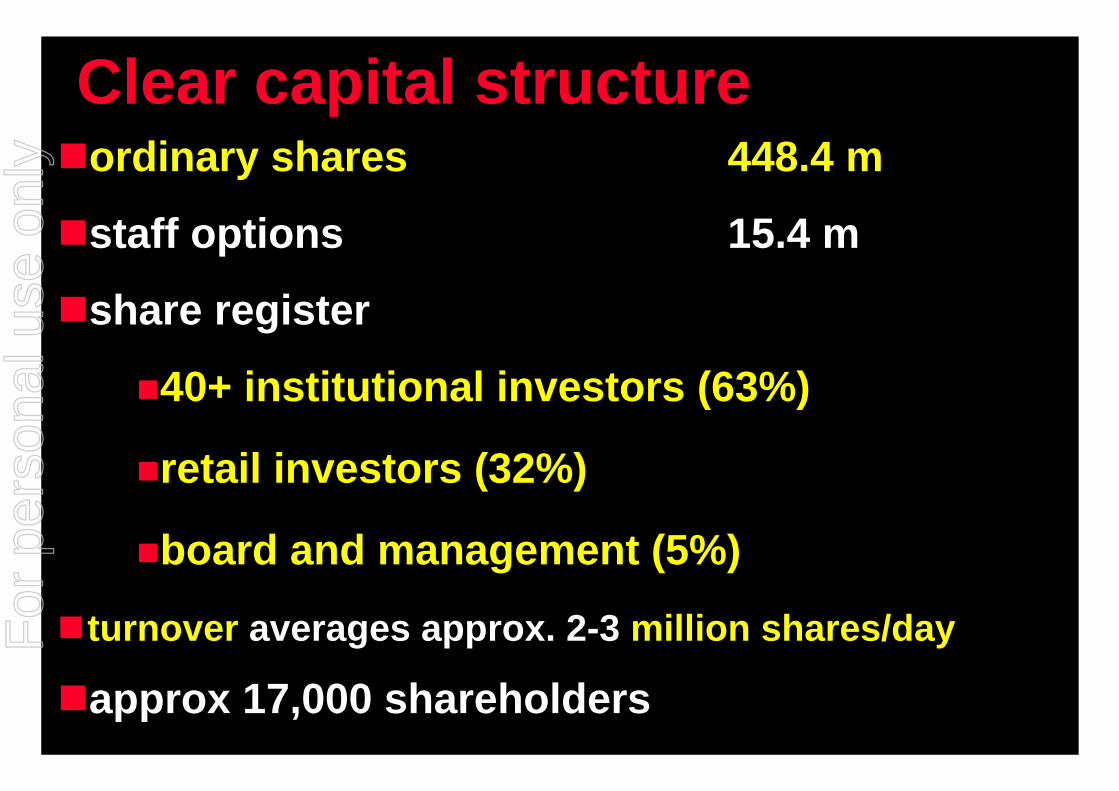
Clear capital structureordinary shares 448.4 m
staff options 15.4 m
share register
40+ institutional investors (63%)
retail investors (32%)
board and management (5%)
turnover averages approx. 2-3 million shares/day
approx 17,000 shareholders
For
per
sona
l use
onl
y

Bruce Wood Managing Director (32 years experience)
Leigh Brooks Exploration Manager (33 years)
Rick Frith Engineering & Prod Manager (33 years)
Neville Kelly CFO and Co. Sec (25 years)
Garry Marsden Corporate Development (25 years)
Ian Palmer NZ Development Manager (26 years)
Eric Matthews NZ Exploration Manager (33 years)
Elliot Yearsley Indonesian Country Manager (25 years)
Dennis Washer NZ Country Manager (28 years)
strong background in global oil & gas operations :-
exploration, development, production and acquisitions.
Experienced management teamF
or p
erso
nal u
se o
nly

...... but E&P is a global game. AWE will grow globally in the medium term, but this will be done with rigor & focus
To date AWE has grown with a strong Australasian focusF
or p
erso
nal u
se o
nly

10 years of growth
Since IPO: Grown business >50 fold; Increased share price >6 fold; 20% annualised TSR since listing
For
per
sona
l use
onl
y

2006-07
a year of delivery
For
per
sona
l use
onl
y
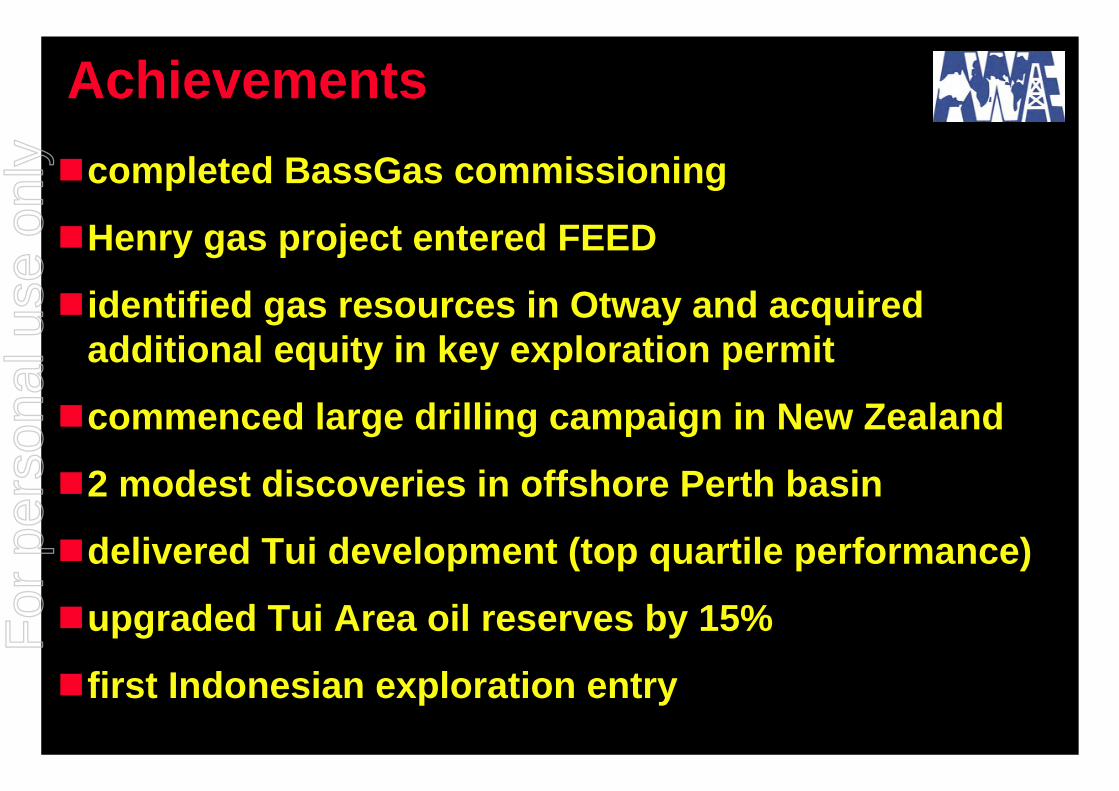
Achievementscompleted BassGas commissioning
Henry gas project entered FEED
identified gas resources in Otway and acquired additional equity in key exploration permit
commenced large drilling campaign in New Zealand
2 modest discoveries in offshore Perth basin
delivered Tui development (top quartile performance)
upgraded Tui Area oil reserves by 15%
first Indonesian exploration entry
For
per
sona
l use
onl
y
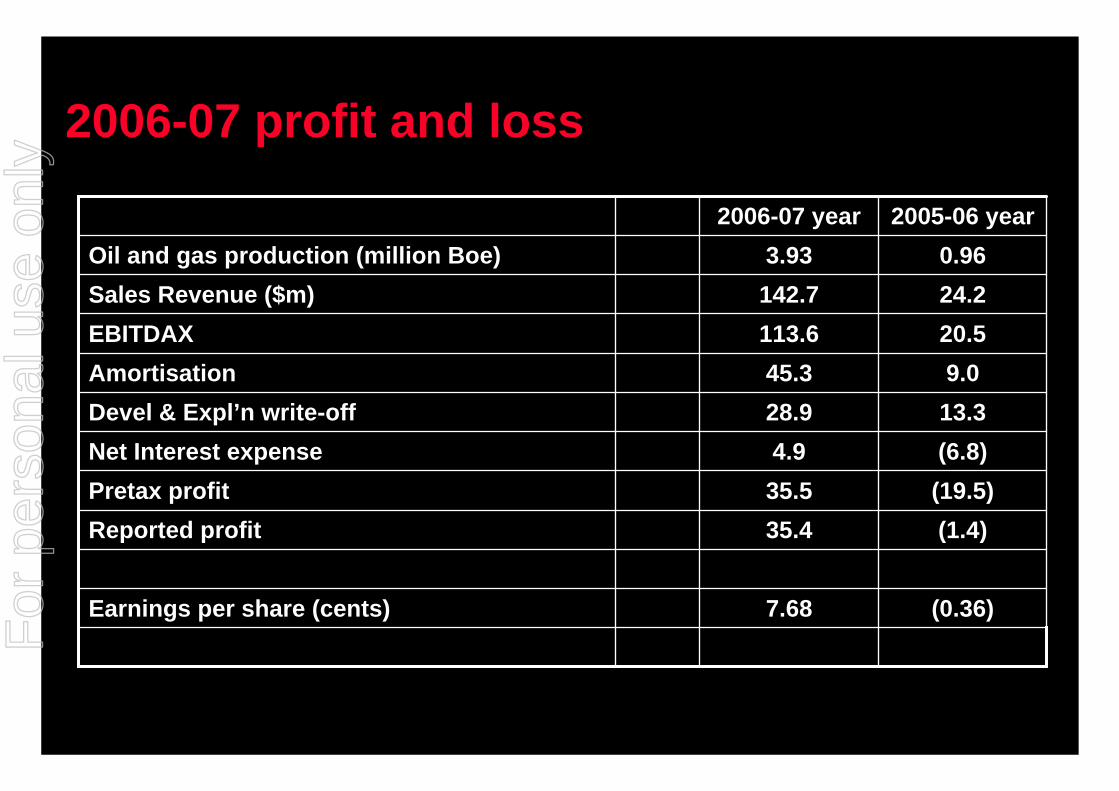
2006-07 profit and loss
(0.36)7.68Earnings per share (cents)
(1.4)35.4Reported profit(19.5)35.5Pretax profit(6.8)4.9Net Interest expense13.328.9Devel & Expl’n write-off9.045.3Amortisation
20.5113.6EBITDAX24.2142.7Sales Revenue ($m)0.963.93Oil and gas production (million Boe)
2005-06 year2006-07 year
For
per
sona
l use
onl
y

Production TargetF
or p
erso
nal u
se o
nly

Numbers may not add due to rounding
2006-07 net profit components
Numbers may not add due to rounding
For
per
sona
l use
onl
y

Numbers may not add due to rounding
2006-07 cash flow summary
Numbers may not add due to rounding
Numbers may not add due to rounding
For
per
sona
l use
onl
y

Cornerstoneprojects
For
per
sona
l use
onl
y

Yolla field performing at design capacity
2007/8 EBITDAX target A$35 million (WTI @ US$60/Bbl)
growth potential (Oil price; Reserve additions at Yolla; Trefoil field tie-in; Expl’n success)
Trefoil and Rockhopper/Gentoo projects under commercial studies
BassGas project (AWE 30%)F
or p
erso
nal u
se o
nly

BassGas Project (AWE 30%) F
or p
erso
nal u
se o
nly

Casino project (AWE 25%)
initial contract 96 TJ/day (additional 44 TJ/day contracted until Q3, 2007)
successful development and strong field performance
Henry Feed nearing completion
Casino 2007/8 EBITDAX target = A$29 million
Pecten East-1 and Netherby-1 planned for early 2008F
or p
erso
nal u
se o
nly

otway basin Vic P44 (AWE 25%)..excellent exploration
Henry 160 PJ
Casino 285 PJ
Pecten East
MarthaNetherby
For
per
sona
l use
onl
y

Perth Basin (AWE 27.5%)F
or p
erso
nal u
se o
nly
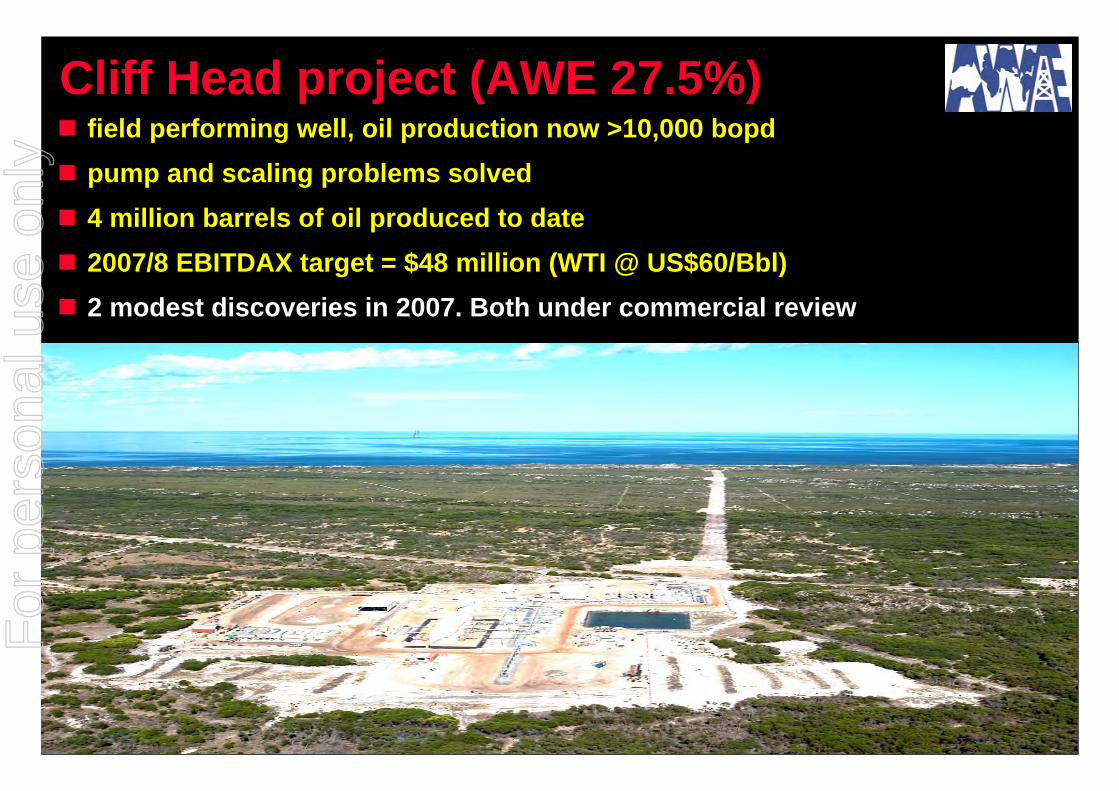
Cliff Head project (AWE 27.5%)field performing well, oil production now >10,000 bopdpump and scaling problems solved 4 million barrels of oil produced to date2007/8 EBITDAX target = $48 million (WTI @ US$60/Bbl)2 modest discoveries in 2007. Both under commercial review
For
per
sona
l use
onl
y

Tui Area oil project,
DELIVERED
20 months from FID to first oil
For
per
sona
l use
onl
y

AWE’s Taranaki Basin Acreage F
or p
erso
nal u
se o
nly
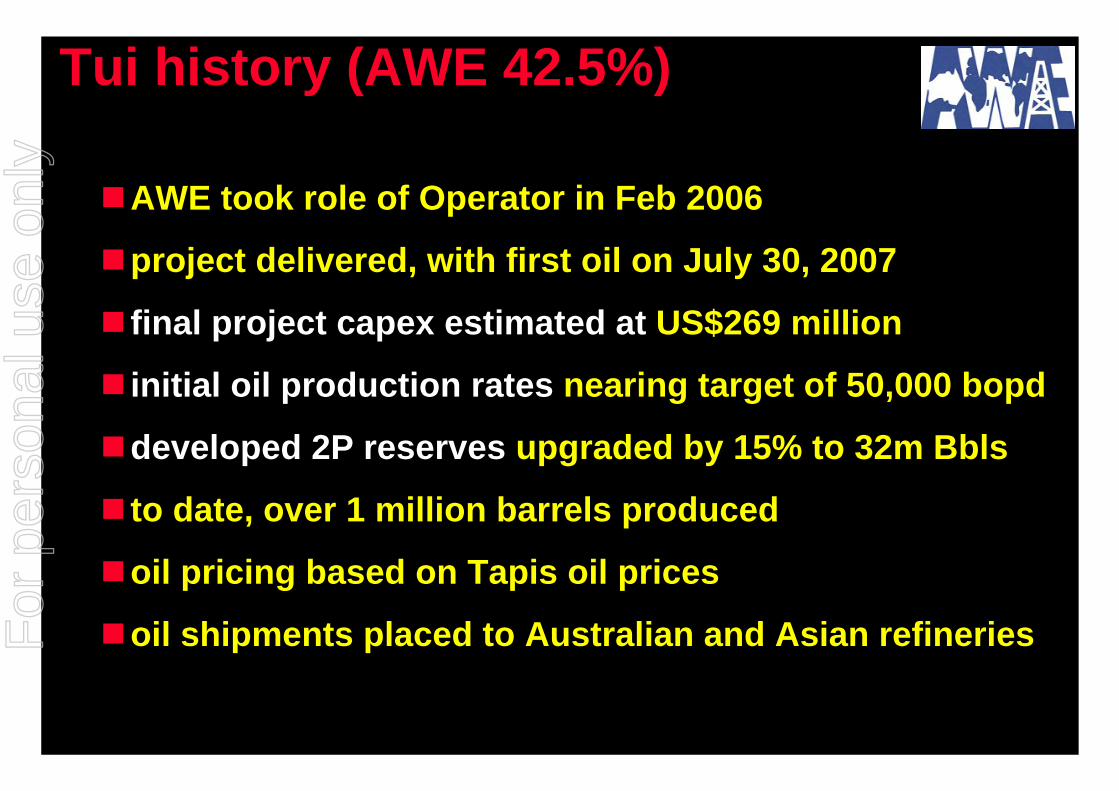
Tui history (AWE 42.5%)
AWE took role of Operator in Feb 2006
project delivered, with first oil on July 30, 2007
final project capex estimated at US$269 million
initial oil production rates nearing target of 50,000 bopd
developed 2P reserves upgraded by 15% to 32m Bbls
to date, over 1 million barrels produced
oil pricing based on Tapis oil prices
oil shipments placed to Australian and Asian refineriesFor
per
sona
l use
onl
y

Mid water arches
FPSO Umuroa
Sub sea well head and tree
Flowlines and Umbilicals
Mooring lines
Tui development
For
per
sona
l use
onl
y

FPSO in SingaporeF
or p
erso
nal u
se o
nly

Normand Installer vesselF
or p
erso
nal u
se o
nly

Installation of mid water arches F
or p
erso
nal u
se o
nly

FPSO in New PlymouthF
or p
erso
nal u
se o
nly

FPSO mooring at TuiF
or p
erso
nal u
se o
nly

First oil transfer from FPSO to AkamaF
or p
erso
nal u
se o
nly

Akama discharging in SydneyF
or p
erso
nal u
se o
nly
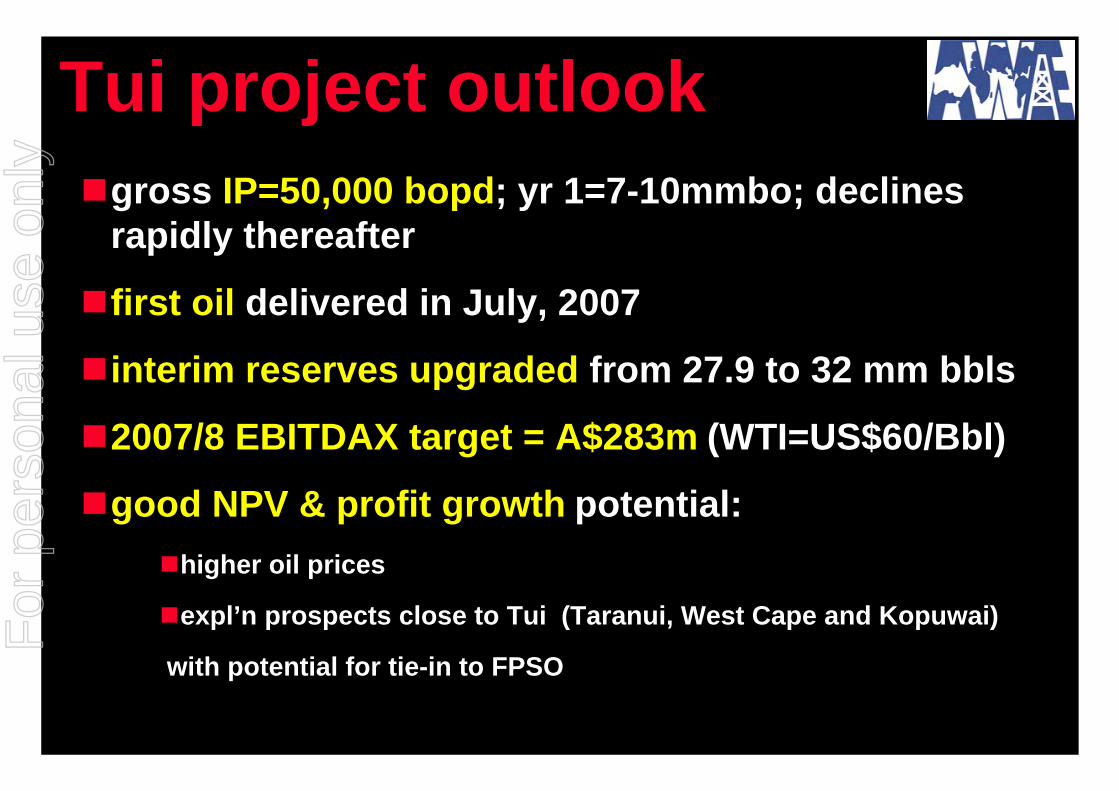
Tui project outlookgross IP=50,000 bopd; yr 1=7-10mmbo; declines rapidly thereafter
first oil delivered in July, 2007
interim reserves upgraded from 27.9 to 32 mm bbls
2007/8 EBITDAX target = A$283m (WTI=US$60/Bbl)
good NPV & profit growth potential:higher oil prices
expl’n prospects close to Tui (Taranui, West Cape and Kopuwai)
with potential for tie-in to FPSO
For
per
sona
l use
onl
y

How we do itretain the best people
provide a great work environment
stay nimble (no paralysis by analysis)
AWE as the JV partner of choice
team focus with single point accountability
positive board and management interaction
transparent communications with shareholders & broader community e.g. unaudited resultsF
or p
erso
nal u
se o
nly
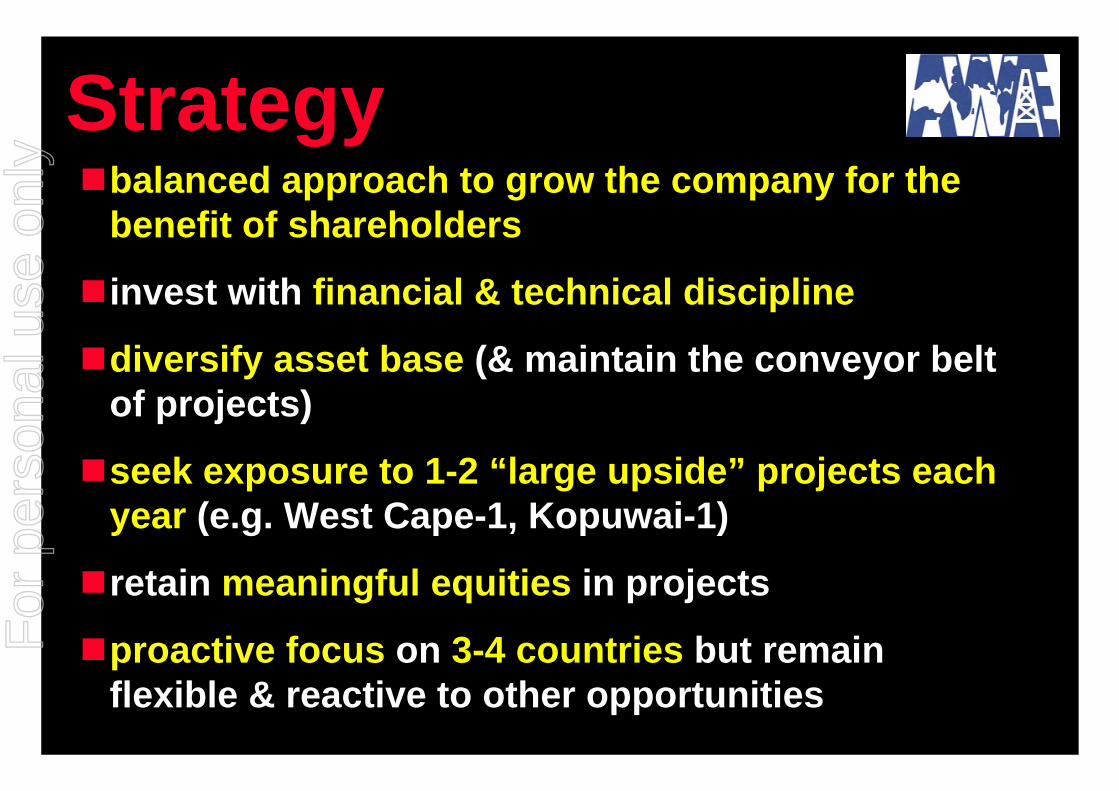
Strategybalanced approach to grow the company for the benefit of shareholders
invest with financial & technical discipline
diversify asset base (& maintain the conveyor belt of projects)
seek exposure to 1-2 “large upside” projects each year (e.g. West Cape-1, Kopuwai-1)
retain meaningful equities in projects
proactive focus on 3-4 countries but remain flexible & reactive to other opportunities
For
per
sona
l use
onl
y

FutureOutlook
For
per
sona
l use
onl
y
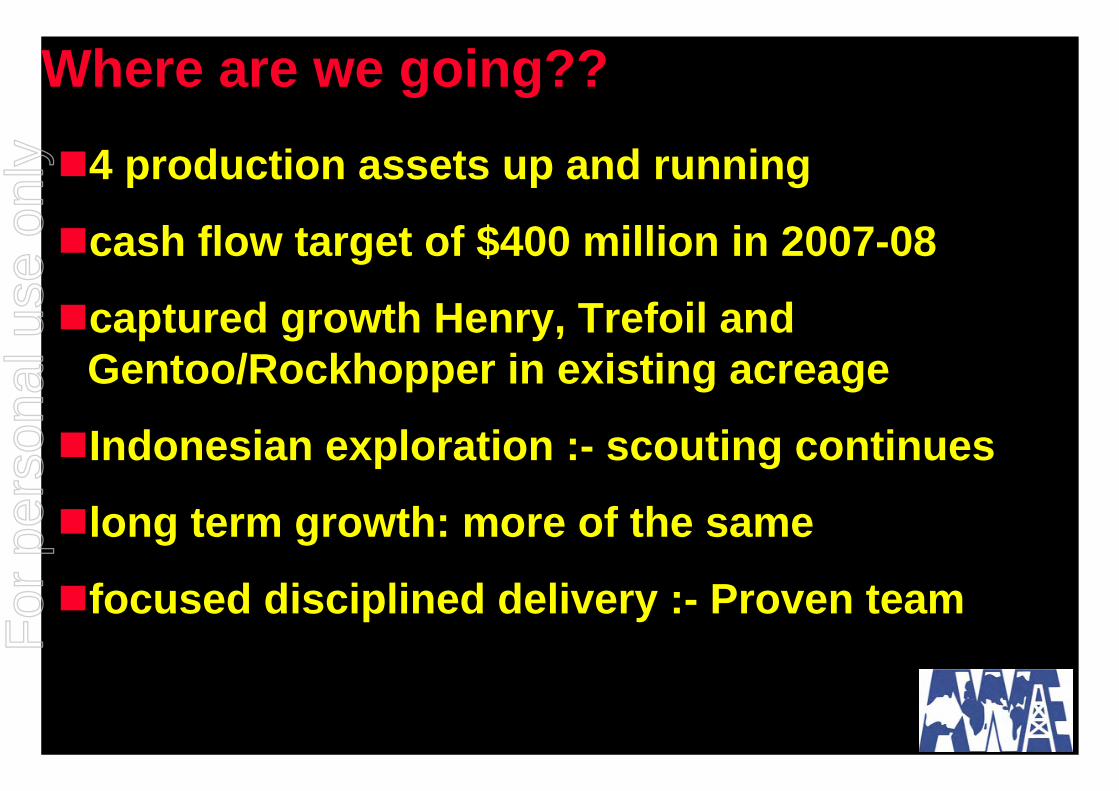
Where are we going??
4 production assets up and running
cash flow target of $400 million in 2007-08
captured growth Henry, Trefoil and Gentoo/Rockhopper in existing acreage
Indonesian exploration :- scouting continues
long term growth: more of the same
focused disciplined delivery :- Proven team
For
per
sona
l use
onl
y

ExplorationOutlook
For
per
sona
l use
onl
y

Prospect Permit Equity Size AWE Cost Timing
(%) (gross) (A$mm)
Taranui-1 PMP 38158 42.5 5-15 mmbo 8.0 currentLisah-1 Bulu PSC 42.5 7.0 Q3-07Lengo-1 Bulu PSC 42.5 7.0 Q3-07West Cape-1 PEP 38481 40.0 >100 mmbo 11.0 Q3-07Kopuwai-1 PEP38482 50.0 >100 mmbo nil Q4-07Henry-2 VIC/P 44 25.0 dev’t early 2008Netherby-1 VIC/P 44 25.0 110 bcf 4.5 early 2008Pecten East-1 VIC/P 44 25.0 160 bcf 4.5 early 2008
A$42m
Upcoming drilling programSeptember 2007
Forward exploration drilling cost is approx. 10cps, but exposing shareholders to dollars per share upside
AWE’s historical commercial success rate is >20%
For
per
sona
l use
onl
y

Good follow-up potential for large prospects (20 to >100 mmb oil)
Update on Taranaki explorationF
or p
erso
nal u
se o
nly

18 km
Tui area FieldsTaranui
Prospect
OiProspect
For
per
sona
l use
onl
y
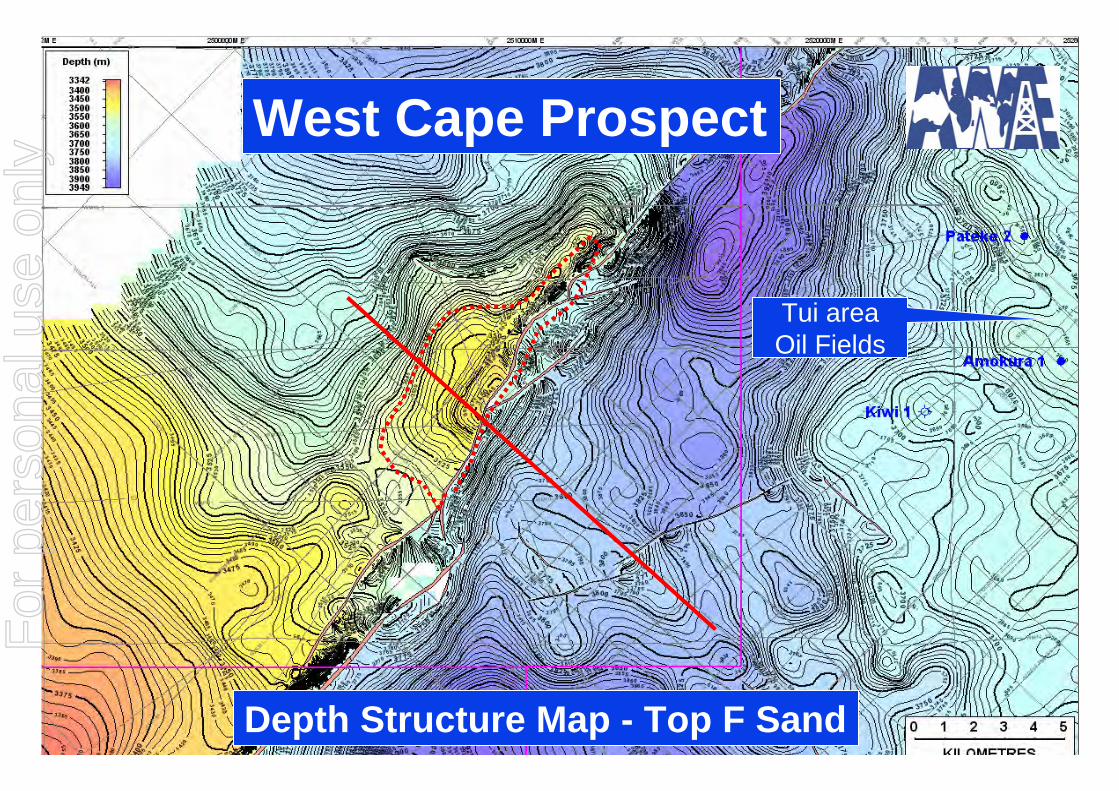
Depth Structure Map - Top F Sand
West Cape Prospect
Tui area Oil Fields
For
per
sona
l use
onl
y

F Sand
West Cape prospect – dip line3 km
For
per
sona
l use
onl
y

Indonesian area of explorationF
or p
erso
nal u
se o
nly

Netherby & Pecten East prospects, Otway basin (AWE 25%)
Henry 160 PJ
Casino 285 PJ
Pecten East
MarthaNetherby
For
per
sona
l use
onl
y
Targets
For
per
sona
l use
onl
y

Production growth targetF
or p
erso
nal u
se o
nly

Cashflow growth target
Long term cashflow target > $130 million per annum
For
per
sona
l use
onl
y
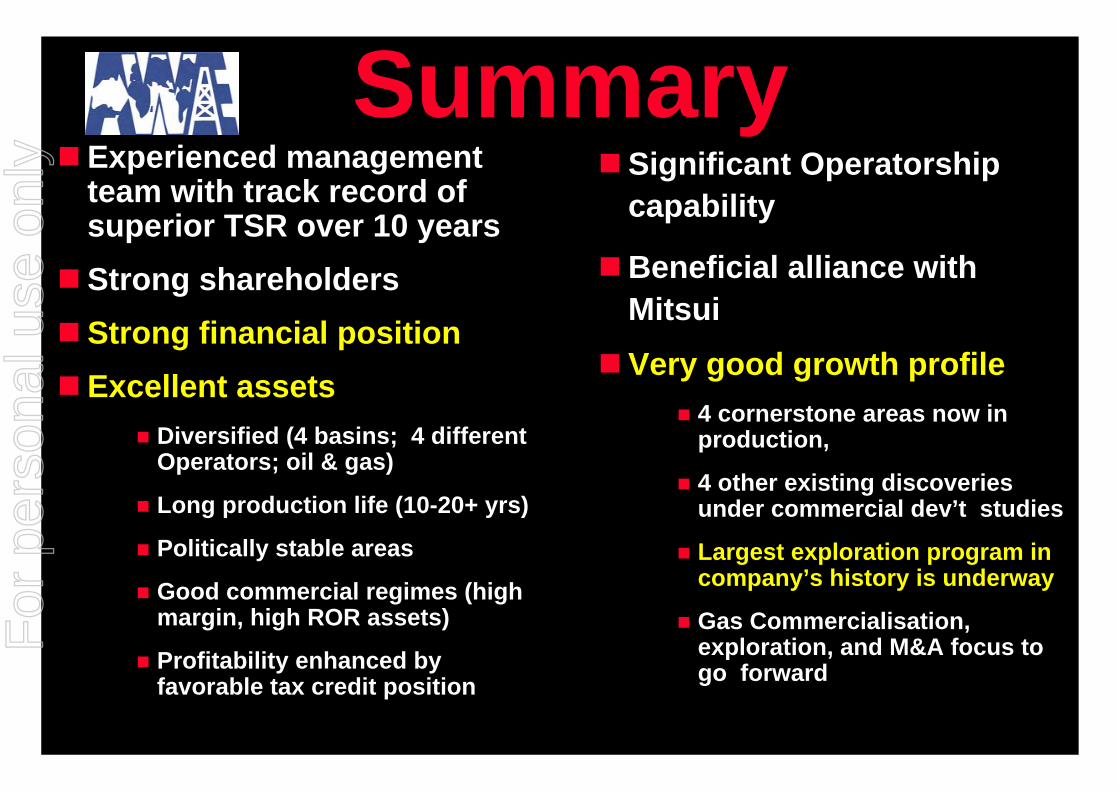
SummaryExperienced management team with track record of superior TSR over 10 yearsStrong shareholdersStrong financial positionExcellent assets
Diversified (4 basins; 4 different Operators; oil & gas)
Long production life (10-20+ yrs)
Politically stable areas
Good commercial regimes (high margin, high ROR assets)
Profitability enhanced by favorable tax credit position
Significant Operatorship capability
Beneficial alliance with MitsuiVery good growth profile
4 cornerstone areas now in production,
4 other existing discoveries under commercial dev’t studies
Largest exploration program in company’s history is underway
Gas Commercialisation, exploration, and M&A focus to go forward
For
per
sona
l use
onl
y

Disclaimer
This presentation may contain forward looking statements that are subject to risk factors associated with oil and gas businesses. It is believed that the expectations reflected in these statements arereasonable but they may be affected by a variety of variables and changes in underlying assumptions which could cause actual results or trends to differ materially, including but not limited to: price fluctuations, actual demand, currency fluctuations, drilling andproduction results, reserve estimates, loss of market, industry competition, environmental risks, physical risks, legislative, fiscal and regulatory developments, economic and financial market conditions in various countries and regions, political risks, project delay or advancement, approvals and cost estimates.
All references to dollars, cents or $ in this presentation are to Australian currency, unless otherwise stated.
For
per
sona
l use
onl
y

Australian Worldwide Exploration
www.awexp.com.au
August/September 2007
For
per
sona
l use
onl
y


