50
Susan Huang, MD MPH University of California Irvine School of Medicine Ed Septimus, MD Hospital Corporation of America for the ABATE Infection Trial Team 1
Susan Huang, MD MPHUniversity of California Irvine School of Medicine
Ed Septimus, MDHospital Corporation of America
for the ABATE Infection Trial Team
1

Disclosures
• Participating hospitals in this trial received contributed antiseptic product from Sage Products and Molnlycke
• Conducting other clinical studies in which participating hospitals and nursing homes receive contributed products from Sage Products, 3M, Xttrium, Clorox, and Medline
• Companies contributing product have no role in design, conduct, analysis, or publication
2
Funded by NIH

Disclosures
• Participating hospitals in this trial received contributed antiseptic product from Sage Products and Molnlycke
• Conducting other clinical studies in which participating hospitals and nursing homes receive contributed products from Sage Products, 3M, Xttrium, Clorox, and Medline
• Companies contributing product have no role in design, conduct, analysis, or publication
3
Funded by NIH
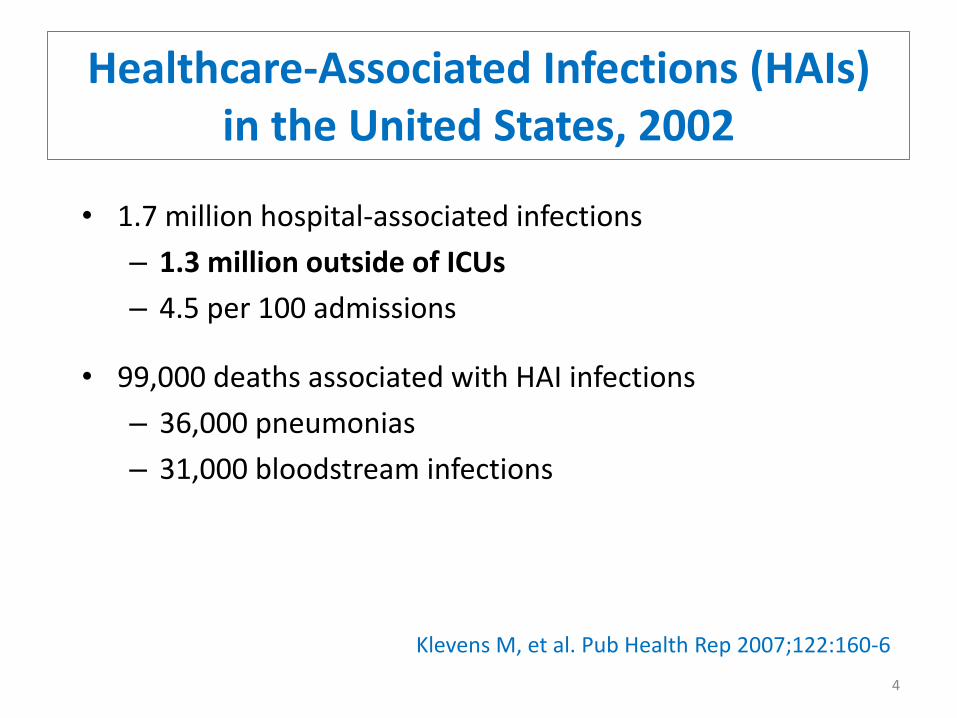
Healthcare-Associated Infections (HAIs)in the United States, 2002
• 1.7 million hospital-associated infections
– 1.3 million outside of ICUs
– 4.5 per 100 admissions
• 99,000 deaths associated with HAI infections
– 36,000 pneumonias
– 31,000 bloodstream infections
Klevens M, et al. Pub Health Rep 2007;122:160-6
4
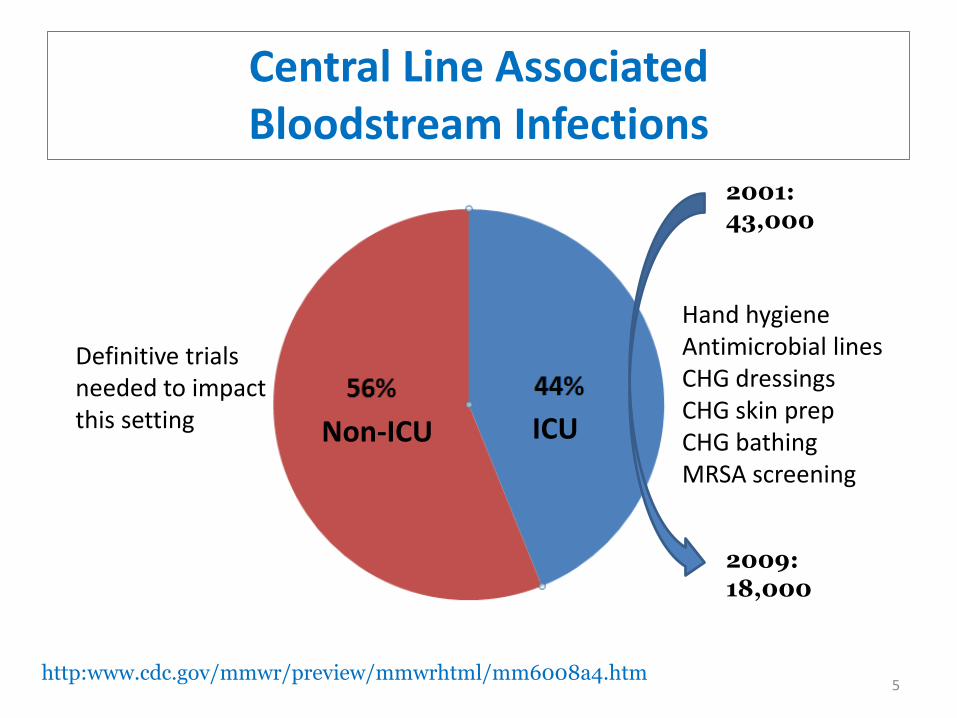
ICUNon-ICU
2001:43,000
2009:18,000
Hand hygieneAntimicrobial linesCHG dressingsCHG skin prepCHG bathingMRSA screening
http:www.cdc.gov/mmwr/preview/mmwrhtml/mm6008a4.htm
Definitive trialsneeded to impactthis setting
Central Line AssociatedBloodstream Infections
5
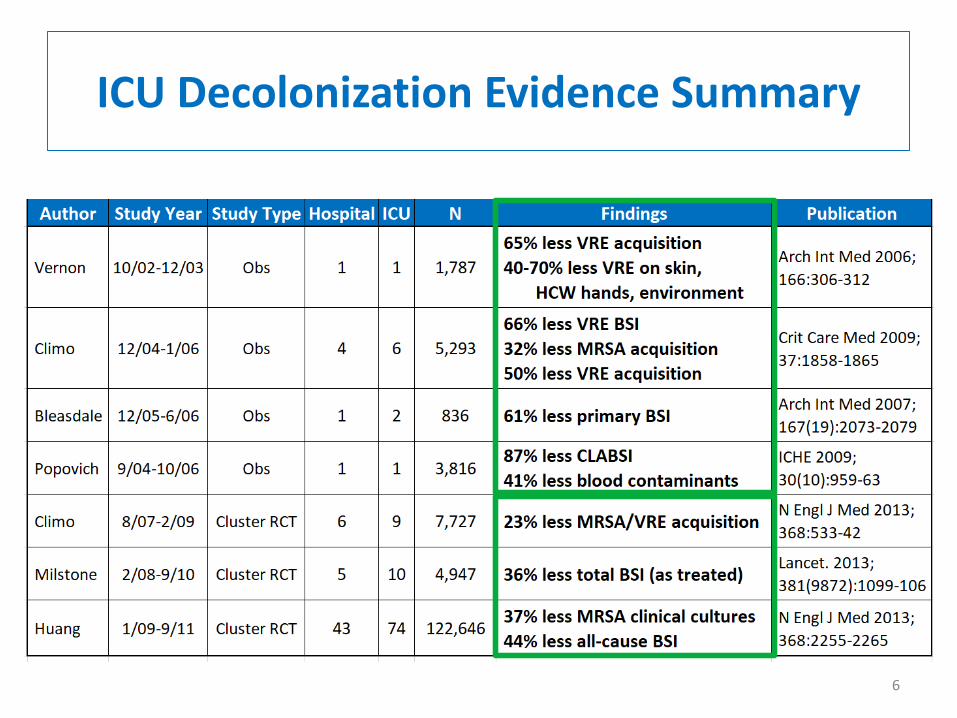
ICU Decolonization Evidence Summary
6
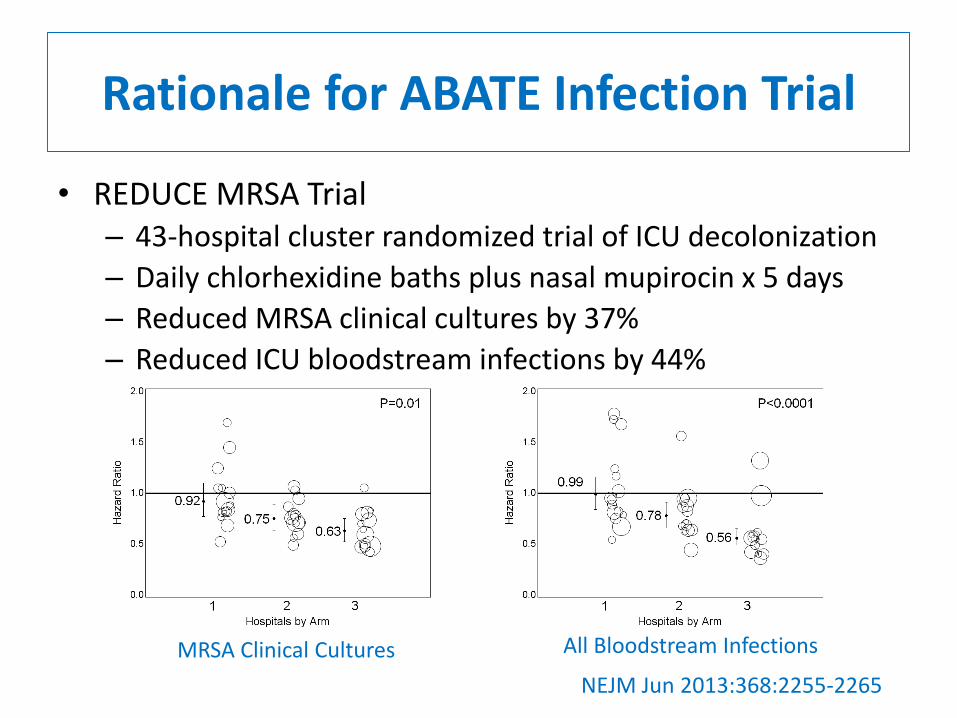
NEJM Jun 2013:368:2255-2265
Rationale for ABATE Infection Trial
• REDUCE MRSA Trial– 43-hospital cluster randomized trial of ICU decolonization
– Daily chlorhexidine baths plus nasal mupirocin x 5 days
– Reduced MRSA clinical cultures by 37%
– Reduced ICU bloodstream infections by 44%
MRSA Clinical Cultures All Bloodstream Infections

8
• What about outside of ICUs?
– 1.3 of 1.7 million HAIs
• Study at Rhode Island Hospital
– 14,801 patients in 4 general medical units
– Daily chlorhexidine (CHG) bathing
– 64% reduction in MRSA, VRE infections
– Evidence of decolonization impact outside of the ICU
Kassakian et al. ICHE 2011;32(3):238-43
Rationale for ABATE Infection Trial

Trial Design
Cluster randomized trial with Hospital Corporation of America
53 HCA hospitals, 194 adult non critical care units
Includes: adult medical, surgical, step down, oncology
Excludes: rehab, psych, peri-partum, BMT
Arm 1: Routine Care
Routine policy for showering/bathing
Arm 2: Decolonization
Daily 4% rinse off CHG shower or 2% leave-on CHG bed bath
Mupirocin x 5 days if MRSA+ by history, culture, or screen9
ABATE Infection ProjectActive Bathing to Eliminate Infection

Baseline and Intervention Periods
10
Mar 2013 Apr 2014 Jun 2014 Feb 2016
Baseline 12 months
Phase-in Intervention21 months

Outcomes
• Primary Outcome
– Any MRSA or VRE isolate attributed to unit
• Key Secondary Outcome
– Any bloodstream isolate attributed to unit
Outcomes defined by:
• Microbiology results alone
• > 2d after unit admit through 2d after unit discharge
• Skin commensals require 2 positive blood cultures
Clinicaltrials.gov: NCT0206386711

26 Hospitals (90 units)
N = 156,887
Intervention: 339,904 patients
1,294,153 attributable patient days
Routine Care Decolonization
27 Hospitals (104 units)
N = 183,017
24 Hospitals(88 units)
N = 152,596
24 Hospitals(98 units)
N = 177,076
3 Hospitals (6 units) withdraw
As Randomized
As Treated
2 Hospitals (2 units) withdraw
12
HCA Hospitals and Units

Number of Units 1-2
3-4
5-6
7-8
>8
Arm 1 Routine CareArm 2 Decolonization
ABATE Infection Trial
HCA Hospital Sites
13
• Research to impact usual care
• Implemented by quality improvement personnel
• No on-site investigators
– Coaching calls
– Monthly compliance feedback
• Based on daily nursing e-queries for CHG use
• Mupirocin medication administration
• Quarterly peer bathing observations
– Site visits for bathing training, and as needed
Implementation
14

# of Binders Shipped: 239
Implementation Toolkits
15
# of Clings Shipped (Arm 2):2,330 room clings; 1,149 shower clings

Arm 2 Huddle DocumentsCovering 14 Topics
Arm 2 Instructional Handouts Provided in English and Spanish
Instructional Handouts
16

Arm 2 – Training Video
17
Scenarios of ways to encourage patients to bathe
Special introduction and overview by Dr. Ed Septimus
and Dr. Susan Huang
Bathing demonstration using mannequin
Showering Instructions Overview
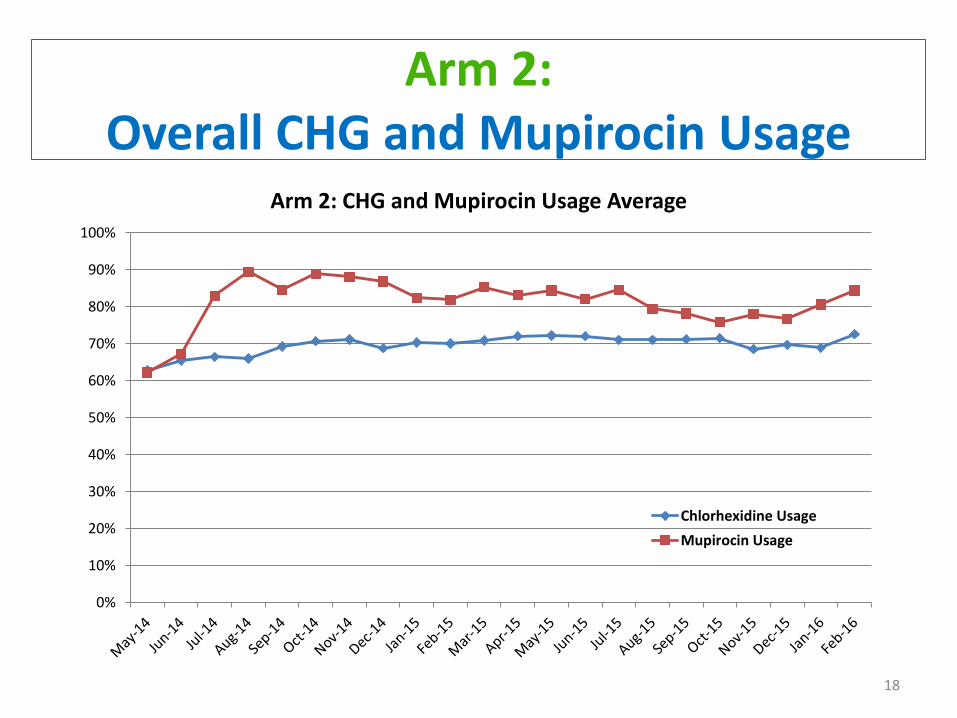
Arm 2: Overall CHG and Mupirocin Usage
18
0%
10%
20%
30%
40%
50%
60%
70%
80%
90%
100%
Arm 2: CHG and Mupirocin Usage Average
Chlorhexidine Usage
Mupirocin Usage

Arm 2 – Quarterly Staff and PatientCompliance Assessments
19# completed: 1,469 # completed: 1,251

• Main results are as-randomized, unadjusted
• Compared baseline to intervention rates across arms
– Proportional hazards models with shared frailties to account for clustering within hospital
– Success: significant difference across arms in change in baseline and intervention hazards
• Sensitivity Analyses
– As treated
– Adjusted (MRSA importation, LOS, comorbidities)
Analysis
20

Select Population Characteristics
21
Variable Routine Care Decolonization
Age (mean years) 62.3 62.6
Female 53.9% 54.8%
Comorbidity Score (Elixhauser) 2.8 2.9
Surgery (CDC) 20.9% 22.4%
Non-ICU Length-of-Stay (days) 5.7 5.7
Central Lines 9.1% 10.7%
MRSA History 1.4% 1.3%

MRSA & VRE Clinical Cultures
22
Arm 1 Arm 2Routine Care Decolonization
P = 0.16

MRSA & VRE Cultures Stratified
23
MRSA Clinical CulturesP=0.63
Arm 1 Arm 2Routine Care Decolonization
VRE Clinical CulturesP=0.01
Arm 1 Arm 2Routine Care Decolonization
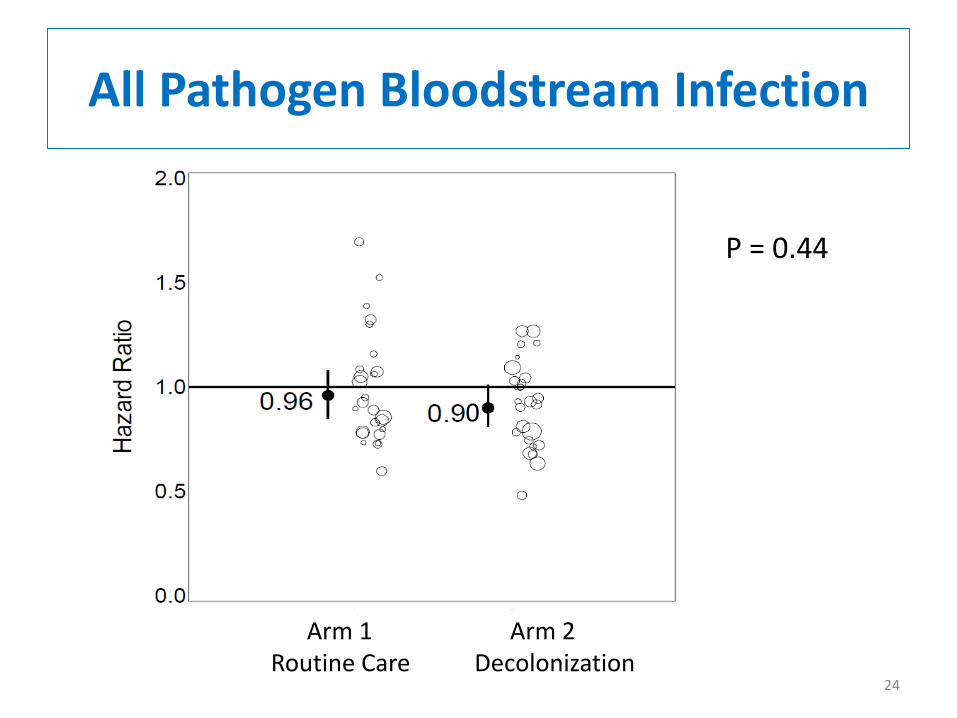
All Pathogen Bloodstream Infection
24
Arm 1 Arm 2Routine Care Decolonization
P = 0.44
0
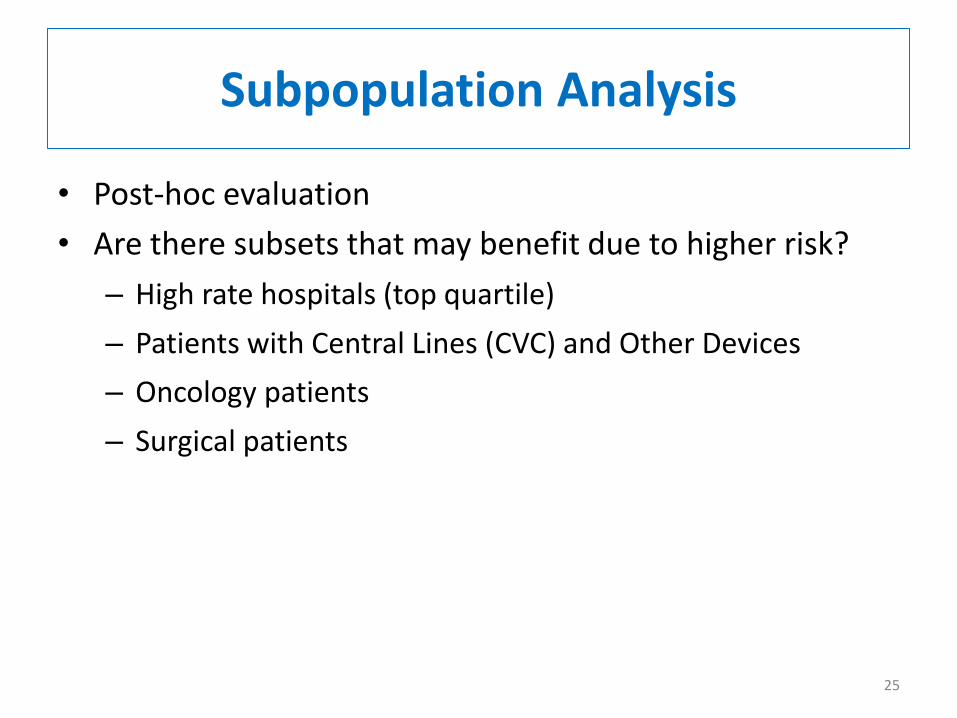
• Post-hoc evaluation
• Are there subsets that may benefit due to higher risk?
– High rate hospitals (top quartile)
– Patients with Central Lines (CVC) and Other Devices
– Oncology patients
– Surgical patients
Subpopulation Analysis
25
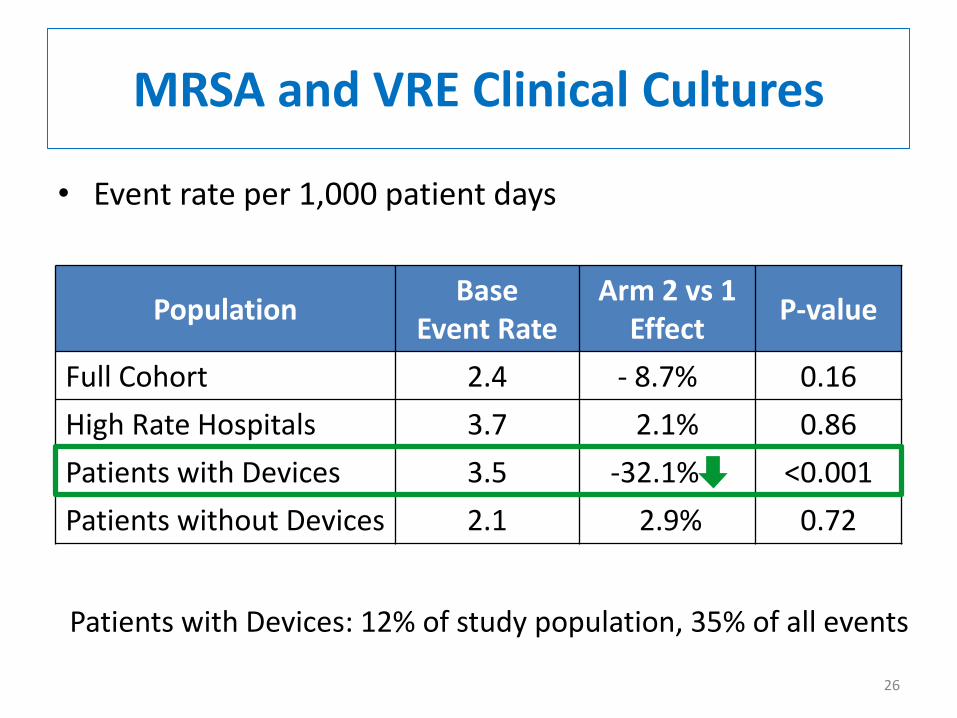
• Event rate per 1,000 patient days
MRSA and VRE Clinical Cultures
PopulationBase
Event Rate Arm 2 vs 1
EffectP-value
Full Cohort 2.4 - 8.7% 0.16
High Rate Hospitals 3.7 2.1% 0.86
Patients with Devices 3.5 -32.1% <0.001
Patients without Devices 2.1 2.9% 0.72
Patients with Devices: 12% of study population, 35% of all events
26

• Event rate per 1,000 patient days
MRSA and VRE Clinical Cultures
PopulationBase
Event Rate Arm 2 vs 1
EffectP-value
Full Cohort 2.4 - 8.7% 0.16
High Rate Hospitals 3.7 2.1% 0.86
Patients with CVCs 3.5 - 32.0% <0.001
Patients without CVCs 2.1 4.2% 0.60
Patients with CVCs: 11% of study population, 34% of all events
27
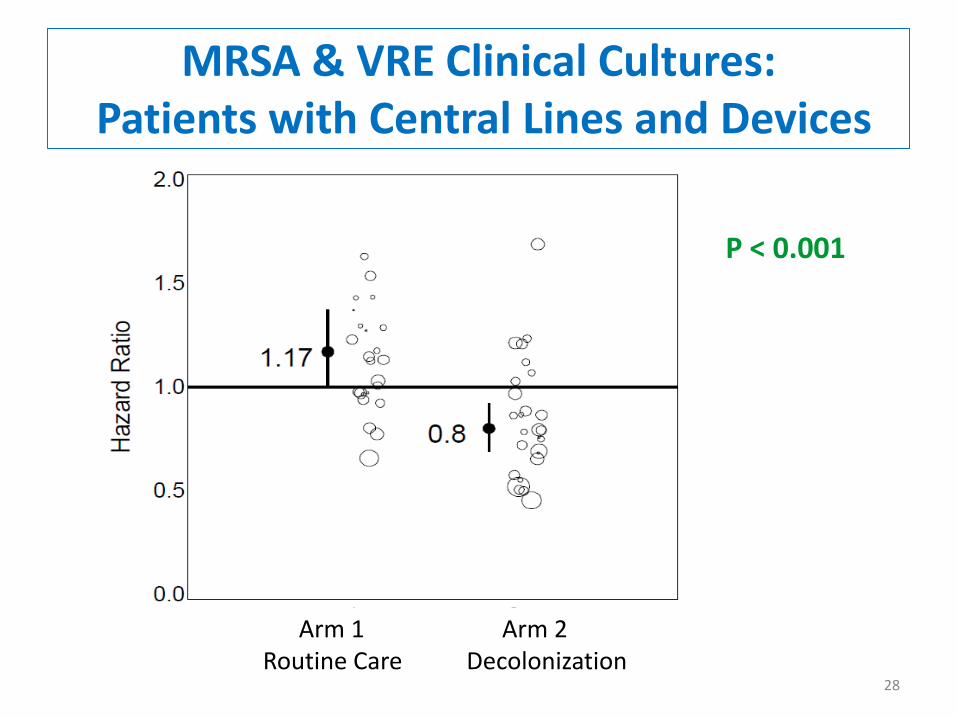
MRSA & VRE Clinical Cultures: Patients with Central Lines and Devices
28
Arm 1 Arm 2Routine Care Decolonization
P < 0.001
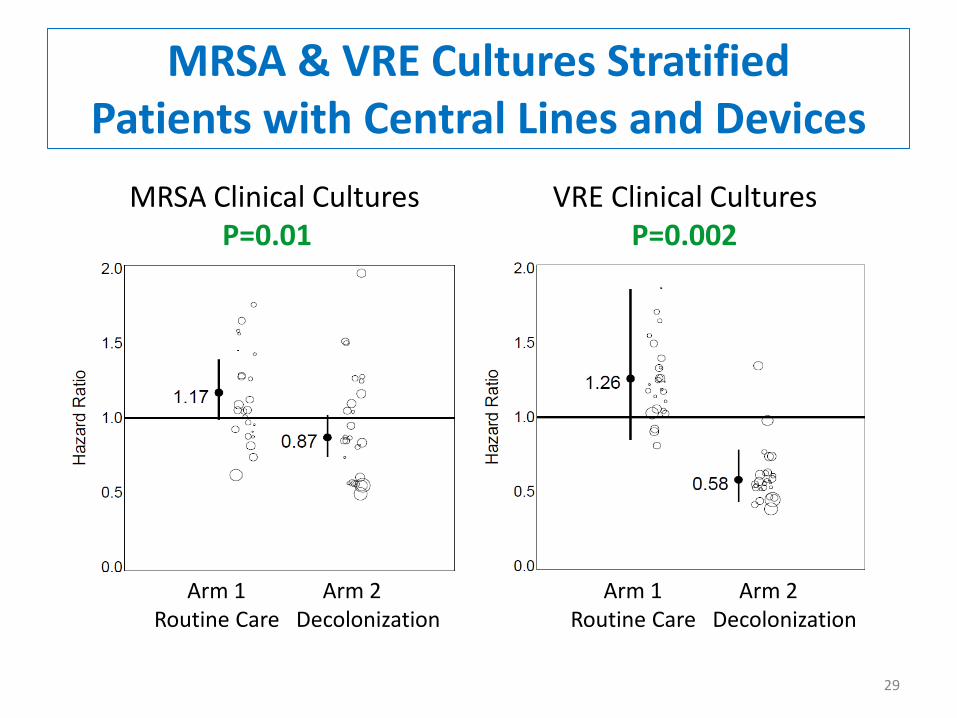
MRSA & VRE Cultures StratifiedPatients with Central Lines and Devices
29
MRSA Clinical CulturesP=0.01
Arm 1 Arm 2Routine Care Decolonization
VRE Clinical CulturesP=0.002
Arm 1 Arm 2Routine Care Decolonization

MRSA & VRE Clinical Cultures: Patients with Central Lines
30
Arm 1 Arm 2Routine Care Decolonization
P < 0.001

MRSA & VRE Cultures StratifiedPatients with Central Lines
31
MRSA Clinical CulturesP=0.02
Arm 1 Arm 2Routine Care Decolonization
VRE Clinical CulturesP=0.001
Arm 1 Arm 2Routine Care Decolonization
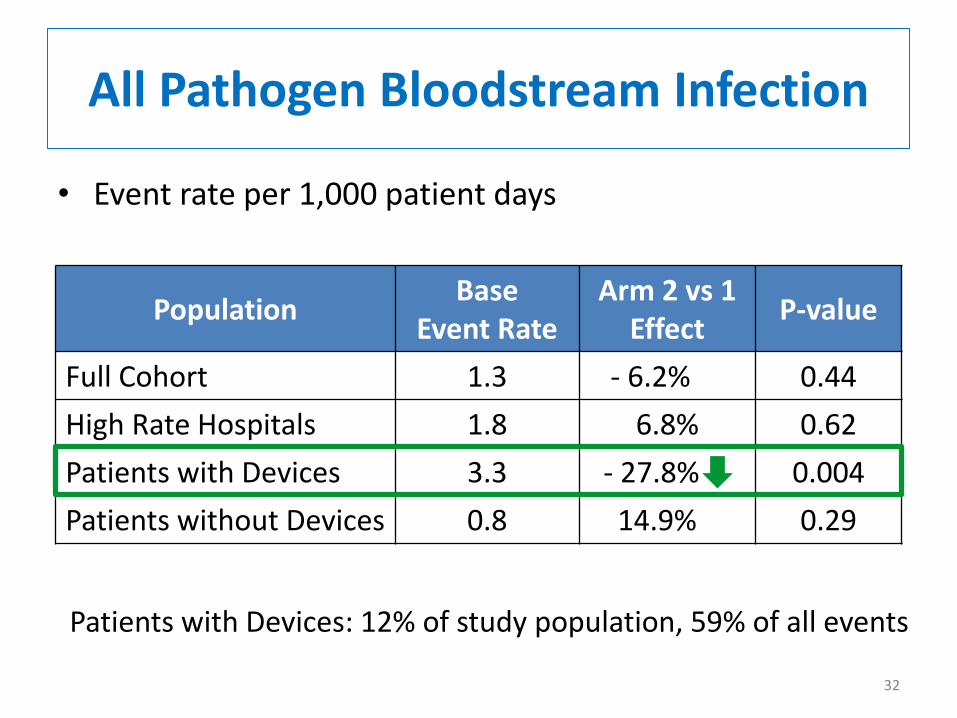
• Event rate per 1,000 patient days
PopulationBase
Event Rate Arm 2 vs 1
EffectP-value
Full Cohort 1.3 - 6.2% 0.44
High Rate Hospitals 1.8 6.8% 0.62
Patients with Devices 3.3 - 27.8% 0.004
Patients without Devices 0.8 14.9% 0.29
All Pathogen Bloodstream Infection
Patients with Devices: 12% of study population, 59% of all events
32

• Event rate per 1,000 patient days
PopulationBase
Event Rate Arm 2 vs 1
EffectP-value
Full Cohort 1.3 - 6.2% 0.44
High Rate Hospitals 1.8 6.8% 0.62
Patients with CVCs 3.3 - 26.9% 0.005
Patients without CVCs 0.8 17.0% 0.22
All Pathogen Bloodstream Infection
Patients with Devices: 11% of study population, 58% of all events
33

All Pathogen Bloodstream Infection: Patients with Lines and Devices
34
Arm 1 Arm 2Routine Care Decolonization
P = 0.004

All Pathogen Bloodstream Infection: Patients with CVC
35
P = 0.005
Arm 1 Arm 2Routine Care Decolonization
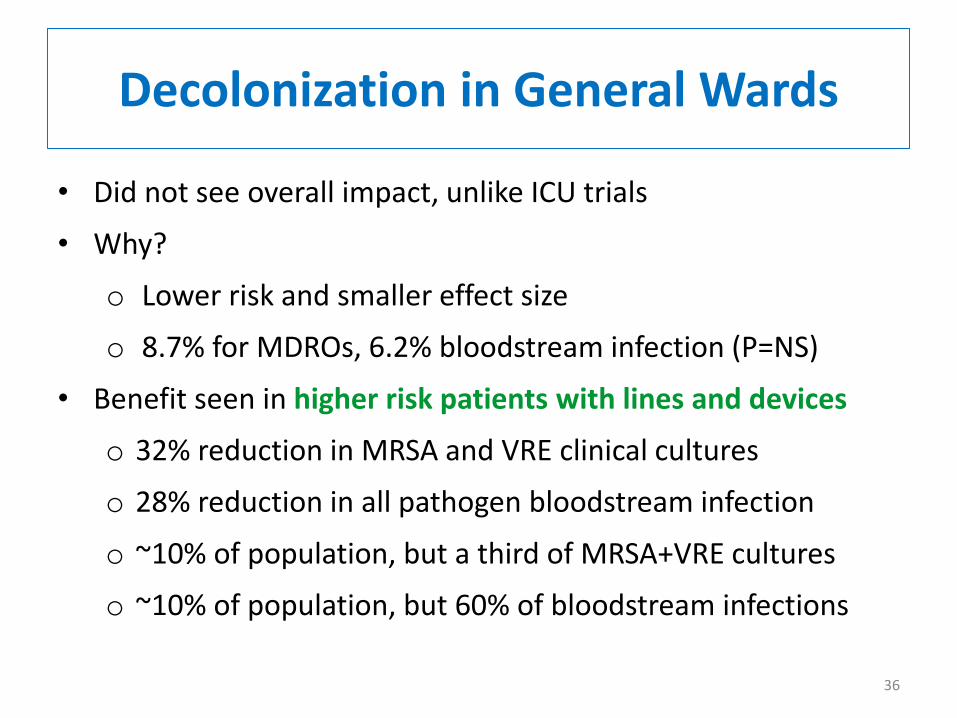
• Did not see overall impact, unlike ICU trials
• Why?
o Lower risk and smaller effect size
o 8.7% for MDROs, 6.2% bloodstream infection (P=NS)
• Benefit seen in higher risk patients with lines and devices
o 32% reduction in MRSA and VRE clinical cultures
o 28% reduction in all pathogen bloodstream infection
o ~10% of population, but a third of MRSA+VRE cultures
o ~10% of population, but 60% of bloodstream infections
Decolonization in General Wards
36

• Community-based hospital trial
• May not translate to high risk centers
• Subset analyses are post hoc
• Cost-effectiveness analysis needed for device effect
• Assessment of resistance underway
Limitations
37

• Universal CHG bathing in general medical and surgical units with targeted mupirocin for MRSA carriers:
– Did not reduce overall MDRO or BSI
– Reduced MRSA and VRE by 32% and all-cause bloodstream infections by 28% in patients with central lines and devices
• Recommendation
– Use CHG daily bathing for all inpatients with devices and central lines and provide additional nasal decolonization if they are MRSA carriers
– Continue to use decolonization in ICU patients
Conclusions
38

Hospital Corporation of AmericaHospital Participants
Arm 1 Facilities
Cartersville Medical Center Lee’s Summit Medical Center Parkridge East Hospital
Coliseum Northside Hospital LewisGale Hospital-Alleghany Plaza Medical Center of Fort Worth
Colleton Medical Center Methodist Stone Oak Hospital Research Medical Center
Conroe Regional Medical Center North Suburban Medical Center South Bay Hospital
Corpus Christi Medical Center Northeast Methodist Hospital St. Petersburg General Hospital
Garden Park Medical Center Northside Hospital Summit Medical Center
Hendersonville Medical Center Osceola Regional Medical Center Sunrise Hospital and Medical Center
Henrico Doctors' Hospital Overland Park Regional Medical Center TriStar Horizon Medical Center
Kingwood Medical Center Palms West Hospital TriStar Horizon Medical Center
Arm 2 Facilities
Blake Medical Center Methodist Specialty & Transplant Hospital Reston Hospital Center
Chippenham Johnston Willis Medical Ctr Methodist Texsan Hospital Rio Grande Regional Hospital
Clear Lake Regional Medical Center MountainView Hospital-Las Vegas St. David's Medical Center
Eastside Medical Center North Hills Hospital Timpanogos Regional Hospital
John Randolph Medical Center Orange Park Medical Center TriStar Southern Hills Medical Center
Las Colinas Medical Center Parkland Medical Center Valley Regional Medical Center
Las Palmas Medical Center Parkridge Medical Center West Florida Hospital
Medical Center of Plano Portsmouth Regional Hospital West Hills Hospital & Medical Center
Methodist Hospital Regional Medical Center of Acadiana West Palm Hospital
Special Thanks
Susan Huang, MD MPHLauren Heim, MPHAdrijana Gombosev, MS
Mary Hayden, MDLena Portillo, MT(ASCP)Jalpa Patel Sarup, MT(ASCP)
John Jernigan, MD MS
Robert Weinstein, MD
Ed Septimus, MD Jonathan Perlin, MD PhDJulia Moody, MS SM Caren Spencer-Smith, MT(ASCP) MISJason Hickok, MBA RN Tyler Forehand, BS
Richard Platt, MD MS Micaela Coady, MSTaliser Avery, MS Michael Murphy, MSKatie Haffenreffer, BS Rebecca Kaganov, BALauren Shimelman, BA Julie Lankiewicz, MPH
Ken Kleinman, ScD
40

Next Steps for HCAImplementation

Clin Infect Dis 2016;63(2):172–7
Generating and adapting to new evidence of effective care is the hallmark of learning health care systems

• One of the most consistent findings from clinical and health services research is the failure to translate research into practice and policy.1
• Improving population health outcomes relies on implementation of findings from clinical and health services research.2
1. Grimshaw et al. Implementation Science. 201;7:50. 2.Evans et al. Implementation Science. 2013;8:17. 3. Balas EA, Yearbook of Medical Informatics 2000;65-70.
5 2010
Research
Clinical
Practic
e
15
Technological
Innovations
Health Services
Years Since Introduction of Innovation3a
A Gap Between Evidence and Practice
It takes an average of 17 years for research to reach clinical practice3
aFor illustrative purposes only based on data from Balas EA.

Time Line: Rapid Adoption REDUCE Infection Trial
Jan 2011 Jan 2013 Jul 2013 Feb 2014
Baseline(Pre)
Ramp-up Full Implementation(Post)
137 ICUs from 96 hospitals
Presented ID Week
PublishedN Engl J Med
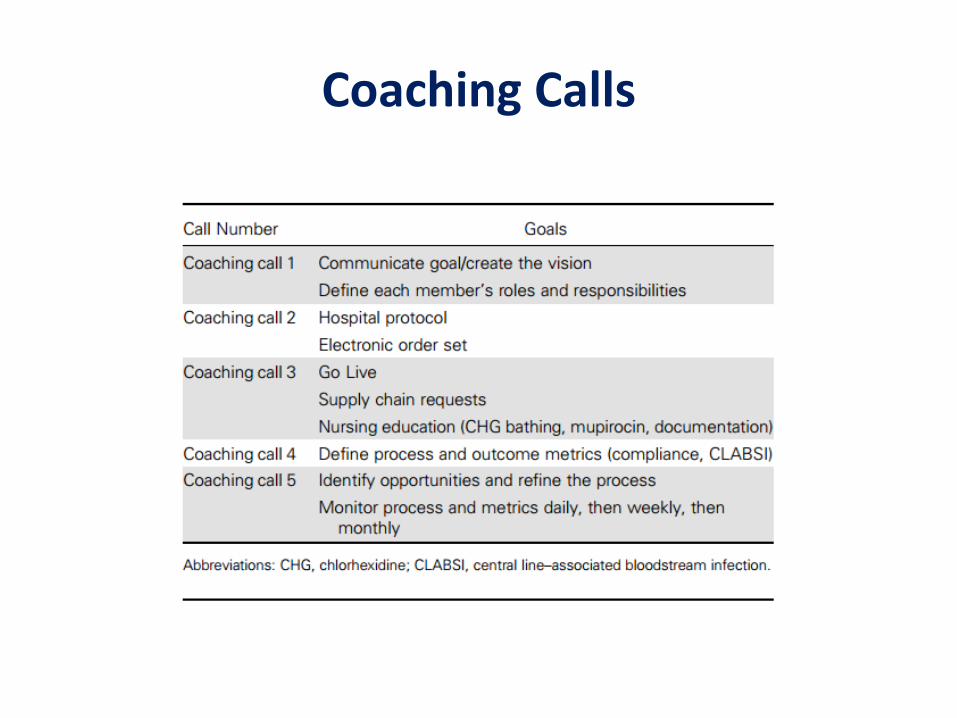
Coaching Calls

Significant Reduction of CLABSI in HCA Adult ICUs
Source: National Healthcare Safety Network (NHSN)
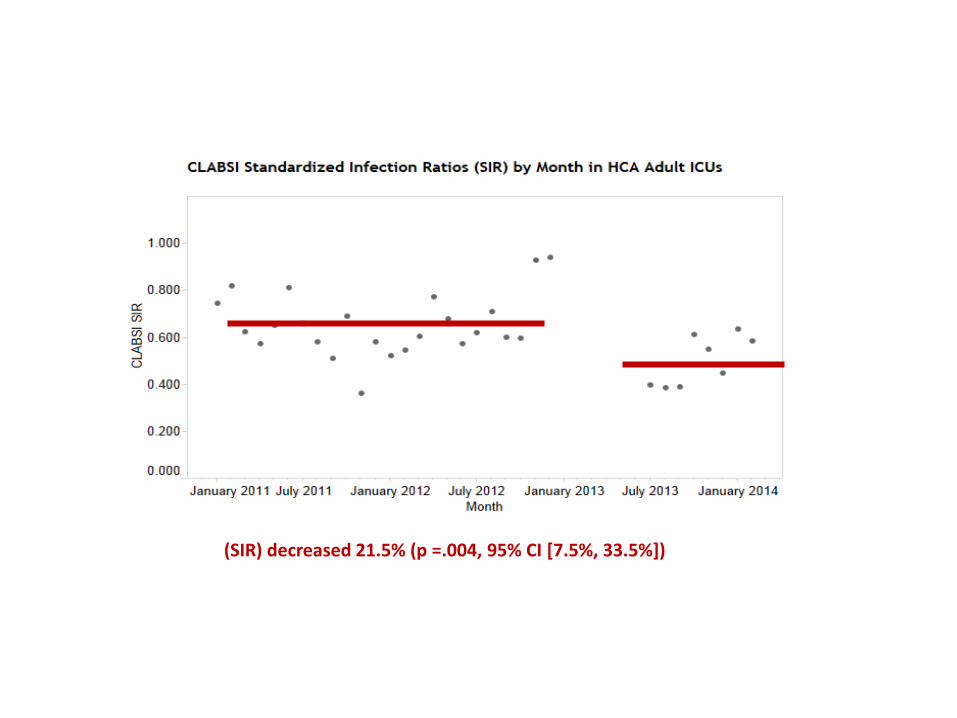
(SIR) decreased 21.5% (p =.004, 95% CI [7.5%, 33.5%])

Rate of central line–associated bloodstream infections (CLABSIs) per 1000 central line–days pre-
and post implementation, stratified by pathogen type.

ABATE Implementation• October to December 2017:
– Planning and implementation will be coordinated by corporate infection prevention(IP) team
– Create toolkit with implementation guidance and materials including detailed decolonization protocols and training including a skills assessment guide and computer based training
– Develop sample policies, order sets, and procedures for all noncritical care patients with devices and central lines
– Begin work with IT to help identify patients with central lines
– Create Nursing data portal, Tableau and NPR reports for CHG and mupirocin compliance
– Work with supply chain to begin process of ordering supplies (mupirocin, warmers, CHG cloths and CHG liquid with mesh sponges)

• January 2018 First coaching call #1– Discuss rationale and science around decolonization for patients with
central lines and devices– Develop a team locally with a physician champion(s), nurse
champion(s), representative from, senior leadership, IP, supply chain-define roles and responsibilities
– Introduce toolkit, computer based training, and video– Nursing education to include CHG bathing and mupirocin application
• February 2018 Coaching call #2– How to implement hospital protocol and order sets– Physician education– Define process and outcome measures (e.g. compliance and CLABSIs)– Remove products that are not CHG compatible
• March 2018 Coaching call #3– Ramp up to go live (will take 3-4 months)– Identity implementation opportunities and feedback using Tableaux and
NPR reports
ABATE Implementation
![[jennifer abate]_visual Order](https://static.documents.pub/doc/80x56/568befc01a28ab89338d4326/jennifer-abatevisual-order.jpg)


