41
RESULTS PRESENTATION for the interim period 30 June 2018

RESULTS PRESENTATION
for the interim period 30 June 2018

2
DISCLAIMER
Certain statements in this document may constitute ’forward looking statements’. Such forward looking statements reflect the company’s beliefs and expectations and involve known and unknown risks,uncertainties and other important factors that could cause the actual results, performance or achievements of Sun International Limited and its subsidiaries to be materially different from the future results, performance or achievements expressed or implied by such forward looking statements. Sun International Limited undertakes no obligation to update publicly or release any revisions to these forward looking statements to reflect events or circumstances after the date of this document, or to reflect the occurrence ofanticipated events. Past performance of Sun International Limited cannot be relied on as a guide to future performance. Forward-looking statements speak only as at the date of this document. You are cautioned not to place any undue reliance on such forward looking statements. No statement in this document is intended to be a profit forecast.
This document is being supplied to you for informational purposes only. This document is not a prospectus or an offer or invitation or inducement to subscribe for or purchase any securities, and nothing contained herein shall form the basis of any contract or commitment whatsoever. This document does not constitute a recommendation regarding the securities of Sun International Limited.
No representation or warranty, express or implied, is given by Sun International Limited, its subsidiaries or any of their respective directors, prescribed officers,
employees and affiliates or any other person as to thefairness, accuracy or completeness of the information (including data obtained from external sources) or opinions contained in this document, nor have they independently verified such information, and any reliance you place thereon will be at your sole risk. Without prejudice to the foregoing, no liability whatsoever for any loss howsoever arising, directly or indirectly, from any use of information contained in this document, or otherwise arising in connection therewith is accepted by any such person in relation to such information. None of the data in this document has been reviewed or reported on by the group’s auditors and no guarantee or warranty as to the data’s accuracy, expressed or implied, is given.

3
INCOME
4% up toR7.9 billion
EBITDA
6% up toR2.0 billion
ADJUSTEDDILUTEDHEPS
47% down to105 centsper share

4
Overview
SOUTH AFRICA LATAM
Despite these challenges, our business proved its resilience and we remain cash generative and can adapt to the ever-changing environment
Trading in Chile remained subdued while Peru performed well• Monticello income up 6% and EBITDA up 10%• The Peruvian operations (excluding Thunderbird) increased
income by 13% and EBITDA by 67%
Concluded the acquisition of 20% minority interest in Sun Dreams• Approximately 10% acquired by Sun Dreams, thereby
increasing interest to 65%• Funding for acquisition raised in Sun Dreams
Completed the acquisition of Thunderbird Resorts in April 2018• Trading to date in line with expectations although slightly
behind as at 30 June 2018
Ocean Sun Casino in Panama still making a small loss, Sun Nao Casino in Colombia closed and outstanding lease settled at US$1.5 million, US$2.3 million below provision
Outcome of municipal licence bidding process announced in June 2018• Sun Dreams only successful in 1 of 5 bids• Our view is that Enjoy overpaid
Trading in the first half of the year remained challenging• Continued pressure on disposable income• VAT increase • A deteriorating economic climate
Comparable income up only 1% with EBITDA in line with the prior year• Gaming income up 2%• Rooms revenue down 2%
Time Square has experienced an increase in activity• Income for the comparable period is only marginally up
on the prior corresponding period• Recent trading encouraging with July and August gaming
income up by 32% and 33% respectively
Applications submitted for the restructure of the Boardwalk and Carousel operations
The capital raise of R1.6 billion completed in early June 2018
STRATEGIC OBJECTIVES

STRATEGIC OBJECTIVES
6
• Increased focus on service and customer engagement• MVG loyalty programme
• Further training of staff required• Issues with power loyalty devices to be resolved• Acceptance of leisure points improving
• Centralised marketing• Communication improved• Stay and play offers only made were appropriate• Decentralised VIP management back to properties
• SunBet went live with its new Adobe website using the Bede and Kambi platform in June 2018 prior to the Fifa World Cup
• Insourced design team to improve marketing and property collateral and reduce costs
• Refurbishments at properties• The Sibaya Privé and food and beverage • Palace and Cascades
• Major plant and equipment assessed to improve planning
• Service culture embedded in the SunWay culture programme
IMPROVE GUEST EXPERIENCE
Our customers are at the heart
of all we do
7
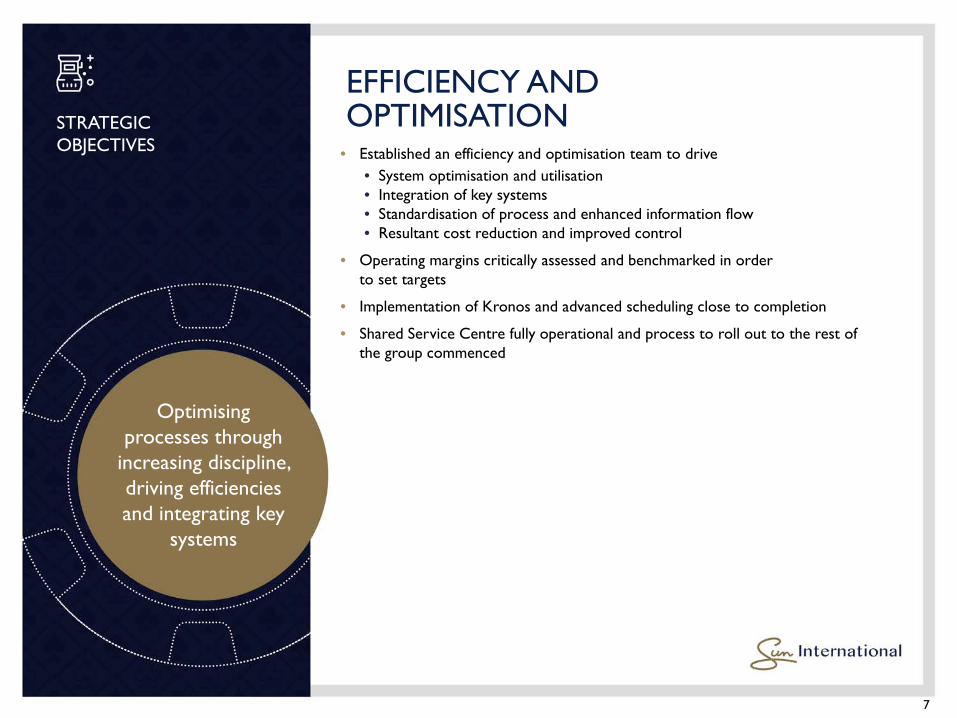
Optimising processes through
increasing discipline, driving efficiencies and integrating key
systems
STRATEGIC OBJECTIVES
EFFICIENCY AND OPTIMISATION
• Established an efficiency and optimisation team to drive• System optimisation and utilisation• Integration of key systems• Standardisation of process and enhanced information flow• Resultant cost reduction and improved control
• Operating margins critically assessed and benchmarked in order to set targets
• Implementation of Kronos and advanced scheduling close to completion
• Shared Service Centre fully operational and process to roll out to the rest of the group commenced

• SOUTH AFRICA• Comments submitted on draft Tobacco Bill• No developments with regards to the increase in Gauteng gaming taxes• Amended National Gambling Amendment Bill 2018 formally released to
Parliament– Includes amendments relating to EBTs– Role of gambling board CEO– Monitoring provisions– B-BBEE– Preparing comments through CASA
• Comments on Western Cape Relocation Bill submitted and stakeholders kept informed
• LA10 application for restructure of Boardwalk partially approved• Applied to the gambling board to restructure and reposition the Carousel• In discussions to renew The Table Bay lease: expires 2022• Wild Coast licence bid submission due on 28 October 2018
– Land claim close to being settled
• Proceeds of R75 million for Fish River land claim received
8
Challenging economic environment increases
pressure to contain costs and make tough
decisions
STRATEGIC OBJECTIVES
PROTECT AND LEVERAGE EXISTING ASSET PORTFOLIO

9
Challenging economic environment increases
pressure to contain costs and make tough decisions
STRATEGIC OBJECTIVES
PROTECT AND LEVERAGE EXISTING ASSET PORTFOLIO | cont.
• SOUTH AFRICA• Boardwalk Mall development progressing with key anchor tenants signed up• Carnival land development progressing with various approvals underway• Disposal of Sibaya excess land for R45 million approved by gaming board
• NIGERIA• Exit Nigerian operations. Continuous engagement with
relevant stakeholders
• LATAM• Sun Dreams only secured one of the five Chilean municipal licences
bid for– All bids exceeded minimum criteria– Enjoy submitted economic offers (additional tax) substantially
above ours – In our view, Enjoy's offer will not generate acceptable returns
• Sun Nao Casino rental in Colombia settled at US$1.5 million, US$2.3 million below provision– Redeployed slot machines to smaller outlets in Cartagena
• Downscaling of the Ocean Sun Casino in Panama. Looking to sell the 65th and 66th floors
10
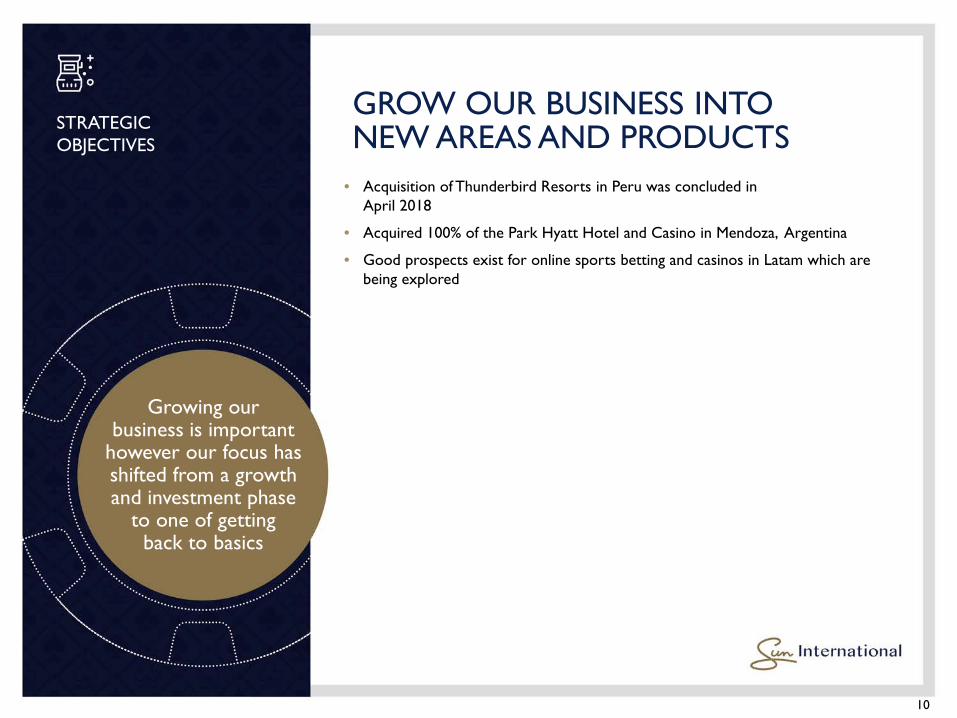
Growing our business is important
however our focus has shifted from a growth and investment phase
to one of getting back to basics
STRATEGIC OBJECTIVES
GROW OUR BUSINESS INTO NEW AREAS AND PRODUCTS
• Acquisition of Thunderbird Resorts in Peru was concluded in April 2018
• Acquired 100% of the Park Hyatt Hotel and Casino in Mendoza, Argentina
• Good prospects exist for online sports betting and casinos in Latam which are being explored
11
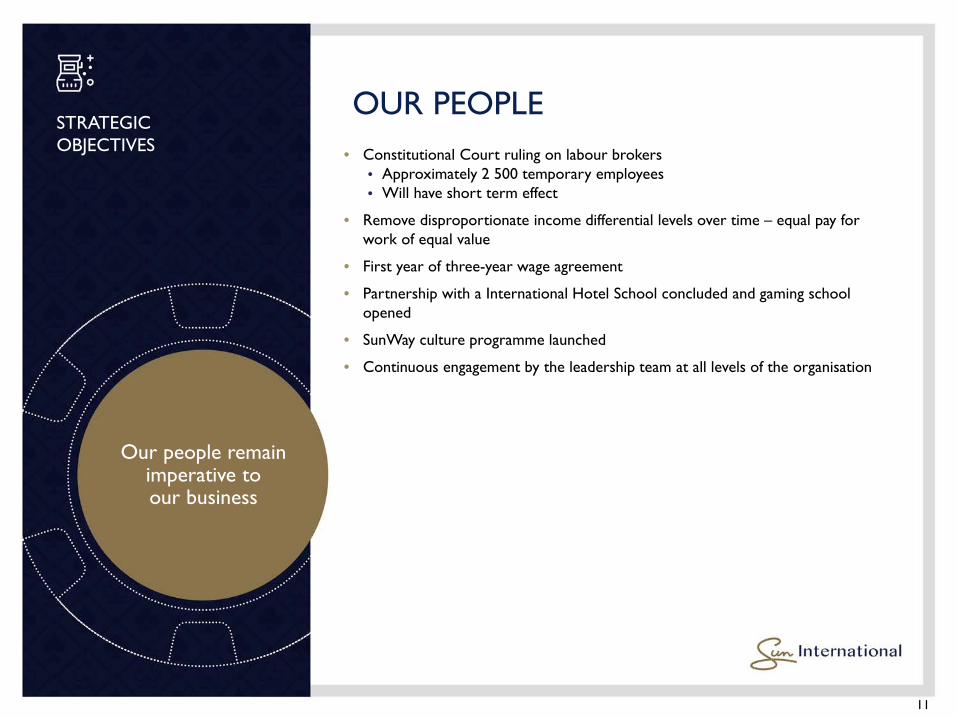
Our people remain imperative to our business
STRATEGIC OBJECTIVES
OUR PEOPLE• Constitutional Court ruling on labour brokers
• Approximately 2 500 temporary employees• Will have short term effect
• Remove disproportionate income differential levels over time – equal pay for work of equal value
• First year of three-year wage agreement
• Partnership with a International Hotel School concluded and gaming school opened
• SunWay culture programme launched
• Continuous engagement by the leadership team at all levels of the organisation

12
Corporate governance framework in place that supports the King IV principles
STRATEGIC OBJECTIVES
GOVERNANCE AND SUSTAINABILITY
• Remuneration policy approved with further changes under discussion
• Dedicated group ethics office established to reinforce ethical culture
• Risk methodology and risk ranking revised
• Focused group sustainability hub incorporating occupational health and safety, environmental, socio-economic and B-BBEE functions
• Integrating South Africa and Latam’s governance structures and implementing a sustainability strategy in Latam

LATAM ACQUISITIONS
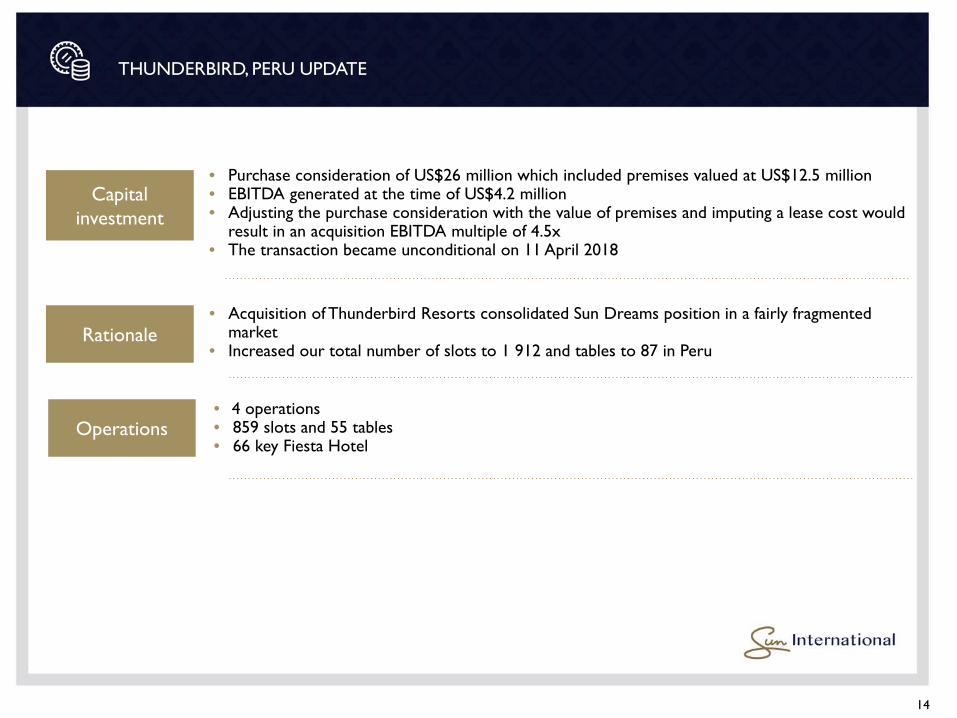
Rationale• Acquisition of Thunderbird Resorts consolidated Sun Dreams position in a fairly fragmented
market• Increased our total number of slots to 1 912 and tables to 87 in Peru
Operations• 4 operations• 859 slots and 55 tables • 66 key Fiesta Hotel
14
Capital investment
• Purchase consideration of US$26 million which included premises valued at US$12.5 million• EBITDA generated at the time of US$4.2 million• Adjusting the purchase consideration with the value of premises and imputing a lease cost would
result in an acquisition EBITDA multiple of 4.5x• The transaction became unconditional on 11 April 2018
THUNDERBIRD, PERU UPDATE

Rationale• The acquisition gives Sun Dreams geographical diversification and positions the
company as a truly Latam operator• Opportunity to improve hotel profitability and tables income
15
Operations • 647 slots and 19 tables• 186 key hotel
Capital investment
• Purchase consideration of US$22.5 million and a potential US$3 million earn out payment• EBITDA generated during 2017 was US$4.7 million • Historical EBITDA multiple of 5.4x• The transaction became unconditional on 11 July 2018• 20 year casino licence
MENDOZA, ARGENTINA UPDATE

TIME SQUARE UPDATE

17
Gauteng gambling market
• Time Square captured 13% of Gauteng's market share, which is below initial expectation• Recent performance has shown positive growth in market share, with slots market share at
13.57% and tables market share at 12.44%
Outlook• Significant increase in activity and visitation• Lower win ratio• July and August casino income up 32% and 33% respectively
Operations• 2 000 slots and 60 tables (commenced operations in April 2017)• 8 500 seater arena (opened November 2017)• 238 key hotel (opened March 2018)
Financial performance
• Income: R582 million• Casino income: R509 million
• EBITDA: R130 million• Operating profit: R9 million
Capital investment
• R4.3 billion invested • R675 million paid to Peermont• R81 million paid to Goldrush
TIME SQUARE UPDATE

TIME SQUARE ARENA LINE-UP

FINANCIAL REVIEW

R millionJune2018 %
June2017
Income 7 851 4 7 560EBITDA 2 010 6 1 894Depreciation and amortisation (815) (9) (747)
Adjusted operating profit 1 195 4 1 147Foreign exchange loss 19 100 -Net interest (600) (24) (483)
Profit before tax 614 (7) 664Tax (259) (12) (232)
Profit after tax 355 (18) 432Minorities (238) (5) (228)
Attributable profit 117 (43) 204Share of associates 3 >100 1Discontinued operations (5) <(100) 1
Adjusted headline earnings 115 (44) 206
20
• Group income increased by 4% to R7.9 billion
• Growth attributable to: - Sun Slots achieving EBITDA
growth of 11%- Monticello achieving EBITDA
growth of 10%- Time Square being fully
operational from the 2nd quarter of 2018
• Although income of the South African operations only increased by 1% on a comparable basis, EBITDA was maintained
• Group EBITDA increased by 6% from R1.9 billion to R2.0 billion
FINANCIAL REVIEW
FINANCIAL OVERVIEW
21
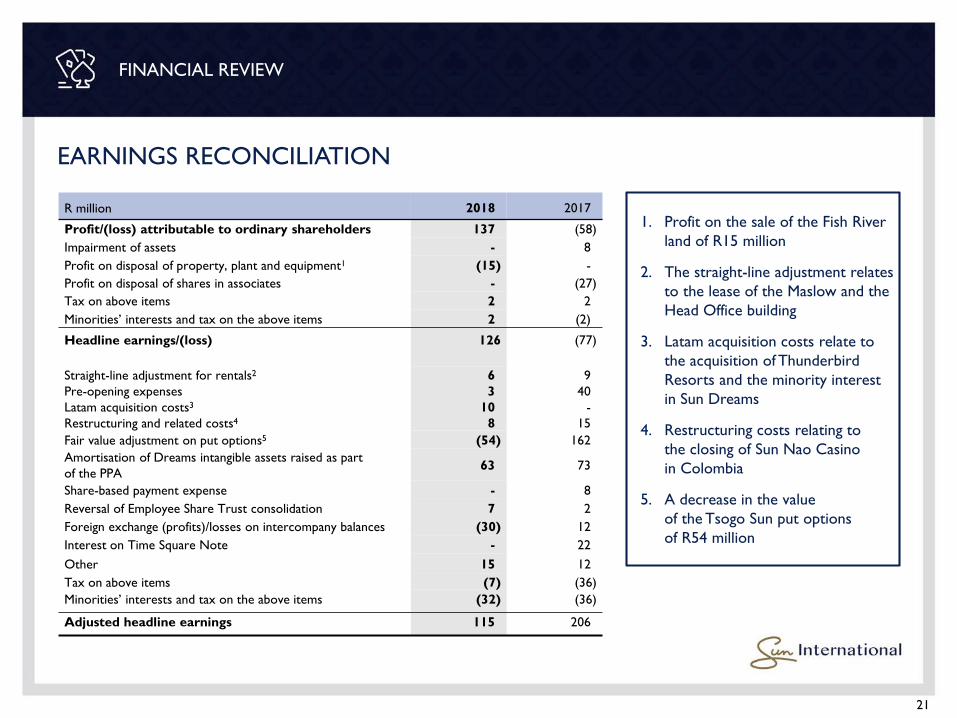
1. Profit on the sale of the Fish River land of R15 million
2. The straight-line adjustment relates to the lease of the Maslow and the Head Office building
3. Latam acquisition costs relate to the acquisition of Thunderbird Resorts and the minority interest in Sun Dreams
4. Restructuring costs relating to the closing of Sun Nao Casino in Colombia
5. A decrease in the value of the Tsogo Sun put options of R54 million
R million 2018 2017
Profit/(loss) attributable to ordinary shareholders 137 (58)Impairment of assets - 8Profit on disposal of property, plant and equipment1 (15) -Profit on disposal of shares in associates - (27)Tax on above items 2 2Minorities’ interests and tax on the above items 2 (2)
Headline earnings/(loss) 126 (77)
Straight-line adjustment for rentals2
Pre-opening expensesLatam acquisition costs3
Restructuring and related costs4
63
108
940
-15
Fair value adjustment on put options5 (54) 162Amortisation of Dreams intangible assets raised as part of the PPA
63 73
Share-based payment expense - 8Reversal of Employee Share Trust consolidation 7 2Foreign exchange (profits)/losses on intercompany balances (30) 12Interest on Time Square Note - 22Other 15 12Tax on above items (7) (36)Minorities’ interests and tax on the above items (32) (36)
Adjusted headline earnings 115 206
FINANCIAL REVIEW
EARNINGS RECONCILIATION
FINANCIAL REVIEW
22
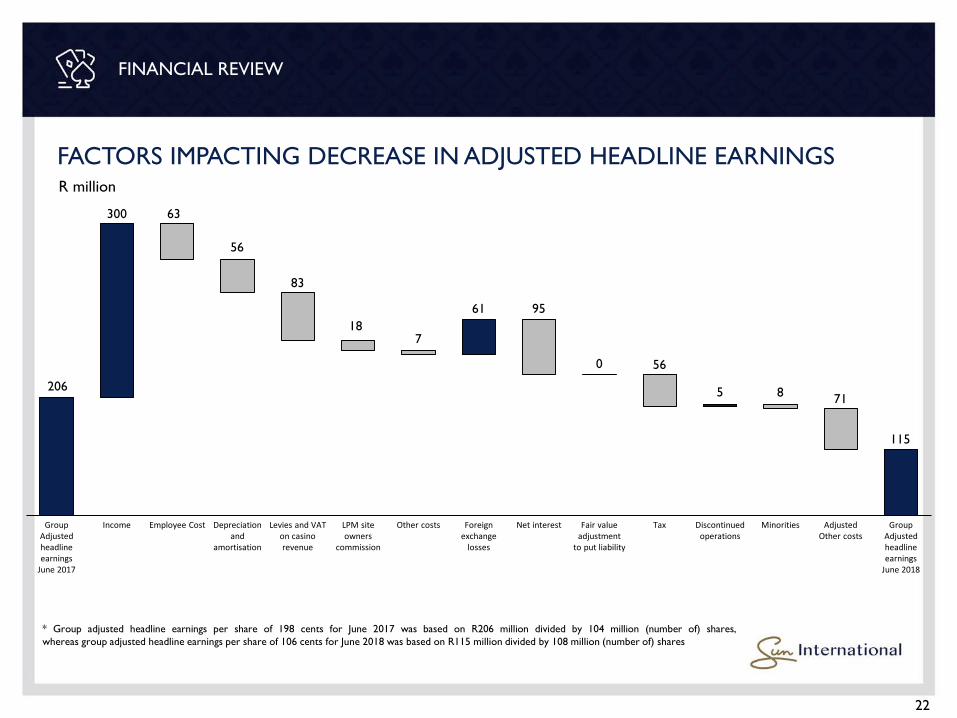
* Group adjusted headline earnings per share of 198 cents for June 2017 was based on R206 million divided by 104 million (number of) shares,whereas group adjusted headline earnings per share of 106 cents for June 2018 was based on R115 million divided by 108 million (number of) shares
R million
FACTORS IMPACTING DECREASE IN ADJUSTED HEADLINE EARNINGS
Fair value adjustment
to put liability
Levies and VAT on casino revenue
Employee CostGroup Adjusted headline earnings
June 2017
Discontinued operations
Minorities Adjusted Other costs
Income LPM site owners
commission
Group Adjusted headline earnings
June 2018
Depreciation and
amortisation
Other costs Foreign exchange
losses
Net interest Tax
300
206
63
56
83
187
61 95
0 56
5 8 71
115
SEGMENTAL REVIEW
24
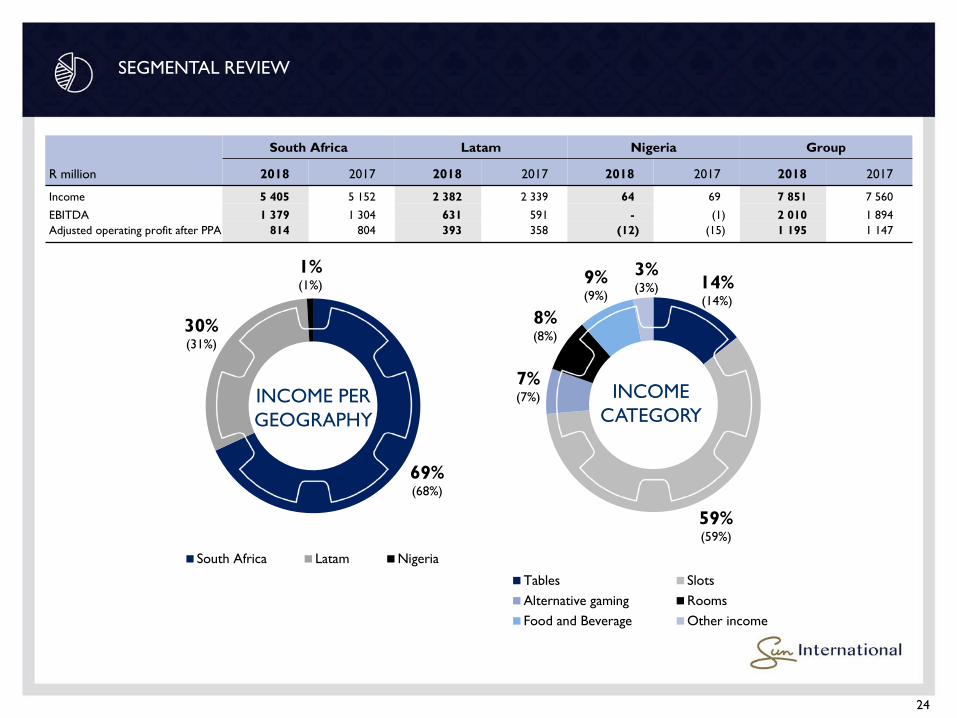
SEGMENTAL REVIEW
69%(68%)
30%(31%)
1%(1%)
South Africa Latam Nigeria
14%(14%)
59%(59%)
7%(7%)
8%(8%)
9%(9%)
3%(3%)
Tables SlotsAlternative gaming RoomsFood and Beverage Other income
INCOMECATEGORY
INCOME PER GEOGRAPHY
South Africa Latam Nigeria Group
R million 2018 2017 2018 2017 2018 2017 2018 2017
Income 5 405 5 152 2 382 2 339 64 69 7 851 7 560
EBITDA 1 379 1 304 631 591 - (1) 2 010 1 894Adjusted operating profit after PPA 814 804 393 358 (12) (15) 1 195 1 147

SEGMENTAL REVIEW
25
R million
Income EBITDA Operating Profit
2018 % 2017 2018 % 2017 2018 % 2017GrandWest 1 075 4 1 031 407 4 391 337 7 316 Sun City 784 (3) 808 81 (15) 95 (30) (67) (18)Sibaya 632 3 612 213 3 207 178 2 175 Carnival City 469 - 471 118 1 117 71 (4) 74 Boardwalk 252 (9) 276 43 26 34 8 >100 (6)Wild Coast Sun 247 7 231 44 16 38 20 54 13 Meropa 146 (1) 147 42 (14) 49 31 (18) 38 Windmill 138 12 123 47 31 36 37 48 25 Flamingo 80 (5) 84 18 (18) 22 11 (27) 15 Golden Valley 84 - 84 16 7 15 8 14 7 Carousel 82 (37) 130 (8) <(100) 19 (17) <(100) 5 Table Bay 162 (7) 175 36 (20) 45 26 (30) 37 The Maslow 68 (4) 71 (18) (29) (14) (25) (9) (23)Naledi 10 - 10 (2) 50 (4) (3) 40 (5)
South African operations 4 229 (1) 4 253 1 037 (1) 1 050 652 - 653 Sun Slots 562 12 504 127 11 114 80 14 70 SunBet 25 - 25 - (100) 1 - - -
South African operations including alternative gaming 4 816 1 4 782 1 164 - 1 165 732 1 723 Time Square 582 >100 276 130 81 72 9 (67) 27
South African operations including Time Square 5 398 7 5 058 1 294 5 1 237 741 (1) 750 Fish River - (100) 12 (1) 92 (12) (1) 92 (13)Morula - (100) 38 (1) 75 (4) (1) 80 (5)International VIP Business - (100) 9 - 100 (15) - 100 (15)Management companies 276 (6) 293 87 (11) 98 75 (14) 87 Intercompany management fees (269) (4) (258) - - - - - -
5 405 5 5 152 1 379 6 1 304 814 1 804
SOUTH AFRICAN SEGMENTAL REVIEW
SEGMENTAL REVIEW
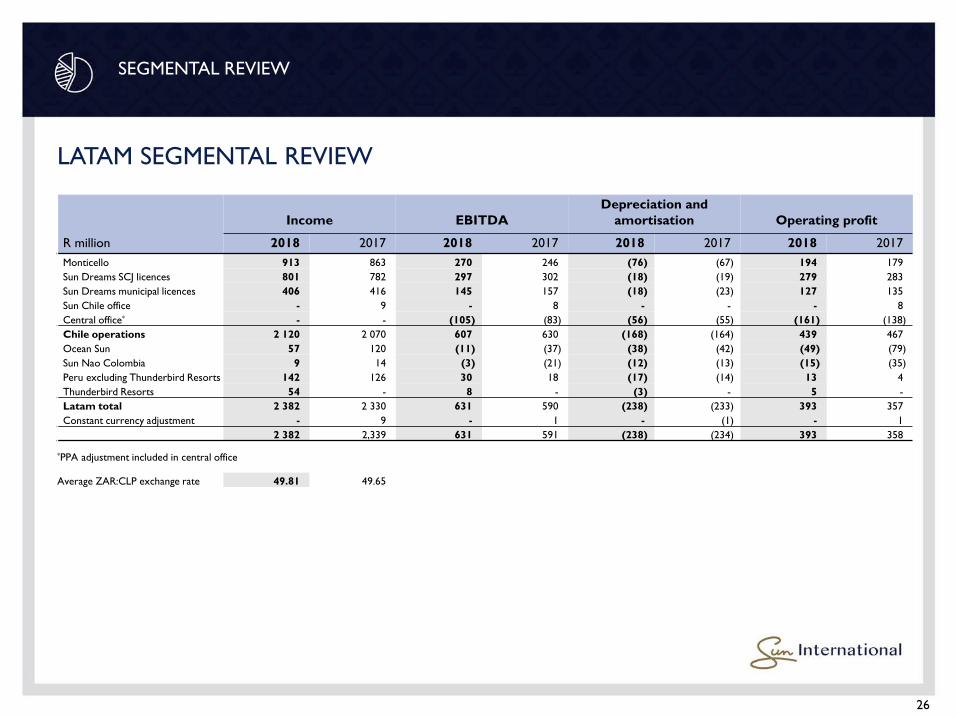
26
R million
Income EBITDADepreciation and
amortisation Operating profit
2018 2017 2018 2017 2018 2017 2018 2017Monticello 913 863 270 246 (76) (67) 194 179 Sun Dreams SCJ licences 801 782 297 302 (18) (19) 279 283 Sun Dreams municipal licences 406 416 145 157 (18) (23) 127 135 Sun Chile office - 9 - 8 - - - 8 Central office* - - (105) (83) (56) (55) (161) (138)Chile operations 2 120 2 070 607 630 (168) (164) 439 467 Ocean Sun 57 120 (11) (37) (38) (42) (49) (79)Sun Nao Colombia 9 14 (3) (21) (12) (13) (15) (35)Peru excluding Thunderbird Resorts 142 126 30 18 (17) (14) 13 4 Thunderbird Resorts 54 - 8 - (3) - 5 -Latam total 2 382 2 330 631 590 (238) (233) 393 357 Constant currency adjustment - 9 - 1 - (1) - 1
2 382 2,339 631 591 (238) (234) 393 358
*PPA adjustment included in central office
Average ZAR:CLP exchange rate 49.81 49.65
LATAM SEGMENTAL REVIEW
CAPITAL INVESTMENT

28
H1 Six months
H2 Six months
December 12 months
R million Actual Forecast Forecast
South African operationsExpansionary
Time Square 166 - 166
166 - 166
Refurbishment and ongoing -Sun City 52 146 198 GrandWest 43 106 149 Sibaya 26 64 90 SunSlotsTime Square
50 7
572
1079
Other 83 145 228
Total South Africa 427 520 947
Latam operationsRefurbishment and ongoing 86 207 293
Total Latam 86 207 293
Nigeria operationRefurbishment and ongoing 6 7 13
Total Nigeria 6 7 13
Total group capital expenditure 519 734 1 253
CAPITAL INVESTMENT
CAPEX

29
R millionProject Capex
Capitalised Interest
Total development
spend
Spend up to 31 December 2016 2 069 130 2 199
Spend for the 12 months 31 December 2017 1 833 138 1 971
Total spend up to 31 December 2017 3 902 268 4 170
Spend from 1 January 2018 to 30 June 2018 166 11 177
Total spend up to 30 June 2018 4 068 279 4 347
Outstanding spend up to completion - - -
Total completed spend 4 068 279 4 347
CAPEX-TIME SQUARE
• Time Square’s development was completed in the first half of 2018 with the completion of the 238 room hotel in March 2018
• The total development spend was R4.3 billion
• Included in the development spend was R279 million of capitalised interest from shareholder loans, which funded the project
CAPITAL INVESTMENT
BORROWINGS AND
CASH FLOW

Total debt Minorities
Attributableto Sun
InternationalR million
South AfricaOperating subsidiaries* 2 827 655 2 172 Time Square 5 060 722 4 338 Central office 1 836 - 1 836
9 723 1 377 8 346 NigeriaShareholder loans 862 437 425 Sun International inter-company debt (302) (153) (149)
560 284 276
LatamSun Dreams 3 986 1 421 2 565 Sun Chile 793 - 793
4 779 1 421 3 358 30 June 2018 15 062 3 082 11 980 31 December 2017 14 995 2 654 12 341 30 June 2017 15 055 3 267 11 788
* Excluding Time Square
31
South Africa Sun Dreams
Covenant Actual Covenant Actual
Debt to EBITDA 3.5x 3.2x 4.75x 3.5xInterest cover 2.5x 3.1x
BORROWINGS AND CASH FLOW
• Proceeds from the rights offer was applied to reduce South African debt
• Latam debt increased following the raising of a 10-year Sun Dreams bond to fund the remaining shareholders’ acquisition of the exiting shareholders approximate 20% interest
• The South African weighted average interest rate is approximately 9.5%
• In Latam the weighted average interest rate is approximately 4.6%
BORROWINGS

32
R million
362290 286
278
538
261
16694 130 254
Project capexInterest paidGenerated by operations
Tax paid Investment in Sibaya
Rights offer BorrowingsDividends to minority
shareholders
Cash at end of period
Cashflow prior to
funding and dividends
Free cashCapex Cash at beginning of
period
Working capital
Other Financing activities
Other investing activities
Cash outflow
* Other investing activities include the sale of Fish River land of R75million.
17
7
1.7031.599
1.448 9
BORROWINGS AND CASH FLOW
SOUTH AFRICAN CASH FLOW
Cash inflow

605
344 354
515130
86321
387
BORROWINGS AND CASH FLOW
33
R million
SUN DREAMS CASH FLOW
Cashflow prior to funding
and dividends
Shareholder loans
662
Acquisition of
Thunderbird Resorts
Advance payment
of Mendoza
713
1.357
Borrowings Effect of exchange
rates upon cash and
cash equivalents
57
Generated by
operations
138
Cash at end of period
Other investing activities
Working capital
12
Tax paid Free cash
27
Acquisition of minority
interest
Interest paid Cash at beginning of period
Capex
10
Cash outflowCash inflow
SUPPLEMENTARY INFORMATION

35
SUPPLEMENTARY INFORMATION
LATAM SEGMENTAL (CLP)
Income EBITDA Operating profitCLP million 2018 % 2017 2018 % 2017 2018 % 2017
Iquique 10 225 (2) 10 468 3 190 (9) 3 518 2 978 (10) 3 311
Puerto Varas 9 981 (3) 10 244 4 049 (6) 4 318 3 368 - 3 378
Temuco 14 748 2 14 455 5 487 (3) 5 650 5 160 (4) 5 369
Valdivia 8 967 (1) 9 079 2 964 (5) 3 110 2 752 (5) 2 905
Coyhaique 3 677 3 3 560 1 017 (7) 1 095 890 2 876
Punta Arenas 12 480 5 11 864 5 324 3 5 176 5 083 3 4 943
Monticello 45 514 6 43 001 13 463 10 12 233 9 660 9 8 890
Sun Chile office - (100) 443 (22) <(100) 381 (22) <(100) 381
Central office* - - - (5 311) (22) (4 345) (8 004) (17) (6 858)
105 592 2 103 114 30 161 (3) 31 136 21 865 (6) 23 195
Ocean Sun 2 825 (53) 5 975 (541) 71 (1 842) (2 423) 38 (3 912)
Sun Nao 439 (39) 720 (155) 85 (1 060) (769) 55 (1 719)
Peru excluding Thunderbird 7 086 13 6 297 1 597 43 1 120 663 >100 192
Thunderbird 2 713 100 - 376 100 - 237 100 -
118 655 2 116 106 31 438 7 29 354 19 573 10 17 756
*PPA adjustment included in central office

Economic interest % * Slots Tables Rooms
South AfricaGauteng Carnival City 91 1 542 49 105
Maslow 100 - - 281Time Square 82 2 000 60 238
Western Cape GrandWest 61 2 563 68 39Table Bay 61 - - 329Worcester 61 220 6 98Sun Bet 100 - - -
KwaZulu-Natal Sibaya 63 1 214 48 154Limpopo Meropa 68 417 17 60North West Sun City 100 645 51 1 296
Carousel 100 700 25 94Northern Cape Flamingo 71 300 10 -Eastern Cape Boardwalk 82 918 27 140
Wild Coast Sun 70 537 19 396Free State Windmill 70 403 18 -
Naledi Sun 100 160 - 30Management activities Sun International Management 100 - - -
Other AfricaNigeria 49 106 10 146Swaziland 51 158 13 351
LatamChile 65 5 180 227 533Panama 65 499 41 -Colombia 65 209 11 -Peru 65 1 912 87 -
36
Economic interest % LPMs Sites
South AfricaSun Slots 70 3 788 780
* Excluding Employee share scheme shareholding %
SUPPLEMENTARY INFORMATION
GROUP STRUCTURE
SUPPLEMENTARY INFORMATION
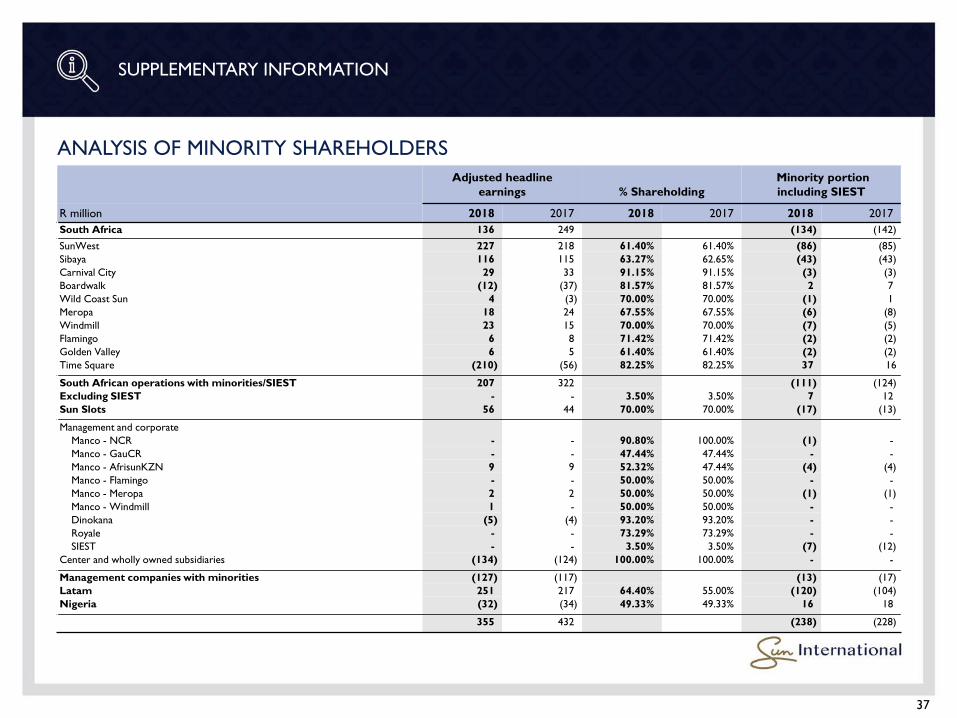
37
Adjusted headline earnings % Shareholding
Minority portion including SIEST
R million 2018 2017 2018 2017 2018 2017South Africa 136 249 (134) (142)
SunWest 227 218 61.40% 61.40% (86) (85)Sibaya 116 115 63.27% 62.65% (43) (43)Carnival City 29 33 91.15% 91.15% (3) (3)Boardwalk (12) (37) 81.57% 81.57% 2 7 Wild Coast Sun 4 (3) 70.00% 70.00% (1) 1 Meropa 18 24 67.55% 67.55% (6) (8)Windmill 23 15 70.00% 70.00% (7) (5)Flamingo 6 8 71.42% 71.42% (2) (2)Golden Valley 6 5 61.40% 61.40% (2) (2)Time Square (210) (56) 82.25% 82.25% 37 16
South African operations with minorities/SIEST 207 322 (111) (124)Excluding SIEST - - 3.50% 3.50% 7 12 Sun Slots 56 44 70.00% 70.00% (17) (13)
Management and corporateManco - NCR - - 90.80% 100.00% (1) -Manco - GauCR - - 47.44% 47.44% - -Manco - AfrisunKZN 9 9 52.32% 47.44% (4) (4)Manco - Flamingo - - 50.00% 50.00% - -Manco - Meropa 2 2 50.00% 50.00% (1) (1)Manco - Windmill 1 - 50.00% 50.00% - -Dinokana (5) (4) 93.20% 93.20% - -Royale - - 73.29% 73.29% - -SIEST - - 3.50% 3.50% (7) (12)
Center and wholly owned subsidiaries (134) (124) 100.00% 100.00% - -
Management companies with minorities (127) (117) (13) (17)Latam 251 217 64.40% 55.00% (120) (104)Nigeria (32) (34) 49.33% 49.33% 16 18
355 432 (238) (228)
ANALYSIS OF MINORITY SHAREHOLDERS

SUPPLEMENTARY INFORMATION
38
2018 2017
Total Borrowings
Minority Share
Attributable to Sun
InternationalTotal
Borrowings Minority shareAttributable to
Sun InternationalR million
South Africa 9 723 1 377 8 346 11 424 1 373 10 051 SunWest 817 286 531 869 305 564 Afrisun Gauteng 627 34 593 580 31 549 Afrisun KZN 293 97 196 284 96 188 Emfuleni 533 80 453 610 91 519 Wild Coast 266 80 186 280 84 196 Meropa 115 33 82 131 38 93 Teemane 76 19 57 75 19 56 Windmill 93 25 68 102 27 75 Golden Valley (8) (3) (5) (11) (4) (7)Sun Slots 15 4 11 70 21 49 Time Square 5 060 722 4 338 4 669 665 4 004 Management and corporate 1 836 - 1 836 3 765 - 3 765
Nigeria 560 284 276 493 250 243 Shareholder loans 862 437 425 761 386 375 Sun International intercompany debt (302) (153) (149) (268) (136) (132)
Latam 4 779 1 421 3 358 3 078 1 031 2 047 Sun Dreams 3 986 1 421 2 565 2 267 1 031 1 236 Sun Chile 793 - 793 811 - 811
Total debt 15 062 3 082 11 980 14 995 2 654 12 341
BORROWINGS BY SUBSIDIARY

SUPPLEMENTARY INFORMATION
39
ISSUED SHARE CAPITAL
‘000June 2018
December 2018
Number of shares in issue before rights offer 109 087 109 087
Rights offer 27 644 27 644
Number of shares in issue 136 731 136 731
Less all shares held through Dinokana, employee share trust and deemed treasury shares (11 215) (11 215)
Shares used in the calculation of basic earnings 125 516 125 516
Adjustment for rights offer and purchased deemed treasury shares weighted for the period (23 106) (11 454)
Shares used in the calculation of HEPS 102 410 114 062 Adjustment for Dinokana, employee share trust and deemed treasury shares that are not attributable to Sun International 6 151 6 202
Shares used in the calculation of AHEPS 108 561 120 264

40
R million South Africa Other Africa Latam Total
Profit before tax 380 (30) 248 598
Adjustment items
Preference share funding 44 - - 44
Movement in put option (54) - - (54)
Foreign inflation adjustments - - (121) (121)
Non-deductible interest 32 - - 32
Tax losses not meeting recognition criteria 213 28 132 373
Adjusted profit before tax 615 (2) 259 872
Tax charge 184 - 70 254
Capital gains tax (5) - - (5)
Prior year tax - - - -
Adjusted tax charge 179 - 70 249
Normalised ETR 29% - 27% 29%
Statutory tax rate 28% 30% 27%
GROUP TAX
GROUP EFFECTIVE TAX RATE (ETR)
RESULTS PRESENTATION
for the interim period 30 June 2018


