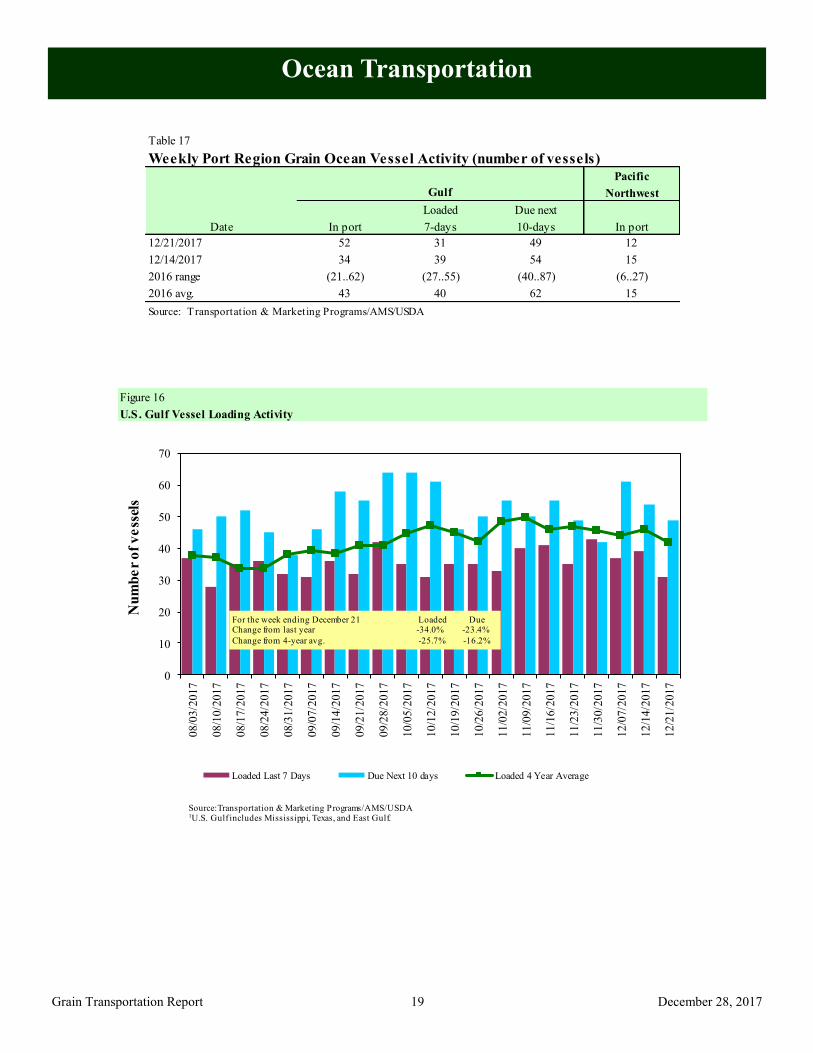
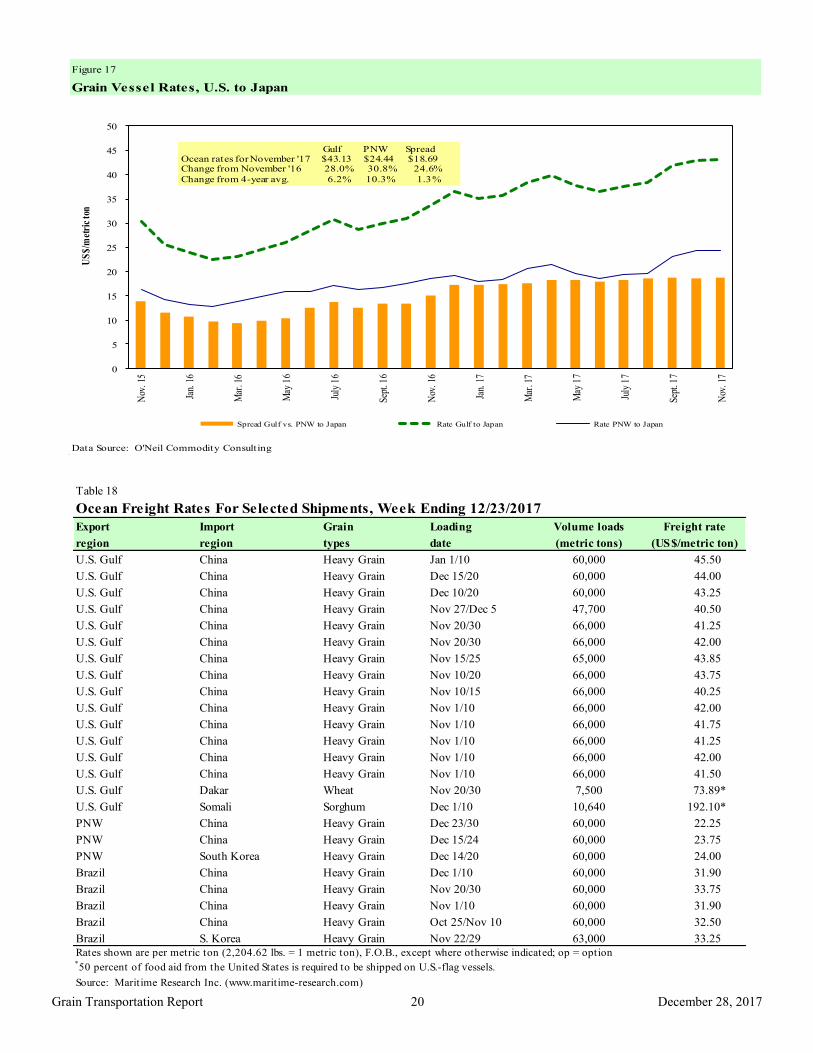
A weekly publication of the Agricultural Marketing Service www.ams.usda.gov/GTR December 28, 2017 Contents Article/ Calendar Grain Transportation Indicators Rail Barge Truck Exports Ocean Brazil Mexico Grain Truck/Ocean Rate Advisory Datasets Specialists Subscription Information -------------- The next release is January 4, 2018 Preferred citation: U.S. Dept. of Agriculture, Agricultural Marketing Service. Grain Transportation Report.December 28, 2017. Web: http://dx.doi.org/10.9752/TS056.12-28-2017 Grain Transportation Report Contact Us WEEKLY HIGHLIGHTS Cold Weather May Impact Barge Logistics Much of the central and eastern United States is experiencing extremely cold weather and sub-freezing temperatures that may form significant ice accumulations on the Upper Mississippi and Illinois Rivers. The ice formations can restrict lock transit and narrow navigation channels. As a result of the freeze-up, river levels have dropped, especially at St. Louis, MO, where the river gage is forecast to drop from 2.0 feet on December 26 to -2.2 feet by January 4. Gage height is a measurement of river elevation the U.S. Army Corps of Engineers (Corps) uses at various locations on individual rivers and refers to the number of feet above or below a reference point on the river bank. It does not refer to the depth of the river and varies by location. The Corps, U.S. Coast Guard and river representatives have formed a joint committee that places restrictions (e.g., depth of draft for barges) on river traffic when the gage at St. Louis declines to -3.5 feet. In the event of possible extreme low water levels, the Corps has procedures to release water from upstream dams that have the potential to increase water levels. Soybean, Wheat, and Corn Inspections All Decline from Previous Week For the week ending December 21, total inspections of grain (corn, wheat, and soybeans) for export from all major U.S. export regions fell to 2.47 million metric tons (mmt), down 22 percent from the previous week, down 25 percent from the same time last year, and down 18 percent from the 3-year average. The decrease in total grain inspections consisted of a 28 percent decline in soybean inspections, a 21 percent decline in wheat inspections, and a 4 percent decline in corn inspections. Mississippi Gulf grain inspections declined 30 percent, and Pacific Northwest (PNW) inspections declined 15 percent. Transportation Board Annual Meeting: January 7 to 11 The Transportation Research Board’s 97th Annual Meeting will be held January 7-11, 2018 in Washington, DC. The meeting program covers all transportation modes and has over 5,000 presentations in nearly 800 sessions and workshops. These sessions and workshops address topics of interest to policy makers, administrators, practitioners, researchers, and representatives of government, industry, and academic institutions. A number of presentations focus on agricultural and grain transportation, including those organized under the following sessions (among others): “From Farm to Table: Multimodal Opportunities and Challenges of Moving the World's Food,” “Trade, Food, and Freight—How Changing Trends in Production and Consumption Affect Movement of Food Exports and Imports,” and “Agriculture Commodity Data: Challenges and Applications.” Snapshots by Sector Export Sales For the week ending December 14 unshipped balances of wheat, corn, and soybeans totaled 35.5 mmt, down 18 percent from the same time last year. Net weekly wheat export sales were .796 mmt, up 35 percent from the previous week. Net corn export sales were 1.6 mmt, up 80 percent from the previous week, and net soybean export sales were 1.7 mmt for the same period, up 20 percent from the previous week. Rail U.S. Class I railroads originated 23,571 grain carloads for the week ending December 16, down 1 percent from the previous week, down 3 percent from last year, and down 1 percent from the 3-year average. Average January shuttle secondary railcar bids/offers per car were $27 below tariff for the week ending December 21, up $60 from last week, and $452 lower than last year. There were no non-shuttle bids/offers this week. Barge For the week ending December 23, barge grain movements totaled 630,186 tons, 22 percent lower than the previous week, and down 2 percent from the same period last year. For the week ending December 23, 396 grain barges moved down river, down 23 percent from last week. 728 grain barges were unloaded in New Orleans, 21 percent lower than the previous week. Ocean For the week ending December 21, 31 ocean-going grain vessels were loaded in the Gulf, 34 percent less than the same period last year. Forty-nine vessels are expected to be loaded within the next 10 days, 23 percent less than the same period last year. For the week ending December 21, the ocean freight rate for shipping bulk grain from the Gulf to Japan was $44.25 per metric ton, down 3 percent from the previous week. The cost of shipping from the PNW to Japan was $24.75 per metric ton, down 2 percent from the previous week. Fuel During the week ending December 25, average diesel fuel prices increased 0.2 cents from the previous week at $2.90 per gallon, 36 cents above the same week last year.
Transcript
A weekly publication of the Agricultural Marketing Service
www.ams.usda.gov/GTR
December 28, 2017
Contents
Article/
Calendar
Grain
Transportation
Indicators
Rail
Barge
Truck
Exports
Ocean
Brazil
Mexico
Grain Truck/Ocean
Rate Advisory
Datasets
Specialists
Subscription
Information
--------------
The next
release is January 4, 2018
Preferred citation: U.S. Dept. of Agriculture, Agricultural Marketing Service. Grain Transportation Report.December 28, 2017.
Web: http://dx.doi.org/10.9752/TS056.12-28-2017
Grain Transportation Report
Contact Us
WEEKLY HIGHLIGHTS
Cold Weather May Impact Barge Logistics
Much of the central and eastern United States is experiencing extremely cold weather and sub-freezing temperatures that may form
significant ice accumulations on the Upper Mississippi and Illinois Rivers. The ice formations can restrict lock transit and narrow
navigation channels. As a result of the freeze-up, river levels have dropped, especially at St. Louis, MO, where the river gage is
forecast to drop from 2.0 feet on December 26 to -2.2 feet by January 4. Gage height is a measurement of river elevation the U.S.
Army Corps of Engineers (Corps) uses at various locations on individual rivers and refers to the number of feet above or below a
reference point on the river bank. It does not refer to the depth of the river and varies by location. The Corps, U.S. Coast Guard and
river representatives have formed a joint committee that places restrictions (e.g., depth of draft for barges) on river traffic when the
gage at St. Louis declines to -3.5 feet. In the event of possible extreme low water levels, the Corps has procedures to release water
from upstream dams that have the potential to increase water levels.
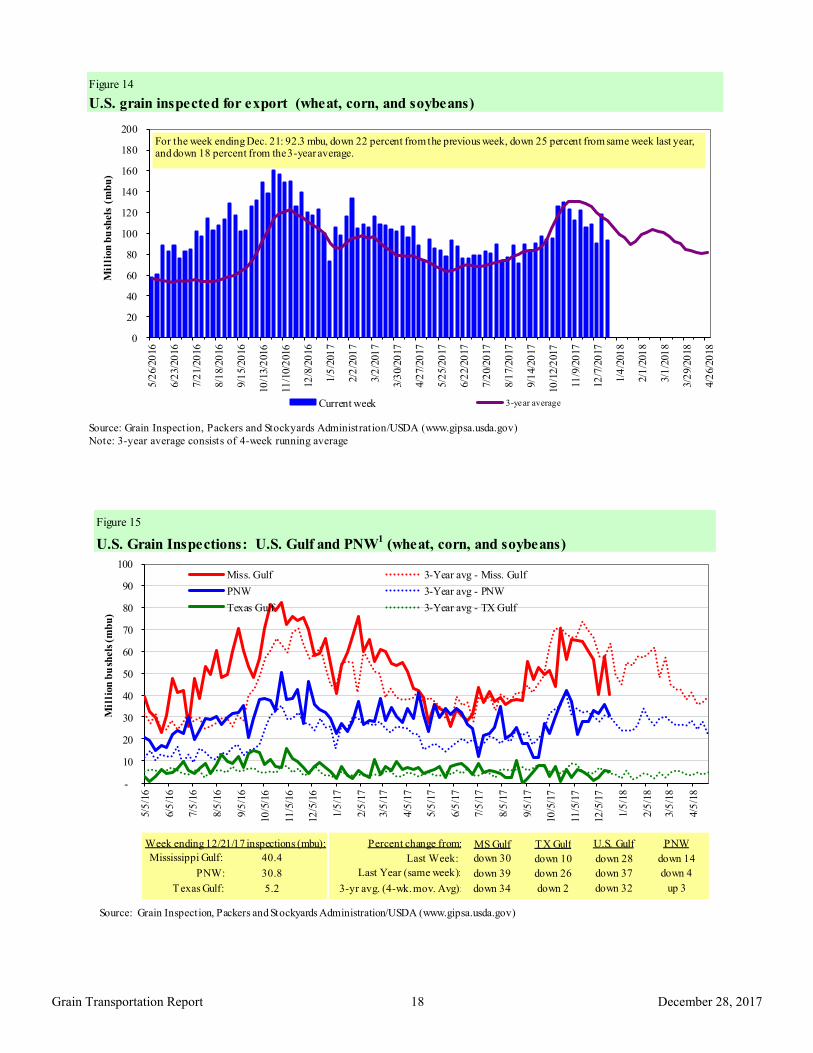
Soybean, Wheat, and Corn Inspections All Decline from Previous Week
For the week ending December 21, total inspections of grain (corn, wheat, and soybeans) for export from all major U.S. export regions
fell to 2.47 million metric tons (mmt), down 22 percent from the previous week, down 25 percent from the same time last year, and
down 18 percent from the 3-year average. The decrease in total grain inspections consisted of a 28 percent decline in soybean
inspections, a 21 percent decline in wheat inspections, and a 4 percent decline in corn inspections. Mississippi Gulf grain inspections
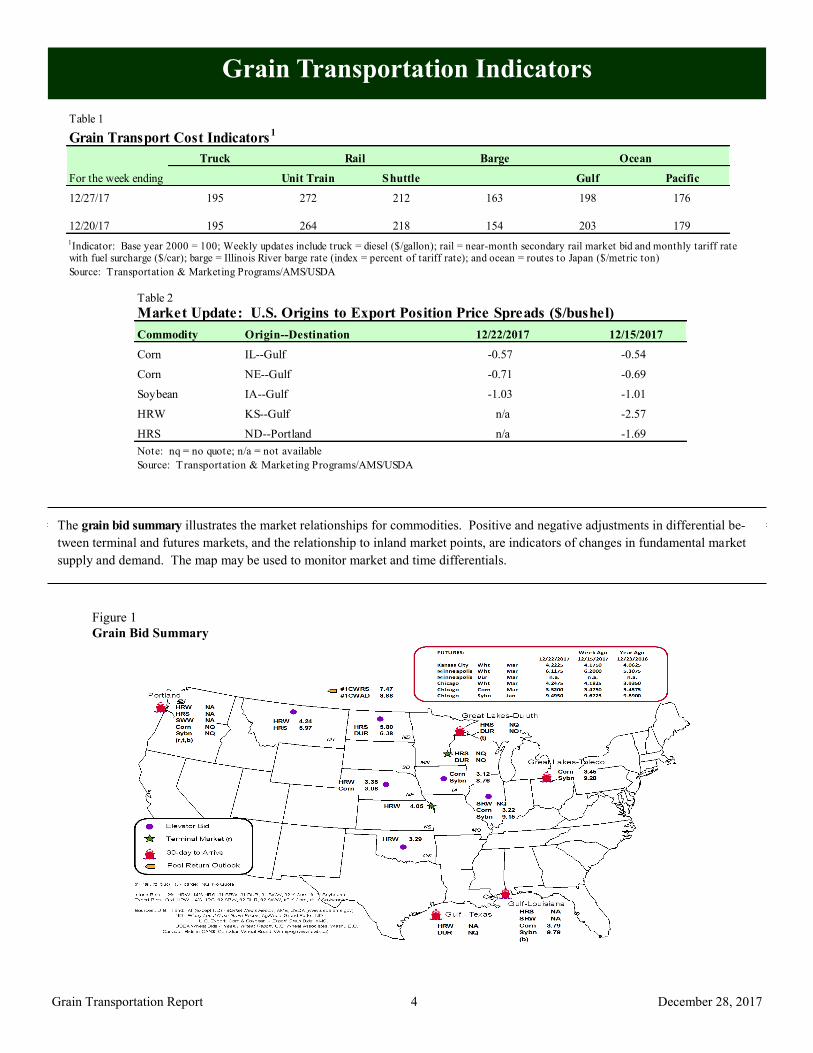
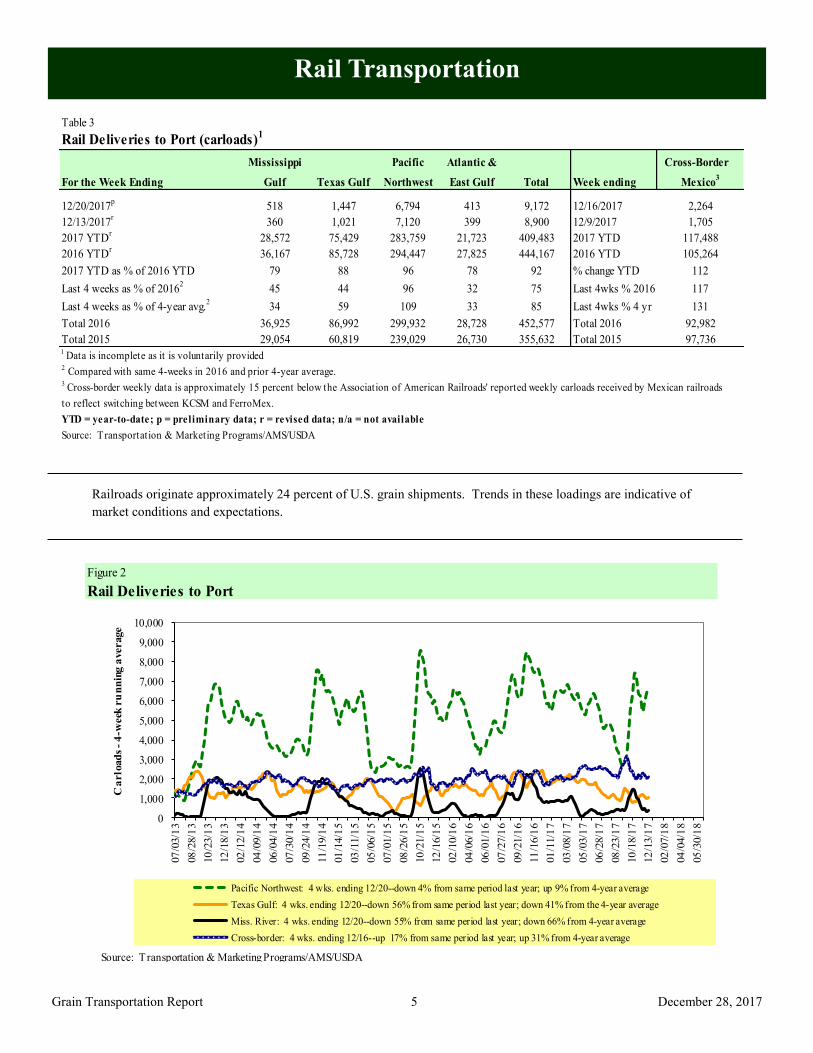
1Indicator: Base year 2000 = 100; Weekly updates include truck = diesel ($/gallon); rail = near-month secondary rail market bid and monthly tariff rate with fuel surcharge ($/car); barge = Illinois River barge rate (index = percent of tariff rate); and ocean = routes to Japan ($/metric ton)
2017 YTD as % of 2016 YTD 79 88 96 78 92 % change YTD 112
Last 4 weeks as % of 20162
45 44 96 32 75 Last 4wks % 2016 117
Last 4 weeks as % of 4-year avg.2
34 59 109 33 85 Last 4wks % 4 yr 131
Total 2016 36,925 86,992 299,932 28,728 452,577 Total 2016 92,982
Total 2015 29,054 60,819 239,029 26,730 355,632 Total 2015 97,7361
Data is incomplete as it is voluntarily provided2 Compared with same 4-weeks in 2016 and prior 4-year average. 3 Cross-border weekly data is approximately 15 percent below the Association of American Railroads' reported weekly carloads received by Mexican railroads
to reflect switching between KCSM and FerroMex.
YTD = year-to-date; p = preliminary data; r = revised data; n/a = not available
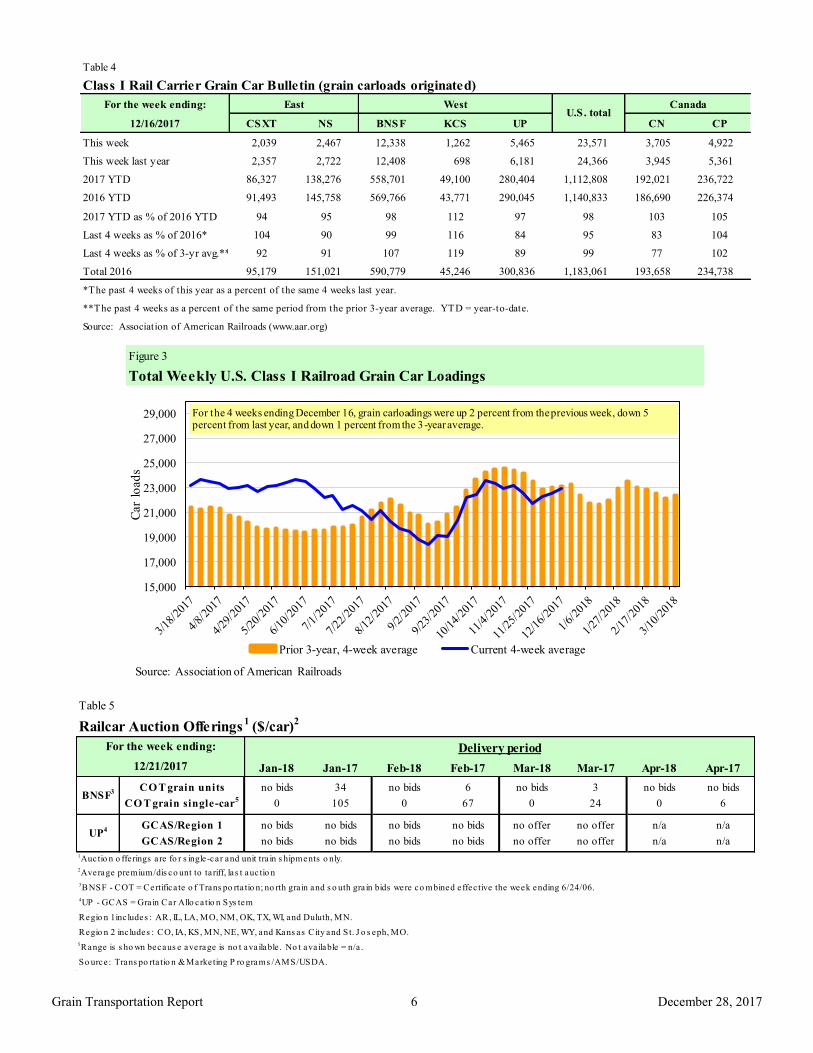
2017 YTD as % of 2016 YTD 94 95 98 112 97 98 103 105
Last 4 weeks as % of 2016* 104 90 99 116 84 95 83 104
Last 4 weeks as % of 3-yr avg.** 92 91 107 119 89 99 77 102
Total 2016 95,179 151,021 590,779 45,246 300,836 1,183,061 193,658 234,738
*The past 4 weeks of this year as a percent of the same 4 weeks last year.
**The past 4 weeks as a percent of the same period from the prior 3-year average. YTD = year-to-date.
Source: Association of American Railroads (www.aar.org)
East WestU.S. total
Canada
Figure 3
Total Weekly U.S. Class I Railroad Grain Car Loadings
15,000
17,000
19,000
21,000
23,000
25,000
27,000
29,000
Car
load
s
Prior 3-year, 4-week average Current 4-week average
For the 4 weeks ending December 16, grain carloadings were up 2 percent from the previous week, down 5 percent from last year, and down 1 percent from the 3-year average.
Grand Forks, ND Portland, OR $5,611 $0 $55.72 $1.52 0
Grand Forks, ND Galveston-Houston, TX $5,931 $0 $58.90 $1.60 0
Northwest KS Portland, OR $5,812 $224 $59.94 $1.63 5
Corn Minneapolis, MN Portland, OR $5,000 $0 $49.65 $1.26 0
Sioux Falls, SD Tacoma, WA $4,960 $0 $49.26 $1.25 0
Champaign-Urbana, IL New Orleans, LA $3,731 $141 $38.45 $0.98 9
Lincoln, NE Galveston-Houston, TX $3,700 $0 $36.74 $0.93 0
Des Moines, IA Amarillo, TX $3,970 $110 $40.52 $1.03 3
Minneapolis, MN Tacoma, WA $5,000 $0 $49.65 $1.26 0
Council Bluffs, IA Stockton, CA $4,820 $0 $47.86 $1.22 2
Soybeans Sioux Falls, SD Tacoma, WA $5,600 $0 $55.61 $1.51 0
Minneapolis, MN Portland, OR $5,650 $0 $56.11 $1.53 0
Fargo, ND Tacoma, WA $5,500 $0 $54.62 $1.49 0
Council Bluffs, IA New Orleans, LA $4,775 $162 $49.03 $1.33 7
Toledo, OH Huntsville, AL $4,352 $0 $43.22 $1.18 3
Grand Island, NE Portland, OR $5,710 $229 $58.98 $1.61 61A unit train refers to shipments of at least 25 cars. Shuttle train rates are generally available for qualified shipments of
75-120 cars that meet railroad efficiency requirements.
2Approximate load per car = 111 short tons (100.7 metric tons): corn 56 lbs./bu., wheat and soybeans 60 lbs./bu.
3Regional economic areas are defined by the Bureau of Economic Analysis (BEA)
4Percentage change year over year calculated using tariff rate plus fuel surcharge
Tariff plus surcharge per:Fuel
surcharge
per car
December 28, 2017
Grain Transportation Report 10
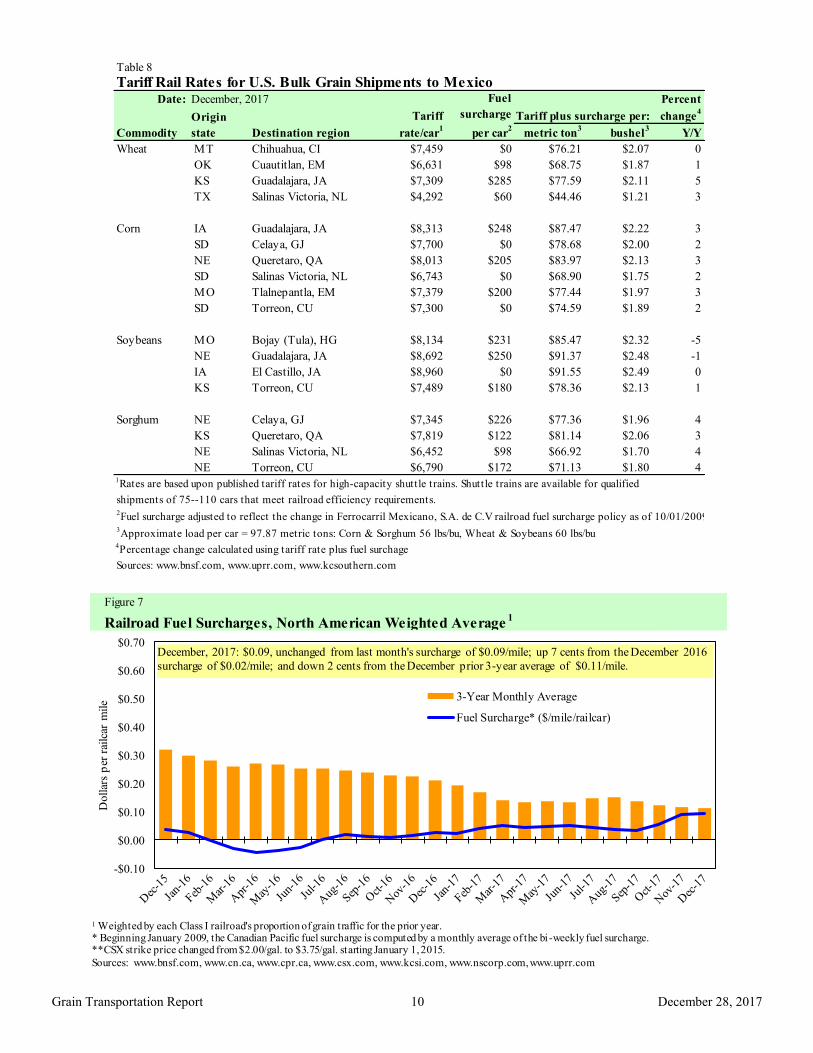
Table 8
Tariff Rail Rates for U.S. Bulk Grain Shipments to MexicoDate: Percent
Tariff change4
Commodity Destination region rate/car1
metric ton3 bushel
3Y/Y
Wheat MT Chihuahua, CI $7,459 $0 $76.21 $2.07 0
OK Cuautitlan, EM $6,631 $98 $68.75 $1.87 1
KS Guadalajara, JA $7,309 $285 $77.59 $2.11 5
TX Salinas Victoria, NL $4,292 $60 $44.46 $1.21 3
Corn IA Guadalajara, JA $8,313 $248 $87.47 $2.22 3
SD Celaya, GJ $7,700 $0 $78.68 $2.00 2
NE Queretaro, QA $8,013 $205 $83.97 $2.13 3
SD Salinas Victoria, NL $6,743 $0 $68.90 $1.75 2
MO Tlalnepantla, EM $7,379 $200 $77.44 $1.97 3
SD Torreon, CU $7,300 $0 $74.59 $1.89 2
Soybeans MO Bojay (Tula), HG $8,134 $231 $85.47 $2.32 -5
NE Guadalajara, JA $8,692 $250 $91.37 $2.48 -1
IA El Castillo, JA $8,960 $0 $91.55 $2.49 0
KS Torreon, CU $7,489 $180 $78.36 $2.13 1
Sorghum NE Celaya, GJ $7,345 $226 $77.36 $1.96 4
KS Queretaro, QA $7,819 $122 $81.14 $2.06 3
NE Salinas Victoria, NL $6,452 $98 $66.92 $1.70 4
NE Torreon, CU $6,790 $172 $71.13 $1.80 41Rates are based upon published tariff rates for high-capacity shuttle trains. Shuttle trains are available for qualified
shipments of 75--110 cars that meet railroad efficiency requirements.2Fuel surcharge adjusted to reflect the change in Ferrocarril Mexicano, S.A. de C.V railroad fuel surcharge policy as of 10/01/2009
3Approximate load per car = 97.87 metric tons: Corn & Sorghum 56 lbs/bu, Wheat & Soybeans 60 lbs/bu
4Percentage change calculated using tariff rate plus fuel surchage
Railroad Fuel Surcharges, North American Weighted Average1
-$0.10
$0.00
$0.10
$0.20
$0.30
$0.40
$0.50
$0.60
$0.70
Do
llar
s p
er r
ailc
ar m
ile
3-Year Monthly Average
Fuel Surcharge* ($/mile/railcar)
December, 2017: $0.09, unchanged from last month's surcharge of $0.09/mile; up 7 cents from the December 2016
surcharge of $0.02/mile; and down 2 cents from the December prior 3-year average of $0.11/mile.
1 Weighted by each Class I railroad's proportion of grain traffic for the prior year. * Beginning January 2009, the Canadian Pacific fuel surcharge is computed by a monthly average of the bi -weekly fuel surcharge.**CSX strike price changed from $2.00/gal. to $3.75/gal. starting January 1, 2015.
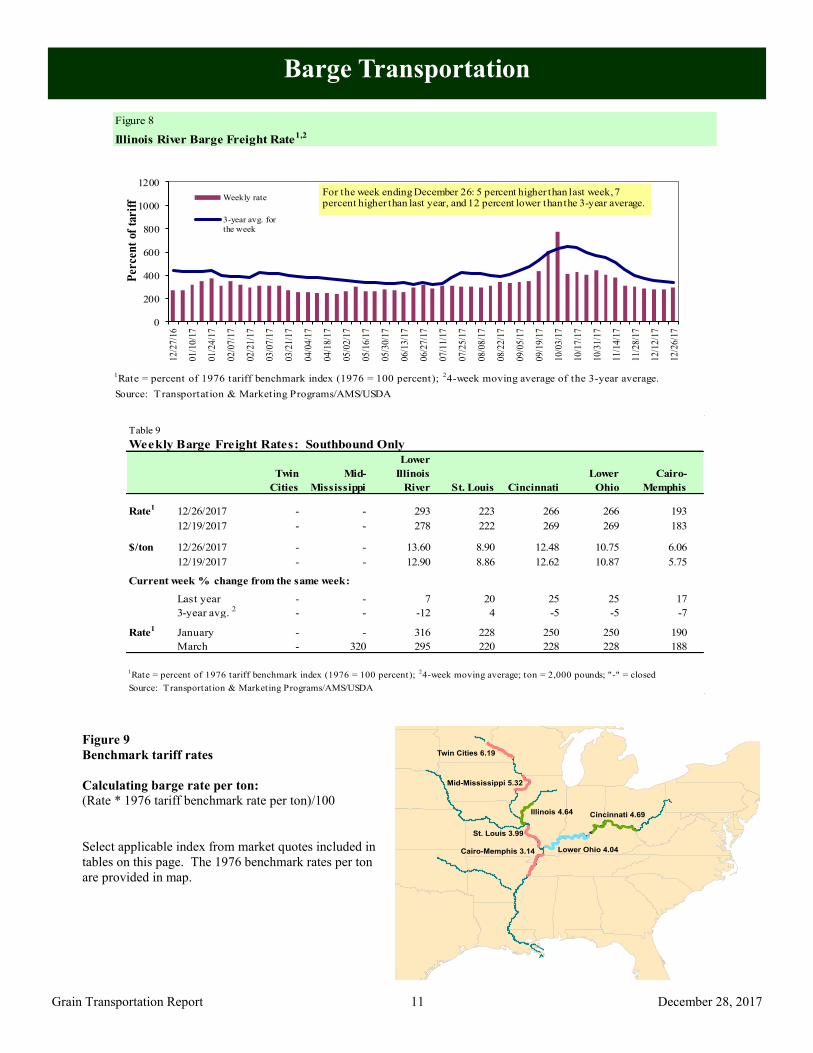
1Rate = percent of 1976 tariff benchmark index (1976 = 100 percent);
24-week moving average; ton = 2,000 pounds; "-" = closed
December 28, 2017
Grain Transportation Report 12
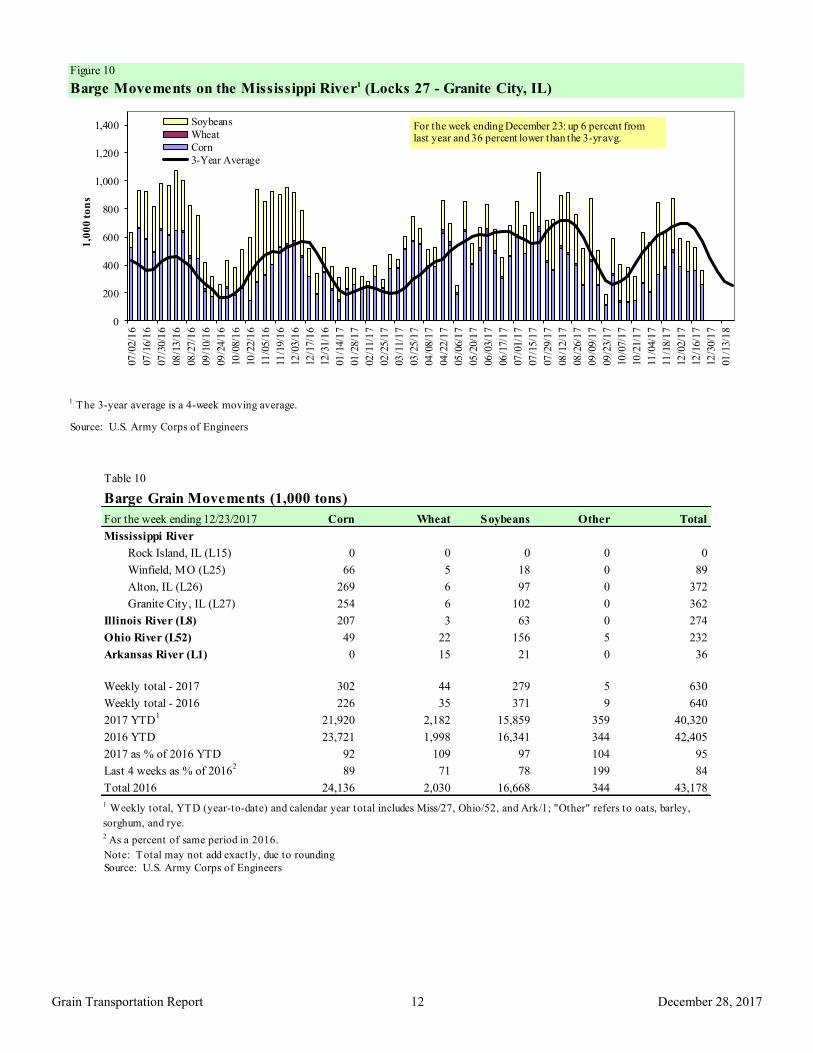
Figure 10
Barge Movements on the Mississippi River1 (Locks 27 - Granite City, IL)
1 The 3-year average is a 4-week moving average.
Source: U.S. Army Corps of Engineers
0
200
400
600
800
1,000
1,200
1,40007
/02/1
6
07
/16/1
6
07
/30/1
6
08
/13/1
6
08
/27/1
6
09
/10/1
6
09
/24/1
6
10
/08/1
6
10
/22/1
6
11
/05/1
6
11
/19/1
6
12
/03/1
6
12
/17/1
6
12
/31/1
6
01
/14/1
7
01
/28/1
7
02
/11/1
7
02
/25/1
7
03
/11/1
7
03
/25/1
7
04
/08/1
7
04
/22/1
7
05
/06/1
7
05
/20/1
7
06
/03/1
7
06
/17/1
7
07
/01/1
7
07
/15/1
7
07
/29/1
7
08
/12/1
7
08
/26/1
7
09
/09/1
7
09
/23/1
7
10
/07/1
7
10
/21/1
7
11
/04/1
7
11
/18/1
7
12
/02/1
7
12
/16/1
7
12
/30/1
7
01
/13/1
8
1,0
00
to
ns
Soybeans
Wheat
Corn
3-Year Average
For the week ending December 23: up 6 percent fromlast year and 36 percent lower than the 3-yravg.
Table 10
Barge Grain Movements (1,000 tons)
For the week ending 12/23/2017 Corn Wheat Soybeans Other Total
Mississippi River
Rock Island, IL (L15) 0 0 0 0 0
Winfield, MO (L25) 66 5 18 0 89
Alton, IL (L26) 269 6 97 0 372
Granite City, IL (L27) 254 6 102 0 362
Illinois River (L8) 207 3 63 0 274
Ohio River (L52) 49 22 156 5 232
Arkansas River (L1) 0 15 21 0 36
Weekly total - 2017 302 44 279 5 630
Weekly total - 2016 226 35 371 9 640
2017 YTD1
21,920 2,182 15,859 359 40,320
2016 YTD 23,721 1,998 16,341 344 42,405
2017 as % of 2016 YTD 92 109 97 104 95
Last 4 weeks as % of 20162
89 71 78 199 84
Total 2016 24,136 2,030 16,668 344 43,178
2 As a percent of same period in 2016.
Source: U.S. Army Corps of Engineers
Note: Total may not add exactly, due to rounding
1 Weekly total, YTD (year-to-date) and calendar year total includes Miss/27, Ohio/52, and Ark/1; "Other" refers to oats, barley,
sorghum, and rye.
December 28, 2017
Grain Transportation Report 13
Figure 11
Source: U.S. Army Corps of Engineers
Upbound Empty Barges Transiting Mississippi River Locks 27, Arkansas River
Lock and Dam 1, and Ohio River Locks and Dam 52
0
100
200
300
400
500
600
700
8002
/11
/17
2/1
8/1
7
2/2
5/1
7
3/4
/17
3/1
1/1
7
3/1
8/1
7
3/2
5/1
7
4/1
/17
4/8
/17
4/1
5/1
7
4/2
2/1
7
4/2
9/1
7
5/6
/17
5/1
3/1
7
5/2
0/1
7
5/2
7/1
7
6/3
/17
6/1
0/1
7
6/1
7/1
7
6/2
4/1
7
7/1
/17
7/8
/17
7/1
5/1
7
7/2
2/1
7
7/2
9/1
7
8/5
/17
8/1
2/1
7
8/1
9/1
7
8/2
6/1
7
9/2
/17
9/9
/17
9/1
6/1
7
9/2
3/1
7
9/3
0/1
7
10/
7/1
7
10/
14/
17
10/
21/
17
10/
28/
17
11/
4/1
7
11/
11/
17
11/
18/
17
11/
25/
17
12/
2/1
7
12/
9/1
7
12/
16/
17
12/
23/
17
Nu
mb
er o
f B
arg
es
Miss. Locks 27 Ark Lock 1 Ohio Locks 52
For the week ending December 23: 594 barges transited the locks, 165 barges lower than the previous week, and 11 percent lower than the 3-year avg.
Figure 12
Grain Barges for Export in New Orleans Region
Source: U.S. Army Corps of Engineers and GIPSA
0
200
400
600
800
1000
1200
9/3
/16
9/1
7/1
6
10
/1/1
6
10
/15
/16
10
/29
/16
11
/12
/16
11
/26
/16
12
/10
/16
12
/24
/16
1/7
/17
1/2
1/1
7
2/4
/17
2/1
8/1
7
3/4
/17
3/1
8/1
7
4/1
/17
4/1
5/1
7
4/2
9/1
7
5/1
3/1
7
5/2
7/1
7
6/1
0/1
7
6/2
4/1
7
7/8
/17
7/2
2/1
7
8/5
/17
8/1
9/1
7
9/2
/17
9/1
6/1
7
9/3
0/1
7
10/1
4/1
7
10/2
8/1
7
11
/11
/17
11
/25
/17
12
/9/1
7
12
/23
/17
Downbound Grain Barges Locks 27, 1, and 52
Grain Barges Unloaded in New Orleans
Nu
mb
er o
f b
arges
For the week ending December 23: 396 grain bargesmoved down river, 23 percent lower than last week, 728grain barges were unloaded in New Orleans, 21 percent
lower than the previous week.
December 28, 2017
Grain Transportation Report 14
The weekly diesel price provides a proxy for trends in U.S. truck rates as diesel fuel is a significant expense for truck grain move-
ments.
Truck Transportation
Table 11
Change from
Region Location Price Week ago Year ago
I East Coast 2.904 0.007 0.331
New England 2.943 0.019 0.332
Central Atlantic 3.068 0.008 0.381
Lower Atlantic 2.782 0.004 0.304
II Midwest2 2.854 0.001 0.365
III Gulf Coast3 2.708 0.011 0.287
IV Rocky Mountain 2.948 -0.010 0.432
V West Coast 3.312 -0.015 0.505
West Coast less California 3.026 -0.018 0.299
California 3.539 -0.013 0.668
Total U.S. 2.903 0.002 0.363
1Diesel fuel prices include all taxes. Prices represent an average of all types of diesel fuel.
2Same as North Central 3Same as South Central
Source: Energy Information Administration/U.S. Department of Energy (www.eia.doe.gov)
Query--http://www.fas.usda.gov/esrquery/. Total commitments change (net sales) from prior week could include
revisions from previous week's outstanding sales or accumulated sales.
December 28, 2017
Grain Transportation Report 16
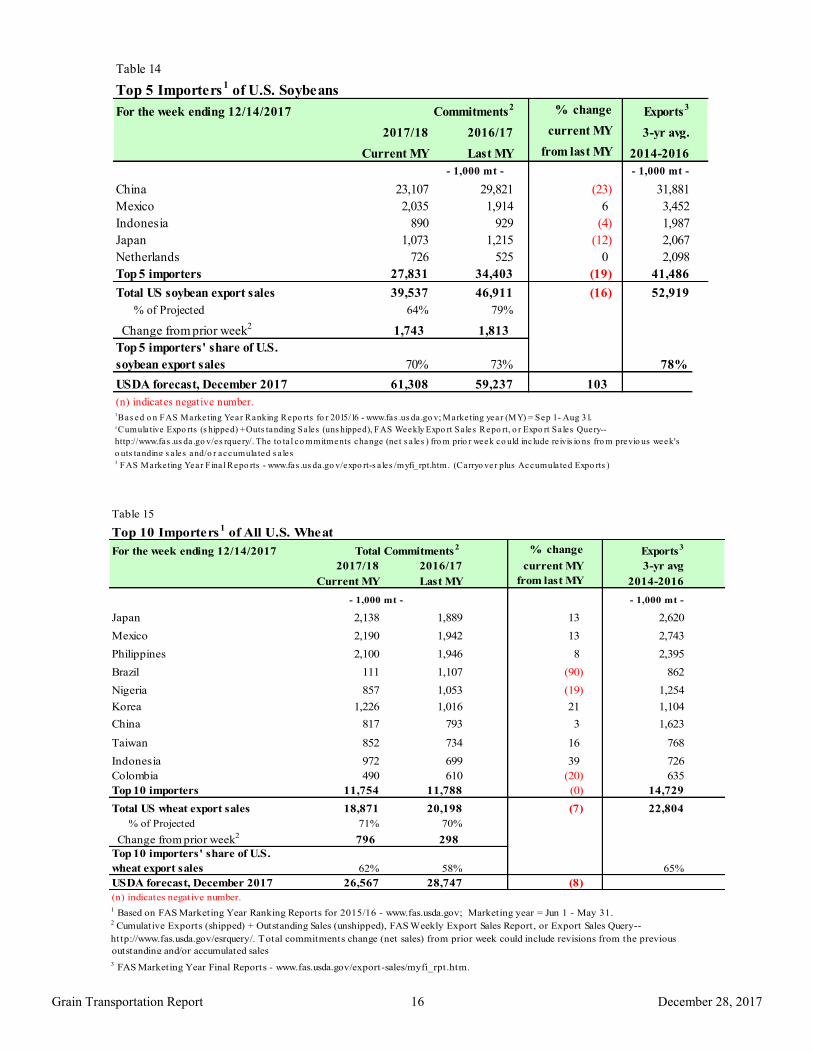
Table 14
Top 5 Importers1 of U.S. Soybeans
For the week ending 12/14/2017 % change
Exports3
2017/18 2016/17 current MY 3-yr avg.
Current MY Last MY from last MY 2014-2016
- 1,000 mt - - 1,000 mt -
China 23,107 29,821 (23) 31,881
Mexico 2,035 1,914 6 3,452
Indonesia 890 929 (4) 1,987
Japan 1,073 1,215 (12) 2,067
Netherlands 726 525 0 2,098
Top 5 importers 27,831 34,403 (19) 41,486
Total US soybean export sales 39,537 46,911 (16) 52,919
% of Projected 64% 79%
Change from prior week2
1,743 1,813
Top 5 importers' share of U.S.
soybean export sales 70% 73% 78%
USDA forecast, December 2017 61,308 59,237 103
1Bas ed o n FAS Marketing Year Ranking Repo rts fo r 2015/16 - www.fas .us da .go v; Marketing year (MY) = Sep 1 - Aug 31.
Total
Commitments2
3 FAS Marketing Year Fina l Repo rts - www.fas .us da .go v/expo rt-s a les /myfi_rpt.htm. (Carryo ver plus Accumula ted Expo rts )
(n) indicates negative number.
2Cumula tive Expo rts (s hipped) + Outs tanding Sales (uns hipped), FAS Weekly Expo rt Sa les Repo rt, o r Expo rt Sa les Query--
http://www.fas .us da .go v/es rquery/. The to ta l co mmitments change (ne t s a les ) fro m prio r week co uld inc lude re ivis io ns fro m previo us week's
o uts tanding s a les and/o r accumula ted s a les
Table 15
Top 10 Importers1 of All U.S. Wheat
For the week ending 12/14/2017 % change Exports3
2017/18 2016/17 current MY 3-yr avg
Current MY Last MY from last MY 2014-2016
- 1,000 mt -
Japan 2,138 1,889 13 2,620
Mexico 2,190 1,942 13 2,743
Philippines 2,100 1,946 8 2,395
Brazil 111 1,107 (90) 862
Nigeria 857 1,053 (19) 1,254
Korea 1,226 1,016 21 1,104
China 817 793 3 1,623
Taiwan 852 734 16 768
Indonesia 972 699 39 726
Colombia 490 610 (20) 635
Top 10 importers 11,754 11,788 (0) 14,729
Total US wheat export sales 18,871 20,198 (7) 22,804
% of Projected 71% 70%
Change from prior week2
796 298
Top 10 importers' share of U.S.
wheat export sales 62% 58% 65%
USDA forecast, December 2017 26,567 28,747 (8)
1 Based on FAS Marketing Year Ranking Reports for 2015/16 - www.fas.usda.gov; Marketing year = Jun 1 - May 31.
outstanding and/or accumulated sales
Total Commitments2
3 FAS Marketing Year Final Reports - www.fas.usda.gov/export-sales/myfi_rpt.htm.
Total 2,469 3,170 78 129,819 133,979 97 82 91 136,6271 Data includes revisions from prior weeks; some regional totals may not add exactly due to rounding.
Source: Grain Inspection, Packers and Stockyards Administration/USDA (www.gipsa.usda.gov); YTD= year-to-date; n/a = not applicable
Last 4-weeks as % of:
Port Regions 2016 Total*2017 YTD*
December 28, 2017
Grain Transportation Report 18
Figure 14
U.S. grain inspected for export (wheat, corn, and soybeans)
Source: Grain Inspection, Packers and Stockyards Administration/USDA (www.gipsa.usda.gov)
Note: 3-year average consists of 4-week running average
0
20
40
60
80
100
120
140
160
180
200
5/2
6/2
016
6/2
3/2
016
7/2
1/2
016
8/1
8/2
016
9/1
5/2
016
10/1
3/2
016
11/1
0/2
016
12
/8/2
016
1/5
/201
7
2/2
/201
7
3/2
/201
7
3/3
0/2
017
4/2
7/2
017
5/2
5/2
017
6/2
2/2
017
7/2
0/2
017
8/1
7/2
017
9/1
4/2
017
10/1
2/2
017
11
/9/2
017
12
/7/2
017
1/4
/201
8
2/1
/201
8
3/1
/201
8
3/2
9/2
018
4/2
6/2
018
Mil
lion
bu
shels
(m
bu
)
Current week 3-year average
For the week ending Dec. 21: 92.3 mbu, down 22 percent from the previous week, down 25 percent from same week last year, and down 18 percent from the 3-year average.
Figure 15
U.S. Grain Inspections: U.S. Gulf and PNW1 (wheat, corn, and soybeans)
-
10
20
30
40
50
60
70
80
90
100
5/5
/16
6/5
/16
7/5
/16
8/5
/16
9/5
/16
10/5
/16
11/5
/16
12/5
/16
1/5
/17
2/5
/17
3/5
/17
4/5
/17
5/5
/17
6/5
/17
7/5
/17
8/5
/17
9/5
/17
10/5
/17
11/5
/17
12/5
/17
1/5
/18
2/5
/18
3/5
/18
4/5
/18
Mil
lion
bu
shels
(m
bu
)
Miss. Gulf 3-Year avg - Miss. Gulf
PNW 3-Year avg - PNW
Texas Gulf 3-Year avg - TX Gulf
Source: Grain Inspection, Packers and Stockyards Administration/USDA (www.gipsa.usda.gov)
region region types date (metric tons) (US$/metric ton)
U.S. Gulf China Heavy Grain Jan 1/10 60,000 45.50
U.S. Gulf China Heavy Grain Dec 15/20 60,000 44.00
U.S. Gulf China Heavy Grain Dec 10/20 60,000 43.25
U.S. Gulf China Heavy Grain Nov 27/Dec 5 47,700 40.50
U.S. Gulf China Heavy Grain Nov 20/30 66,000 41.25
U.S. Gulf China Heavy Grain Nov 20/30 66,000 42.00
U.S. Gulf China Heavy Grain Nov 15/25 65,000 43.85
U.S. Gulf China Heavy Grain Nov 10/20 66,000 43.75
U.S. Gulf China Heavy Grain Nov 10/15 66,000 40.25
U.S. Gulf China Heavy Grain Nov 1/10 66,000 42.00
U.S. Gulf China Heavy Grain Nov 1/10 66,000 41.75
U.S. Gulf China Heavy Grain Nov 1/10 66,000 41.25
U.S. Gulf China Heavy Grain Nov 1/10 66,000 42.00
U.S. Gulf China Heavy Grain Nov 1/10 66,000 41.50
U.S. Gulf Dakar Wheat Nov 20/30 7,500 73.89*
U.S. Gulf Somali Sorghum Dec 1/10 10,640 192.10*
PNW China Heavy Grain Dec 23/30 60,000 22.25
PNW China Heavy Grain Dec 15/24 60,000 23.75
PNW South Korea Heavy Grain Dec 14/20 60,000 24.00
Brazil China Heavy Grain Dec 1/10 60,000 31.90
Brazil China Heavy Grain Nov 20/30 60,000 33.75
Brazil China Heavy Grain Nov 1/10 60,000 31.90
Brazil China Heavy Grain Oct 25/Nov 10 60,000 32.50
Brazil S. Korea Heavy Grain Nov 22/29 63,000 33.25
Rates shown are per metric ton (2,204.62 lbs. = 1 metric ton), F.O.B., except where otherwise indicated; op = option *50 percent of food aid from the United States is required to be shipped on U.S.-flag vessels.
Source: Maritime Research Inc. (www.maritime-research.com)
December 28, 2017
Grain Transportation Report 21
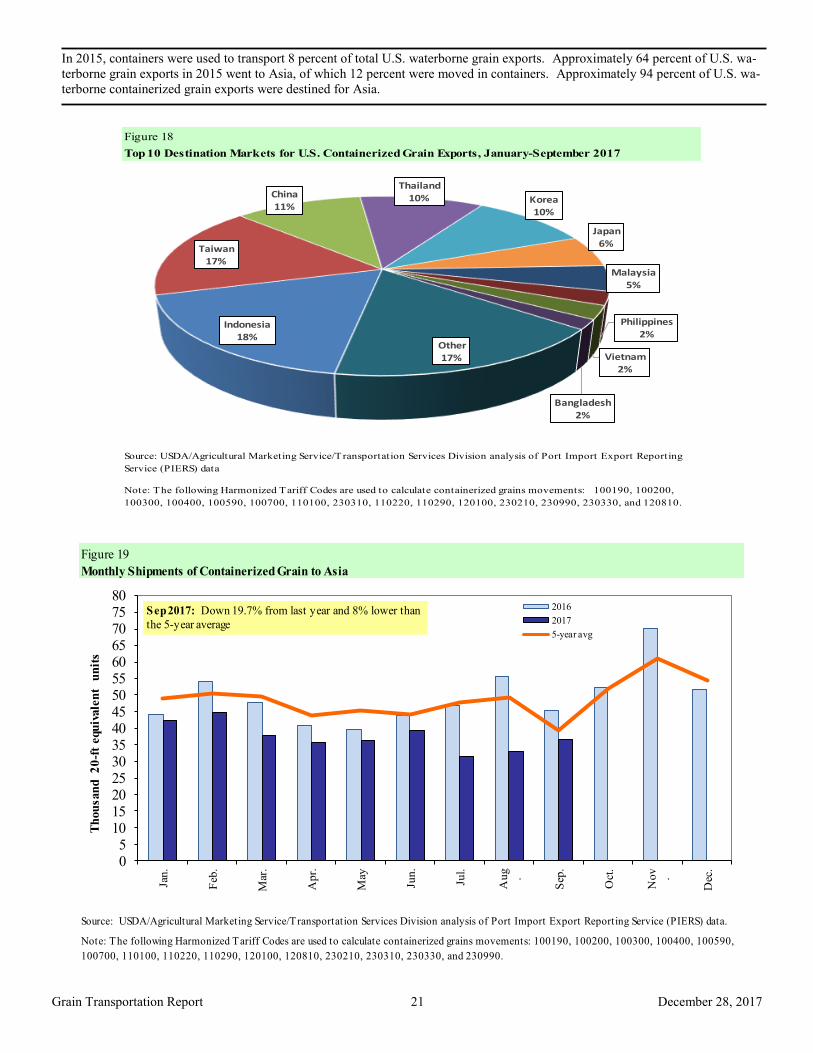
In 2015, containers were used to transport 8 percent of total U.S. waterborne grain exports. Approximately 64 percent of U.S. wa-
terborne grain exports in 2015 went to Asia, of which 12 percent were moved in containers. Approximately 94 percent of U.S. wa-
terborne containerized grain exports were destined for Asia.
Figure 18
Top 10 Destination Markets for U.S. Containerized Grain Exports, January-September 2017
Source: USDA/Agricultural Marketing Service/Transportation Services Division analysis of Port Import Export Reporting
Service (PIERS) data
Note: The following Harmonized Tariff Codes are used to calculate containerized grains movements: 100190, 100200,
Subscription Information: Send relevant information to [email protected] for an electronic
copy (printed copies are also available upon request).
Preferred citation: U.S. Dept. of Agriculture, Agricultural Marketing Service. Grain Transportation Report.
December 28, 2017. Web: http://dx.doi.org/10.9752/TS056.12-28-2017
Contacts and Links
In accordance with Federal civil rights law and U.S. Department of Agriculture (USDA) civil rights regulations and policies, the USDA, its
Agencies, offices, and employees, and institutions participating in or administering USDA programs are prohibited from discriminating based on
race, color, national origin, religion, sex, gender identity (including gender expression), sexual orientation, disability, age, marital status, family/
parental status, income derived from a public assistance program, political beliefs, or reprisal or retaliation for prior civil rights activity, in any
program or activity conducted or funded by USDA (not all bases apply to all programs). Remedies and complaint filing deadlines vary by pro-
gram or incident.
Persons with disabilities who require alternative means of communication for program information (e.g., Braille, large print, audiotape, American
Sign Language, etc.) should contact the responsible Agency or USDA's TARGET Center at (202) 720-2600 (voice and TTY) or contact USDA
through the Federal Relay Service at (800) 877-8339. Additionally, program information may be made available in languages other than English.
To file a program discrimination complaint, complete the USDA Program Discrimination Complaint Form, AD-3027, found online at How to
File a Program Discrimination Complaint and at any USDA office or write a letter addressed to USDA and provide in the letter all of the infor-
mation requested in the form. To request a copy of the complaint form, call (866) 632-9992. Submit your completed form or letter to USDA by:
(1) mail: U.S. Department of Agriculture, Office of the Assistant Secretary for Civil Rights, 1400 Independence Avenue, SW, Washington, D.C.
20250-9410; (2) fax: (202) 690-7442; or (3) email: [email protected].