United States Department of Agriculture Grain: Foreign Agricultural Service World Markets and Trade Circular Series FG 02-06 February 2006 Short Crops Reduce Argentine Grain Exports MMT Year to Year Production Change Marketing Year Grain Exports Decline MMT 8 6 4 2 0 -2 -4 -6 -8 -10 Wheat Corn 24 20 16 12 8 4 00/01 02/03 03/04 04/05 05/06 0 00/01 02/03 03/04 04/05 05/06 Sharply lower corn and wheat production this year is expected to drop Argentine grain exports to a 7-year low . While last year record exports made it the world’s second largest grain exporter, this year it is expected to fall to fifth place. For corn, lower area and unfavorable growing conditions have curtailed production. This, coupled with robust domestic feed demand, has added upward pressure to prices. Recent FOB quotes (Up River) are at or above U.S. Gulf prices, which has not happened for about 3 years. While new crop sales remain slightly ahead of last year, the pace has slowed considerably in recent weeks. For wheat, production fell this year as dryness at planting sharply reduced area (harvested area is currently estimated at a 10-year low). Smaller exportable supplies have already impacted sales, which are currently down 25 percent from this time last year. More dramatically, with stronger demand from neighboring Brazil, current sales to other markets are down two-thirds compared to this time last year. Approved by the World Agricultural Outlook Board - USDA
Transcript
United States Department of Agriculture Grain: Foreign Agricultural Service World Markets and Trade Circular Series FG 02-06 February 2006
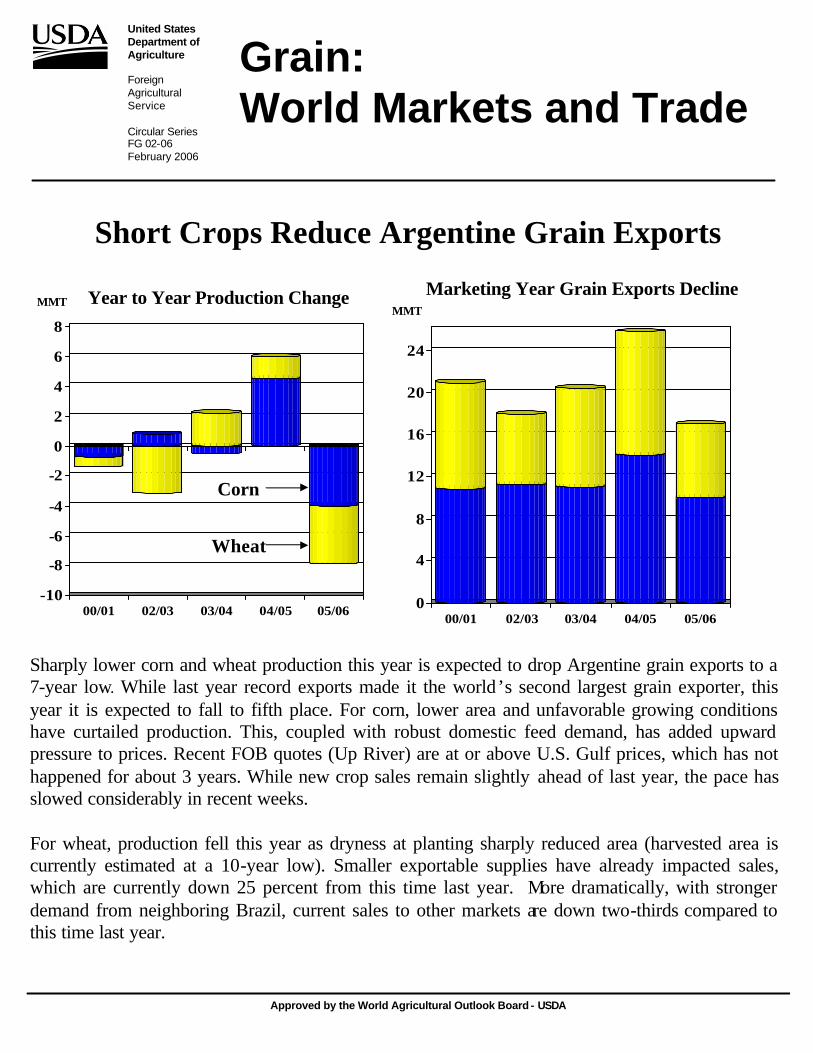
Short Crops Reduce Argentine Grain Exports
MMT Year to Year Production Change Marketing Year Grain Exports Decline MMT
Sharply lower corn and wheat production this year is expected to drop Argentine grain exports to a 7-year low. While last year record exports made it the world’s second largest grain exporter, this year it is expected to fall to fifth place. For corn, lower area and unfavorable growing conditions have curtailed production. This, coupled with robust domestic feed demand, has added upward pressure to prices. Recent FOB quotes (Up River) are at or above U.S. Gulf prices, which has not happened for about 3 years. While new crop sales remain slightly ahead of last year, the pace has slowed considerably in recent weeks.
For wheat, production fell this year as dryness at planting sharply reduced area (harvested area is currently estimated at a 10-year low). Smaller exportable supplies have already impacted sales, which are currently down 25 percent from this time last year. More dramatically, with stronger demand from neighboring Brazil, current sales to other markets are down two-thirds compared to this time last year.
Approved by the World Agricultural Outlook Board - USDA
TABLE OF CONTENTS
Summary Table All Grain Summary......................................................................................3
World Markets and Trade: Commentary and Current Data Wheat .........................................................................................................4Rice .......................................................................................................... 10Coarse Grains ............................................................................................ 15
Historical Data Series for Selected Regions and Countries .......................... 35
Endnotes to Grain: World Markets and Trade ............................................ 50
Grain: World Markets and Trade, February 2006
2
ALL GRAIN SUMMARY
PRODUCTION, CONSUMPTION, STOCKS, AND TRADE
TOTAL FOREIGN COUNTRIES, USA, AND TOTAL WORLD
(MILLION METRIC TONS)
2001/02 2002/03 2003/04 2004/05 2005/06 WHEAT 12-Jan 12-Jan All Foreign Countries
USA Production 321.4 294.0 345.3 385.6 363.1 Imports 5.8 5.0 4.5 4.6 5.0 Exports 83.5 73.1 89.5 82.9 83.5
World Total, Trade 241.2 241.7 234.3 242.7 236.9
Trade data are reported on an international year basis. All other data are reported using marketing years. Rice production data is on a milled basis.
2005/06 9-Feb
558.9 591.5 127.2
57.3 2.4
32.3 27.5 14.7
110.2
401.9 411.2
7.1 0.4 4.0 3.7
26.6
659.9 729.6
298.7 2.2
241.3 52.3 66.0 99.5
1,620.7 1,732.3
363.1 5.0
83.5 236.3
3 February 2006
--
DG F/SA &F
WORLD MARKETS AND TRADE: COMMENTARY AND CURRENT DATA
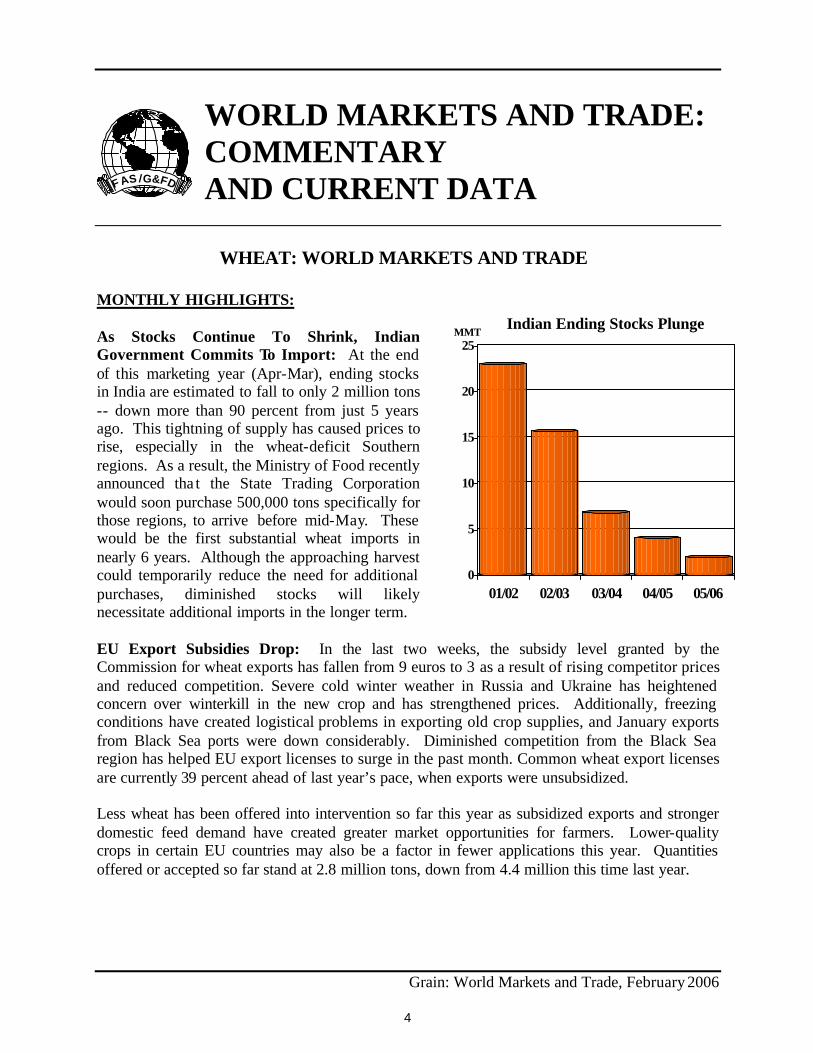
Government Commits To Import: At the end of this marketing year (Apr-Mar), ending stocks in India are estimated to fall to only 2 million tons
down more than 90 percent from just 5 years ago. This tightning of supply has caused prices to rise, especially in the wheat-deficit Southern regions. As a result, the Ministry of Food recently announced tha t the State Trading Corporation would soon purchase 500,000 tons specifically for those regions, to arrive before mid-May. These would be the first substantial wheat imports in nearly 6 years. Although the approaching harvest could temporarily reduce the need for additional purchases, diminished stocks will likely necessitate additional imports in the longer term.
WHEAT: WORLD MARKETS AND TRADE
MONTHLY HIGHLIGHTS:
As Stocks Continue To Shrink, Indian MMT Indian Ending Stocks Plunge
25
20
15
10
0
5
01/02 02/03 03/04 04/05 05/06
EU Export Subsidies Drop: In the last two weeks, the subsidy level granted by the Commission for wheat exports has fallen from 9 euros to 3 as a result of rising competitor prices and reduced competition. Severe cold winter weather in Russia and Ukraine has heightened concern over winterkill in the new crop and has strengthened prices. Additionally, freezing conditions have created logistical problems in exporting old crop supplies, and January exports from Black Sea ports were down considerably. Diminished competition from the Black Sea region has helped EU export licenses to surge in the past month. Common wheat export licenses are currently 39 percent ahead of last year’s pace, when exports were unsubsidized.
Less wheat has been offered into intervention so far this year as subsidized exports and stronger domestic feed demand have created greater market opportunities for farmers. Lower-quality crops in certain EU countries may also be a factor in fewer applications this year. Quantities offered or accepted so far stand at 2.8 million tons, down from 4.4 million this time last year.
Grain: World Markets and Trade, February 2006
4
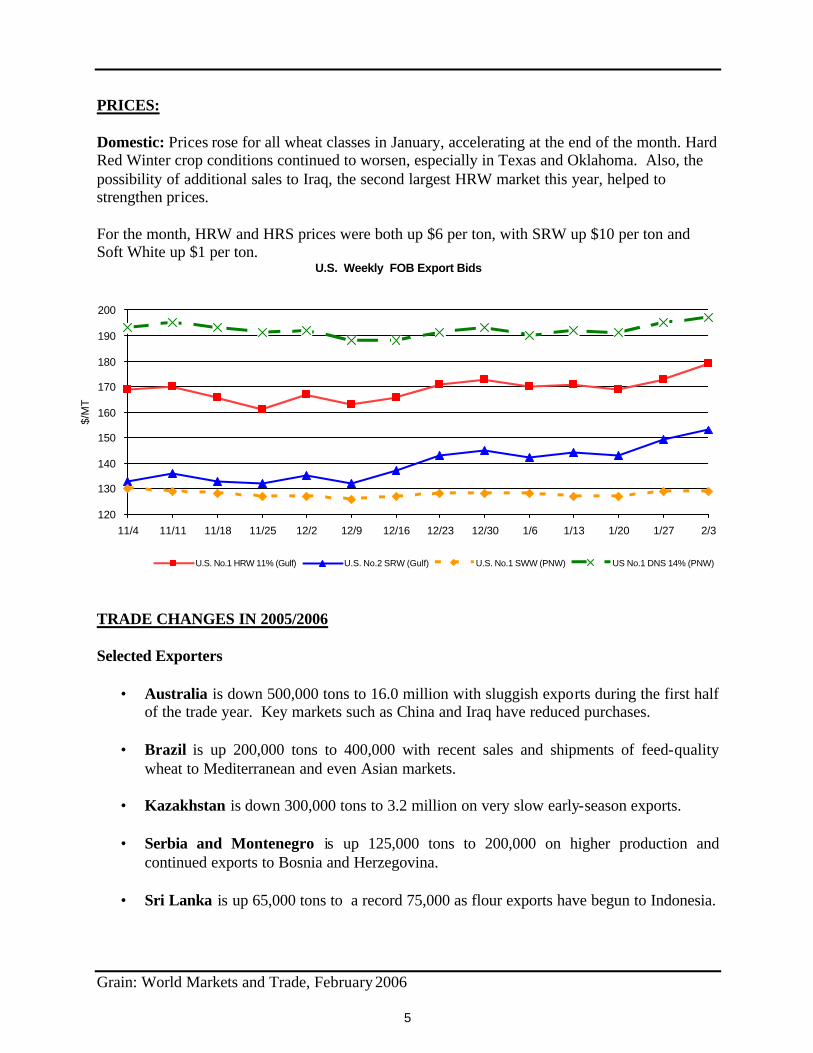
PRICES:
Domestic: Prices rose for all wheat classes in January, accelerating at the end of the month. Hard Red Winter crop conditions continued to worsen, especially in Texas and Oklahoma. Also, the possibility of additional sales to Iraq, the second largest HRW market this year, helped to strengthen prices.
For the month, HRW and HRS prices were both up $6 per ton, with SRW up $10 per ton and Soft White up $1 per ton.
U.S. No.1 HRW 11% (Gulf) U.S. No.2 SRW (Gulf) U.S. No.1 SWW (PNW) US No.1 DNS 14% (PNW)
TRADE CHANGES IN 2005/2006
Selected Exporters
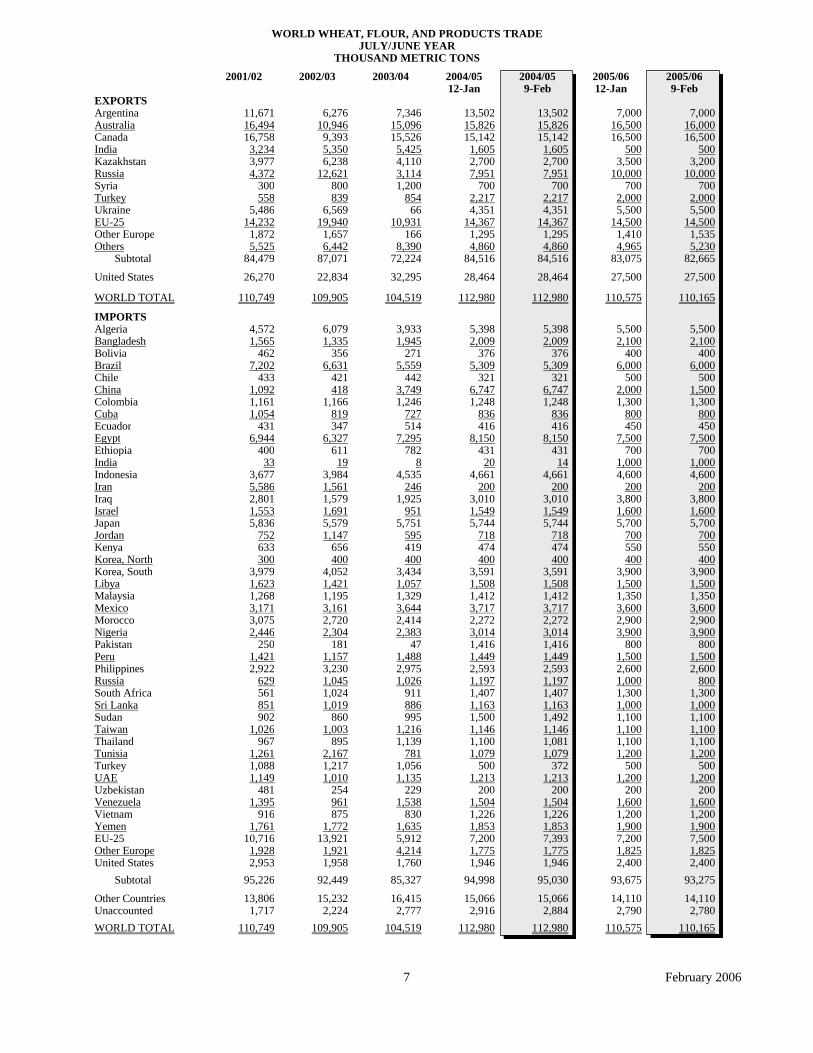
• Australia is down 500,000 tons to 16.0 million with sluggish exports during the first half of the trade year. Key markets such as China and Iraq have reduced purchases.
• Brazil is up 200,000 tons to 400,000 with recent sales and shipments of feed-quality wheat to Mediterranean and even Asian markets.
• Kazakhstan is down 300,000 tons to 3.2 million on very slow early-season exports.
• Serbia and Montenegro is up 125,000 tons to 200,000 on higher production and continued exports to Bosnia and Herzegovina.
• Sri Lanka is up 65,000 tons to a record 75,000 as flour exports have begun to Indonesia.
Grain: World Markets and Trade, February 2006
5
Selected Importers
• China is down 500,000 tons to 1.5 million as the import pace has faded in recent months.
• EU-25 is up 300,000 tons to 7.5 on robust early-season imports as well as a strong pace of licenses to date.
• Russia is down 200,000 tons on slower than expected imports from Kazakhstan.
Grain: World Markets and Trade, February 2006
6
WORLD WHEAT, FLOUR, AND PRODUCTS TRADEJULY/JUNE YEAR
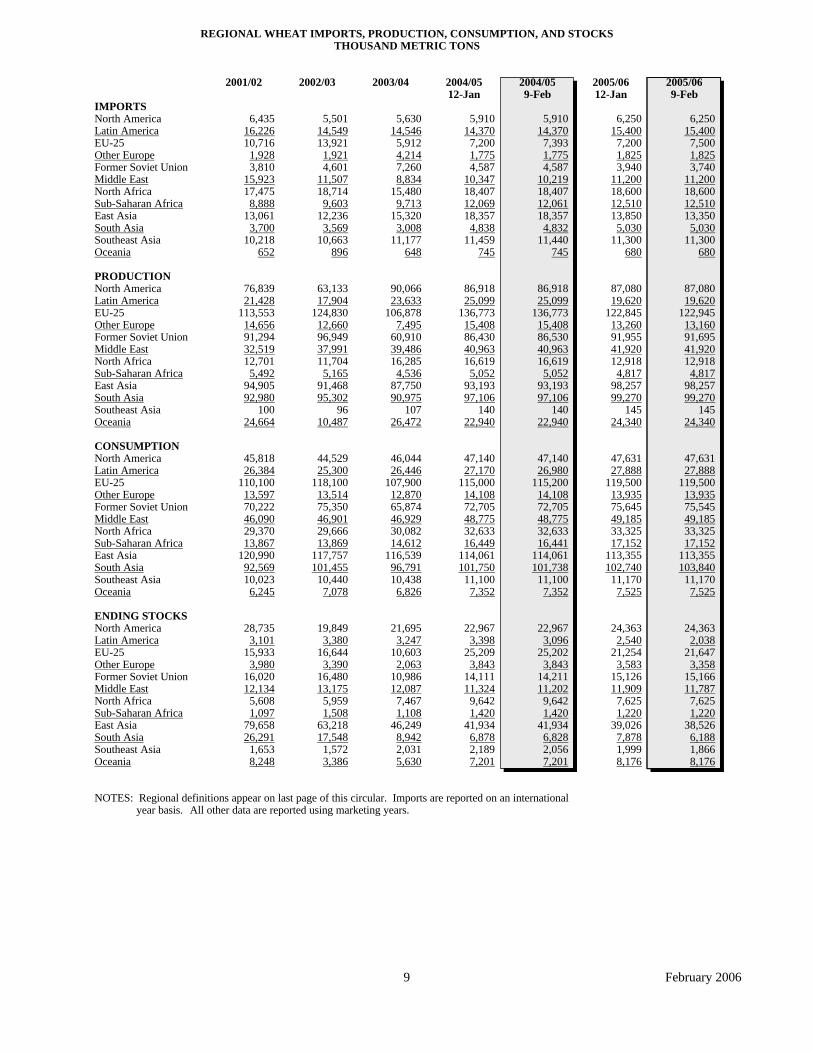
IMPORTS North America 6,435 5,501 5,630 5,910 6,250 Latin America 16,226 14,549 14,546 14,370 15,400 EU-25 10,716 13,921 5,912 7,200 7,200 Other Europe 1,928 1,921 4,214 1,775 1,825 Former Soviet Union 3,810 4,601 7,260 4,587 3,940 Middle East 15,923 11,507 8,834 10,347 11,200 North Africa 17,475 18,714 15,480 18,407 18,600 Sub-Saharan Africa 8,888 9,603 9,713 12,069 12,510 East Asia 13,061 12,236 15,320 18,357 13,850 South Asia 3,700 3,569 3,008 4,838 5,030 Southeast Asia 10,218 10,663 11,177 11,459 11,300 Oceania 652 896 648 745 680
PRODUCTION North America 76,839 63,133 90,066 86,918
2004/05 9-Feb
5,910 14,370 7,393 1,775 4,587
10,219 18,407 12,061 18,357 4,832
11,440 745
86,918 25,099
136,773 15,408 86,530 40,963 16,619 5,052
93,193 97,106
140 22,940
47,140 26,980
115,200 14,108 72,705 48,775 32,633 16,441
114,061 101,738
11,100 7,352
22,967 3,096
25,202 3,843
14,211 11,202 9,642 1,420
41,934 6,828 2,056 7,201
87,080 Latin America 21,428 17,904 23,633 25,099 19,620 EU-25 113,553 124,830 106,878 136,773 122,845 Other Europe 14,656 12,660 7,495 15,408 13,260 Former Soviet Union 91,294 96,949 60,910 86,430 91,955 Middle East 32,519 37,991 39,486 40,963 41,920 North Africa 12,701 11,704 16,285 16,619 12,918 Sub-Saharan Africa 5,492 5,165 4,536 5,052 4,817 East Asia 94,905 91,468 87,750 93,193 98,257 South Asia 92,980 95,302 90,975 97,106 99,270 Southeast Asia 100 96 107 140 145 Oceania 24,664 10,487 26,472 22,940 24,340
CONSUMPTION North America 45,818 44,529 46,044 47,140 47,631 Latin America 26,384 25,300 26,446 27,170 27,888 EU-25 110,100 118,100 107,900 115,000 119,500 Other Europe 13,597 13,514 12,870 14,108 13,935 Former Soviet Union 70,222 75,350 65,874 72,705 75,645 Middle East 46,090 46,901 46,929 48,775 49,185 North Africa 29,370 29,666 30,082 32,633 33,325 Sub-Saharan Africa 13,867 13,869 14,612 16,449 17,152 East Asia 120,990 117,757 116,539 114,061 113,355 South Asia 92,569 101,455 96,791 101,750 102,740 Southeast Asia 10,023 10,440 10,438 11,100 11,170 Oceania 6,245 7,078 6,826 7,352 7,525
ENDING STOCKS North America 28,735 19,849 21,695 22,967 24,363 Latin America 3,101 3,380 3,247 3,398 2,540 EU-25 15,933 16,644 10,603 25,209 21,254 Other Europe 3,980 3,390 2,063 3,843 3,583 Former Soviet Union 16,020 16,480 10,986 14,111 15,126 Middle East 12,134 13,175 12,087 11,324 11,909 North Africa 5,608 5,959 7,467 9,642 7,625 Sub-Saharan Africa 1,097 1,508 1,108 1,420 1,220 East Asia 79,658 63,218 46,249 41,934 39,026 South Asia 26,291 17,548 8,942 6,878 7,878 Southeast Asia 1,653 1,572 2,031 2,189 1,999 Oceania 8,248 3,386 5,630 7,201 8,176
NOTES: Regional definitions appear on last page of this circular. Imports are reported on an international year basis. All other data are reported using marketing years.
2005/06 9-Feb
6,250 15,400
7,500 1,825 3,740
11,200 18,600 12,510 13,350
5,030 11,300
680
87,080 19,620
122,945 13,160 91,695 41,920 12,918
4,817 98,257 99,270
145 24,340
47,631 27,888
119,500 13,935 75,545 49,185 33,325 17,152
113,355 103,840
11,170 7,525
24,363 2,038
21,647 3,358
15,166 11,787
7,625 1,220
38,526 6,188 1,866 8,176
9 February 2006
RICE: WORLD MARKETS AND TRADE
PRICES:
International: Thai prices jumped $10 this month mostly on currency fluctuations, with quotes currently at $306 per ton, FOB. Domestic prices continue to be supported by the mortgage scheme with over 600,000 tons of government stocks auctioned this month at near market prices. Vietnam prices are up $1 to $264 per ton, FOB, although with harvest approaching, there could be some downward pressure on prices in the short-term.
Domestic: U.S. long grain prices have strengthened over the past month, up $17, with #2/4 currently quoted at $368 per ton, FOB. This brings the price spread between Thai and U.S. rice to $62 per ton. Meanwhile, U.S. medium grain prices have stabilized; current quotes for #1/4 are $515 per ton, FOB.
TRADE CHANGES IN 2006
Selected Exporters
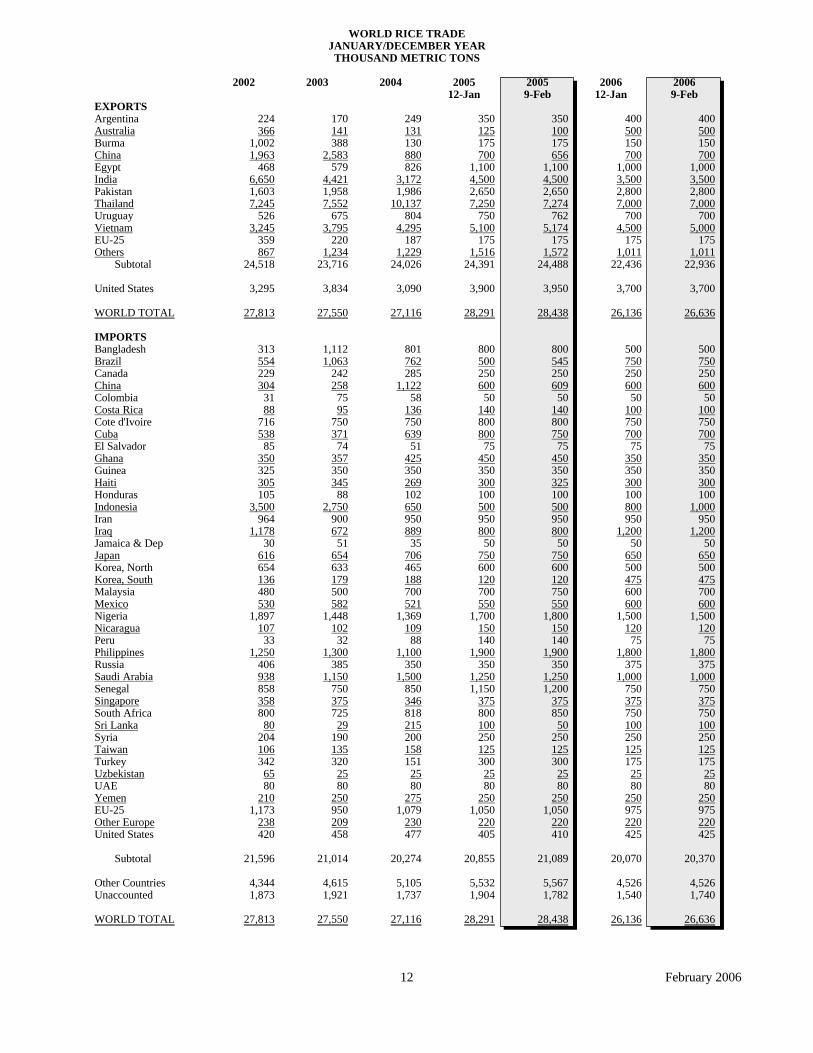
• Vietnam is increased 500,000 tons to 5.0 million because of its aggressive early-year sales pace.
Selected Importers
• Indonesia is boosted 200,000 tons to 1.0 million as imports will likely be needed to maintain buffer stocks once the harvest is over and to offset the recent rise in prices.
TRADE CHANGES IN 2005
Selected Exporters
• Australia is reduced 25,000 tons to 100,000 due to continued weakness in its export pace.
• The United States is increased 50,000 tons to a record 3.95 million tons due to a robust export pace.
• China, Thailand, Uruguay, and Vietnam are revised based on year-end data.
Selected Importers
• Brazil is raised 45,000 tons to 545,000 based on stronger than anticipated import demand during the last quarter of the year.
• Cuba is dropped 50,000 tons to 750,000 due to weak last quarter imports from Vietnam.
Grain: World Markets and Trade, February 2006
10
• Haiti is increased 25,000 tons to 325,000 because of steady import demand, mainly from the United States.
• Nigeria is boosted 100,000 tons to 1.8 million due to the strong pace of shipments from Thailand and India.
• Demand for fragrant brokens has pushed Senegal imports to a new record; the estimate is raised 50,000 tons to 1.2 million.
• South Africa is increased 50,000 tons to 850,000 due to strong parboiled shipments from Thailand and India.
Grain: World Markets and Trade, February 2006
11
WORLD RICE TRADE JANUARY/DECEMBER YEAR THOUSAND METRIC TONS
EXPORTS Argentina Australia Burma China Egypt India Pakistan Thailand Uruguay Vietnam EU-25 Others
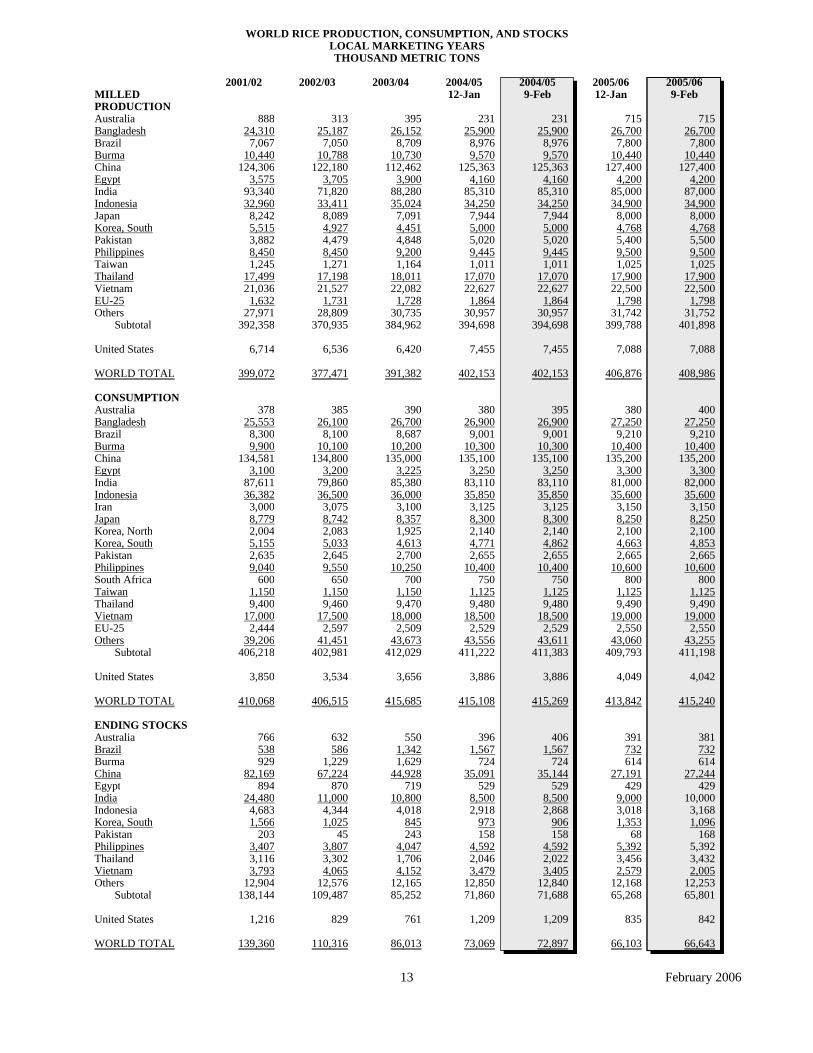
WORLD TOTAL 139,360 110,316 86,013 73,069 72,897 66,103 66,643
13 February 2006
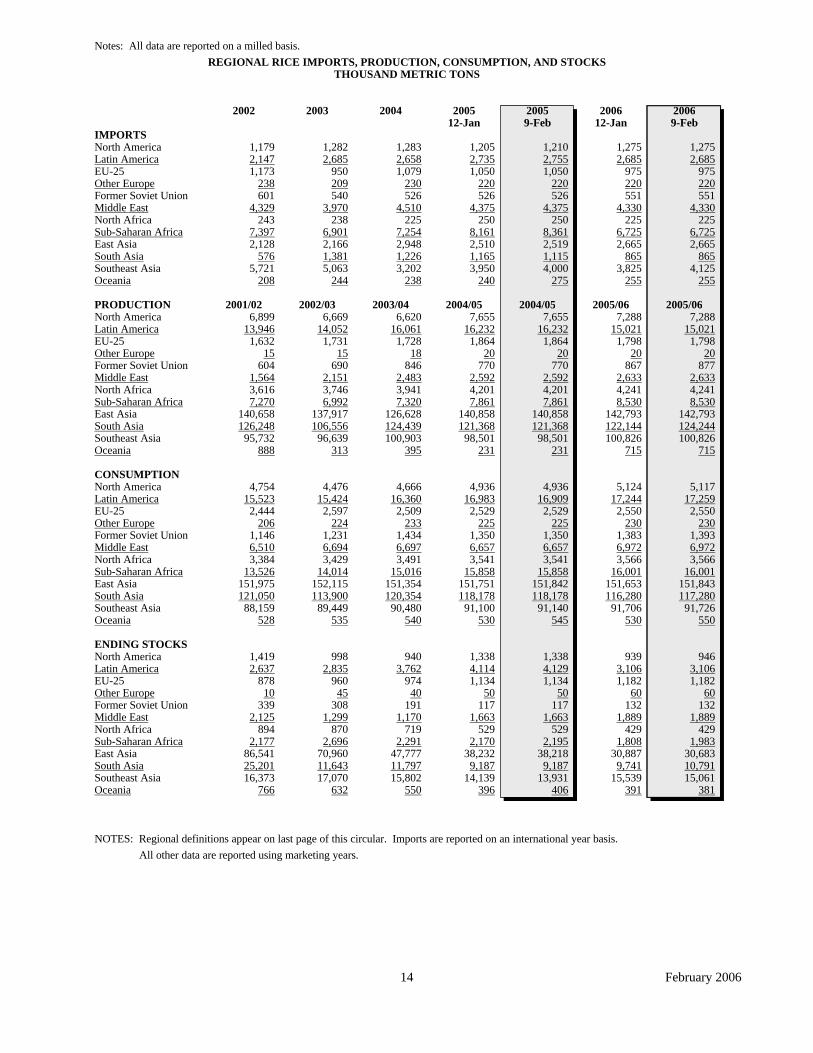
Notes: All data are reported on a milled basis. REGIONAL RICE IMPORTS, PRODUCTION, CONSUMPTION, AND STOCKS
THOUSAND METRIC TONS
2002 2003 2004 2005 2006 12-Jan 12-Jan
IMPORTS North America 1,179 1,282 1,283 1,205 1,275 Latin America 2,147 2,685 2,658 2,735 2,685 EU-25 1,173 950 1,079 1,050 975 Other Europe 238 209 230 220 220 Former Soviet Union 601 540 526 526 551 Middle East 4,329 3,970 4,510 4,375 4,330 North Africa 243 238 225 250 225 Sub-Saharan Africa 7,397 6,901 7,254 8,161 6,725 East Asia 2,128 2,166 2,948 2,510 2,665 South Asia 576 1,381 1,226 1,165 865 Southeast Asia 5,721 5,063 3,202 3,950 3,825 Oceania 208 244 238 240 255
PRODUCTION 2001/02 2002/03 2003/04 2004/05 2005/06 North America 6,899 6,669 6,620 7,655 7,288 Latin America 13,946 14,052 16,061 16,232 15,021 EU-25 1,632 1,731 1,728 1,864 1,798 Other Europe 15 15 18 20 20 Former Soviet Union 604 690 846 770 867 Middle East 1,564 2,151 2,483 2,592 2,633 North Africa 3,616 3,746 3,941 4,201 4,241 Sub-Saharan Africa 7,270 6,992 7,320 7,861 8,530 East Asia 140,658 137,917 126,628 140,858 142,793 South Asia 126,248 106,556 124,439 121,368 122,144 Southeast Asia 95,732 96,639 100,903 98,501 100,826 Oceania 888 313 395 231 715
CONSUMPTION North America 4,754 4,476 4,666 4,936
2005 9-Feb
1,210 2,755 1,050
220 526
4,375 250
8,361 2,519 1,115 4,000
275
2004/05 7,655
16,232 1,864
20 770
2,592 4,201 7,861
140,858 121,368
98,501 231
4,936 16,909 2,529
225 1,350 6,657 3,541
15,858 151,842 118,178
91,140 545
1,338 4,129 1,134
50 117
1,663 529
2,195 38,218 9,187
13,931 406
5,124 Latin America 15,523 15,424 16,360 16,983 17,244 EU-25 2,444 2,597 2,509 2,529 2,550 Other Europe 206 224 233 225 230 Former Soviet Union 1,146 1,231 1,434 1,350 1,383 Middle East 6,510 6,694 6,697 6,657 6,972 North Africa 3,384 3,429 3,491 3,541 3,566 Sub-Saharan Africa 13,526 14,014 15,016 15,858 16,001 East Asia 151,975 152,115 151,354 151,751 151,653 South Asia 121,050 113,900 120,354 118,178 116,280 Southeast Asia 88,159 89,449 90,480 91,100 91,706 Oceania 528 535 540 530 530
ENDING STOCKS North America 1,419 998 940 1,338 939 Latin America 2,637 2,835 3,762 4,114 3,106 EU-25 878 960 974 1,134 1,182 Other Europe 10 45 40 50 60 Former Soviet Union 339 308 191 117 132 Middle East 2,125 1,299 1,170 1,663 1,889 North Africa 894 870 719 529 429 Sub-Saharan Africa 2,177 2,696 2,291 2,170 1,808 East Asia 86,541 70,960 47,777 38,232 30,887 South Asia 25,201 11,643 11,797 9,187 9,741 Southeast Asia 16,373 17,070 15,802 14,139 15,539 Oceania 766 632 550 396 391
NOTES: Regional definitions appear on last page of this circular. Imports are reported on an international year basis. All other data are reported using marketing years.
2006 9-Feb
1,275 2,685
975 220 551
4,330 225
6,725 2,665
865 4,125
255
2005/06 7,288
15,021 1,798
20 877
2,633 4,241 8,530
142,793 124,244 100,826
715
5,117 17,259
2,550 230
1,393 6,972 3,566
16,001 151,843 117,280
91,726 550
946 3,106 1,182
60 132
1,889 429
1,983 30,683 10,791 15,061
381
14 February 2006
COARSE GRAINS: WORLD MARKETS AND TRADE
MONTHLY HIGHLIGHTS:
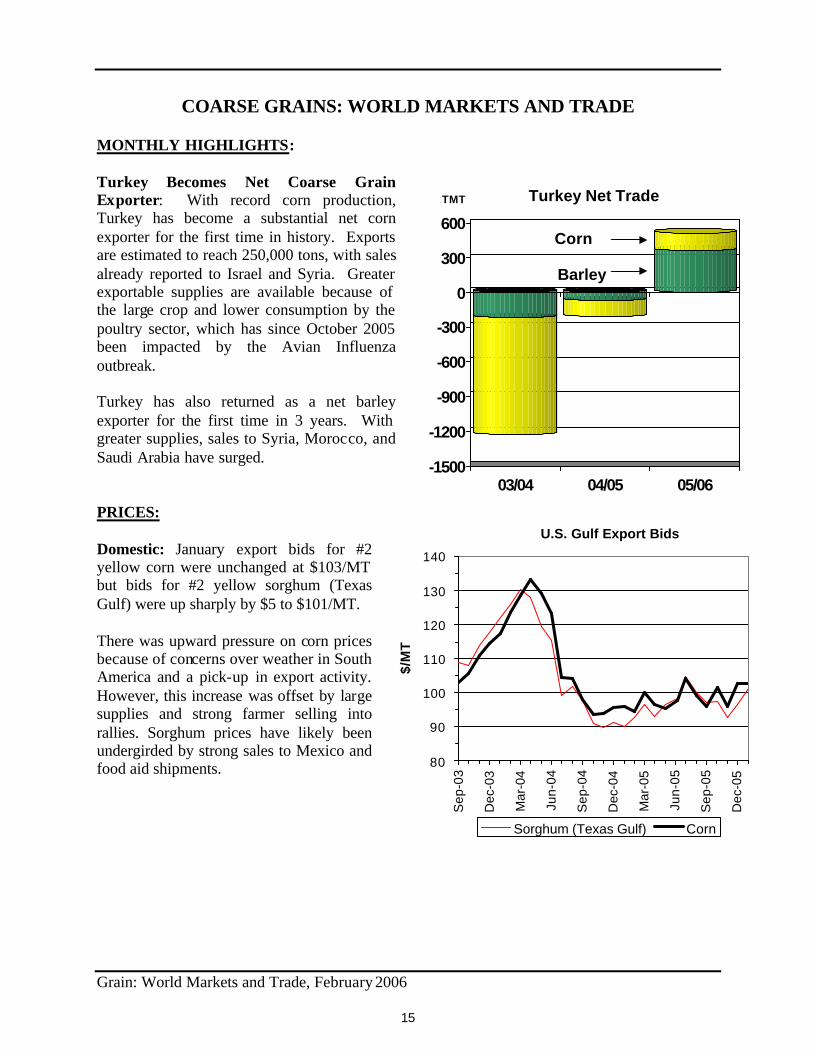
Turkey Becomes Net Coarse Grain Exporter: With record corn production, Turkey has become a substantial net corn exporter for the first time in history. Exports are estimated to reach 250,000 tons, with sales already reported to Israel and Syria. Greater exportable supplies are available because of the large crop and lower consumption by the poultry sector, which has since October 2005 been impacted by the Avian Influenza outbreak.
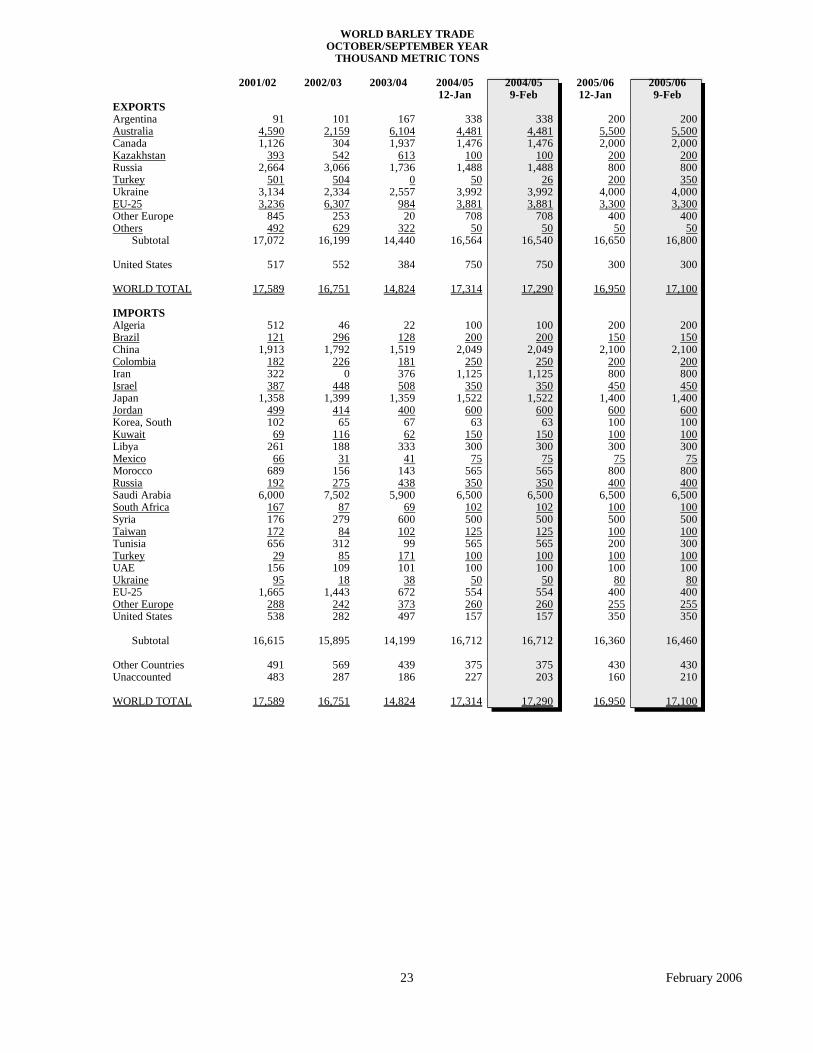
Turkey has also returned as a net barley exporter for the first time in 3 years. With greater supplies, sales to Syria, Morocco, and
TMT Turkey Net Trade
600
300
0
-300
-600
-900
-1200
-1500 03/04 04/05 05/06
Barley
Corn
U.S. Gulf Export Bids
Saudi Arabia have surged.
PRICES:
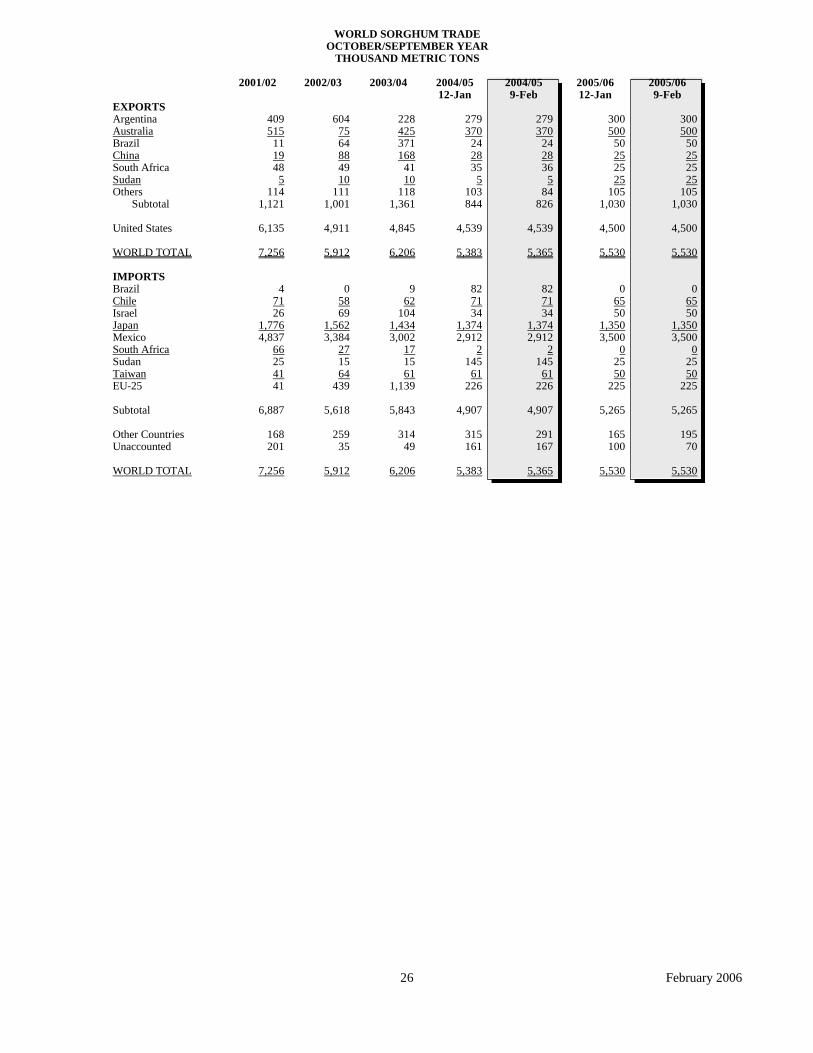
Domestic: January export bids for #2 yellow corn were unchanged at $103/MT but bids for #2 yellow sorghum (Texas Gulf) were up sharply by $5 to $101/MT.
There was upward pressure on corn prices because of concerns over weather in South America and a pick-up in export activity. However, this increase was offset by large supplies and strong farmer selling into rallies. Sorghum prices have likely been undergirded by strong sales to Mexico and food aid shipments.
$/M
T
Sep
-03
140
130
120
110
100
90
80
Sorghum (Texas Gulf) Corn
Dec
-03
Mar
-04
Jun-
04
Sep
-04
Dec
-04
Mar
-05
Jun-
05
Sep
-05
Dec
-05
Grain: World Markets and Trade, February 2006
15
TRADE CHANGES IN 2005/2006
Selected Exporters
• Argentina corn is slashed by 1.5 million tons to 11.0 million because of reduced production and stronger domestic feeding.
• Croatia corn is raised by 190,000 tons to 200,000 as a result of record production. Imports are cut by 150,000 tons to 50,000.
• Serbia and Montenegro corn is doubled to 1.0 million tons--a record--in light of strong sales to EU-25 and a record crop.
• Turkey barley is increased 150,000 tons to 350,000 based on strong export and sales data.
Selected Importers
• China corn is cut in half to 100,000 tons based on a lack of significant import activity.
• Colombia corn is raised by 200,000 tons to a record 2.4 million based on strong purchases of U.S. corn.
• Egypt corn is cut by 500,000 tons to 4.8 million amid indications of slack demand in the poultry industry.
• Indonesia corn is cut by 100,000 tons to 500,000 because of slow purchases from Argentina and Thailand.
• Russia corn is up 100,000 tons to 300,000 as a result of improved feed demand.
• Tunisia barley is increased 100,000 tons to 300,000 on strong purchases; corn is cut by 200,000 tons to 500,000, the lowest in 8 years, amid slow purchases of U.S. corn.
Grain: World Markets and Trade, February 2006
16
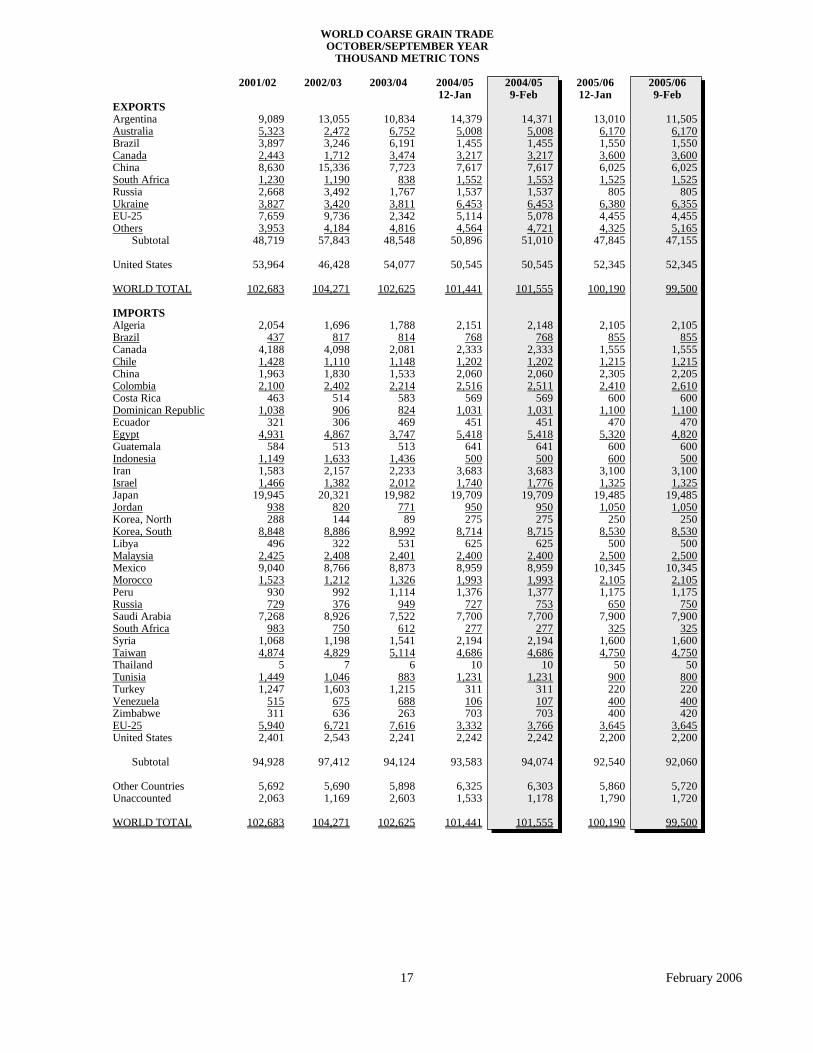
WORLD COARSE GRAIN TRADE OCTOBER/SEPTEMBER YEAR
THOUSAND METRIC TONS
2001/02 2002/03 2003/04
EXPORTS Argentina 9,089 13,055 10,834 Australia 5,323 2,472 6,752 Brazil 3,897 3,246 6,191 Canada 2,443 1,712 3,474 China 8,630 15,336 7,723 South Africa 1,230 1,190 838 Russia 2,668 3,492 1,767 Ukraine 3,827 3,420 3,811 EU-25 7,659 9,736 2,342 Others 3,953 4,184 4,816
Subtotal 48,719 57,843 48,548
United States 53,964 46,428 54,077
WORLD TOTAL 102,683 104,271 102,625
IMPORTS Algeria 2,054 1,696 1,788 Brazil 437 817 814 Canada 4,188 4,098 2,081 Chile 1,428 1,110 1,148 China 1,963 1,830 1,533 Colombia 2,100 2,402 2,214 Costa Rica 463 514 583 Dominican Republic 1,038 906 824 Ecuador 321 306 469 Egypt 4,931 4,867 3,747 Guatemala 584 513 513 Indonesia 1,149 1,633 1,436 Iran 1,583 2,157 2,233 Israel 1,466 1,382 2,012 Japan 19,945 20,321 19,982 Jordan 938 820 771 Korea, North 288 144 89 Korea, South 8,848 8,886 8,992 Libya 496 322 531 Malaysia 2,425 2,408 2,401 Mexico 9,040 8,766 8,873 Morocco 1,523 1,212 1,326 Peru 930 992 1,114 Russia 729 376 949 Saudi Arabia 7,268 8,926 7,522 South Africa 983 750 612 Syria 1,068 1,198 1,541 Taiwan 4,874 4,829 5,114 Thailand 5 7 6 Tunisia 1,449 1,046 883 Turkey 1,247 1,603 1,215 Venezuela 515 675 688 Zimbabwe 311 636 263 EU-25 5,940 6,721 7,616 United States 2,401 2,543 2,241
Subtotal 94,928 97,412 94,124
Other Countries 5,692 5,690 5,898 Unaccounted 2,063 1,169 2,603
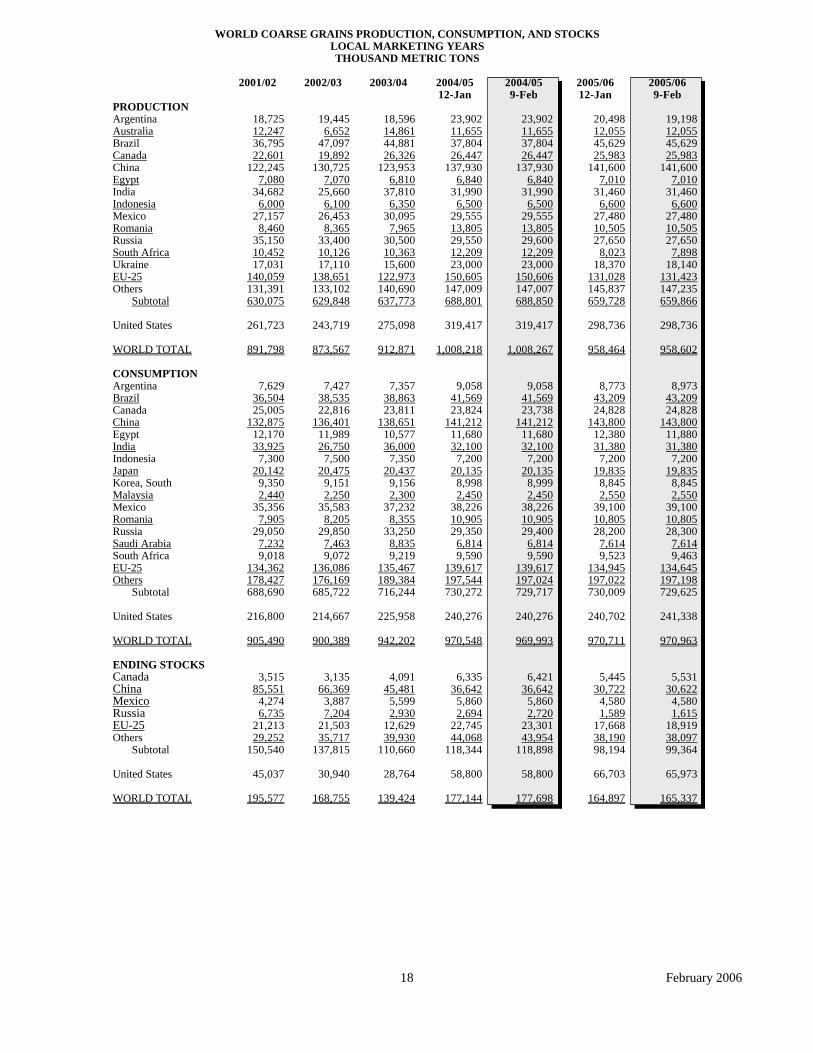
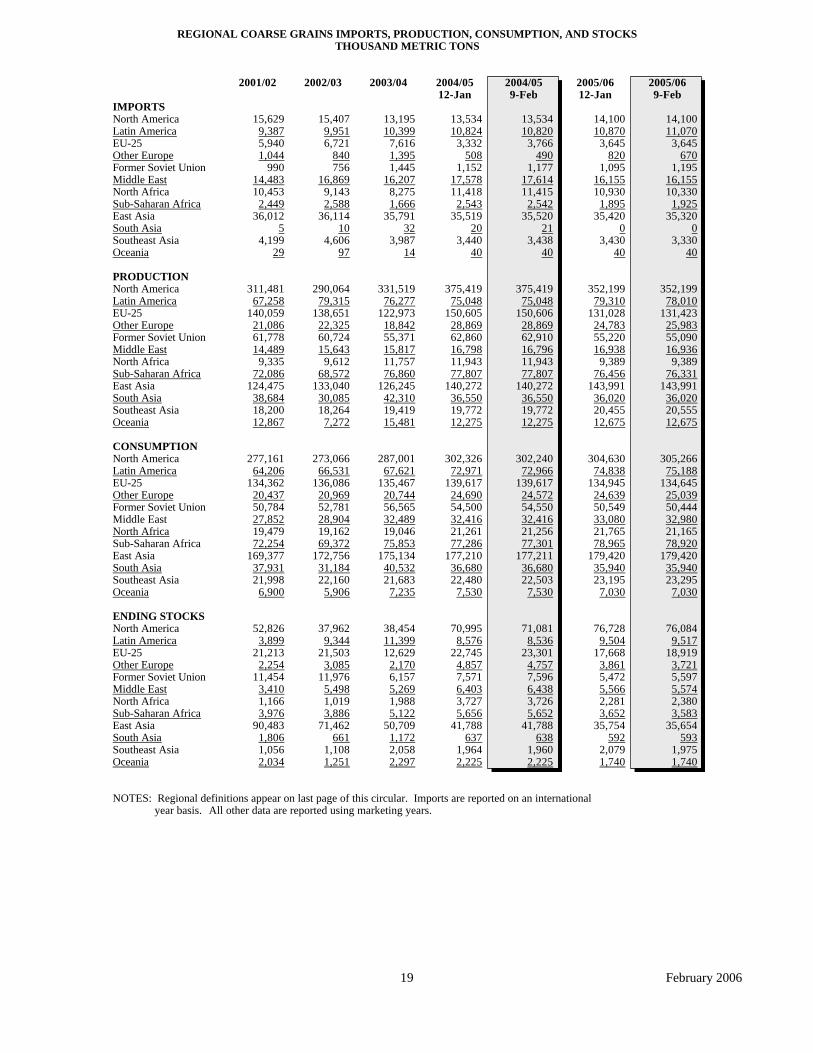
IMPORTS North America 15,629 15,407 13,195 13,534 14,100 Latin America 9,387 9,951 10,399 10,824 10,870 EU-25 5,940 6,721 7,616 3,332 3,645 Other Europe 1,044 840 1,395 508 820 Former Soviet Union 990 756 1,445 1,152 1,095 Middle East 14,483 16,869 16,207 17,578 16,155 North Africa 10,453 9,143 8,275 11,418 10,930 Sub-Saharan Africa 2,449 2,588 1,666 2,543 1,895 East Asia 36,012 36,114 35,791 35,519 35,420 South Asia 5 10 32 20 0 Southeast Asia 4,199 4,606 3,987 3,440 3,430 Oceania 29 97 14 40 40
PRODUCTION North America 311,481 290,064 331,519 375,419
2004/05 9-Feb
13,534 10,820
3,766 490
1,177 17,614 11,415
2,542 35,520
21 3,438
40
375,419 75,048
150,606 28,869 62,910 16,796 11,943 77,807
140,272 36,550 19,772 12,275
302,240 72,966
139,617 24,572 54,550 32,416 21,256 77,301
177,211 36,680 22,503
7,530
71,081 8,536
23,301 4,757 7,596 6,438 3,726 5,652
41,788 638
1,960 2,225
352,199 Latin America 67,258 79,315 76,277 75,048 79,310 EU-25 140,059 138,651 122,973 150,605 131,028 Other Europe 21,086 22,325 18,842 28,869 24,783 Former Soviet Union 61,778 60,724 55,371 62,860 55,220 Middle East 14,489 15,643 15,817 16,798 16,938 North Africa 9,335 9,612 11,757 11,943 9,389 Sub-Saharan Africa 72,086 68,572 76,860 77,807 76,456 East Asia 124,475 133,040 126,245 140,272 143,991 South Asia 38,684 30,085 42,310 36,550 36,020 Southeast Asia 18,200 18,264 19,419 19,772 20,455 Oceania 12,867 7,272 15,481 12,275 12,675
CONSUMPTION North America 277,161 273,066 287,001 302,326 304,630 Latin America 64,206 66,531 67,621 72,971 74,838 EU-25 134,362 136,086 135,467 139,617 134,945 Other Europe 20,437 20,969 20,744 24,690 24,639 Former Soviet Union 50,784 52,781 56,565 54,500 50,549 Middle East 27,852 28,904 32,489 32,416 33,080 North Africa 19,479 19,162 19,046 21,261 21,765 Sub-Saharan Africa 72,254 69,372 75,853 77,286 78,965 East Asia 169,377 172,756 175,134 177,210 179,420 South Asia 37,931 31,184 40,532 36,680 35,940 Southeast Asia 21,998 22,160 21,683 22,480 23,195 Oceania 6,900 5,906 7,235 7,530 7,030
ENDING STOCKS North America 52,826 37,962 38,454 70,995 76,728 Latin America 3,899 9,344 11,399 8,576 9,504 EU-25 21,213 21,503 12,629 22,745 17,668 Other Europe 2,254 3,085 2,170 4,857 3,861 Former Soviet Union 11,454 11,976 6,157 7,571 5,472 Middle East 3,410 5,498 5,269 6,403 5,566 North Africa 1,166 1,019 1,988 3,727 2,281 Sub-Saharan Africa 3,976 3,886 5,122 5,656 3,652 East Asia 90,483 71,462 50,709 41,788 35,754 South Asia 1,806 661 1,172 637 592 Southeast Asia 1,056 1,108 2,058 1,964 2,079 Oceania 2,034 1,251 2,297 2,225 1,740
NOTES: Regional definitions appear on last page of this circular. Imports are reported on an international year basis. All other data are reported using marketing years.
2005/06 9-Feb
14,100 11,070
3,645 670
1,195 16,155 10,330
1,925 35,320
0 3,330
40
352,199 78,010
131,423 25,983 55,090 16,936
9,389 76,331
143,991 36,020 20,555 12,675
305,266 75,188
134,645 25,039 50,444 32,980 21,165 78,920
179,420 35,940 23,295
7,030
76,084 9,517
18,919 3,721 5,597 5,574 2,380 3,583
35,654 593
1,975 1,740
19 February 2006
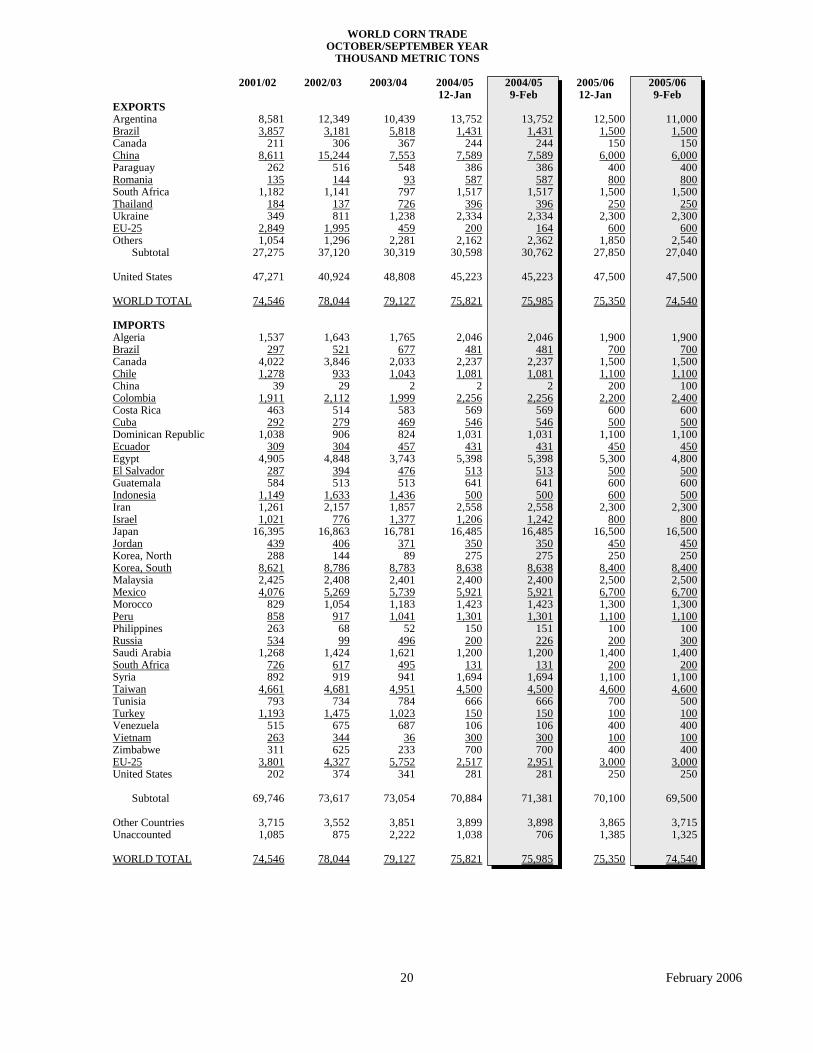
WORLD CORN TRADE OCTOBER/SEPTEMBER YEAR
THOUSAND METRIC TONS
2001/02 2002/03 2003/04
EXPORTS Argentina 8,581 12,349 10,439 Brazil 3,857 3,181 5,818 Canada 211 306 367 China 8,611 15,244 7,553 Paraguay 262 516 548 Romania 135 144 93 South Africa 1,182 1,141 797 Thailand 184 137 726 Ukraine 349 811 1,238 EU-25 2,849 1,995 459 Others 1,054 1,296 2,281
Subtotal 27,275 37,120 30,319
United States 47,271 40,924 48,808
WORLD TOTAL 74,546 78,044 79,127
IMPORTS Algeria 1,537 1,643 1,765 Brazil 297 521 677 Canada 4,022 3,846 2,033 Chile 1,278 933 1,043 China 39 29 2 Colombia 1,911 2,112 1,999 Costa Rica 463 514 583 Cuba 292 279 469 Dominican Republic 1,038 906 824 Ecuador 309 304 457 Egypt 4,905 4,848 3,743 El Salvador 287 394 476 Guatemala 584 513 513 Indonesia 1,149 1,633 1,436 Iran 1,261 2,157 1,857 Israel 1,021 776 1,377 Japan 16,395 16,863 16,781 Jordan 439 406 371 Korea, North 288 144 89 Korea, South 8,621 8,786 8,783 Malaysia 2,425 2,408 2,401 Mexico 4,076 5,269 5,739 Morocco 829 1,054 1,183 Peru 858 917 1,041 Philippines 263 68 52 Russia 534 99 496 Saudi Arabia 1,268 1,424 1,621 South Africa 726 617 495 Syria 892 919 941 Taiwan 4,661 4,681 4,951 Tunisia 793 734 784 Turkey 1,193 1,475 1,023 Venezuela 515 675 687 Vietnam 263 344 36 Zimbabwe 311 625 233 EU-25 3,801 4,327 5,752 United States 202 374 341
Subtotal 69,746 73,617 73,054
Other Countries 3,715 3,552 3,851 Unaccounted 1,085 875 2,222
WORLD TOTAL 74,546 78,044 79,127
2004/05 12-Jan
13,752 1,431
244 7,589
386 587
1,517 396
2,334 200
2,162 30,598
45,223
75,821
2,046 481
2,237 1,081
2 2,256
569 546
1,031 431
5,398 513 641 500
2,558 1,206
16,485 350 275
8,638 2,400 5,921 1,423 1,301
150 200
1,200 131
1,694 4,500
666 150 106 300 700
2,517 281
70,884
3,899 1,038
75,821
2004/05 9-Feb
13,752 1,431
244 7,589
386 587
1,517 396
2,334 164
2,362 30,762
45,223
75,985
2,046 481
2,237 1,081
2 2,256
569 546
1,031 431
5,398 513 641 500
2,558 1,242
16,485 350 275
8,638 2,400 5,921 1,423 1,301
151 226
1,200 131
1,694 4,500
666 150 106 300 700
2,951 281
71,381
3,898 706
75,985
2005/06 9-Feb
11,000 1,500
150 6,000
400 800
1,500 250
2,300 600
2,540 27,040
47,500
74,540
1,900 700
1,500 1,100
100 2,400
600 500
1,100 450
4,800 500 600 500
2,300 800
16,500 450 250
8,400 2,500 6,700 1,300 1,100
100 300
1,400 200
1,100 4,600
500 100 400 100 400
3,000 250
69,500
3,715 1,325
74,540
2005/06 12-Jan
12,500 1,500
150 6,000
400 800
1,500 250
2,300 600
1,850 27,850
47,500
75,350
1,900 700
1,500 1,100
200 2,200
600 500
1,100 450
5,300 500 600 600
2,300 800
16,500 450 250
8,400 2,500 6,700 1,300 1,100
100 200
1,400 200
1,100 4,600
700 100 400 100 400
3,000 250
70,100
3,865 1,385
75,350
20 February 2006
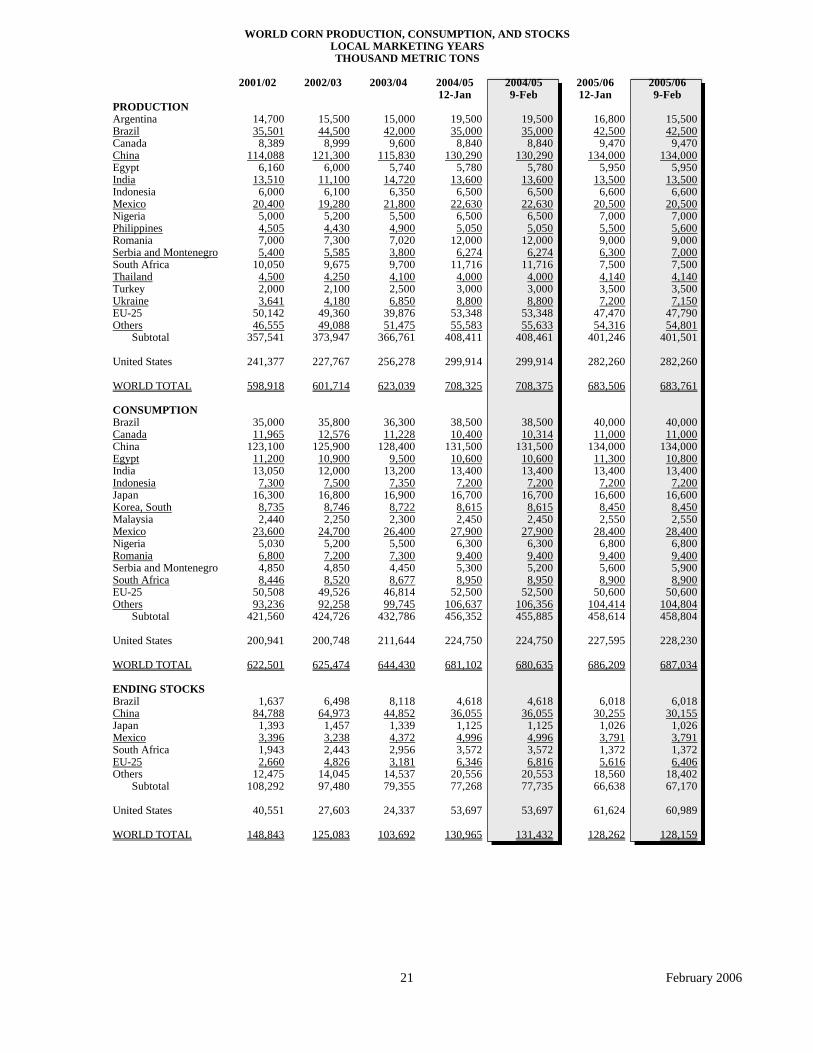
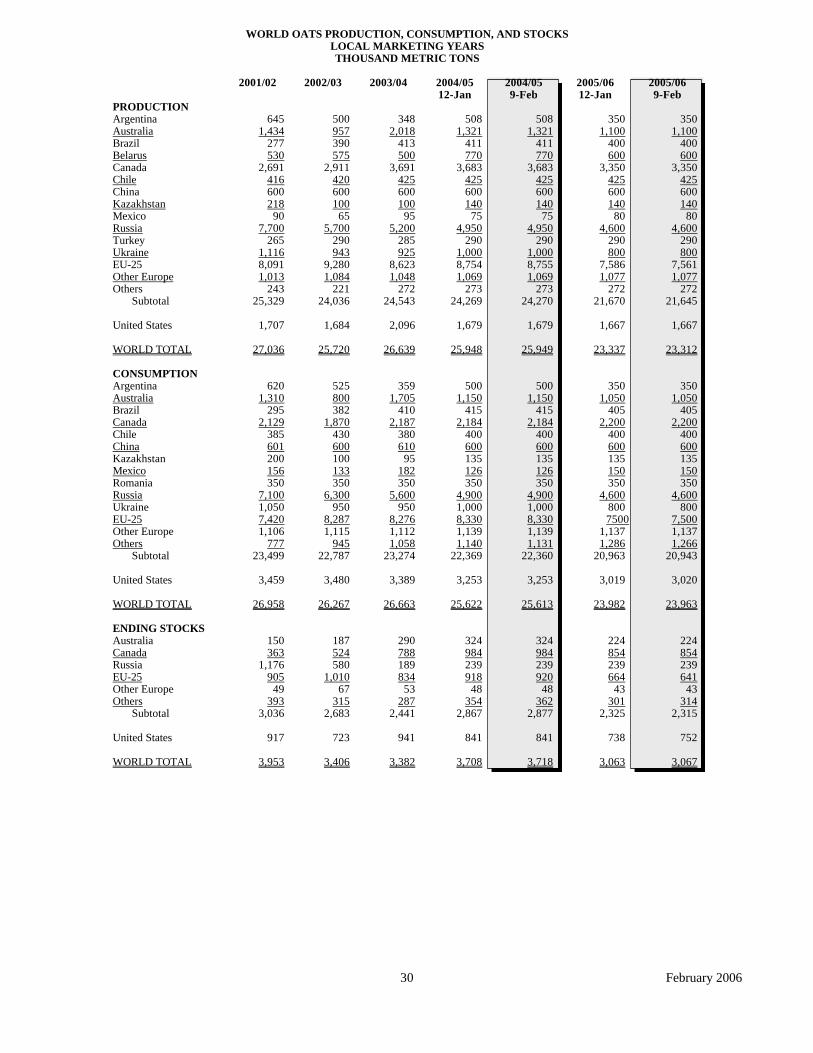
WORLD CORN PRODUCTION, CONSUMPTION, AND STOCKSLOCAL MARKETING YEARSTHOUSAND METRIC TONS
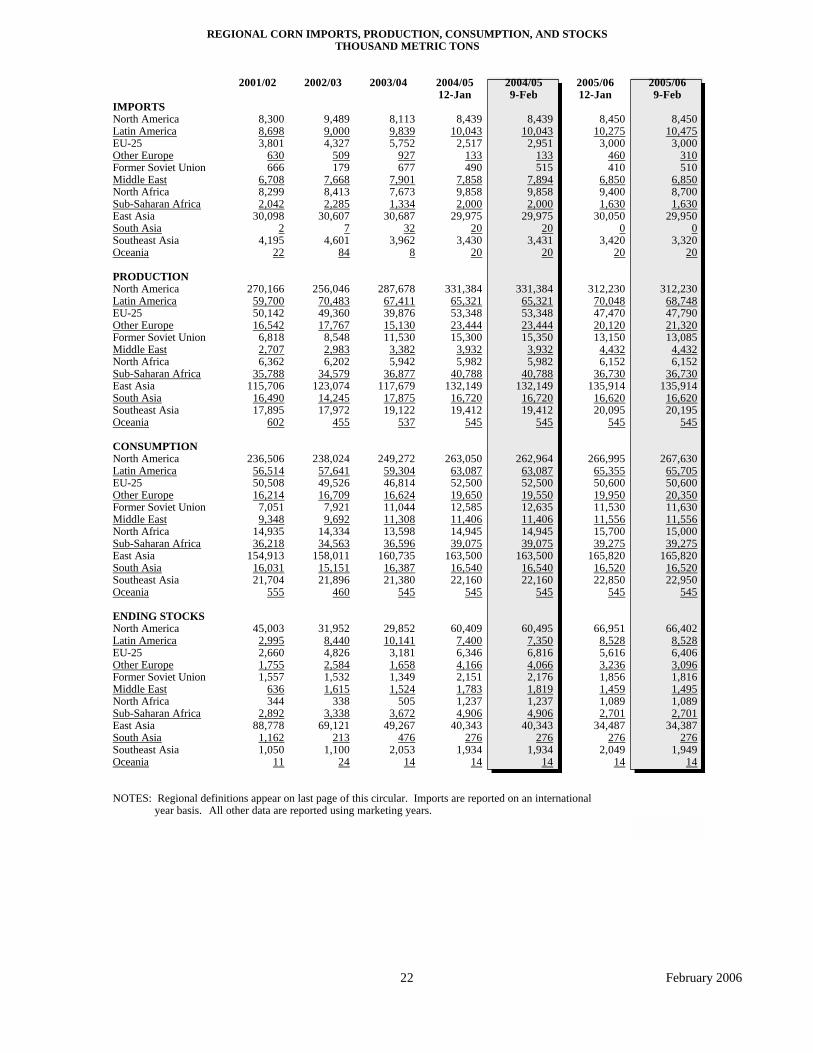
IMPORTS North America 8,300 9,489 8,113 8,439 8,450 Latin America 8,698 9,000 9,839 10,043 10,275 EU-25 3,801 4,327 5,752 2,517 3,000 Other Europe 630 509 927 133 460 Former Soviet Union 666 179 677 490 410 Middle East 6,708 7,668 7,901 7,858 6,850 North Africa 8,299 8,413 7,673 9,858 9,400 Sub-Saharan Africa 2,042 2,285 1,334 2,000 1,630 East Asia 30,098 30,607 30,687 29,975 30,050 South Asia 2 7 32 20 0 Southeast Asia 4,195 4,601 3,962 3,430 3,420 Oceania 22 84 8 20 20
PRODUCTION North America 270,166 256,046 287,678 331,384
312,230 Latin America 59,700 70,483 67,411 65,321 70,048 EU-25 50,142 49,360 39,876 53,348 47,470 Other Europe 16,542 17,767 15,130 23,444 20,120 Former Soviet Union 6,818 8,548 11,530 15,300 13,150 Middle East 2,707 2,983 3,382 3,932 4,432 North Africa 6,362 6,202 5,942 5,982 6,152 Sub-Saharan Africa 35,788 34,579 36,877 40,788 36,730 East Asia 115,706 123,074 117,679 132,149 135,914 South Asia 16,490 14,245 17,875 16,720 16,620 Southeast Asia 17,895 17,972 19,122 19,412 20,095 Oceania 602 455 537 545 545
CONSUMPTION North America 236,506 238,024 249,272 263,050 266,995 Latin America 56,514 57,641 59,304 63,087 65,355 EU-25 50,508 49,526 46,814 52,500 50,600 Other Europe 16,214 16,709 16,624 19,650 19,950 Former Soviet Union 7,051 7,921 11,044 12,585 11,530 Middle East 9,348 9,692 11,308 11,406 11,556 North Africa 14,935 14,334 13,598 14,945 15,700 Sub-Saharan Africa 36,218 34,563 36,596 39,075 39,275 East Asia 154,913 158,011 160,735 163,500 165,820 South Asia 16,031 15,151 16,387 16,540 16,520 Southeast Asia 21,704 21,896 21,380 22,160 22,850 Oceania 555 460 545 545 545
ENDING STOCKS North America 45,003 31,952 29,852 60,409 66,951 Latin America 2,995 8,440 10,141 7,400 8,528 EU-25 2,660 4,826 3,181 6,346 5,616 Other Europe 1,755 2,584 1,658 4,166 3,236 Former Soviet Union 1,557 1,532 1,349 2,151 1,856 Middle East 636 1,615 1,524 1,783 1,459 North Africa 344 338 505 1,237 1,089 Sub-Saharan Africa 2,892 3,338 3,672 4,906 2,701 East Asia 88,778 69,121 49,267 40,343 34,487 South Asia 1,162 213 476 276 276 Southeast Asia 1,050 1,100 2,053 1,934 2,049 Oceania 11 24 14 14 14
NOTES: Regional definitions appear on last page of this circular. Imports are reported on an international year basis. All other data are reported using marketing years.
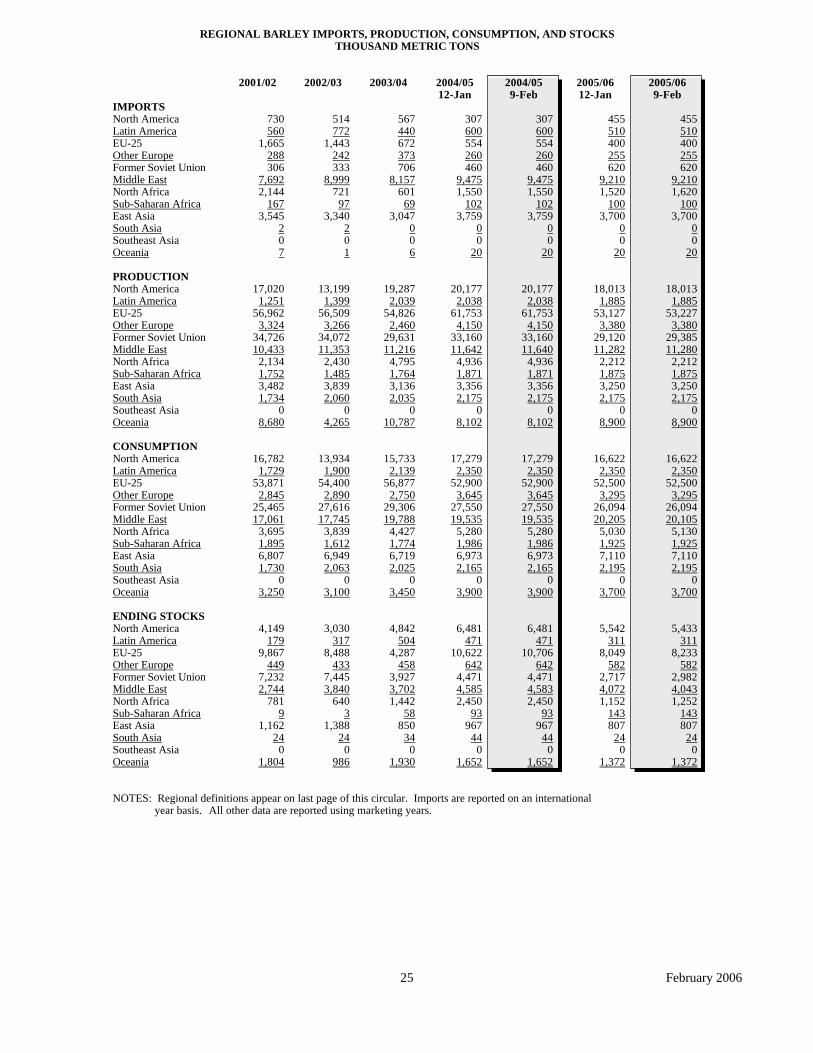
IMPORTS North America 730 514 567 307 455 Latin America 560 772 440 600 510 EU-25 1,665 1,443 672 554 400 Other Europe 288 242 373 260 255 Former Soviet Union 306 333 706 460 620 Middle East 7,692 8,999 8,157 9,475 9,210 North Africa 2,144 721 601 1,550 1,520 Sub-Saharan Africa 167 97 69 102 100 East Asia 3,545 3,340 3,047 3,759 3,700 South Asia 2 2 0 0 0 Southeast Asia 0 0 0 0 0 Oceania 7 1 6 20 20
PRODUCTION North America 17,020 13,199 19,287 20,177
2004/05 9-Feb
307 600 554 260 460
9,475 1,550
102 3,759
0 0
20
20,177 2,038
61,753 4,150
33,160 11,640
4,936 1,871 3,356 2,175
0 8,102
17,279 2,350
52,900 3,645
27,550 19,535
5,280 1,986 6,973 2,165
0 3,900
6,481 471
10,706 642
4,471 4,583 2,450
93 967
44 0
1,652
18,013 Latin America 1,251 1,399 2,039 2,038 1,885 EU-25 56,962 56,509 54,826 61,753 53,127 Other Europe 3,324 3,266 2,460 4,150 3,380 Former Soviet Union 34,726 34,072 29,631 33,160 29,120 Middle East 10,433 11,353 11,216 11,642 11,282 North Africa 2,134 2,430 4,795 4,936 2,212 Sub-Saharan Africa 1,752 1,485 1,764 1,871 1,875 East Asia 3,482 3,839 3,136 3,356 3,250 South Asia 1,734 2,060 2,035 2,175 2,175 Southeast Asia 0 0 0 0 0 Oceania 8,680 4,265 10,787 8,102 8,900
CONSUMPTION North America 16,782 13,934 15,733 17,279 16,622 Latin America 1,729 1,900 2,139 2,350 2,350 EU-25 53,871 54,400 56,877 52,900 52,500 Other Europe 2,845 2,890 2,750 3,645 3,295 Former Soviet Union 25,465 27,616 29,306 27,550 26,094 Middle East 17,061 17,745 19,788 19,535 20,205 North Africa 3,695 3,839 4,427 5,280 5,030 Sub-Saharan Africa 1,895 1,612 1,774 1,986 1,925 East Asia 6,807 6,949 6,719 6,973 7,110 South Asia 1,730 2,063 2,025 2,165 2,195 Southeast Asia 0 0 0 0 0 Oceania 3,250 3,100 3,450 3,900 3,700
ENDING STOCKS North America 4,149 3,030 4,842 6,481 5,542 Latin America 179 317 504 471 311 EU-25 9,867 8,488 4,287 10,622 8,049 Other Europe 449 433 458 642 582 Former Soviet Union 7,232 7,445 3,927 4,471 2,717 Middle East 2,744 3,840 3,702 4,585 4,072 North Africa 781 640 1,442 2,450 1,152 Sub-Saharan Africa 9 3 58 93 143 East Asia 1,162 1,388 850 967 807 South Asia 24 24 34 44 24 Southeast Asia 0 0 0 0 0 Oceania 1,804 986 1,930 1,652 1,372
NOTES: Regional definitions appear on last page of this circular. Imports are reported on an international year basis. All other data are reported using marketing years.
IMPORTS North America 4,837 3,385 3,002 2,913 3,500 Latin America 79 123 104 166 70 EU-25 41 439 1,139 226 225 Other Europe 27 34 24 25 25 Former Soviet Union 0 0 0 0 0 Middle East 26 70 105 34 50 North Africa 0 1 0 0 0 Sub-Saharan Africa 216 187 232 399 140 East Asia 1,824 1,632 1,526 1,449 1,410 South Asia 1 1 0 0 0 Southeast Asia 4 5 25 10 10 Oceania 0 0 0 0 0
PRODUCTION North America 18,957 15,501 17,746 17,473
2004/05 9-Feb
2,913 162 226
7 0
34 0
398 1,450
1 7 0
17,473 6,185
470 5 0
485 915
19,809 2,349 7,760
200 2,177
15,557 6,044
700 12
0 527 915
20,859 3,887 7,680
183 1,805
2,111 602
21 0 0
36 39
641 347 118
26 235
16,005 Latin America 4,802 5,985 5,538 6,185 6,078 EU-25 653 701 380 470 470 Other Europe 5 5 5 5 5 Former Soviet Union 0 0 0 0 0 Middle East 655 553 485 485 485 North Africa 765 915 915 915 915 Sub-Saharan Africa 18,982 16,836 21,250 19,809 21,306 East Asia 2,715 3,345 2,883 2,349 2,421 South Asia 8,620 7,290 7,560 7,760 7,730 Southeast Asia 145 132 137 200 200 Oceania 2,021 1,465 2,009 2,177 2,000
CONSUMPTION North America 17,177 14,839 15,438 15,557 14,807 Latin America 4,437 5,483 4,921 6,049 5,844 EU-25 679 677 1,966 700 700 Other Europe 32 39 29 30 30 Former Soviet Union 0 0 0 0 0 Middle East 686 610 590 527 535 North Africa 765 916 915 915 915 Sub-Saharan Africa 18,558 17,511 20,480 20,844 21,195 East Asia 4,540 4,485 4,604 3,886 3,826 South Asia 8,530 7,380 7,580 7,680 7,630 Southeast Asia 134 104 143 160 185 Oceania 1,655 1,405 1,405 1,805 1,605
ENDING STOCKS North America 2,328 1,694 1,955 2,111 2,491 Latin America 575 489 650 600 560 EU-25 40 68 32 21 11 Other Europe 0 0 0 0 0 Former Soviet Union 0 0 0 0 0 Middle East 30 43 43 35 35 North Africa 40 40 40 40 40 Sub-Saharan Africa 1,065 530 1,380 645 796 East Asia 422 826 463 347 327 South Asia 220 124 62 117 192 Southeast Asia 6 8 5 30 30 Oceania 69 54 63 235 130
NOTES: Regional definitions appear on last page of this circular. Imports are reported on an international year basis. All other data are reported using marketing years.
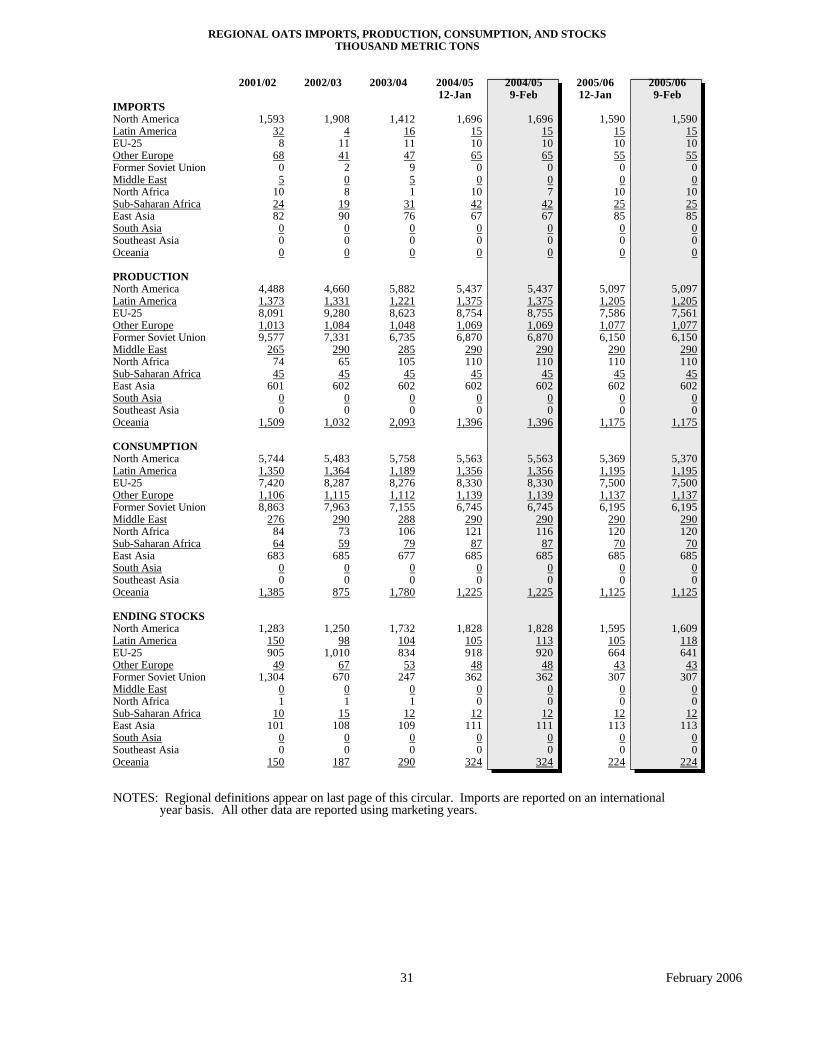
IMPORTS North America 1,593 1,908 1,412 1,696 1,590 Latin America 32 4 16 15 15 EU-25 8 11 11 10 10 Other Europe 68 41 47 65 55 Former Soviet Union 0 2 9 0 0 Middle East 5 0 5 0 0 North Africa 10 8 1 10 10 Sub-Saharan Africa 24 19 31 42 25 East Asia 82 90 76 67 85 South Asia 0 0 0 0 0 Southeast Asia 0 0 0 0 0 Oceania 0 0 0 0 0
PRODUCTION North America 4,488 4,660 5,882 5,437
2004/05 9-Feb
1,696 15 10 65
0 0 7
42 67
0 0 0
5,437 1,375 8,755 1,069 6,870
290 110
45 602
0 0
1,396
5,563 1,356 8,330 1,139 6,745
290 116
87 685
0 0
1,225
1,828 113 920
48 362
0 0
12 111
0 0
324
5,097 Latin America 1,373 1,331 1,221 1,375 1,205 EU-25 8,091 9,280 8,623 8,754 7,586 Other Europe 1,013 1,084 1,048 1,069 1,077 Former Soviet Union 9,577 7,331 6,735 6,870 6,150 Middle East 265 290 285 290 290 North Africa 74 65 105 110 110 Sub-Saharan Africa 45 45 45 45 45 East Asia 601 602 602 602 602 South Asia 0 0 0 0 0 Southeast Asia 0 0 0 0 0 Oceania 1,509 1,032 2,093 1,396 1,175
CONSUMPTION North America 5,744 5,483 5,758 5,563 5,369 Latin America 1,350 1,364 1,189 1,356 1,195 EU-25 7,420 8,287 8,276 8,330 7,500 Other Europe 1,106 1,115 1,112 1,139 1,137 Former Soviet Union 8,863 7,963 7,155 6,745 6,195 Middle East 276 290 288 290 290 North Africa 84 73 106 121 120 Sub-Saharan Africa 64 59 79 87 70 East Asia 683 685 677 685 685 South Asia 0 0 0 0 0 Southeast Asia 0 0 0 0 0 Oceania 1,385 875 1,780 1,225 1,125
ENDING STOCKS North America 1,283 1,250 1,732 1,828 1,595 Latin America 150 98 104 105 105 EU-25 905 1,010 834 918 664 Other Europe 49 67 53 48 43 Former Soviet Union 1,304 670 247 362 307 Middle East 0 0 0 0 0 North Africa 1 1 1 0 0 Sub-Saharan Africa 10 15 12 12 12 East Asia 101 108 109 111 113 South Asia 0 0 0 0 0 Southeast Asia 0 0 0 0 0 Oceania 150 187 290 324 224
NOTES: Regional definitions appear on last page of this circular. Imports are reported on an international year basis. All other data are reported using marketing years.
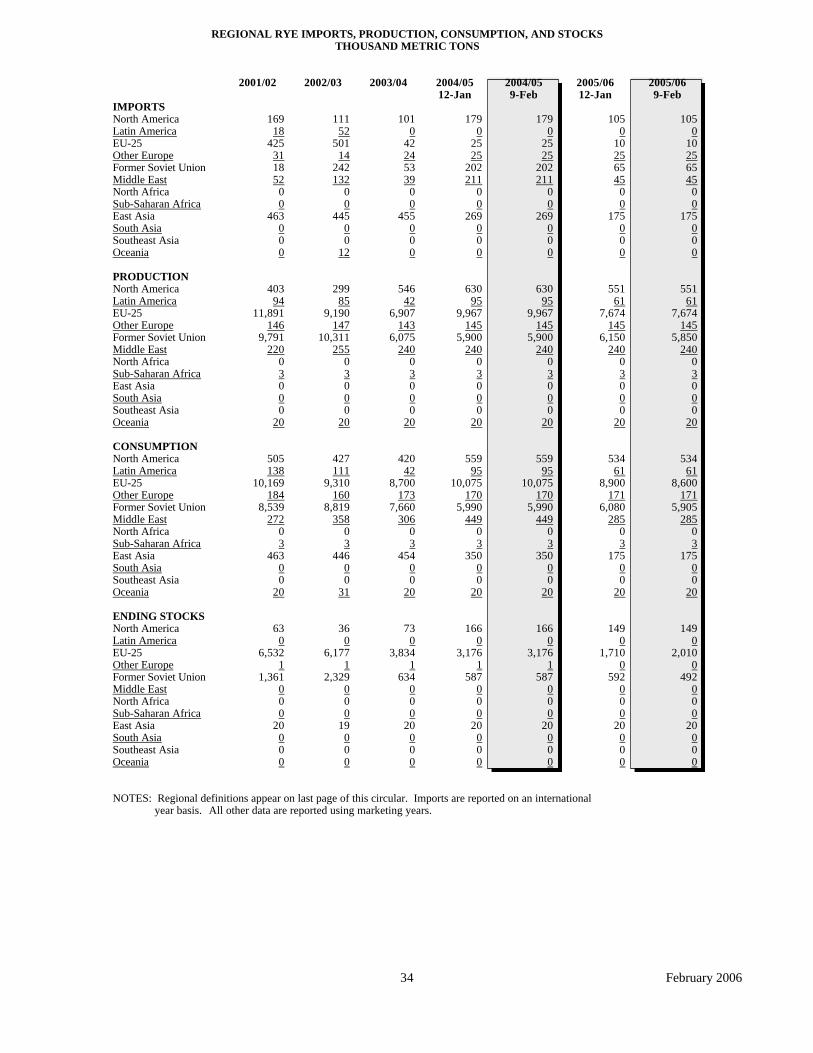
IMPORTS North America 169 111 101 179 105 Latin America 18 52 0 0 0 EU-25 425 501 42 25 10 Other Europe 31 14 24 25 25 Former Soviet Union 18 242 53 202 65 Middle East 52 132 39 211 45 North Africa 0 0 0 0 0 Sub-Saharan Africa 0 0 0 0 0 East Asia 463 445 455 269 175 South Asia 0 0 0 0 0 Southeast Asia 0 0 0 0 0 Oceania 0 12 0 0 0
PRODUCTION North America 403 299 546 630
2004/05 9-Feb
179 0
25 25
202 211
0 0
269 0 0 0
630 95
9,967 145
5,900 240
0 3 0 0 0
20
559 95
10,075 170
5,990 449
0 3
350 0 0
20
166 0
3,176 1
587 0 0 0
20 0 0 0
551 Latin America 94 85 42 95 61 EU-25 11,891 9,190 6,907 9,967 7,674 Other Europe 146 147 143 145 145 Former Soviet Union 9,791 10,311 6,075 5,900 6,150 Middle East 220 255 240 240 240 North Africa 0 0 0 0 0 Sub-Saharan Africa 3 3 3 3 3 East Asia 0 0 0 0 0 South Asia 0 0 0 0 0 Southeast Asia 0 0 0 0 0 Oceania 20 20 20 20 20
CONSUMPTION North America 505 427 420 559 534 Latin America 138 111 42 95 61 EU-25 10,169 9,310 8,700 10,075 8,900 Other Europe 184 160 173 170 171 Former Soviet Union 8,539 8,819 7,660 5,990 6,080 Middle East 272 358 306 449 285 North Africa 0 0 0 0 0 Sub-Saharan Africa 3 3 3 3 3 East Asia 463 446 454 350 175 South Asia 0 0 0 0 0 Southeast Asia 0 0 0 0 0 Oceania 20 31 20 20 20
ENDING STOCKS North America 63 36 73 166 149 Latin America 0 0 0 0 0 EU-25 6,532 6,177 3,834 3,176 1,710 Other Europe 1 1 1 1 0 Former Soviet Union 1,361 2,329 634 587 592 Middle East 0 0 0 0 0 North Africa 0 0 0 0 0 Sub-Saharan Africa 0 0 0 0 0 East Asia 20 19 20 20 20 South Asia 0 0 0 0 0 Southeast Asia 0 0 0 0 0 Oceania 0 0 0 0 0
NOTES: Regional definitions appear on last page of this circular. Imports are reported on an international year basis. All other data are reported using marketing years.
2005/06 9-Feb
105 0
10 25 65 45
0 0
175 0 0 0
551 61
7,674 145
5,850 240
0 3 0 0 0
20
534 61
8,600 171
5,905 285
0 3
175 0 0
20
149 0
2,010 0
492 0 0 0
20 0 0 0
34 February 2006
DG F/SA &F
HISTORICAL DATA SERIES FOR SELECTED REGIONS AND COUNTRIES
CONTENTS
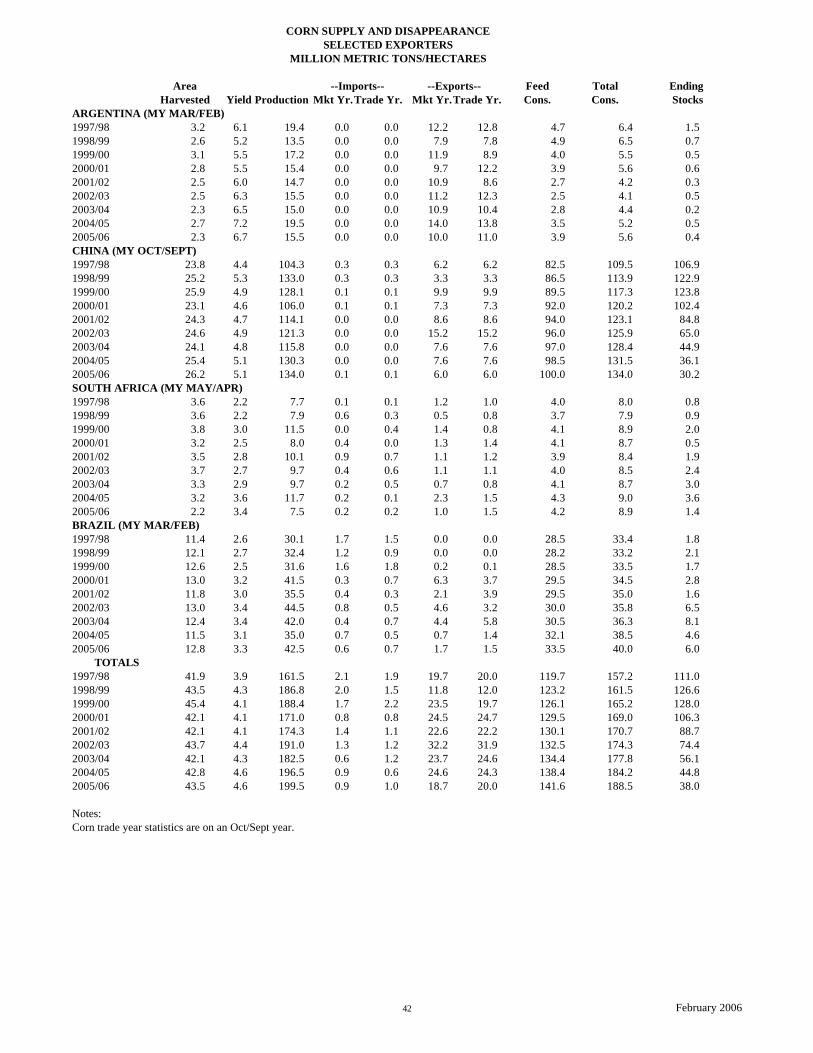
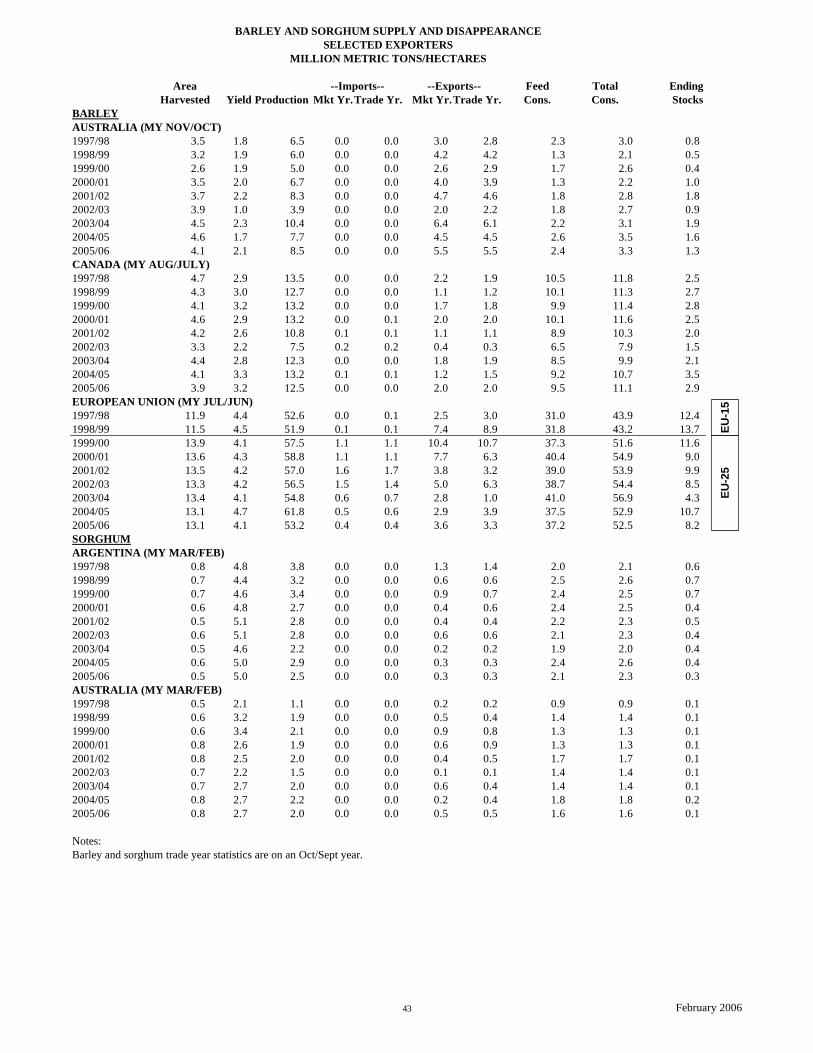
European Union: Grain Supply and Demand ............................................ 36China: Grain Supply and Demand............................................................ 37Other Europe: Grain Supply and Demand ................................................ 38Former Soviet Union: Grain Supply and Demand..................................... 39Wheat Supply and Disappearance: Selected Exporters.............................. 41Corn Supply and Disappearance: Selected Exporters ................................ 42Barley and Sorghum Supply and Disappearance: Selected Exporters......... 43U.S. Grains: Supply and Distribution....................................................... 44Total Wheat and Coarse Grains: Supply and Demand ............................... 46World Wheat and Coarse Grains: Supply and Demand ............................. 47World Corn and Barley: Supply and Demand........................................... 48World Rice: Supply and Demand............................................................. 49
Grain: World Markets and Trade, February 2006
35
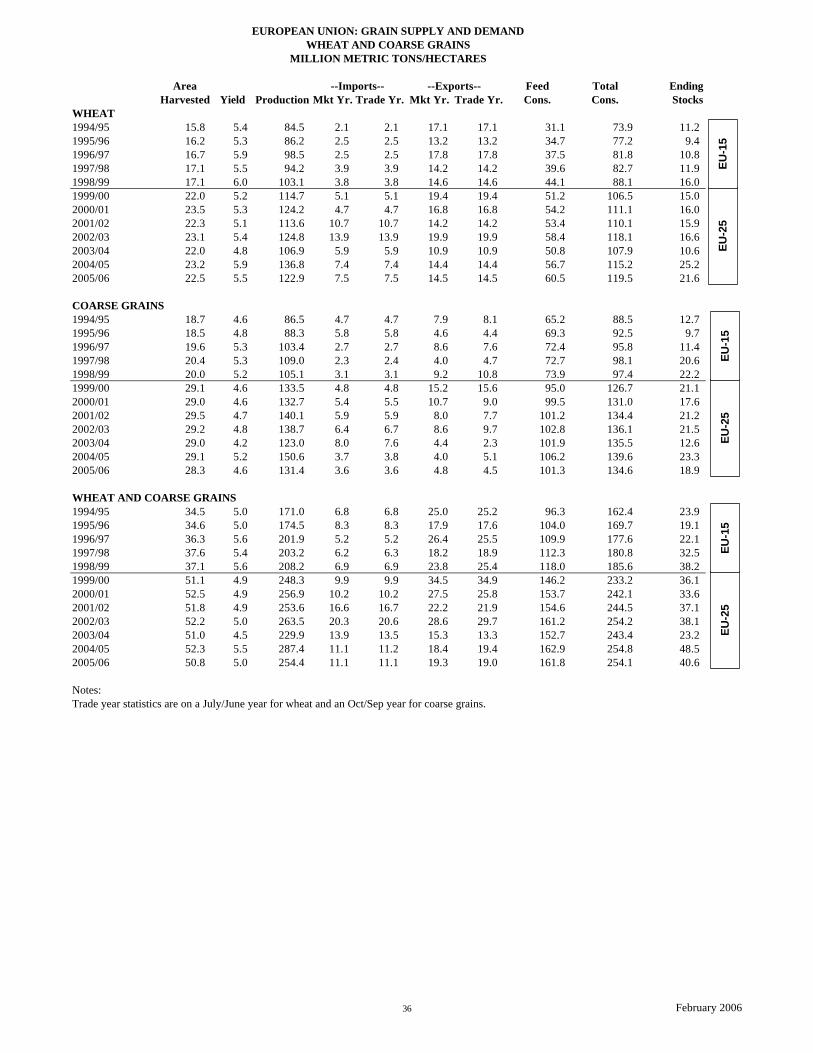
EUROPEAN UNION: GRAIN SUPPLY AND DEMANDWHEAT AND COARSE GRAINS
MILLION METRIC TONS/HECTARES
Area --Imports-- --Exports-- Feed Total Ending Harvested Yield Production Mkt Yr. Trade Yr. Mkt Yr. Trade Yr. Cons. Cons. Stocks
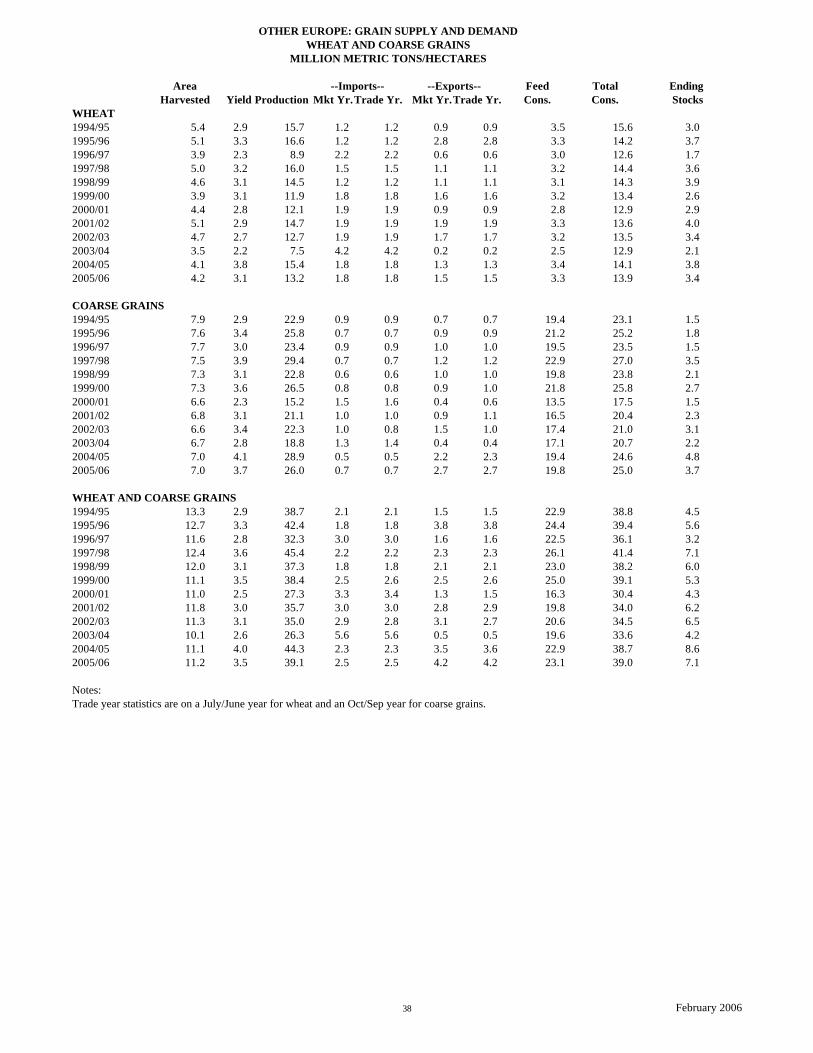
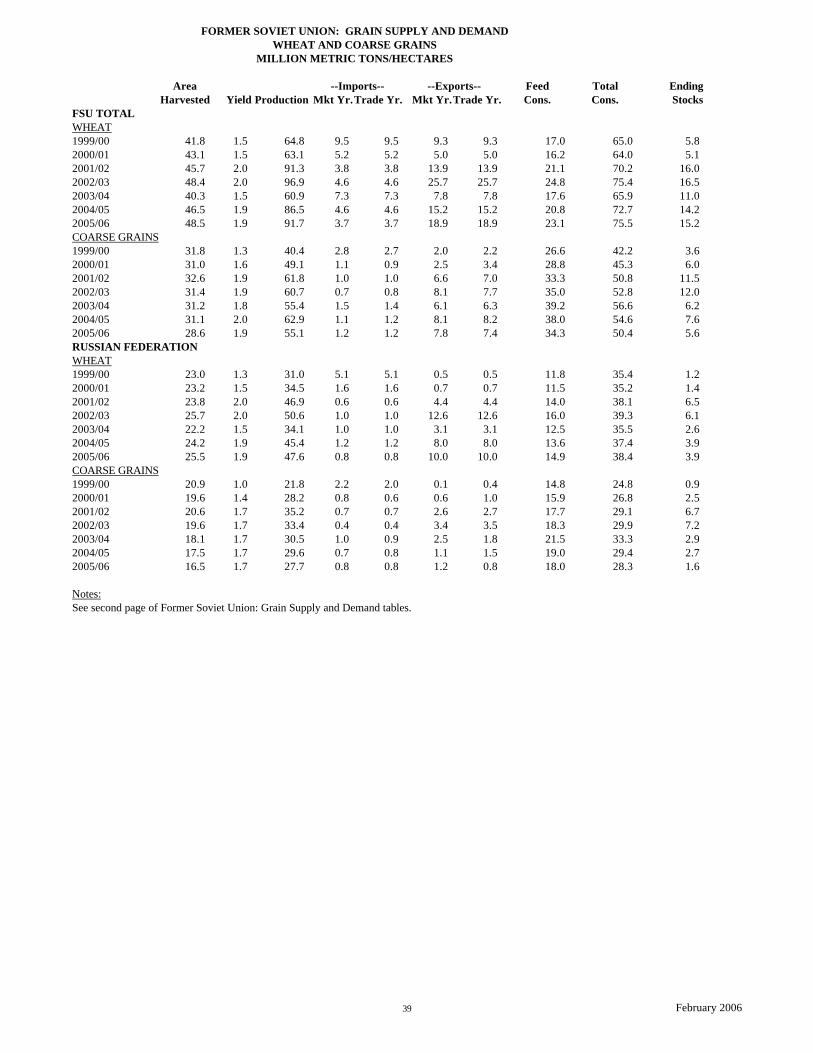
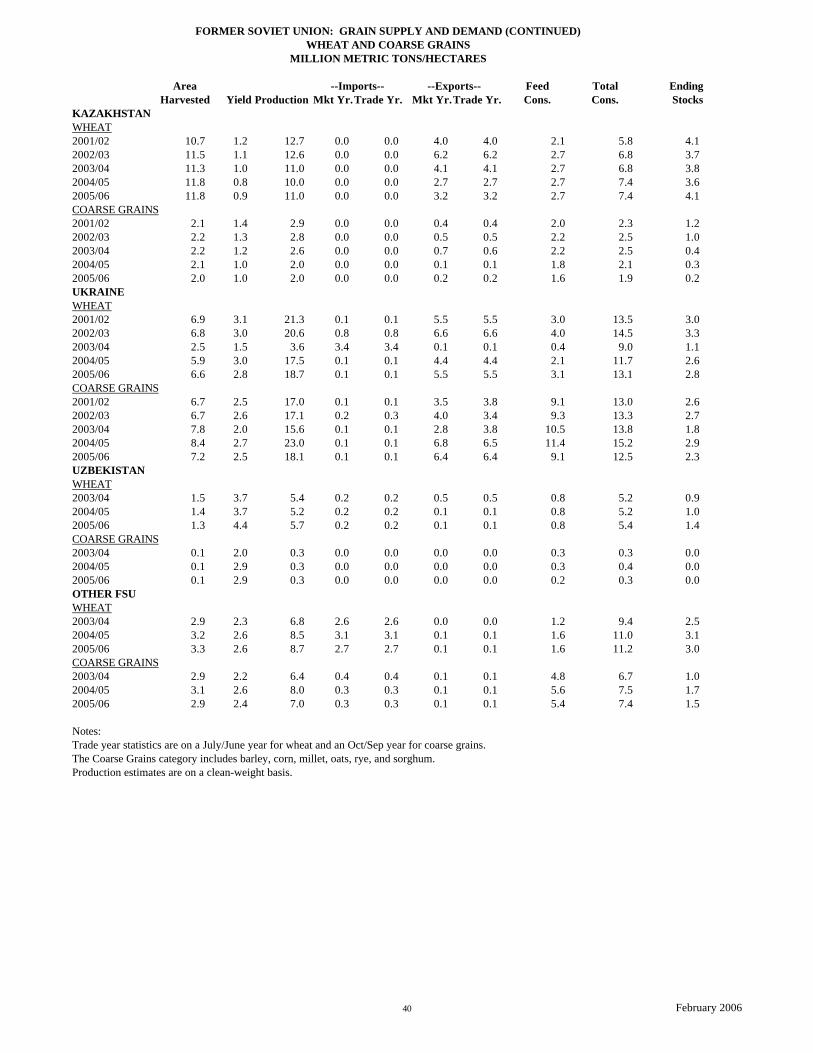
Notes: Trade year statistics are on a July/June year for wheat and an Oct/Sep year for coarse grains.The Coarse Grains category includes barley, corn, millet, oats, rye, and sorghum.Production estimates are on a clean-weight basis.
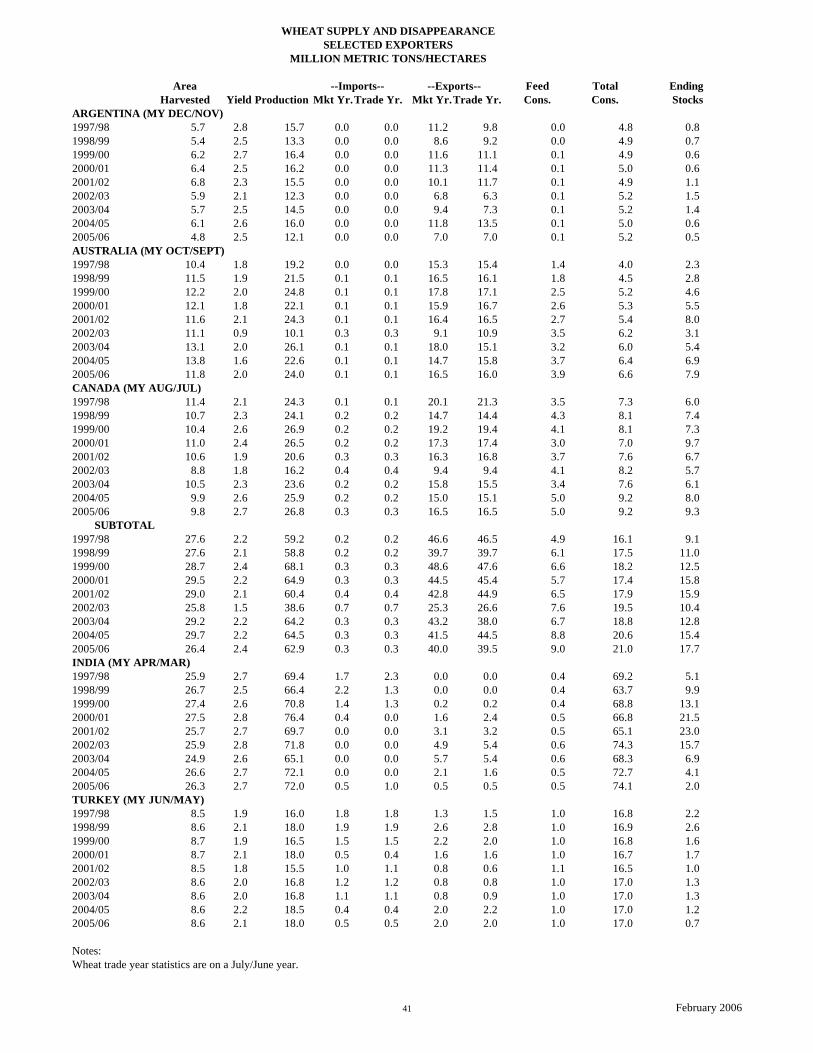
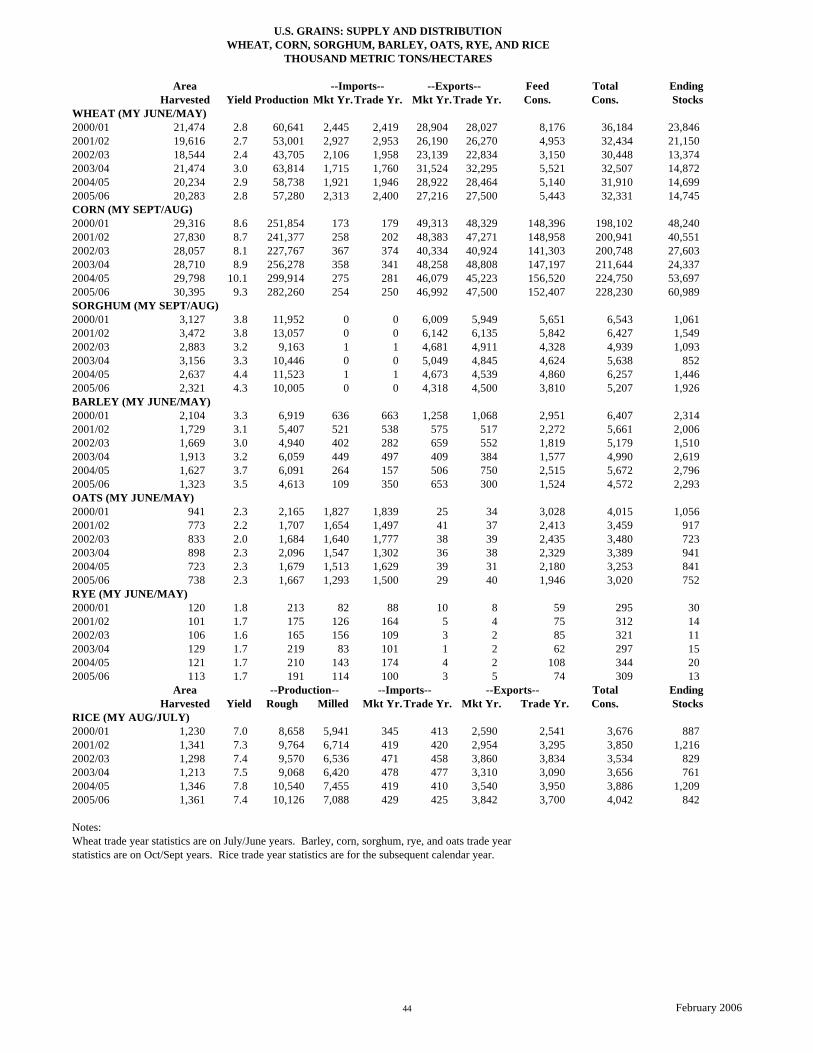
Notes:Wheat trade year statistics are on July/June years. Barley, corn, sorghum, rye, and oats trade year statistics are on Oct/Sept years. Rice trade year statistics are for the subsequent calendar year.
44 February 2006
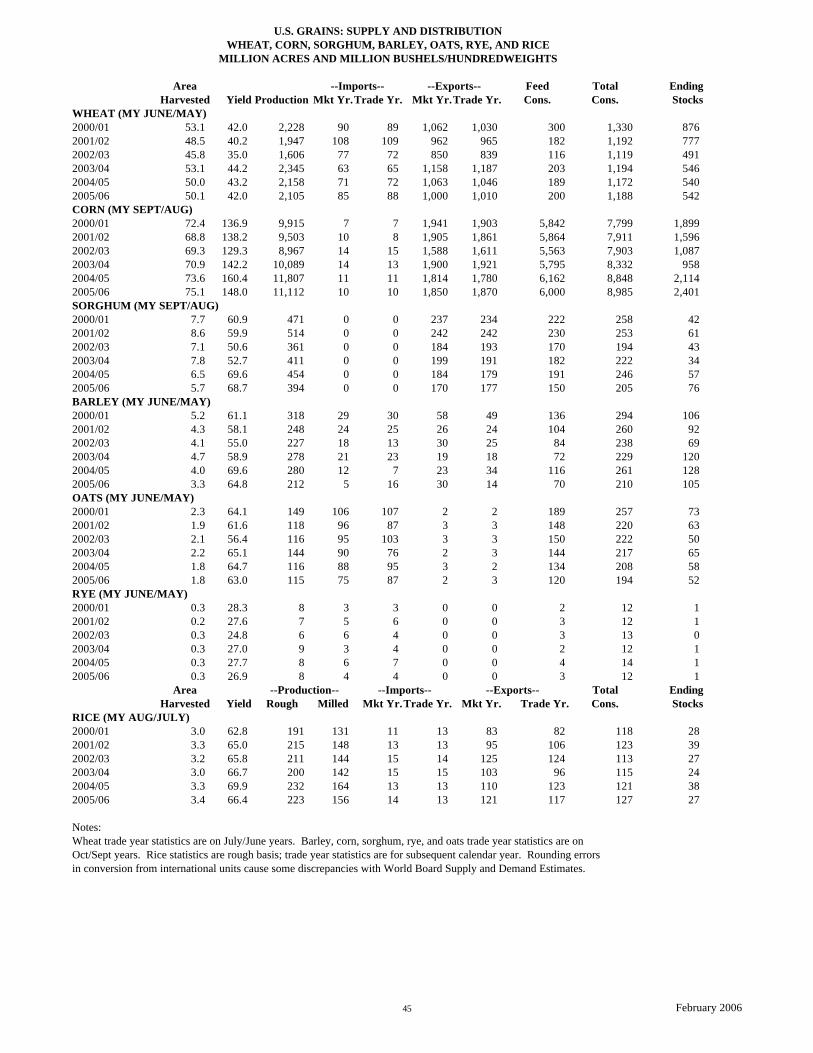
U.S. GRAINS: SUPPLY AND DISTRIBUTIONWHEAT, CORN, SORGHUM, BARLEY, OATS, RYE, AND RICE
MILLION ACRES AND MILLION BUSHELS/HUNDREDWEIGHTS
Area --Imports-- --Exports-- Feed Total Ending Harvested Yield Production Mkt Yr. Trade Yr. Mkt Yr. Trade Yr. Cons. Cons. Stocks
Notes:Wheat trade year statistics are on July/June years. Barley, corn, sorghum, rye, and oats trade year statistics are on Oct/Sept years. Rice statistics are rough basis; trade year statistics are for subsequent calendar year. Rounding errorsin conversion from international units cause some discrepancies with World Board Supply and Demand Estimates.
45 February 2006
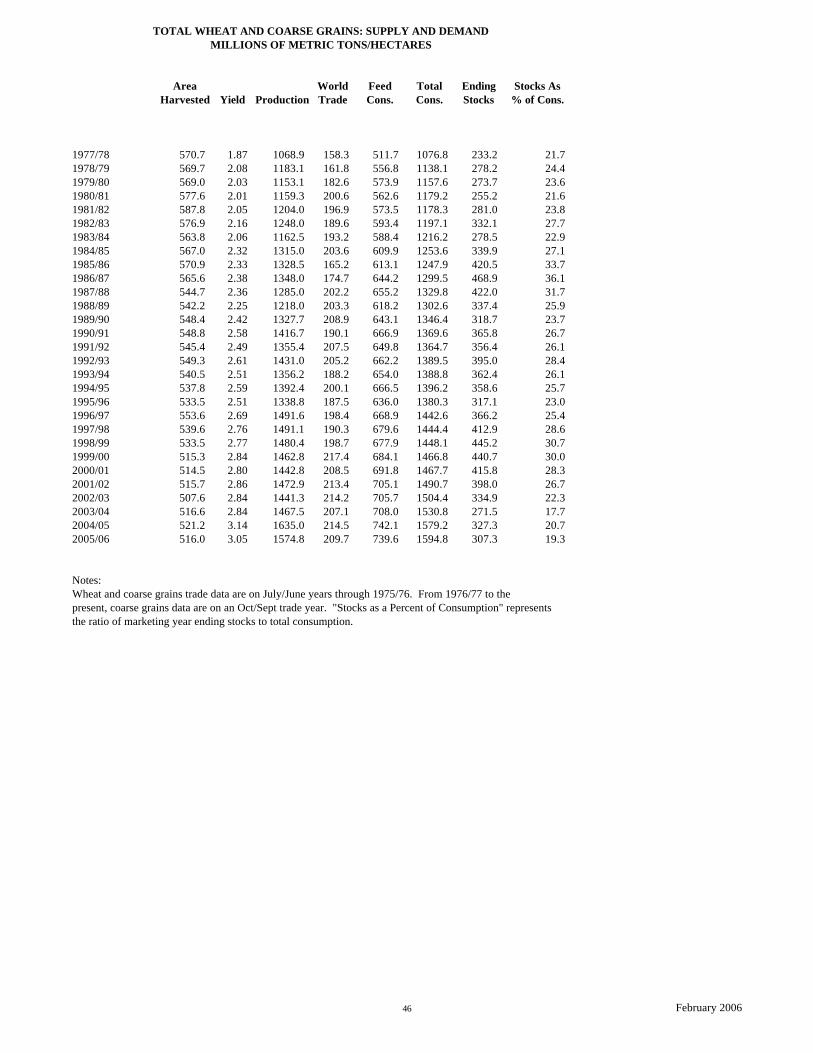
TOTAL WHEAT AND COARSE GRAINS: SUPPLY AND DEMAND MILLIONS OF METRIC TONS/HECTARES
Area World Feed Total Ending Stocks As Harvested Yield Production Trade Cons. Cons. Stocks % of Cons.
Notes:Wheat and coarse grains trade data are on July/June years through 1975/76. From 1976/77 to the present, coarse grains data are on an Oct/Sept trade year. "Stocks as a Percent of Consumption" representsthe ratio of marketing year ending stocks to total consumption.
46 February 2006
WORLD WHEAT AND COARSE GRAINS: SUPPLY AND DEMAND MILLIONS OF METRIC TONS/HECTARES
Area World Feed Total Ending Stocks As Harvested Yield Production Trade Cons. Cons. Stocks % of Cons.
Notes:Wheat and coarse grains trade data are on July/June years through 1975/76. From 1976/77 to the present, coarse grains data are on an Oct/Sept trade year. "Stocks as a Percent of Consumption" representsthe ratio of marketing year ending stocks to total consumption.
47 February 2006
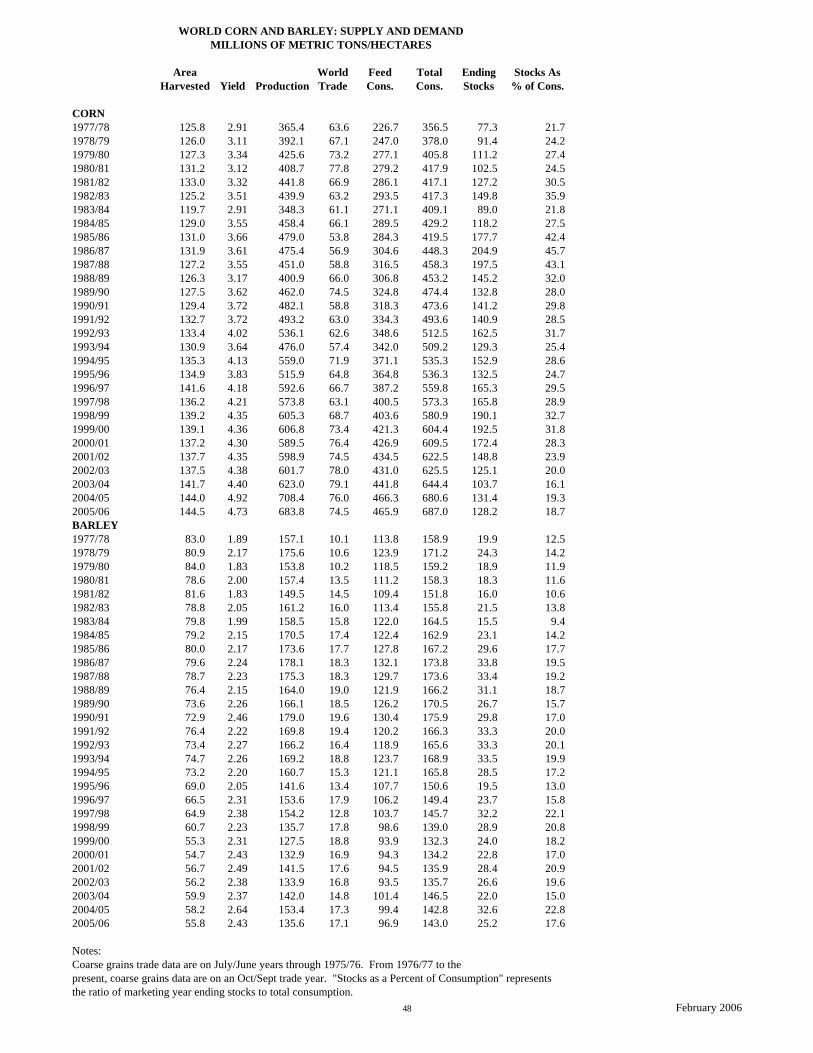
WORLD CORN AND BARLEY: SUPPLY AND DEMAND MILLIONS OF METRIC TONS/HECTARES
Area World Feed Total Ending Stocks As Harvested Yield Production Trade Cons. Cons. Stocks % of Cons.
Notes:Coarse grains trade data are on July/June years through 1975/76. From 1976/77 to the present, coarse grains data are on an Oct/Sept trade year. "Stocks as a Percent of Consumption" representsthe ratio of marketing year ending stocks to total consumption.
48 February 2006
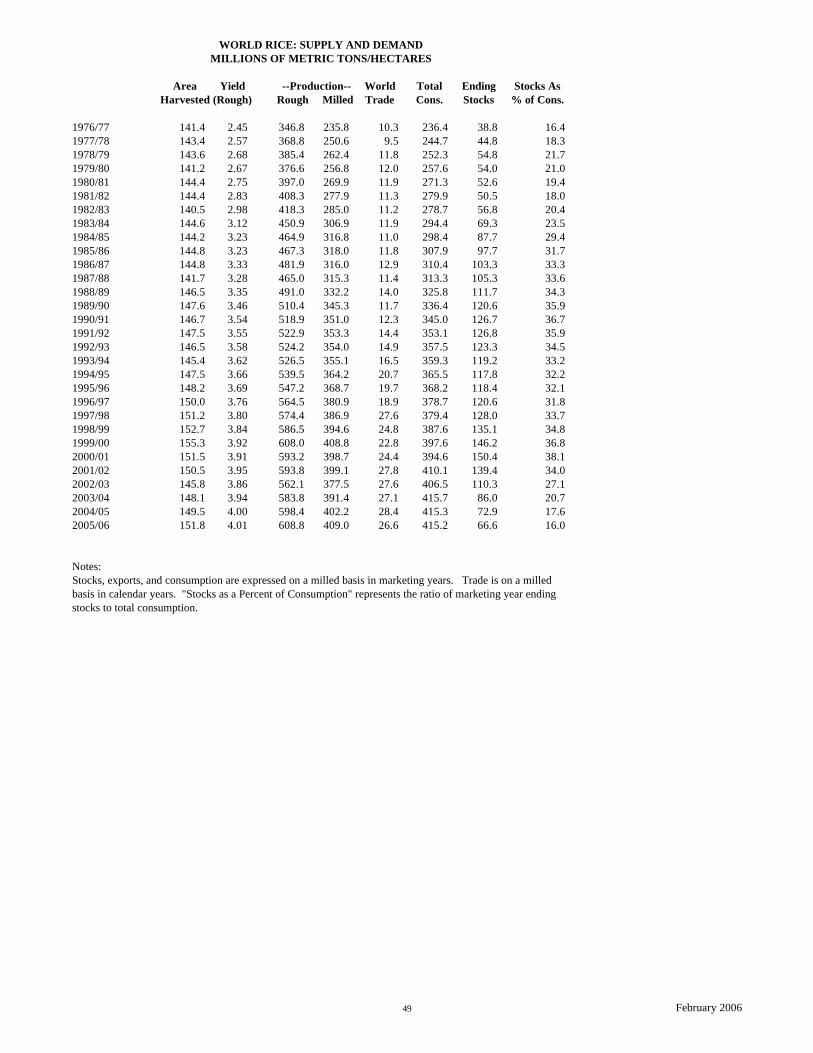
WORLD RICE: SUPPLY AND DEMAND MILLIONS OF METRIC TONS/HECTARES
Area Yield --Production-- World Total Ending Stocks As Harvested (Rough) Rough Milled Trade Cons. Stocks % of Cons.
Notes:Stocks, exports, and consumption are expressed on a milled basis in marketing years. Trade is on a milledbasis in calendar years. "Stocks as a Percent of Consumption" represents the ratio of marketing year endingstocks to total consumption.
49 February 2006
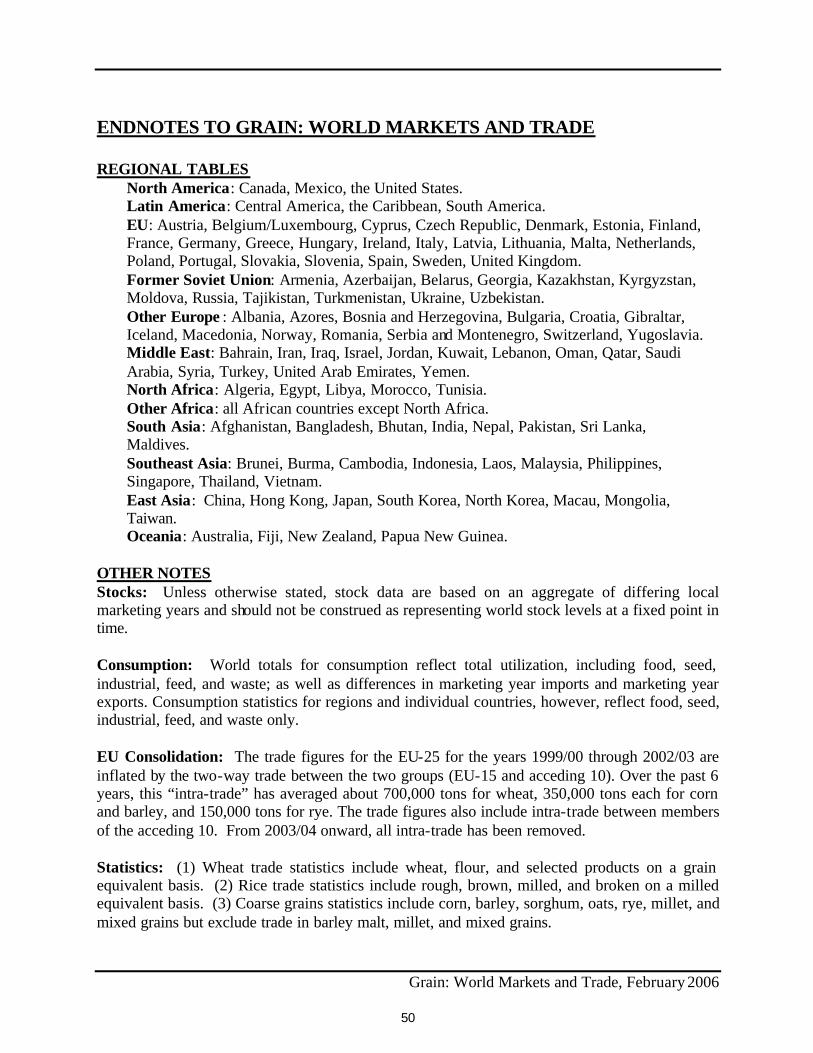
ENDNOTES TO GRAIN: WORLD MARKETS AND TRADE
REGIONAL TABLES North America: Canada, Mexico, the United States. Latin America: Central America, the Caribbean, South America. EU: Austria, Belgium/Luxembourg, Cyprus, Czech Republic, Denmark, Estonia, Finland, France, Germany, Greece, Hungary, Ireland, Italy, Latvia, Lithuania, Malta, Netherlands, Poland, Portugal, Slovakia, Slovenia, Spain, Sweden, United Kingdom. Former Soviet Union: Armenia, Azerbaijan, Belarus, Georgia, Kazakhstan, Kyrgyzstan, Moldova, Russia, Tajikistan, Turkmenistan, Ukraine, Uzbekistan. Other Europe : Albania, Azores, Bosnia and Herzegovina, Bulgaria, Croatia, Gibraltar, Iceland, Macedonia, Norway, Romania, Serbia and Montenegro, Switzerland, Yugoslavia. Middle East: Bahrain, Iran, Iraq, Israel, Jordan, Kuwait, Lebanon, Oman, Qatar, Saudi Arabia, Syria, Turkey, United Arab Emirates, Yemen. North Africa: Algeria, Egypt, Libya, Morocco, Tunisia. Other Africa: all African countries except North Africa. South Asia: Afghanistan, Bangladesh, Bhutan, India, Nepal, Pakistan, Sri Lanka, Maldives. Southeast Asia: Brunei, Burma, Cambodia, Indonesia, Laos, Malaysia, Philippines, Singapore, Thailand, Vietnam. East Asia: China, Hong Kong, Japan, South Korea, North Korea, Macau, Mongolia, Taiwan. Oceania: Australia, Fiji, New Zealand, Papua New Guinea.
OTHER NOTESStocks: Unless otherwise stated, stock data are based on an aggregate of differing localmarketing years and should not be construed as representing world stock levels at a fixed point in time.
Consumption: World totals for consumption reflect total utilization, including food, seed, industrial, feed, and waste; as well as differences in marketing year imports and marketing year exports. Consumption statistics for regions and individual countries, however, reflect food, seed, industrial, feed, and waste only.
EU Consolidation: The trade figures for the EU-25 for the years 1999/00 through 2002/03 are inflated by the two-way trade between the two groups (EU-15 and acceding 10). Over the past 6 years, this “intra-trade” has averaged about 700,000 tons for wheat, 350,000 tons each for corn and barley, and 150,000 tons for rye. The trade figures also include intra-trade between members of the acceding 10. From 2003/04 onward, all intra-trade has been removed.
Statistics: (1) Wheat trade statistics include wheat, flour, and selected products on a grain equivalent basis. (2) Rice trade statistics include rough, brown, milled, and broken on a milled equivalent basis. (3) Coarse grains statistics include corn, barley, sorghum, oats, rye, millet, and mixed grains but exclude trade in barley malt, millet, and mixed grains.
Grain: World Markets and Trade, February 2006
50
Unaccounted: This term includes grain in transit, reporting discrepancies in some countries, and trade to countries outside the USDA database.
The Grain and Feed Division, Commodity and Marketing Programs, Foreign Agricultural Service, USDA, Washington DC 20250, prepared this circular. Information is gathered from official statistics of foreign governments and other foreign source materials, reports of U.S. agricultural attachés and Foreign Service officers, results of office research, and related information. Further information may be obtained by writing the division or telephoning (202) 720-6219.
Note: The previous report in this series was the Grain: World Markets and Trade Foreign Agricultural Service Circular FG 01-06 January 2006. For further details on world grain production, see World Agricultural Production Foreign Agricultural Service Circular WAP 02-06 February 2006.
This circular is available in its entirety on the World Wide Web via the Foreign Agricultural Service Home Page. The address is: http://www.fas.usda.go v