70
ENGINEERED EXCELLENCE REPORT TO STAKEHOLDERS FOR THE YEAR ENDED 30 JUNE 2015

ENGINEERED EXCELLENCE
REPORT TO
STAKEHOLDERS
FOR THE YEAR ENDED
30 JUNE 2015

ENGINEERED EXCELLENCE© Murray & Roberts 2015 | 2

ENGINEERED EXCELLENCE© Murray & Roberts 2015 | 3
Henry Laas • Key presentation takeaways• Salient features• Safety performance• Historic financial results• A New Strategic Future• Business model• Project value chain• FY15 bolt-on acquisitions• Profitability of acquisitions• Global reach
Slide 4Slide 5Slide 6Slide 7Slides 9 to 10Slide 11Slide 12Slide 13Slide 14Slide 15
Cobus Bester • Statement of financial performance
• Statement of financial position
• Platform contributions – Revenue and EBIT
• Project value chain contributions – Revenue and EBIT
• Geographic contributions – Revenue and EBIT
• Segmental analysis per platform
• Investment margins and aspirations
Slide 17
Slide 18
Slide 19
Slide 20
Slide 21
Slides 22 to 26
Slide 27
Henry Laas • Order book per platform
• Order book, near orders and pipeline
• Order book – geography and time distribution
• Underground Mining platform – commodity order book breakdown
• Major claims update• Platform outlook
Slide 29
Slide 30
Slide 31
Slide 32
Slide 34
Slides 35 to 36
Appendices • Detailed financial results• Group overview
Slides 42 to 64
Slides 65 to 68

ENGINEERED EXCELLENCE© Murray & Roberts 2015 | 4
Murray & Roberts is transforming from being predominantly a SA engineering and construction
company, to an international group focussed on the natural resources market sectors
Murray & Roberts is transforming from being predominantly a SA engineering and construction
company, to an international group focussed on the natural resources market sectors
FY16 will be even more challenging, as the expected growth in Underground Mining will not be
sufficient to offset expected decline in contribution from Oil & Gas
FY16 will be even more challenging, as the expected growth in Underground Mining will not be
sufficient to offset expected decline in contribution from Oil & Gas
Strong project pipeline but the timing of opportunities is uncertainStrong project pipeline but the timing of opportunities is uncertain
Gautrain and Dubai Airport Claims settlement processes – slow but solid progressGautrain and Dubai Airport Claims settlement processes – slow but solid progress
The declining order book over the past 2 years reflects the reality of a subdued global economy
and weak demand for commodities, coupled with low investment in fixed capital formation in SA
The declining order book over the past 2 years reflects the reality of a subdued global economy
and weak demand for commodities, coupled with low investment in fixed capital formation in SA
Challenging economic conditions, weak commodity demand and slump in commodity prices,
specifically oil, weighed on the Group’s performance in FY15
Challenging economic conditions, weak commodity demand and slump in commodity prices,
specifically oil, weighed on the Group’s performance in FY15
Balance sheet strength will enable the Group to pursue growth and to continue with its strategy
to change its business model through strategic bolt-on and larger acquisitions
Balance sheet strength will enable the Group to pursue growth and to continue with its strategy
to change its business model through strategic bolt-on and larger acquisitions
Despite further challenging trading conditions, the Group is working towards and is well placed to
realise its vision for 2020
Despite further challenging trading conditions, the Group is working towards and is well placed to
realise its vision for 2020
Murray & Roberts differentiator – full project lifecycle service offering, exposure to select natural
resources market sectors, and international diversification
Murray & Roberts differentiator – full project lifecycle service offering, exposure to select natural
resources market sectors, and international diversification
?

ENGINEERED EXCELLENCE© Murray & Roberts 2015 | 5
FY2015 COMPARED TO FY2014
Revenue1Revenue1 Attributable earnings2Attributable earnings2HEPS (Diluted continuing)HEPS (Diluted continuing)
Order book4Order book4
R30,6bn
�
R36bn (FY14)
R881m
�
R1 261m (FY14)
201 cents
�
205 cents (FY14)
R38.3bn
�
R40.9bn (FY14)
Net cash3Net cash3
NAVNAV DividendDividend Health & SafetyHealth & Safety
R1.4bn
�
R1.8bn (FY14)
R15 p/share
�
R13 p/share (FY14)
1 The reduction is mainly due to subdued markets, primarily in the Oil & Gas sector.2 The decrease is primarily due to a profit (trading and disposal) of R422m on discontinued operations included in FY2014.3 The reduction is mainly due to the repayment of advance payments and acquisition funding.4 The decrease is mainly due to a decrease in the Oil & Gas platform order book, partly offset by new awards in Underground Mining.
LTIFR – 0.79
�
LTIFR – 0.80 (FY14)
50 cents
�
50 cents (FY14)

ENGINEERED EXCELLENCE© Murray & Roberts 2015 | 6
4 2 4 4
1.14
0.82
0.80
0.79
0.00
0.20
0.40
0.60
0.80
1.00
1.20
0
1
2
3
4
5
FY2012 FY2013 FY2014 FY2015
LTIFR*Fatalities
Fatalities L.T.I.F.R. (per 1 million hours) L.T.I.F.R. Target (0.8)
* Lost Time Injury Frequency Rate
• Regrettably, four
fatalities
• Record low LTIFR of
0.79
TOGETHER TO ZERO HARM

ENGINEERED EXCELLENCE© Murray & Roberts 2015 | 7
(600)
(300)
0
300
(2 000)
(1 000)
0
1 000
Attributable earnings is after tax and non-controlling interests
• Fourth consecutive year
of growth in attributable
earnings from
continuing operations.
• For FY15, operating
income was down on
prior year, but offset by
lower tax charge.
ATTRIBUTABLE EARNINGS AND DILUTED CONTINUING HEPS
2011 2012 2013 2014 2015
Discontinued and abnormal items (Rm) (388) 137 516 422 22
From continuing operations (Rm) (1 347) (873) 488 839 859
Diluted continuing HEPS (428) (268) 123 205 201
R’m Cents

ENGINEERED EXCELLENCE© Murray & Roberts 2015 | 8

ENGINEERED EXCELLENCE© Murray & Roberts 2015 | 9
The Group’s 2020 vision is that of a diverse international engineering &
construction group focused on the natural resource market segments
PLATFORMS ARE NAMED AFTER PRIMARY MARKET SEGMENTS BUT ALSO UNDERTAKE WORK IN SELECTED COMPLIMENTARY MARKETSTHE PREVIOUS ENERGY & INDUSTRIAL PLATFORM WAS RENAMED POWER & WATER
A Group of world class companies and brands aligned to the same purpose and vision, and guided by the same set of values with a common owner, Murray & Roberts Holdings Ltd
Murray & Roberts Purpose
Delivery of infrastructure in a sustainable way to facilitate economic and social development
Stop.Think.Act.24/7: Safety first in everything we do
Murray & Roberts Values
• Accountability• Care• Respect • Commitment• Integrity
Murray & Roberts Vision
By 2020 we aim to be a leading diversified international project engineering, procurement
and construction group in selected natural resources sectors and supporting infrastructure
Business Platforms
Oil & Gas Underground Mining Power & Water Infrastructure & Building

ENGINEERED EXCELLENCE© Murray & Roberts 2015 | 10
A LEADING DIVERSIFIED INTERNATIONAL PROJECT ENGINEERING,
PROCUREMENT AND CONSTRUCTION GROUP BY 2020
Grow profitability and cash flows
Focus on international natural resource market sectors
Diversify business model into higher margin segments
Enhance shareholder value
Strategic priority
• Achieve industry leading HSE performance• Enhance leadership capabilities and bench strength• Improve employee relations and employee engagement
• Resolve Gautrain and Dubai claims and Gautrain water ingress• Enhanced EBT, free cash flow and ROICE performance
• Grow gas (LNG), metals & minerals and power market presences• Enter industrial water market sector
• Reposition Murray & Roberts and its brand with all stakeholders• Enhance market valuation and positioning• Clarity on dividend policy
Strategic objectives
Enhance the safety, performance and diversity of our people
Deliver project and commercial management excellence
• Expand specialist engineering capabilities into all project value chain segments to offer more complete project solutions to clients
• Grow commissioning, brownfields and O&M capabilities• Invest in selected project development opportunities
• Enhanced EPC and project management capabilities• Entrench project, risk and commercial management best practice

ENGINEERED EXCELLENCE© Murray & Roberts 2015 | 11
ENGINEERING AND CONSTRUCTION SERVICE OFFERING ACROSS PROJECT
VALUE CHAIN IN SELECTED NATURAL RESOURCES MARKET SECTORS
Infrastructure &
Building
Power & Water
Underground
Mining
Oil & Gas
• Detailed engineering• Procurement• Construction• Commissioning
• Detailed engineering• Procurement• Construction• Commissioning and maintenance
• Detailed engineering• Procurement• Construction• Commissioning and maintenance• Operations
• Detailed engineering• Procurement• Construction• Commissioning and maintenance
Service and Operations
Infrastructure Construction
General
Process EPC
Design and Engineering /
Technical Consulting
PlatformPlatform CapabilitiesCapabilities
• Africa• Middle East
• Africa
• Americas• Africa• Asia• Australia
• Australasia• Asia• Americas• EMEA
GeographyGeography Project value chainProject value chain

ENGINEERED EXCELLENCE© Murray & Roberts 2015 | 12
Source: Annual reports, Bloomberg, BCG
0 %
10 %
20 %
30 %
40 %
50 %
IMPROVED RETURNS THROUGH BUSINESS MODEL DIVERSIFICATION
INCREASE CONTRIBUTION OUTSIDE CLASSIC CONSTRUCTION
15-45%
0-30%
5-15%
0-10%
0-30%
0-15%0-5%
10-20%
2-10%
0-40%
DevelopmentClassic
constructionOperations ServicesEngineering
Invest in selected project development
opportunities
Expand specialist engineering capabilities
Grow commissioning & asset support and operations & maintenance (O&M) capabilities
Typical ROCE
Typical EBIT margin
Typical return and margin range per value chain segment

ENGINEERED EXCELLENCE© Murray & Roberts 2015 | 13
CHANGING BUSINESS MODEL THROUGH BOLT-ON ACQUISITIONS
• Value: R57m• Location: Hanover and Houston, United States• Description:
- CH·IV International has been providing LNG engineering and consulting services to a wide base of clients encompassing the entire LNG value chain since 1991.
- CH·IV’s employees have a combined total of over 150 years of engineering experience covering the entire LNG value chain.
- From gas treatment and liquefaction, through marine and land transportation to the final import regasification and delivery of the gas to the consumer.
• Value: R79m• Location: Ayrshire, Scotland• Description:
- Booth Welsh is an engineering services company founded in 1989.- The company operates globally providing services to blue chip clients across a broad spectrum of
industries.- Booth Welsh leads the way in the provision of process consultancy, engineering and design, project
management, implementation and commissioning specialising in providing instrument, control and electrical engineering including configuration, installation, maintenance and renewal of control engineering systems.
•
• Booth Welsh employ over 200 personnel and have a proud track record in providing tailor-made, cost effective and flexible solutions for clients in the Whisky, Oil & Gas, Pharmaceutical, Nuclear, Petrochemical, Chemical, Utilities and Food & Beverage industries.
• Value: R28m• Location: Cape Town, South Africa• Description:
- Over the past 15 years Aquamarine Water Treatment has developed a complete line of efficient equipment and chemicals to ensure safe, and sustainable treatment programmes.
- Aquamarine has extensive knowledge in all processes from conventional water treatment to specialised reverse osmosis, desalination and ultra filtration systems.
- All systems are designed and manufactured by in-house design and manufacturing engineers.

ENGINEERED EXCELLENCE© Murray & Roberts 2015 | 14
268
614
1 383
4681
144
-
300
600
900
1 200
1 500
FY13 FY14 FY15
e2o
Turnover EBITRevenue
272
93
25 18 9 2
- 40 80
120 160 200 240 280
Booth Welsh CH-IV Acquamarine
Revenue EBIT
FY15 Performance7%
10%
8%
% Margin
Rm
Rm
Includes results from date of acquisition.
Includes results for full financial year for comparison purposes.

ENGINEERED EXCELLENCE© Murray & Roberts 2015 | 15
INTERNATIONAL DIVERSIFICATION
• International
diversification approach:
� Geographic positioning
– permanent presence
(offices) in regions with
major opportunity in
selected market
segments
� Major clients – follow
major clients on project-
by-project basis into
other regions
• Globally employing about
20 000 people
North Bay
Johannesburg
Kalgoorlie
Perth
Accra
Salt Lake
City
Santiago
GaboroneWindhoek
Cape Town
Dubai
BrisbaneMaputo
Kitwe
Glasgow
Houston
PNG
Corporate
Underground Mining
Infrastructure & Building
Oil & Gas
Power & Water
Murray & Roberts active projects
Offices

ENGINEERED EXCELLENCE© Murray & Roberts 2015 | 16

ENGINEERED EXCELLENCE© Murray & Roberts 2015 | 17
Rm 2015 2014 Variance
Revenue 30 568 36 039 (5 471)
EBITDA 1 742 2 241 (499)
EBIT 1 125 1 533 (408)
Net interest expense (72) (58) (14)
Taxation (194) (499) 305
Income from equity accounted investments 3 1 2
Discontinued operations* 32 423 (391)
Non-controlling interests (13) (139) 126
Attributable profit 881 1 261 (380)
STATEMENT OF FINANCIAL PERFORMANCE
1. Lower EBIT due to poor performance and restructuring costs in Power & Water platform, and downturn in oil & gas market.
2. Tax saving as a result of utilisation of tax losses.
3. The prior year profit includes a profit on sale of discontinued operations of R379m and R44m trading profit from discontinued operations.
*Reported numbers are after tax and interest, but before non-controlling interests.

ENGINEERED EXCELLENCE© Murray & Roberts 2015 | 18
Rm 2015 2014 Variance
Total assets 18 803 19 811 (1 008)
Property, plant and equipment 3 021 3 248 (227)
Other non-current assets 4 622 4 075 547
Current assets 8 185 7 781 404
Cash and cash equivalents 2 891 4 301 (1 410)
Assets classified as held-for-sale 84 406 (322)
Total equity and liabilities 18 803 19 811 (1 008)
Shareholders’ equity 6 523 5 932 591
Interest bearing debt - short term 337 2 064 (1 727)
- long term 1 141 455 686
Other non-current liabilities 1 385 1 453 (68)
Current liabilities 9 413 9 808 (395)
Liabilities classified as held-for-sale 4 99 (95)
Net cash 1 413 1 782 (369)
STATEMENT OF FINANCIAL POSITION
1. Interest bearing debt reduced by R1bn.
2. Lower net cash position mainly due to the repayment of advance payments and acquisition funding.

ENGINEERED EXCELLENCE© Murray & Roberts 2014 | 19
23%
14%
25%
38%
Revenue
* Internationally-focussed
EARNINGS UNDERPINNED BY INTERNATIONAL PLATFORMS
AS AT 30 JUNE 2015
16%
(10%)
31%
63%
EBIT (Before Corporate Cost)
Underground Mining*
Infrastructure & Building
Oil & Gas*
Power & Water
International – 63%
Africa – 37%
International – 94%
Africa – 6%
• Internationally-focused
platforms (Oil & Gas
and Underground
Mining) contribute 63%
of revenue and 94% of
EBIT (Before Corporate
costs).
• Increased contribution
expected from Africa-
focused platforms
when the market
becomes more
favourable.

ENGINEERED EXCELLENCE© Murray & Roberts 2014 | 20
66%
16%
8%
7%3%
Value chain turnover
SERVICES ACROSS PROJECT LIFECYCLE REFLECTS GROUP’S
CHANGING BUSINESS MODEL
32%
39%
17%
(1%)
13%
Value chain EBIT
Planning & Engineering
Operations
ConstructionCommissioning
• Construction activity
contributes 66% to
turnover and 32% to
EBIT.
• Planning &
Engineering,
Commissioning and
Maintenance &
Refurbishment attract
highest margins.
• Value chain
diversification
currently best achieved
in Oil & Gas platform.
Maintenance & Refurbishment

ENGINEERED EXCELLENCE© Murray & Roberts 2014 | 21
38%
37%
10%
8%
3% 3% 1%
Geographic turnover
GROUP IS TRANSFORMING TO BE AN INTERNATIONAL PLAYER
11%
63%
18%
(2%)6%
2%2%
Geographic EBIT
Oceania
Rest of Africa
South Africa
Americas
• 38% of turnover and
11% of EBIT from South
Africa.
• No contribution from
the ‘Rest of Africa’.
• Oceania (Oil & Gas) and
the Americas
(Underground Mining)
are the dominant
regions.
Asia
Middle EastEurope

ENGINEERED EXCELLENCE© Murray & Roberts 2015 | 22
Power & WaterOil & GasOil & Gas Underground Mining Infrastructure & Building
The decrease in the platform's operating results by R188m from the prior year is reflecting the changing market conditions in Australasia and fall in the oil price.
1. Engineering: Strong contribution, declining order book reflective of run-down of major projects in Australia.
2. Construction & Fabrication: Margins up due to close-out of projects, construction activity very limited.
3. Global Marine: No profit recognition on Wheatstone jetty project in Australia.
4. Commissioning & Brownfield: Good growth and margins as projects are moving into commissioning phase.
5. Corporate & Other: Declining overheads due to cost saving initiatives.
*Murray & Roberts Marine now reported under Global Marine in this platform.
Rm Engineering Construction & Fabrication Global Marine
Commissioning & Brownfields
Corporate & Other Total
2015 2014 2015 2014 2015 2014 2015 2014 2015 2014 2015 2014
Revenue 4 679 4 794 705 7 096 2 085 2 466 3 384 2 013 953 1 111 11 806 17 480
Operating profit/(loss) 666 698 103 428 51 117 389 215 (371) (432) 838 1 026
Operating margin (%) 14% 15% 15% 6% 2% 5% 11% 11% - - 7% 6%
Order book 4 405 7 971 - 1 014 832 2 437 3 209 5 292 - - 8 446 16 714
OIL & GAS
Oil & Gas*Oil & Gas*

ENGINEERED EXCELLENCE© Murray & Roberts 2015 | 23
Power & WaterOil & Gas Underground MiningUnderground Mining Infrastructure & Building
Rm Africa Australasia The Americas Total
2015 2014 2015 2014 2015 2014 2015 2014
Revenue 3 770 3 111 830 699 2 965 2 818 7 565 6 628
Operating profit 117 57 61 49 233 152 411 258
Operating margin (%) 3% 2% 7% 7% 8% 5% 5% 4%
Order book 11 877 6 157 1 812 556 3 058 3 225 16 747 9 938
UNDERGROUND MINING
The increase in the platform's operating results by R153m from the prior year is reflective of growing brownfield
work to replace infrastructure on operating mines.
1. Africa - Improvement in operational performance in South Africa in second half of the year and successful project closeouts in Zambia.
2. Australasia – Marginal growth and margins maintained in a challenging market.
3. The Americas – Excellent project delivery and margins on contracts in the USA.

ENGINEERED EXCELLENCE© Murray & Roberts 2015 | 24
Power & WaterPower & WaterOil & Gas Underground Mining Infrastructure & Building
* Power programme contracts and Genrec power programme contracts.** Includes Electrical & Control Systems, Resources & Industrial, Water and Power & Energy non-power programme projects and Genrec non-power programme contracts.
POWER & WATER
Rm Power programme* Engineering** Total
2015 2014 2015 2014 2015 2014
Revenue 3 154 3 685 1 084 1 070 4 238 4 755
Operating profit / (loss) 189 238 (323) (94) (134) 144
Operating margin (%) 6% 6% (30%) (9%) (3%) 3%
Order book 5 194 5 503 804 657 5 998 6 160
The decrease in the platform's operating results by R278m from the prior year is mainly due to poor operational
performance and platform restructuring cost.
1. Power Programme – Margins maintained, but revenue and profit down due to industrial action at Medupi power station.
2. Engineering – Losses on contracts in Resources & Industrial and Electrical & Control Systems.
– Platform restructuring costs. Resources & Industrial and Electrical & Control Systems now incorporated in the Power & Energy business.

ENGINEERED EXCELLENCE© Murray & Roberts 2015 | 25
Power & WaterOil & Gas Underground Mining Infrastructure & BuildingInfrastructure & Building
INFRASTRUCTURE & BUILDING
Rm Construction Africa Marine Middle East Total
2015 2014 2015 2014 2015 2014 2015 2014
Revenue 6 019 5 740 - 496 940 940 6 959 7 176
Operating profit / (loss) 177 (189) - 302 28 83 205 196
Operating margin (%) 3% (3%) - 61% 3% 9% 3% 3%
Order book 4 874 5 881 - 125 2 216 2 073 7 090 8 079
The increase in the platform's operating results by R9m from the prior year is mainly attributable to:
1. Construction Africa - Water ingress provision raised in prior period of R300m.
- Fair value adjustment of R172m (2014: R234m) in Bombela Concessions Company.
- Excluding above, improvement of R132m due to slight improvement in construction and lower cost in Gautrain Bombela Civil Joint Venture.
2. Marine – 2014 includes GPMOF settlement of R323m – now reported under Oil & Gas.
3. Middle East – Mafraq Hospital reported a break even result.– Prior year included close out profits on legacy contracts.

ENGINEERED EXCELLENCE© Murray & Roberts 2015 | 26
Disposal of non-core assetsDisposal of non-core assets
The Group has largely concluded the disposal of its discontinued operations. The decrease in the discontinued operations' operating results by R561m from the prior year is mainly attributable to:
1. Profit on sale of the Construction Products businesses in the prior year (R553m).
2. Trading profits of four months from Construction Products in prior year.
3. The majority of the Tolcon business was sold on 31 August 2014.
4. Balance of Tolcon business, Cape Point Partnership and Entilini sale is currently subject to remaining conditions precedent.
* Includes Hall Longmore and UCW** Before tax and non-controlling interests
DISPOSAL OF NON-CORE ASSETS
Rm Tolcon
Steel Reinforcing
Products
Clough Marine Services & Properties Properties SA
Construction Products* Total
2015 2014 2015 2014 2015 2014 2015 2014 2015 2014 2015 2014
Revenue 89 414 2 113 3 12 - 2 (6) 1 484 88 2 025
Operating profit / (loss)** 18 50 14 47 (4) (45) - 6 (9) 522 19 580
ENGINEERED EXCELLENCE© Murray & Roberts 2015 | 27
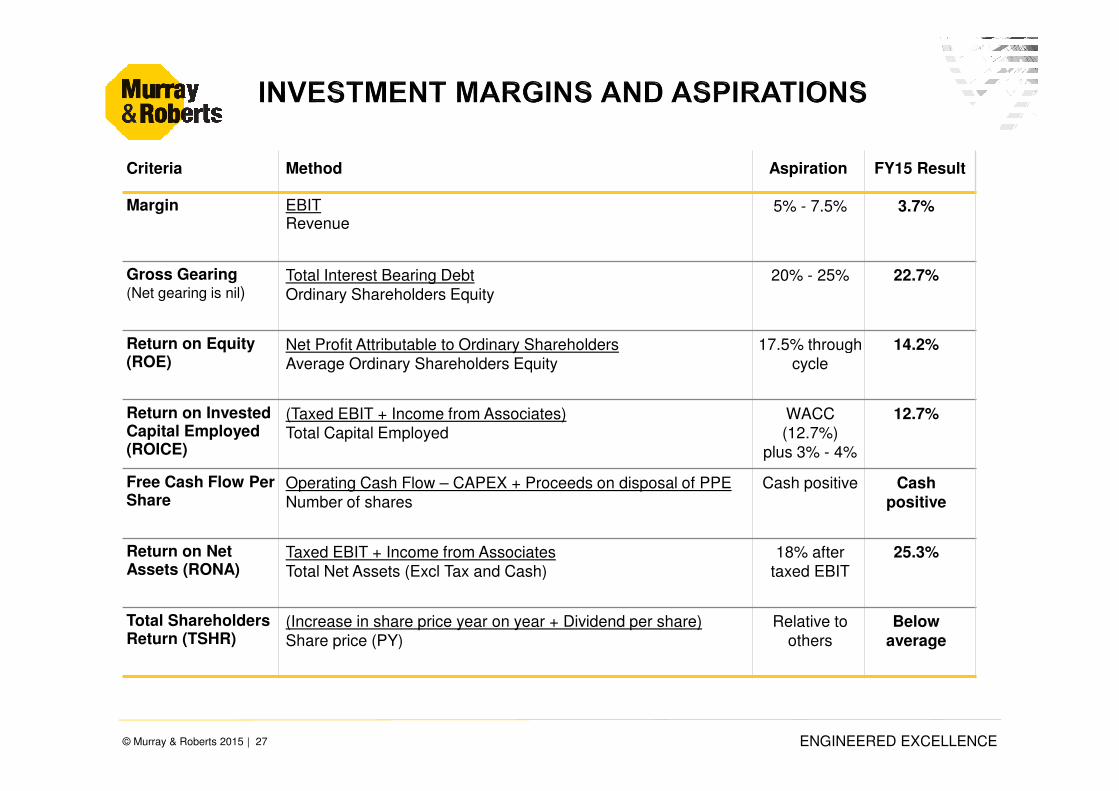
Criteria Method Aspiration FY15 Result
Margin EBIT Revenue
5% - 7.5% 3.7%
Gross Gearing(Net gearing is nil)
Total Interest Bearing Debt
Ordinary Shareholders Equity
20% - 25% 22.7%
Return on Equity (ROE)
Net Profit Attributable to Ordinary ShareholdersAverage Ordinary Shareholders Equity
17.5% through cycle
14.2%
Return on Invested Capital Employed (ROICE)
(Taxed EBIT + Income from Associates)Total Capital Employed
WACC (12.7%)
plus 3% - 4%
12.7%
Free Cash Flow Per Share
Operating Cash Flow – CAPEX + Proceeds on disposal of PPENumber of shares
Cash positive Cash positive
Return on Net Assets (RONA)
Taxed EBIT + Income from AssociatesTotal Net Assets (Excl Tax and Cash)
18% after taxed EBIT
25.3%
Total Shareholders Return (TSHR)
(Increase in share price year on year + Dividend per share)Share price (PY)
Relative to others
Belowaverage

ENGINEERED EXCELLENCE© Murray & Roberts 2015 | 28

ENGINEERED EXCELLENCE© Murray & Roberts 2015 | 29
Oil & GasOil & GasUnderground
Mining
Underground
MiningPower & WaterPower & Water
Infrastructure &
Building
Infrastructure &
BuildingTotalTotal
DECREASING ORDER BOOK REFLECTIVE OF SUBDUED MARKET
Jun2014
Dec2014
Jun2015
Jun2014
Dec2014
Jun2015
Jun2014
Dec2014
Jun2015
Jun2014
Dec2014
Jun2015
Jun2014
Dec2014
Jun2015
9.9bn
13.8bn16.8bn
8.1bn6.4bn 7.1bn
40.9bn
37.8bn 38.3bn
6.2bn 5.4bn 6.0bn
16.7bn
12.2bn
8.4bn
1. The Oil & Gas order book reflects the transition from large and long-term greenfield capital projects to smaller volume and shorter term contracts for commissioning, brownfields and maintenance services – the order book also reflects a downturn in the oil & gas market.
2. Underground Mining platform order book includes the awards of the R4.8bn Kalagadi Manganese andR3bn Booysendal projects.
TotalTotal

ENGINEERED EXCELLENCE© Murray & Roberts 2015 | 30
STRONG PIPELINE BUT TIMING UNCERTAIN
Pipeline
R’bn Order Book Near orders Category 1 Category 2 Category 3
Infrastructure & Building 7.1 2.0 12.0 61.6 40.0
Power & Water 6.0 - 14.0 12.7 21.2
Underground mining 16.8 5.2 29.2 11.8 22.5
Oil & Gas 8.4 0.7 20.1 7.6 163.9
Total 38.3 7.9 75.3 93.7 247.6
PIPELINE DEFINITION
Near Orders: Tenders where the Group is the preferred bidder and final award is subject to financial / commercial close.There is more than a 95% chance that these orders will be secured.
Category 1: Tenders the Group is currently working on (excluding Near Orders). Projects developed by clients to thestage where firm bids are being obtained. Chance of being secured as firm orders a function of final clientapproval as well as bid strike rate.
Category 2: Budgets, feasibilities and prequalification the Group is currently working on. Project planning underway, notat a stage yet where projects are ready for tender.
Category 3: Opportunities which are being tracked and are expected to come to the market in the next 36 months.Identified opportunities that are likely to be implemented, but still in pre-feasibility stage.

ENGINEERED EXCELLENCE© Murray & Roberts 2015 | 31
38.340.92016
R20.7bn2017
R8.9bn>2018R8.7bn
SADC Int. 2014 2015 FY Time Distribution
GEOGRAPHY & TIME DISTRIBUTION
PlatformPlatform
Infrastructure
& Building
Power &
Water
Underground
Mining
Oil & Gas
2015 Order book % split
2015 Order book % split
Order book Rbn
Order book Rbn
Order bookRbn
Order bookRbn
70 30
70 30
100
100
8.4
16.8
6.0
7.1
16.7
9.9
6.2
8.1
6.8
1.6
0.0
2016
2017
>2018
5.8
3.7
7.3
2016
2017
>2018
3.0
1.9
1.1
2016
2017
>2018
5.1
1.7
0.3
2016
2017
>2018
43%60% 40%
Margin Aspiration
Margin Aspiration
5 - 7.5
%
5 - 7.5
5 - 7.5
1 - 3

ENGINEERED EXCELLENCE© Murray & Roberts 2015 | 32
This platform contains no exposure to opencast mining projects
COMMODITY ORDER BOOK BREAKDOWN %
27%
13%
11%
18%
Copper
Gold
Diamonds
Silver
Platinum
Coal
Nickel & Copper
Potash
Other
Copper-Gold
1%
35%
13%
3%
2%
16%
9%
4%
42%
3%
Manganese
7%
3%
30%
3%
18%80%
13%
Total Platform R16,8bn
June 2015
Total Platform R16,8bn
June 2015
The Americas
R3,1bn
The Americas
R3,1bn
Australasia R1,8bn
Australasia R1,8bn
Africa
R11,9bn
Africa
R11,9bn
Total Platform R9,9bn
June 2014
Total Platform R9,9bn
June 2014
Salt
Niobium
41%
30%
4%5%
6%
9%
2%1%
2% 1%5%
23%
1%
19%

ENGINEERED EXCELLENCE© Murray & Roberts 2015 | 33

ENGINEERED EXCELLENCE© Murray & Roberts 2015 | 34
Gautrain Rapid Rail LinkGPMOF Dubai International Airport
• Claims settled.
• The certificate for
final completion is
being issued and
the guarantees
returned.
• Sandton Cavern
- Ruled in BCJV’s favour, quantum award expected
by end Sep 15.
• Delay & Disruption
- Two arbitrations rulings (cantilever bridges and late
handover of land) in BCC’s favour. Claim’s legal
basis now confirmed.
- Merit and quantum hearings to commence in Q1 of
calendar year 2016.
- Commercial closeout expected by the end of 2017.
• Water Ingress
- A provision* of about R300m has been raised.
- Various unresolved matters between parties, relating
to arbitration award, will be heard in court.
• Arbitration process continuing.
• Process of amicable engagement
running in parallel with the legal
proceedings.
• Commercial closeout expected
towards the end of calendar 2016.
* Based on an assessment by a panel of technical experts and design consultants who were appointed to perform a technical evaluation of the potentialremedial work that may be required, the Company raised a provision of about R300m in the prior year for its share (45% shareholding) of potential costs to beincurred by the Bombela Civil Joint Venture. The amount of other potential financial compensation, if any, related to the matter cannot be determined at this time.Various matters between the parties, relating to the arbitration award, remain unresolved and the timing of any future work is uncertain.

ENGINEERED EXCELLENCE© Murray & Roberts 2015 | 35
SUPPORTS LONG-TERM NATURAL RESOURCES FOCUS
Oil & Gas
Underground
Mining
• Market very uncertain due the low oil price – investment decisions being delayed / deferred.
• Strong short to medium term growth in Australasian LNG commissioning, operations & maintenance market – Clough has largest share of Australasian commissioning market via e2o.
• New medium to long term LNG project opportunities in US / Africa expected to present growth potential.
• CH-IV (US-based) secured larger engineering contracts than prior to the acquisition by Clough,
including two owner’s engineering contracts for US LNG projects, Magnolia and Freeport.
• Booth Welsh (UK-based) benefitted from increased engineering work for existing customers.
• Expansion into the government infrastructure sector in Australia presents major near-term opportunity. Alternative income stream following changing LNG market in Australia and globally.
• Near orders R0.7bn and pipeline R20.1bn (category 1).
• Low demand for commodities and weak commodity prices limiting further growth potential.
• Commodity cycle upturn expected in the medium term with large pipeline of underground mining projects, including new mine developments.
• Notwithstanding market conditions, operating profit up by 60%.
• Further growth expected from increasing demand for infrastructure replacement work on operating mines, as well as new Booysendal and Kalagadi contracts.
• Well positioned for major project opportunities: York Potash (UK), Oyu Tolgoi (Mongolia), Freeport scope growth (Indonesia).
• Near orders R5.2bn and pipeline R29.2bn (category 1).

ENGINEERED EXCELLENCE© Murray & Roberts 2015 | 36
SUPPORTS LONG-TERM NATURAL RESOURCES FOCUS
Power & Water
Infrastructure &
Building
• Medupi & Kusile to provide baseload work for the next 4/5 years, although declining year-on-year.
• Opportunity in maintenance and refurbishment of older Eskom thermal power stations.
• Power sector to see increased levels of private investment as South African government launches tenders for thermal generation IPPs.
• South African nuclear capacity to be added to power mix by 2030.
• Well positioned for participation in opportunities in the renewable power sector – Ilanga solar opportunity reached financial close in Mar 2015.
• Aquamarine’s (Water Treatment) containerised water treatment systems to be offered in Africa.
• Pipeline R14bn (category 1) – no near orders.
• Subdued market and growth dependant on increased investment in fixed capital formation.
• Reported profit for the second consecutive year under continuing difficult market conditions.
• Co-developer of residential building opportunity with expected project value of about R1bn.
• Well positioned for building opportunities in Africa with a South African blue chip financial services firm and for a global healthcare provider.
• Local market presenting ongoing road project opportunities.
• Need for new transport infrastructure with rail and port sectors creates opportunity for growth.
• South African nuclear capacity to be added to power mix by 2030.
• Near orders R2bn and pipeline R12bn (category 1).

ENGINEERED EXCELLENCE© Murray & Roberts 2015 | 37
Full project lifecycle service offering, exposure to select natural resources market sectors, and
international diversification.

ENGINEERED EXCELLENCE© Murray & Roberts 2015 | 38
This presentation includes certain various “forward-looking statements” within the meaning of Section 27A of the US Securities Act 10 1933 and
Section 21 E of the Securities Exchange Act of 1934 that reflect the current views or expectations of the Board with respect to future events and
financial and operational performance. All statements other than statements of historical fact are, or may be deemed to be, forward-looking
statements, including, without limitation, those concerning: the Group’s strategy; the economic outlook for the industry and the Group’s liquidity and
capital resources and expenditure. These forward-looking statements speak only as of the date of this presentation and are not based on historical
facts, but rather reflect the Group’s current expectations concerning future results and events and generally may be identified by the use of forward-
looking words or phrases such as “believe”, “expect”, “anticipate”, “intend”, “should”, “planned”, “may”, “potential” or similar words and phrases. The
Group undertakes no obligation to update publicly or release any revisions to these forward looking statements to reflect events or circumstances
after the date of this presentation or to reflect the occurrence of any unexpected events.
Neither the content of the Group’s website, nor any website accessible by hyperlinks on the Group’s website is incorporated in, or forms part of, this
presentation.

ENGINEERED EXCELLENCE
REPORT TO
STAKEHOLDERS
FOR THE YEAR ENDED
30 JUNE 2015
This presentation is available on www.murrob.com

ENGINEERED EXCELLENCE
REPORT TO
STAKEHOLDERS
FOR THE YEAR ENDED
30 JUNE 2015
APPENDIX

ENGINEERED EXCELLENCE© Murray & Roberts 2015 | 41

ENGINEERED EXCELLENCE© Murray & Roberts 2015 | 42
*Reported numbers are after tax and interest, but before non-controlling interests.
Rm 2015 2014 Variance
Revenue 30 568 36 039 (5 471)
EBITDA 1 742 2 241 (499)
EBIT 1 125 1 533 (408)
Net interest expense (72) (58) (14)
Taxation (194) (499) 305
Income from equity accounted investments 3 1 2
Discontinued operations* 32 423 (391)
Non-controlling interests (13) (139) 126
Attributable profit 881 1 261 (380)
STATEMENT OF FINANCIAL PERFORMANCE

ENGINEERED EXCELLENCE© Murray & Roberts 2015 | 43
Rm 2015 2014 Variance
Revenue 30 568 36 039 (5 471)
EBITDA 1 742 2 241 (499)
EBIT 1 125 1 533 (408)
Net interest expense (72) (58) (14)
Taxation (194) (499) 305
Income from equity accounted investments 3 1 2
Discontinued operations 32 423 (391)
Non-controlling interests (13) (139) 126
Attributable profit 881 1 261 (380)
STATEMENT OF FINANCIAL PERFORMANCE
Revenue decreased by 15%.
1. Decrease relates mainly to capital projects coming to an end in the Oil & Gas platform and new work not materialising
outside the power programme in South Africa.

ENGINEERED EXCELLENCE© Murray & Roberts 2015 | 44
Rm 2015 2014 Variance
Revenue 30 568 36 039 (5 471)
EBITDA 1 742 2 241 (499)
EBIT 1 125 1 533 (408)
Net interest expense (72) (58) (14)
Taxation (194) (499) 305
Income from equity accounted investments 3 1 2
Discontinued operations 32 423 (391)
Non-controlling interests (13) (139) 126
Attributable profit 881 1 261 (380)
STATEMENT OF FINANCIAL PERFORMANCE
EBITDA is reflected before:
1. Lower depreciation of R575m (2014: R685m), due to lower capital spend in Underground Mining.
2. Amortisation of intangible assets of R42m (2014: R23m).
3. Refer to EBIT explanation on slide 45.

ENGINEERED EXCELLENCE© Murray & Roberts 2015 | 45
Rm 2015 2014 Variance
Revenue 30 568 36 039 (5 471)
EBITDA 1 742 2 241 (499)
EBIT 1 125 1 533 (408)
Net interest expense (72) (58) (14)
Taxation (194) (499) 305
Income from equity accounted investments 3 1 2
Discontinued operations 32 423 (391)
Non-controlling interests (13) (139) 126
Attributable profit 881 1 261 (380)
STATEMENT OF FINANCIAL PERFORMANCE
The decrease in EBIT from the prior year is mainly attributable to:
1. Reversal of R278m due to loss making projects in Power & Water and lack of new work.
2. Although there was a decrease of R188m in the Oil & Gas platform due to new work not materialising and no profit
taken on Wheatstone Jetty, it is still the largest profit contributor in the Group.
3. Increase in Underground Mining due to improved project earnings in Cementation Africa and the Americas, as well
as the close-out of loss making contracts (+R153m).
4. Corporate overheads remain largely unchanged, however negatively impacted by forex profits included in prior year
(-R104m).

ENGINEERED EXCELLENCE© Murray & Roberts 2015 | 46
Rm 2015 2014 Variance
Revenue 30 568 36 039 (5 471)
EBITDA 1 742 2 241 (499)
EBIT 1 125 1 533 (408)
Net interest expense (72) (58) (14)
Taxation (194) (499) 305
Income from equity accounted investments 3 1 2
Discontinued operations 32 423 (391)
Non-controlling interests (13) (139) 126
Attributable profit 881 1 261 (380)
STATEMENT OF FINANCIAL PERFORMANCE
Increase in net interest expense attributable to:
1. Full year effect of Clough minority transaction in December 2013 which was funded from cash (R2.9bn) and
interest bearing debt (R1.5bn).

ENGINEERED EXCELLENCE© Murray & Roberts 2015 | 47
Rm 2015 2014 Variance
Revenue 30 568 36 039 (5 471)
EBITDA 1 742 2 241 (499)
EBIT 1 125 1 533 (408)
Net interest expense (72) (58) (14)
Taxation (194) (499) 305
Income from equity accounted investments 3 1 2
Discontinued operations 32 423 (391)
Non-controlling interests (13) (139) 126
Attributable profit 881 1 261 (380)
STATEMENT OF FINANCIAL PERFORMANCE
The effective tax rate of 18.4% (2014: 33.8%) is attributable to:
1. Utilisation of tax losses.
2. Deferred tax assets only raised in Australia as and when profits are earned – tax is expected to normalise by 2017.
ENGINEERED EXCELLENCE© Murray & Roberts 2015 | 48
Rm 2015 2014 Variance
Revenue 30 568 36 039 (5 471)
EBITDA 1 742 2 241 (499)
EBIT 1 125 1 533 (408)
Net interest expense (72) (58) (14)
Taxation (194) (499) 305
Income from equity accounted investments 3 1 2
Discontinued operations 32 423 (391)
Non-controlling interests (13) (139) 126
Attributable profit 881 1 261 (380)
STATEMENT OF FINANCIAL PERFORMANCE
Increase in equity income is attributable to:
1. Income from 23% investment in Bombela Operating Company of R2m.

ENGINEERED EXCELLENCE© Murray & Roberts 2015 | 49
*Reported numbers are after tax and interest*Reported numbers are after tax and interest, but before non-controlling interests.
Rm 2015 2014 Variance
Revenue 30 568 36 039 (5 471)
EBITDA 1 742 2 241 (499)
EBIT 1 125 1 533 (408)
Net interest expense (72) (58) (14)
Taxation (194) (499) 305
Income from equity accounted investments 3 1 2
Discontinued operations* 32 423 (391)
Profit on disposal of businesses 11 379 (368)
Trading & other profits 21 44 (23)
STATEMENT OF FINANCIAL PERFORMANCE
Decrease in profit on disposal attributable to:
1. Profit on sale of Construction Products businesses in the prior year.
2. Current year includes two months trading and profit on sale of the Tolcon businesses.
Decrease in trading & other profits attributable to:
1. Prior year included four months trading of Construction products businesses.
2. Prior year included Tolcon for a full year of trading.

ENGINEERED EXCELLENCE© Murray & Roberts 2015 | 50
Rm 2015 2014 Variance
Revenue 30 568 36 039 (5 471)
EBITDA 1 742 2 241 (499)
EBIT 1 125 1 533 (408)
Net interest expense (72) (58) (14)
Taxation (194) (499) 305
Income from equity accounted investments 3 1 2
Discontinued operations 32 423 (391)
Non-controlling interests (13) (139) 126
Attributable profit 881 1 261 (380)
STATEMENT OF FINANCIAL PERFORMANCE
Decrease in non-controlling interests attributable to:
1. The acquisition of non-controlling interests in Clough on 11 December 2013.
2. Current year non-controlling interests mainly relate to Tolcon.

ENGINEERED EXCELLENCE© Murray & Roberts 2015 | 51
Rm 2015 2014 Variance
Revenue 30 568 36 039 (5 471)
EBITDA 1 742 2 241 (499)
EBIT 1 125 1 533 (408)
Net interest expense (72) (58) (14)
Taxation (194) (499) 305
Income from equity accounted investments 3 1 2
Discontinued operations 32 423 (391)
Non-controlling interests (13) (139) 126
Attributable profit 881 1 261 (380)
Continuing 859 839 20
Discontinuing 22 422 (400)
STATEMENT OF FINANCIAL PERFORMANCE
The increase in continuing attributable profit due to:Positive impact:
1. Favourable impact of non-controlling interests in Clough.2. Lower effective tax rate.
Negative impact:
1. Decrease in operating profit.
The decrease in discontinued attributable profit due to:
1. The profit on disposal of the Construction Products businesses in the prior year.

ENGINEERED EXCELLENCE© Murray & Roberts 2015 | 52

ENGINEERED EXCELLENCE© Murray & Roberts 2015 | 53
Rm 2015 2014 Variance
Total assets 18 803 19 811 (1 008)
Property, plant and equipment 3 021 3 248 (227)
Other non-current assets 4 622 4 075 547
Current assets 8 185 7 781 404
Cash and cash equivalents 2 891 4 301 (1 410)
Assets classified as held-for-sale 84 406 (322)
Total equity and liabilities 18 803 19 811 (1 008)
Shareholders’ equity 6 523 5 932 591
Interest bearing debt - short term 337 2 064 (1 727)
- long term 1 141 455 686
Other non-current liabilities 1 385 1 453 (68)
Current liabilities 9 413 9 808 (395)
Liabilities classified as held-for-sale 4 99 (95)
Net cash 1 413 1 782 (369)
STATEMENT OF FINANCIAL POSITION

ENGINEERED EXCELLENCE© Murray & Roberts 2015 | 54
Rm 2015 2014 Variance
Total assets 18 803 19 811 (1 008)
Property, plant and equipment 3 021 3 248 (227)
Other non-current assets 4 622 4 075 547
Current assets 8 185 7 781 404
Cash and cash equivalents 2 891 4 301 (1 410)
Assets classified as held-for-sale 84 406 (322)
Total equity and liabilities 18 803 19 811 (1 008)
Shareholders’ equity 6 523 5 932 591
Interest bearing debt - short term 337 2 064 (1 727)
- long term 1 141 455 686
Other non-current liabilities 1 385 1 453 (68)
Current liabilities 9 413 9 808 (395)
Liabilities classified as held-for-sale 4 99 (95)
Net cash 1 413 1 782 (369)
STATEMENT OF FINANCIAL POSITION
Decrease in property, plant and equipment due to:
1. Capex of R425m is lower than prior year (R961m) mainly due to reduced capex in the Underground Mining and
Oil & Gas operations.
2. Capex comprise of expansion capex (R290m) and maintenance capex (R135m).

ENGINEERED EXCELLENCE© Murray & Roberts 2015 | 55
Rm 2015 2014 Variance
Total assets 18 803 19 811 (1 008)
Property, plant and equipment 3 021 3 248 (227)
Other non-current assets 4 622 4 075 547
Current assets 8 185 7 781 404
Cash and cash equivalents 2 891 4 301 (1 410)
Assets classified as held-for-sale 84 406 (322)
Total equity and liabilities 18 803 19 811 (1 008)
Shareholders’ equity 6 523 5 932 591
Interest bearing debt - short term 337 2 064 (1 727)
- long term 1 141 455 686
Other non-current liabilities 1 385 1 453 (68)
Current liabilities 9 413 9 808 (395)
Liabilities classified as held-for-sale 4 99 (95)
Net cash 1 413 1 782 (369)
STATEMENT OF FINANCIAL POSITION
Increase in non-current assets attributable to:
1. Increase in deferred taxation assets (+R169m).
2. Increase in goodwill due to acquisitions during the year (+R150m).
3. Increase in other intangibles (+R90m).
Non-current assets comprise mainly of:
1. Non-current portion of uncertified revenue including the MEP subcontractor on the Dubai Airport
and Gautrain (R 2 259m).
2. Investment in Concession (R708m).
3. Deferred taxation assets (R596m).
4. Goodwill and intangible assets (R844m).
5. Vendor loans (R44m).

ENGINEERED EXCELLENCE© Murray & Roberts 2015 | 56
Rm 2015 2014 Variance
Total assets 18 803 19 811 (1 008)
Property, plant and equipment 3 021 3 248 (227)
Other non-current assets 4 622 4 075 547
Current assets 8 185 7 781 404
Cash and cash equivalents 2 891 4 301 (1 410)
Assets classified as held-for-sale 84 406 (322)
Total equity and liabilities 18 803 19 811 (1 008)
Shareholders’ equity 6 523 5 932 591
Interest bearing debt - short term 337 2 064 (1 727)
- long term 1 141 455 686
Other non-current liabilities 1 385 1 453 (68)
Current liabilities 9 413 9 808 (395)
Liabilities classified as held-for-sale 4 99 (95)
Net cash 1 413 1 782 (369)
STATEMENT OF FINANCIAL POSITION
Decrease from the prior year due to:
1. Disposal of Tolcon businesses.
Remaining net assets classified as held for sale comprise:
1. Clough properties (R60m).
2. Cape Point Partnership (R10m) and Entilini (R5m).
3. Remnant of the Steel business assets (R5m).

ENGINEERED EXCELLENCE© Murray & Roberts 2015 | 57
Reclassification of debt between long and short term due to renegotiation of Australian facilities.
Rm 2015 2014 Variance
Total assets 18 803 19 811 (1 008)
Property, plant and equipment 3 021 3 248 (227)
Other non-current assets 4 622 4 075 547
Current assets 8 185 7 781 404
Cash and cash equivalents 2 891 4 301 (1 410)
Assets classified as held-for-sale 84 406 (322)
Total equity and liabilities 18 803 19 811 (1 008)
Shareholders’ equity 6 523 5 932 591
Interest bearing debt - short term 337 2 064 (1 727)
- long term 1 141 455 686
Other non-current liabilities 1 385 1 453 (68)
Current liabilities 9 413 9 808 (395)
Liabilities classified as held-for-sale 4 99 (95)
Net cash 1 413 1 782 (369)
STATEMENT OF FINANCIAL POSITION
Decrease of R1 041m in total interest bearing debt is attributable to:
1. Repayment of funding required to acquire the non-controlling interests in Clough.

ENGINEERED EXCELLENCE© Murray & Roberts 2015 | 58

ENGINEERED EXCELLENCE© Murray & Roberts 2015 | 59
NET CASH RECONCILIATION
Rm
Dividends received:
1. Dividends received from Concessions (R132m) and joint venture classified as held for sale (R35m).
1 782
1 413
1 575
167 122 139 162
46 509
125 425
720
107
0
500
1 000
1 500
2 000
2 500
3 000
3 500
4 000
30 June 2014
EBITDA cash items
Other cash
movements
Acquisition of
businesses
CapexAcquisition of
intangibles
Disposal Tolcon
Additional investments
Working capital
Dividends
received
Interest, tax &
dividends paid
Treasuryshares
30 June2015

ENGINEERED EXCELLENCE© Murray & Roberts 2015 | 60
NET CASH RECONCILIATION
Rm
1 782
1 413
1 575
167 122 139 162
46 509
125 425
720
107
0
500
1 000
1 500
2 000
2 500
3 000
3 500
4 000
30 June 2014
EBITDA cash items
Other cash
movements
Acquisition of
businesses
Acquisition of
intangibles
Additional investments
Working capital
Dividends
received
Interest, tax &
dividends paid
Treasuryshares
30 June2015
Disposal of Tolcon:
1. Disposal for a gross consideration of R186m (R132m net of working capital, transaction costs and other
adjustments).
2. R122m received to date with the remaining vendor loan of R10m receivable due in August 2016.
CapexDisposal Tolcon

ENGINEERED EXCELLENCE© Murray & Roberts 2015 | 61
NET CASH RECONCILIATION
Rm
1 782
1 413
1 575
167 122 139 162
46 509
125 425
720
107
0
500
1 000
1 500
2 000
2 500
3 000
3 500
4 000
30 June 2014
EBITDA cash items
Other cash
movements
Acquisition of
businesses
Acquisition of
intangibles
Additional investments
Working capital
Dividends
received
Interest, tax &
dividends paid
Treasuryshares
30 June2015
Acquisition of businesses comprise:
1. CH-IV (R57m).
2. Booth Welsh (R79m).
3. Aquamarine (R26m).
CapexDisposal Tolcon

ENGINEERED EXCELLENCE© Murray & Roberts 2015 | 62
NET CASH RECONCILIATION
Rm
1 782
1 413
1 575
167 122 139 162
46 509
125 425
720
107
0
500
1 000
1 500
2 000
2 500
3 000
3 500
4 000
30 June 2014
EBITDA cash items
Other cash
movements
Acquisition of
businesses
Acquisition of
intangibles
Additional investments
Working capital
Dividends
received
Interest, tax &
dividends paid
Treasuryshares
30 June2015
Working capital outflows relates mainly to:
1. Increase in uncertified revenue from prior year of R607m.
2. Repayment of advances (-R205m).
CapexDisposal Tolcon
R200m received on Mafraq hospital two weeks post year end.

ENGINEERED EXCELLENCE© Murray & Roberts 2015 | 63
NET CASH RECONCILIATION
Rm
1 782
1 413
1 575
167 122 139 162
46 509
125 425
720
107
0
500
1 000
1 500
2 000
2 500
3 000
3 500
4 000
30 June 2014
EBITDA cash items
Other cash
movements
Acquisition of
businesses
Acquisition of
intangibles
Additional investments
Working capital
Dividends
received
Interest, tax &
dividends paid
Treasuryshares
30 June2015
Capex comprise of:
1. Expansion capex (R290m) (Relates mainly to Cementation Africa (R121m), RUC (R28m), Americas (R48m)
and Clough (R46m).
2. Maintenance capex (R135m) (Relates mainly to Construction SADC (R74m) and Americas (R45m).
CapexDisposal Tolcon

ENGINEERED EXCELLENCE© Murray & Roberts 2015 | 64
NET CASH RECONCILIATION
Rm
1 782
1 413
1 575
167 122 139 162
46 509
125 425
720
107
0
500
1 000
1 500
2 000
2 500
3 000
3 500
4 000
30 June 2014
EBITDA cash items
Other cash
movements
Acquisition of
businesses
Acquisition of
intangibles
Additional investments
Working capital
Dividends
received
Interest, tax &
dividends paid
Treasuryshares
30 June2015
Interest, tax and dividends comprise of:
1. Tax paid in Clough (R134m), Americas (R111m) and Cementation Africa (R94m).
2. Dividends paid to shareholders (R207m).
CapexDisposal Tolcon

ENGINEERED EXCELLENCE© Murray & Roberts 2015 | 65
1906John Murray buys out James Stewart and continues trading as Murray & Stewart
1934Douglas Murray and Douglas Roberts enter into a partnership and form Roberts Construction
1967Murray & Stewart merged with Roberts Construction to form Murray & Roberts under the chairmanship ofDouglas Roberts
1902 TO PRESENT
1980sThe group’s activities in the field of process engineering, project management and design continues to develop
1900
1910
1920
1930
1940
1950
1960
1970
1980
1990
2000
2010
2020
1902John Murray arrives in South Africa and together with James Stewart forms Murray & Stewart
1920s Douglas Murray, John Murray’s son, meets Andrew and Douglas Roberts while studying civil engineering
1951Roberts Construction Holdings lists on the Johannesburg Stock Exchange
1970sMurray & Roberts starts diversifying its fields of interest, moves into different industries and defines itself as an industrial holding company
1990sMurray & Roberts commits to its major markets in South Africa and remains a highly diversified industrial Group
2011 – 2014A 3-year Recovery & Growth strategy is launched and the Group pursues a strategy of diversifying through the project value chain via strategic ‘bolt-on’ acquisitions
Early 2000’sMurray & Roberts undergoes a fundamental strategic change and defines itself as a group of world-class companies with a focus on the construction economies of the developing world. The Group acquires and wholly-owns Cementation (underground mining), Concor (construction) and acquires an interest in Clough (oil & gas).
2015 A New Strategic Future. The Group’s 2020 vision is that of a diverse international engineering & construction group focused on the natural resource market segments

ENGINEERED EXCELLENCE© Murray & Roberts 2015 | 66
Power & Water
Oil & Gas
Infrastructure & Building
Underground Mining

ENGINEERED EXCELLENCE© Murray & Roberts 2015 | 67
EXPERIENCED MANAGEMENT TEAM
COBUS BESTER
BCom (Acc) Hons CA(SA)
26 years in sector
GROUP FINANCIAL DIRECTOR
Cobus joined in 2006 and
appointed to the Board as
Group financial director in
July 2011.
HENRY LAAS
BEng (Mining) MBA
31 years in sector
GROUP CHIEF EXECUTIVE
Henry joined in 2001 and was
appointed to the Board and
as Group chief executive in
July 2011.
KEVIN GALLAGHER
BEng (Mechanical) Hons,
FIEAust
25 years in the sector
OPERATIONS EXECUTIVE
Kevin joined the Group in
2011 and appointed to the
executive committee on
11 December 2013. He is
responsible for the Oil & Gas
operating platform.
ORRIE FENN
BSc (Hons) Eng MPhil Eng
D Eng
33 years in the sector
OPERATIONS EXECUTIVE
Orrie joined and was
appointed to the executive
committee in 2009. He is
responsible for the
Underground Mining
operating platform.
JEROME GOVENDER
BSc (QS) MSc MBA
21 years in the sector
OPERATIONS EXECUTIVE
Jerome joined in 2002 and
was appointed to the
executive committee on
1 August 2012. He is
responsible for the
Infrastructure & Building
operating platform.
ANDREW SKUDDER
BSc PDM MBA
14 years in the sector
SUSTAINABILITY EXECUTIVE
IAN HENSTOCK
BCompt (Hons) CA(SA) HDip Tax Law MBA
7 years in the sector
COMMERCIAL EXECUTIVE
THOKOZANI MDLULI
BSc PBL MBL
20 years in the sector
HEALTH, SAFETY & ENVIRONMENT EXECUTIVE“Sector” is defined as the Engineering, Construction and Mining sectors.

ENGINEERED EXCELLENCE© Murray & Roberts 2015 | 68
Murray & Roberts has a sponsored Level 1 ADR programme (Since 2009)
Bloomberg ticker: MURZY
CUSIP: 626805204
Ratio: 1 ADR: 1 Ordinary Share
Exchange Traded: Over-the-counter (OTC) market
Depositary bank: Deutsche Bank Trust Company Americas
Depositary bank contact: Jane Taylor
ADR broker helpline: +1 212 250 9100 (New York)
+44 207 547 6500 (London)
E-mail: [email protected]
ADR website: www.adr.db.com
Depositary bank’s local custodian: Computershare, South Africa

ENGINEERED EXCELLENCE© Murray & Roberts 2015 | 69
ENGINEERED EXCELLENCE
REPORT TO
STAKEHOLDERS
FOR THE YEAR ENDED
30 JUNE 2015
This presentation is available on www.murrob.com


