Forensic analysis of a rock burst event at the Kiirunavaara Mine – results and implications for the future
J. Sjöberg, C. Dahnér & L. Malmgren LKAB, Kiruna, Sweden
F. Perman Vattenfall Power Consultant AB, Luleå, Sweden
ABSTRACT: This paper presents a forensic analysis of a rock burst fatality event comprisingdamage mapping, structural mapping, seismological analysis, and three-dimensional numerical modeling. Three hypotheses for the cause of the event were proposed and further examined through numerical modeling. Numerical analysis was performed using 3DEC, using both elastic and plastic material models, and with and without geological structures included, to develop an understanding of the factors governing seismicity. The numerical modeling results showed, similarly to other analyses, that shear along pre-existing geological structures (i.e. fault slip) was a plausible reason for the seismic event. Following this rock burst, a range of measures have been implemented in the mine, e.g. a mine-wide seismic monitoring network, dynamic reinforcement, and revised mining sequences. The strategy for future modeling is also discussed.
1 INTRODUCTION
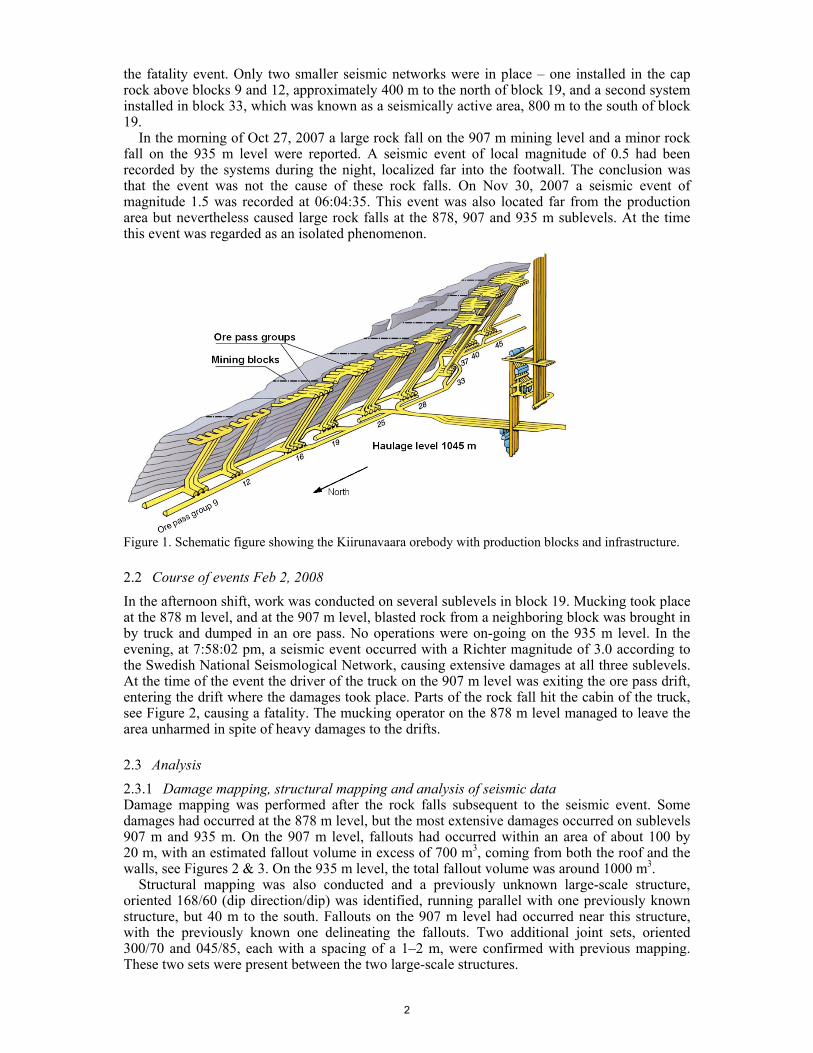
The LKAB Kiirunavaara iron ore underground mine is located in the city of Kiruna, approximately 150 km north of the Arctic Circle in northern Sweden. Mining is conducted using large-scale sublevel caving with a high degree of automation. Annual production amounts to 27 million metric tons of crude ore, as of 2010. The approximately 4000 m long and 80 m wide orebody, strikes nearly north-south and dips 55°–60° toward east. The mine is divided into 10 production blocks, named from 9 to 45, see Figure 1. Each production block has its own system of ore passes and ventilation shafts, and shares a ramp with its neighboring block. Mining is currently on-going between the 907 and 964 m levels, which corresponds to 700–750 m depth below the ground surface.
In the evening of February 2, 2008, a seismic event of magnitude 3.0 occurred in the mine, causing extensive damage, and with an unfortunate fatality resulting. Before this event, large seismic events were rare and did not pose a major ground control issue. This paper presents a rock mechanical investigation of the February 2 rock burst. The investigation was aimed at identifying the most likely cause of the event, and comprised damage mapping, structural mapping, seismological analysis, and three-dimensional numerical modeling.
2 THE FEBRUARY 2, 2008 FATALITY SEISMIC EVENT 2.1 Description and rock mechanical history The February 2 event occurred in block 19 (Fig. 1), which is a comparatively geologically complex area in the mine. The ore is inhomogeneous with the host rock splitting it into small, irregular portions. The contact between the ore and the host rock is normally very weak. Historically, this area is known for its poor rock conditions causing problems both in the development and production phase. No seismic system was installed in block 19 at the time of
the fatality event. Only two smaller seismic networks were in place – one installed in the cap rock above blocks 9 and 12, approximately 400 m to the north of block 19, and a second system installed in block 33, which was known as a seismically active area, 800 m to the south of block 19.
In the morning of Oct 27, 2007 a large rock fall on the 907 m mining level and a minor rock fall on the 935 m level were reported. A seismic event of local magnitude of 0.5 had been recorded by the systems during the night, localized far into the footwall. The conclusion was that the event was not the cause of these rock falls. On Nov 30, 2007 a seismic event of magnitude 1.5 was recorded at 06:04:35. This event was also located far from the production area but nevertheless caused large rock falls at the 878, 907 and 935 m sublevels. At the time this event was regarded as an isolated phenomenon.
Figure 1. Schematic figure showing the Kiirunavaara orebody with production blocks and infrastructure.
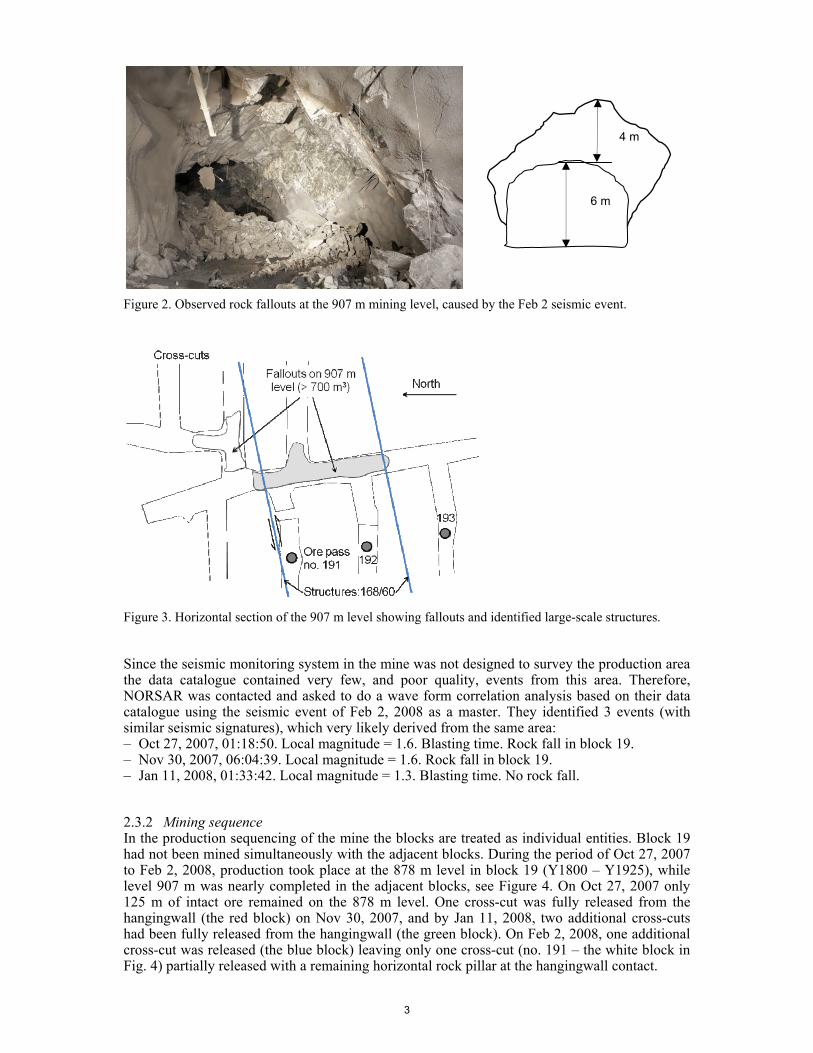
2.2 Course of events Feb 2, 2008 In the afternoon shift, work was conducted on several sublevels in block 19. Mucking took place at the 878 m level, and at the 907 m level, blasted rock from a neighboring block was brought in by truck and dumped in an ore pass. No operations were on-going on the 935 m level. In the evening, at 7:58:02 pm, a seismic event occurred with a Richter magnitude of 3.0 according to the Swedish National Seismological Network, causing extensive damages at all three sublevels. At the time of the event the driver of the truck on the 907 m level was exiting the ore pass drift, entering the drift where the damages took place. Parts of the rock fall hit the cabin of the truck, see Figure 2, causing a fatality. The mucking operator on the 878 m level managed to leave the area unharmed in spite of heavy damages to the drifts.
2.3 Analysis 2.3.1 Damage mapping, structural mapping and analysis of seismic data Damage mapping was performed after the rock falls subsequent to the seismic event. Some damages had occurred at the 878 m level, but the most extensive damages occurred on sublevels 907 m and 935 m. On the 907 m level, fallouts had occurred within an area of about 100 by 20 m, with an estimated fallout volume in excess of 700 m3, coming from both the roof and the walls, see Figures 2 & 3. On the 935 m level, the total fallout volume was around 1000 m3.
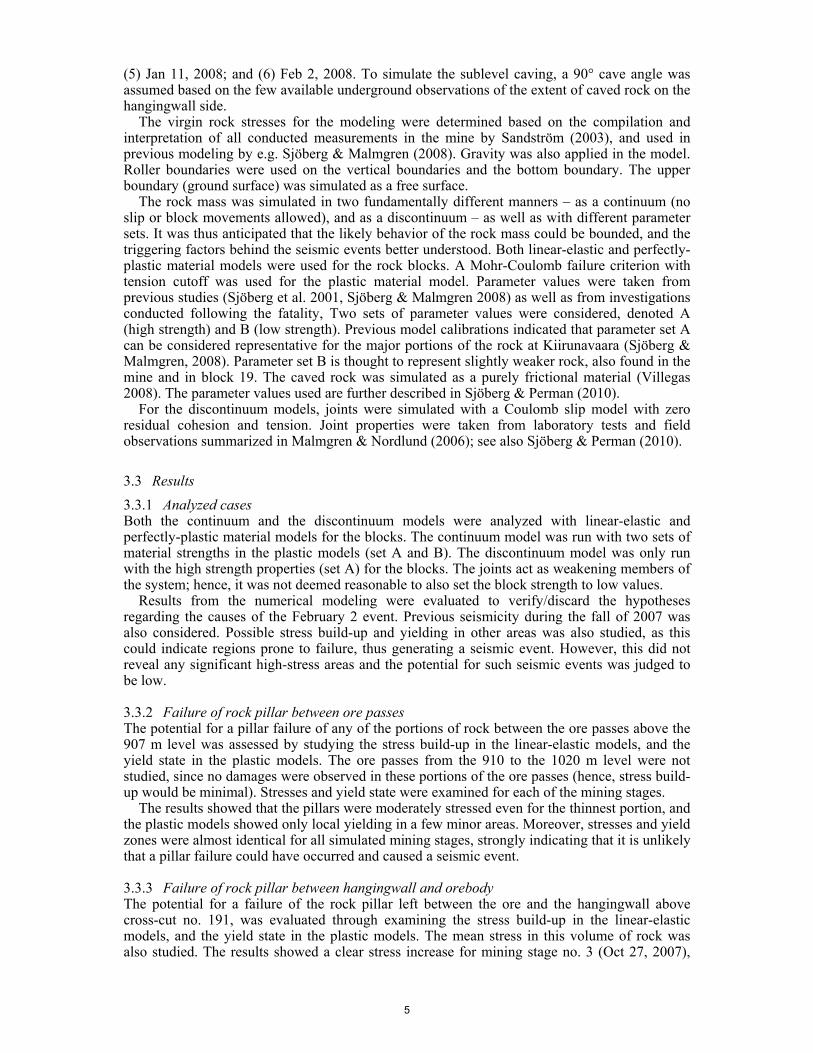
Structural mapping was also conducted and a previously unknown large-scale structure, oriented 168/60 (dip direction/dip) was identified, running parallel with one previously known structure, but 40 m to the south. Fallouts on the 907 m level had occurred near this structure, with the previously known one delineating the fallouts. Two additional joint sets, oriented 300/70 and 045/85, each with a spacing of a 1–2 m, were confirmed with previous mapping. These two sets were present between the two large-scale structures.
2
Figure 2. Observed rock fallouts at the 907 m mining level, caused by the Feb 2 seismic event.
Figure 3. Horizontal section of the 907 m level showing fallouts and identified large-scale structures. Since the seismic monitoring system in the mine was not designed to survey the production area the data catalogue contained very few, and poor quality, events from this area. Therefore, NORSAR was contacted and asked to do a wave form correlation analysis based on their data catalogue using the seismic event of Feb 2, 2008 as a master. They identified 3 events (with similar seismic signatures), which very likely derived from the same area: – Oct 27, 2007, 01:18:50. Local magnitude = 1.6. Blasting time. Rock fall in block 19. – Nov 30, 2007, 06:04:39. Local magnitude = 1.6. Rock fall in block 19. – Jan 11, 2008, 01:33:42. Local magnitude = 1.3. Blasting time. No rock fall.
2.3.2 Mining sequence In the production sequencing of the mine the blocks are treated as individual entities. Block 19 had not been mined simultaneously with the adjacent blocks. During the period of Oct 27, 2007 to Feb 2, 2008, production took place at the 878 m level in block 19 (Y1800 – Y1925), while level 907 m was nearly completed in the adjacent blocks, see Figure 4. On Oct 27, 2007 only 125 m of intact ore remained on the 878 m level. One cross-cut was fully released from the hangingwall (the red block) on Nov 30, 2007, and by Jan 11, 2008, two additional cross-cuts had been fully released from the hangingwall (the green block). On Feb 2, 2008, one additional cross-cut was released (the blue block) leaving only one cross-cut (no. 191 – the white block in Fig. 4) partially released with a remaining horizontal rock pillar at the hangingwall contact.
4 m
6 m
3
Figure 4. Longitudinal section looking east (toward the hangingwall) showing the mining sequence of block 19 (Y1800–Y2275).
2.3.3 Hypotheses of failure mechanism Three hypotheses for the cause of the Feb 2 event were postulated: – The ore passes in the footwall have grown in size due to stress-induced damage and wear,
leaving a thin slice of rock between them, which may have caused a pillar burst failure. – In the opening phase of a sublevel a rock pillar is formed between the hangingwall and ore, in
cross-cuts not fully released from the hangingwall (cf. Fig. 4). A pillar burst failure could have occurred here as well.
– A fault slip along a large-scale structure running through the production area. The conclusion from the rock mechanical analysis was that the failure mechanism was a fault slip along the newly mapped large-scale structure, since repeated pillar failures are unlikely. This conclusion remained to be further verified through numerical modeling.
3 FORENSIC NUMERICAL MODELING OF BLOCK 19 3.1 Approach The mining configuration and the geometry of block 19 are truly three-dimensional, and structures probably play an important role in triggering the seismic event. Consequently, 3DEC (Itasca 2007) was the obvious choice of modeling tool, to explicitly simulate shear movements along geological structures. The modeling was focused on identifying fundamental triggering mechanisms; hence, the actual seismic event (wave propagation, effects on reinforcement and rock behavior, etc) need not be modeled, and only static analysis was conducted. The model was set up to investigate the three proposed hypotheses for the cause of the rock burst events in block 19, and mining was simulated up until the fatality date.
3.2 Model setup and input data A mine-scale model was used, to accurately capture stress redistribution due to caving. The two neighboring blocks (16 and 25) were included in the model, which extended from the ground surface and to approximately twice the current mining depth. A simplified geological representation was used in which three lithological units were included: (i) footwall, (ii) ore, and (iii) hangingwall. The total model size was 2500 by 1200 by 1500 m; see also Figure 5 a). The model also had to be detailed in the primary area of interest (mining levels 878 to 935 in block 19), for which access drifts and cross-cuts, as well as the (partly) damaged ore passes, although with a simplified cross-sectional geometry, were included, see Figure 5 b).
Geological structures were included in the region between the 935 and 878 m mining levels. It was decided to include only the structures that were most prominent and (what was thought to be) most important from a seismicity perspective. These included: (i) two large-scale structures, oriented 168/60 (dip direction/dip), with a spacing of 40 m, and (ii) two joint sets oriented 300/70 and 045/85, respectively, each with a spacing of 10 m. Both of these joint sets were assumed to exist between the two large-scale structures above, see also Figure 5 b).
For blocks 16 and 25, a simplified mining sequence was simulated, with each mining level being excavated entirely at once. For block 19, the mining geometry was simulated in more detail, with several mining stages defined. Mining stages were chosen to match key events, including observed seismic events during 2007 and 2008, as follows: (0) pre-2005 (development); (1) April 21, 2005; (2) Dec 12, 2006; (3) Oct 27, 2007; (4) Nov 30, 2007;
4
(5) Jan 11, 2008; and (6) Feb 2, 2008. To simulate the sublevel caving, a 90° cave angle was assumed based on the few available underground observations of the extent of caved rock on the hangingwall side.
The virgin rock stresses for the modeling were determined based on the compilation and interpretation of all conducted measurements in the mine by Sandström (2003), and used in previous modeling by e.g. Sjöberg & Malmgren (2008). Gravity was also applied in the model. Roller boundaries were used on the vertical boundaries and the bottom boundary. The upper boundary (ground surface) was simulated as a free surface.
The rock mass was simulated in two fundamentally different manners – as a continuum (no slip or block movements allowed), and as a discontinuum – as well as with different parameter sets. It was thus anticipated that the likely behavior of the rock mass could be bounded, and the triggering factors behind the seismic events better understood. Both linear-elastic and perfectly-plastic material models were used for the rock blocks. A Mohr-Coulomb failure criterion with tension cutoff was used for the plastic material model. Parameter values were taken from previous studies (Sjöberg et al. 2001, Sjöberg & Malmgren 2008) as well as from investigations conducted following the fatality, Two sets of parameter values were considered, denoted A (high strength) and B (low strength). Previous model calibrations indicated that parameter set A can be considered representative for the major portions of the rock at Kiirunavaara (Sjöberg & Malmgren, 2008). Parameter set B is thought to represent slightly weaker rock, also found in the mine and in block 19. The caved rock was simulated as a purely frictional material (Villegas 2008). The parameter values used are further described in Sjöberg & Perman (2010).
For the discontinuum models, joints were simulated with a Coulomb slip model with zero residual cohesion and tension. Joint properties were taken from laboratory tests and field observations summarized in Malmgren & Nordlund (2006); see also Sjöberg & Perman (2010).
3.3 Results 3.3.1 Analyzed cases Both the continuum and the discontinuum models were analyzed with linear-elastic and perfectly-plastic material models for the blocks. The continuum model was run with two sets of material strengths in the plastic models (set A and B). The discontinuum model was only run with the high strength properties (set A) for the blocks. The joints act as weakening members of the system; hence, it was not deemed reasonable to also set the block strength to low values.
Results from the numerical modeling were evaluated to verify/discard the hypotheses regarding the causes of the February 2 event. Previous seismicity during the fall of 2007 was also considered. Possible stress build-up and yielding in other areas was also studied, as this could indicate regions prone to failure, thus generating a seismic event. However, this did not reveal any significant high-stress areas and the potential for such seismic events was judged to be low.
3.3.2 Failure of rock pillar between ore passes The potential for a pillar failure of any of the portions of rock between the ore passes above the 907 m level was assessed by studying the stress build-up in the linear-elastic models, and the yield state in the plastic models. The ore passes from the 910 to the 1020 m level were not studied, since no damages were observed in these portions of the ore passes (hence, stress build-up would be minimal). Stresses and yield state were examined for each of the mining stages.
The results showed that the pillars were moderately stressed even for the thinnest portion, and the plastic models showed only local yielding in a few minor areas. Moreover, stresses and yield zones were almost identical for all simulated mining stages, strongly indicating that it is unlikely that a pillar failure could have occurred and caused a seismic event.
3.3.3 Failure of rock pillar between hangingwall and orebody The potential for a failure of the rock pillar left between the ore and the hangingwall above cross-cut no. 191, was evaluated through examining the stress build-up in the linear-elastic models, and the yield state in the plastic models. The mean stress in this volume of rock was also studied. The results showed a clear stress increase for mining stage no. 3 (Oct 27, 2007),
5
but only small stress changes after that (Fig. 6). Significant yielding also occurred for this mining stage, but there was very little additional yielding in subsequent mining stages.
These findings indicate that the rock pillar between the orebody and the hangingwall may have exceeded its maximum load-bearing capacity with mining up until Oct 27, 2007 (stage 3, cf. Fig. 6), and that this may have caused the 1.6 magnitude seismic event of that date. It is unlikely, however, that subsequent events could have been caused by repeated pillar failures.
3.3.4 Shear failure (slip) along large-scale geological structures The potential for slip and associated shear movements along geological structures was assessed by evaluating shear displacements and slip indicators in the discontinuum models. Both the linear-elastic and the plastic discontinuum models were examined for each of the mining stages.
Joint shear slip occurred, to various degrees, in all mining stages, with the largest shear displacements in stages 4 and 5 (Nov 30, 2007 and Jan 11, 2008). Shear displacements developed both along the large-scale structures (oriented 168/60) and along the joint sets between the two large-scale structures. Both the plastic and the elastic discontinuum models showed smaller joint shear displacements in the final mining stage (Feb 2, 2008), and could thus not completely explain the occurrence of the February 2 event. a) b)
Figure 5. Geometry of 3DEC model of block 19: a) full model geometry comprising blocks 16, 19, and 25; and b) model viewed from footwall side showing access drifts, cross-cuts, and ore passes at the 878, 907, and 935 m mining levels, together with structures included. a) b)
Figure 6. a) Rock pillar between hangingwall and orebody above drift no. 191 (purple color), viewed from the hangingwall side (blue color = drifts located in the orebody, green color = drifts located in the footwall on the 878 m level), b) calculated mean of the major principal stress in the rock pillar for different mining stages using a linear-elastic material model.
0
20
40
60
80
100
120
140
160
180
0 1 2 3 4 5 6
σ1[M
Pa]
Mining stage
Mean pillar stress
Structures: 168/60
Block 16
Hangingwall
Footwall
pillar Rock
6
3.3.5 Estimation of seismic magnitude For failure of a rock pillar, the available strain energy for a seismic event can be calculated from (assuming linear-elastic material):
dVE
dVE tots ∫∫ ==2
_σσε , (1)
where Es_ tot is the total strain energy, σ is the stress (major principal stress used), ε is the strain, E is the Young's modulus for the rock, and V is the volume. For slip along a structure, the seismic moment can be calculated from (Aki & Richards 1980):
AGM sμ=0 , (2)
where M0 is the seismic moment, G is the rock mass shear modulus, μs is the average slip, and A is the area over which slip occurs. For both these mechanisms, the seismic magnitude can then be estimated from (in lieu of better, site-calibrated, alternatives):
7.10log327.10log
32
_0 −=−= totsEMM , (3)
where it is further assumed that M0 = Es_tot and in dyne-cm units (Hanks & Kanamori 1979). For failure of the rock pillar between hangingwall and orebody, it was assumed that all
available strain energy was converted to seismic energy. This provides an upper limit of the possible seismic magnitude. The largest magnitudes were found for mining stages 3 and 4 (Oct 27, 2007 and Nov 30, 2007) and were approximately 0.2. This magnitude is significantly smaller than the recorded magnitudes – e.g. the event of November 30, 2007 had an estimated magnitude of 1.6.
For slip along the large-scale geological structures, the slip area was estimated from the model results and an approximate mean value of the shear displacements was calculated. The largest seismic magnitude was found for mining stages 4 and 5 (Nov 30, 2007 and Jan 11, 2008) and were 0.8–1.0. This is somewhat lower than recorded magnitudes (1.6 and 1.3) but even so a further indication that slip along a geological structure is a more plausible cause of the seismic events in block 19.
4 CONCLUSIONS AND IMPLICATIONS
It can be reasonably concluded that the February 2 rock burst was caused by shear slip along pre-existing geological features based on the following facts: (i) the observed seismic events occurred at different times of the day, with no clear correlation to blasting, (ii) wave form correlation showed that the four large events in block 19 during 2007–2008 had similar characteristics, (iii) geological mapping verified the existence of two large-scale structures, with signs of slip movements, (iv) numerical modeling showed that shear slip was a plausible cause for several of the observed events, and (v) calculated seismic magnitudes from shear slip were of the same order of magnitude, although slightly lower, as the recorded seismic magnitudes.
Following the February 2 rock burst, the Kiirunavaara mine is now regarded as a seismically active mine. This has lead to a number of remedial measures and additional work, as follows: – Installation of a mine-wide seismic monitoring network to enable 24/7-monitoring of all
active mining areas. The system currently comprises 133 geophones, with a location accuracy better than 20 m, and a sensitivity of -1.5 (local magnitude).
– Installation of dynamically resistant rock reinforcement in all production areas, comprising friction bolts or in some cases grouted rebars, 100 mm fiber-reinforced shotcrete, and welded mesh fastened with 150 mm face plates. Tests are currently underway to replace currently used bolts with yielding rock bolts.
– Development of stringent reentry protocols for areas that have suffered rock bursts. – Revised opening sequence in production blocks with large seismic hazard. – Development of a structural-geological model of the mine, based on re-examination of
previous field mapping and core logging, geophysical data, supplementary underground mapping, and analysis of data from the seismic network.
7
5 RECOMMENDATIONS FOR FUTURE NUMERICAL MODELING
Despite the uncertainties related to discretization and choice of strength parameters for the model, the work presented in this paper has shown that it is possible to use numerical modeling as a tool for identifying the factors contributing to seismic events and evaluating different mining sequences with respect to such factors. Moreover, the installed mine-wide seismic monitoring network delivers data that allow better calibration of numerical models and, ultimately, an improved reliability in predictions. A strategy for future modeling can thus be outlined as follows: – Apply discontinuum modeling to explicitly model shear displacements along geological
structures (in addition to simulating stress redistribution due to mining), and any interaction between different seismically active structures.
– Conduct additional modeling of block 19 to address future mining. The modeling should focus on comparing different mining/sequencing alternatives, and individual drifts need not be included in the model. The model can be further calibrated against periods of increased seismic activity recorded using the new seismic network, since the re-start of production.
– Carry out mine-scale modeling of other production blocks in the mine, using the methodology developed for block 19. There is also the possibility to include the entire mine in one model but still with some detail in mining stages in each block, thus reducing the total number of models. However, the practical feasibility of this is still to be verified.
– Perform conceptual discontinuum modeling to investigate (and demonstrate) the relation between mining sequences in a block and activation of geological structures (and hence the potential for seismic fault slip). Such modeling can be carried out for “generic” block geometry and for a selected set of scenarios (mining sequences and location/orientation of structures).
– Increase efforts to quantify possible differences in mechanical behavior of geological structures in different portions of the mine to better understand differences in seismic signatures.
ACKNOWLEDGEMENTS
The work presented in this paper has been funded by LKAB. The structural mapping conducted by Björn Magnor (Vattenfall Power Consultant) is gratefully acknowledged. The authors also thank the LKAB “Seismic Mine Advisory Board”, consisting of Yves Potvin (ACG), William Hustrulid (Hustrulid Mining Services), and Per-Ivar Marklund (Boliden Mineral AB), for valuable discussions and suggestions.
REFERENCES
Aki, K. & Richards, P G. 1980. Quantitative Seismology. San Francisco: W.H. Freeman. Hanks, T.C. & Kanamori, H. 1979. A Moment Amplitude Scale. J. Geophys. Res., 84: 2348–2350. Itasca Consulting Group, Inc. 2007. 3DEC – 3 Dimensional Distinct Element Code, Ver. 4.10 User’s
Manual. Minneapolis: Itasca. Malmgren, L. & Nordlund, E. 2006 Behaviour of shotcrete supported rock wedges subjected to blast-
induced vibrations. Int. J. Rock Mech. Min. Sci. 43: 593-615. Sandström, D. 2003. Analysis of the Virgin State of Stress at the Kiirunavaara Mine. Licentiate thesis
2003:02, Luleå University of Technology. Sjöberg, J. & Malmgren, L. 2008. New haulage level at Kiirunavaara – rock mechanics challenges and
analyses. In Proc. MassMin 2008 5th International Conference and Exhibition on Mass Mining, Luleå, June 9–11, 2008, pp. 729–838. Luleå: Luleå University of Technology.
Sjöberg, J., Lundman, P, Nordlund, E. & Quinteiro, C. 2003. Stability analysis of ore passes in the Kiirunavaara Mine. In International Society for Rock Mechanics, 10th Congress. Technology roadmap for Rock Mechanics, Johannesburg, September 8-12, 2003, Symposium Series S33, Volume 2: 1093–1098. Johannesburg: The South African Institute of Mining and Metallurgy.
Sjöberg, J. & Perman, F. 2010. Tredimensionell spänningsanalys av block 19 i Kiirunavaara gruva. In Bergmekanikdag 2010. Papers presented at Rock Mechanics Meeting, Stockholm, March 8, 2010. Stockholm: BeFo (in Swedish).
Villegas, T.F. 2008. Numerical Analyses of the Hangingwall at the Kiirunavaara Mine. Licentiate Thesis 2008:11, Division of Mining and Geotechnical Engineering, Luleå University of Technology, Sweden.