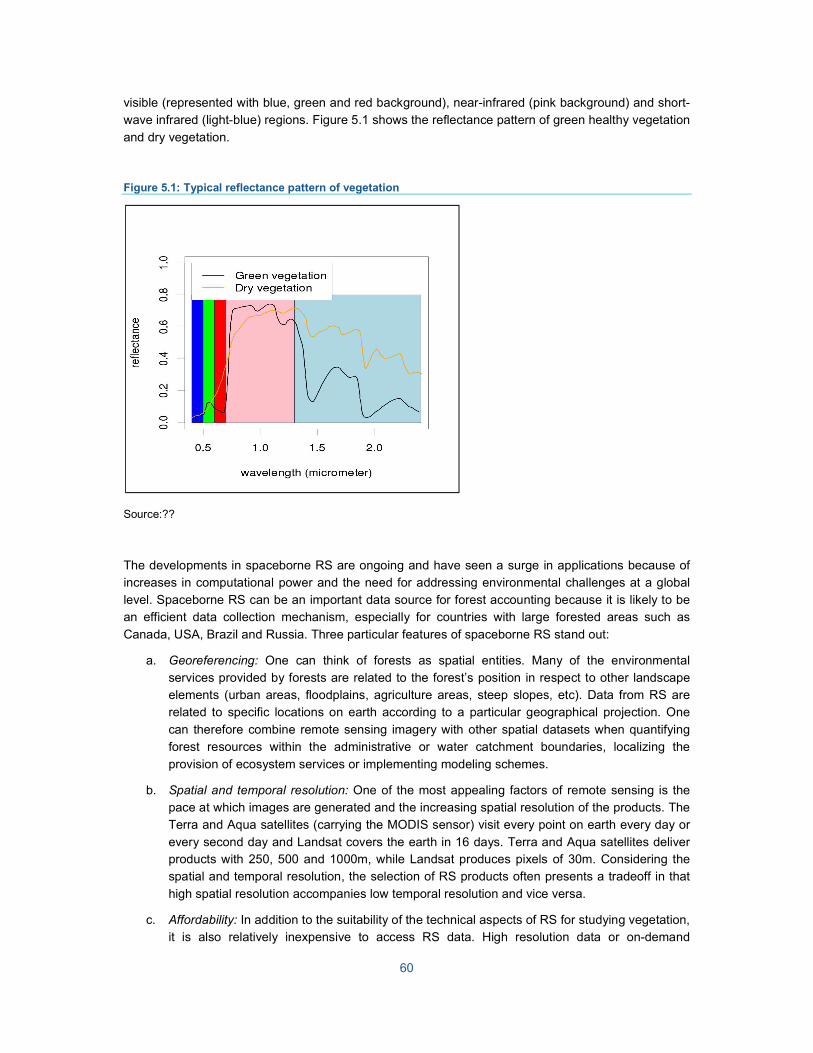
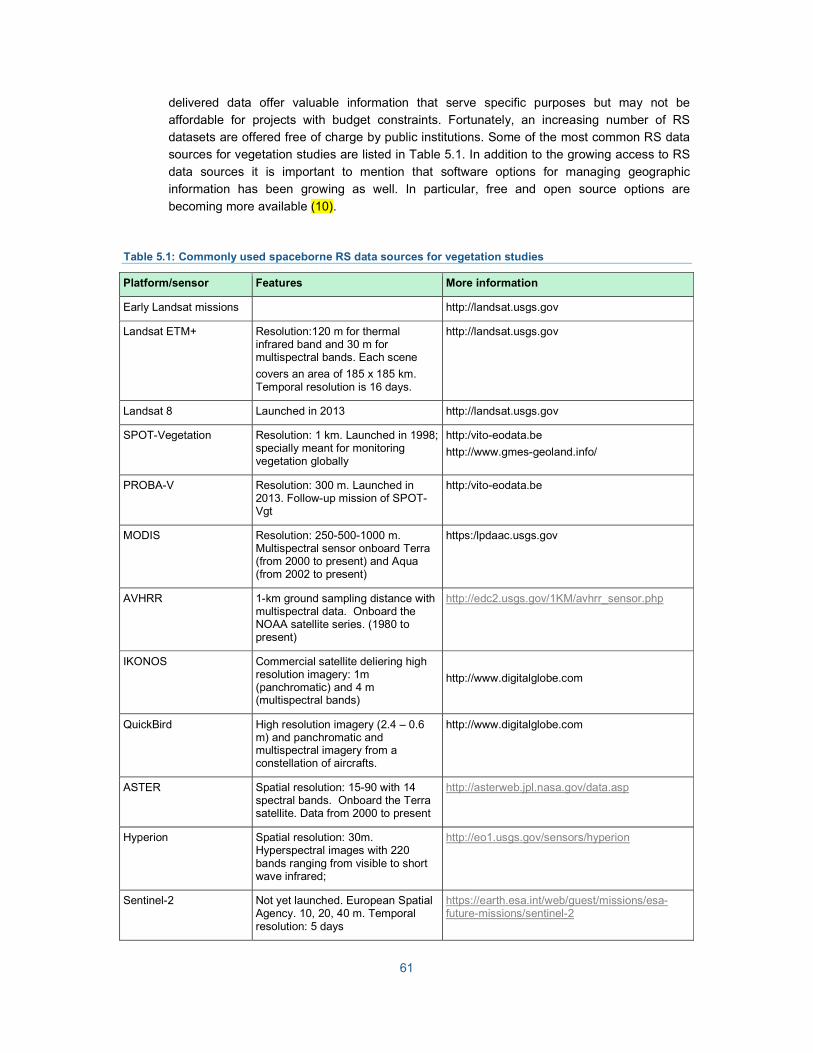
– WAVES May 31, 2015 Wealth Accounting and the Valuation of Ecosystem Services www.wavespartnership.org Forest accounting sourcebook Policy applications and basic compilation DRAFT – For discussion only
Transcript
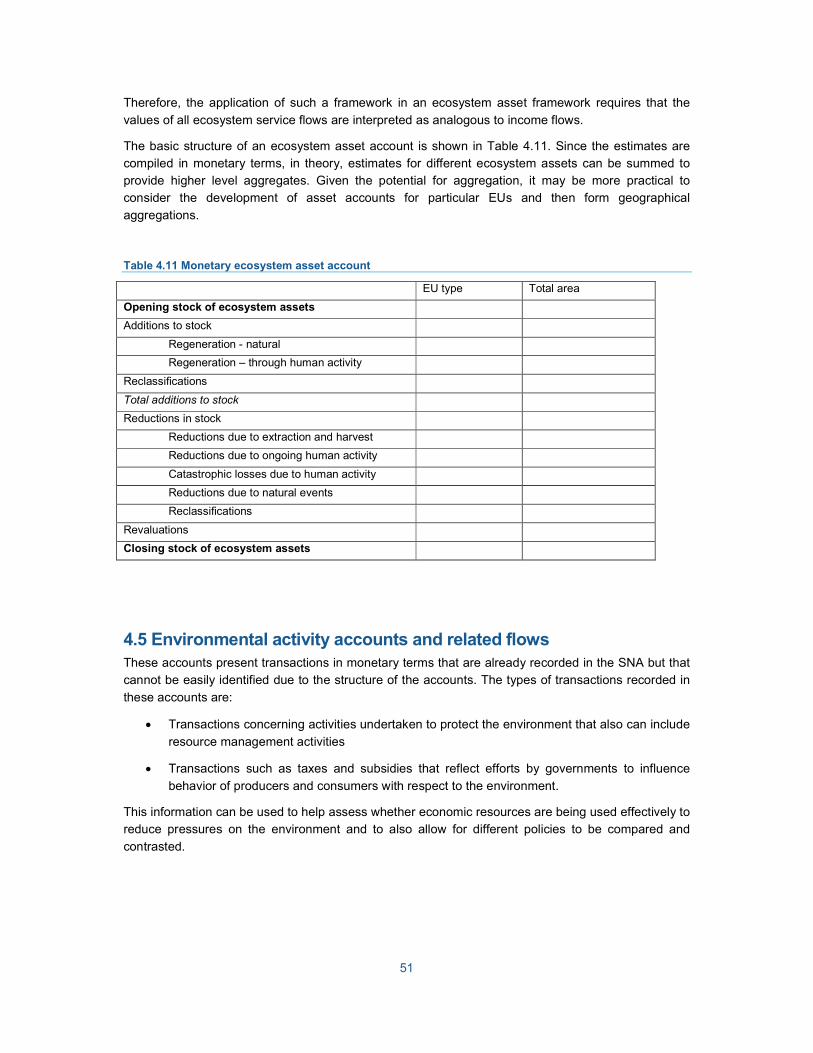
–
WAVES
May 31, 2015
Wealth Accounting and the
Valuation of Ecosystem Services
www.wavespartnership.org
Forest accounting sourcebook Policy applications and basic compilation
DRAFT – For discussion only
2
Global Partnership for Wealth Accounting and Valuation of Ecosystem Services (WAVES)
Wealth Accounting and Valuation of Ecosystem Services (WAVES) is a global partnership led by the World Bank that aims to promote sustainable development by mainstreaming natural capital in development planning and national economic accounting systems, based on the System of Environmental-Economic Accounting (SEEA). The WAVES global partnership (www.wavespartnership.org) brings together a broad coalition of governments, UN agencies, nongovernment organizations and academics for this purpose.
WAVES core implementing countries include developing countries – Botswana, Colombia, Costa Rica, Guatemala, Indonesia, Madagascar, the Philippines and Rwanda – all working to establish natural capital accounts. WAVES also partners with UN agencies – UNEP, UNDP, and the UN Statistical Commission – that are helping to implement natural capital accounting. WAVES is funded by a multi-donor trust fund and is overseen by a steering committee. WAVES donors include – Denmark, the European Commission, France, Germany, Japan, The Netherlands, Norway, Switzerland, and the United Kingdom.
3
Contents
1. Introduction
1.1 The importance of forests in policy-making
1.2 Why forests are not completely accounted for and how forest accounts can help
1.3 Structure of the Forest accounting sourcebook
2. A summary of national capital accounting for forests
2.1 The need for forest accounts
2.2 Forest accounting solutions
2.3 The role of accounting
2.4 International experiences in natural capital accounting
3. Applications of forest accounting
3.1 Introduction
3.2 Policy questions
3.3 Policy applications of forest accounts
3.4 Analytical models based on forest accounting
4. An introduction to structuring forest accounts
4.1 The need for forest accounts beyond the SNA
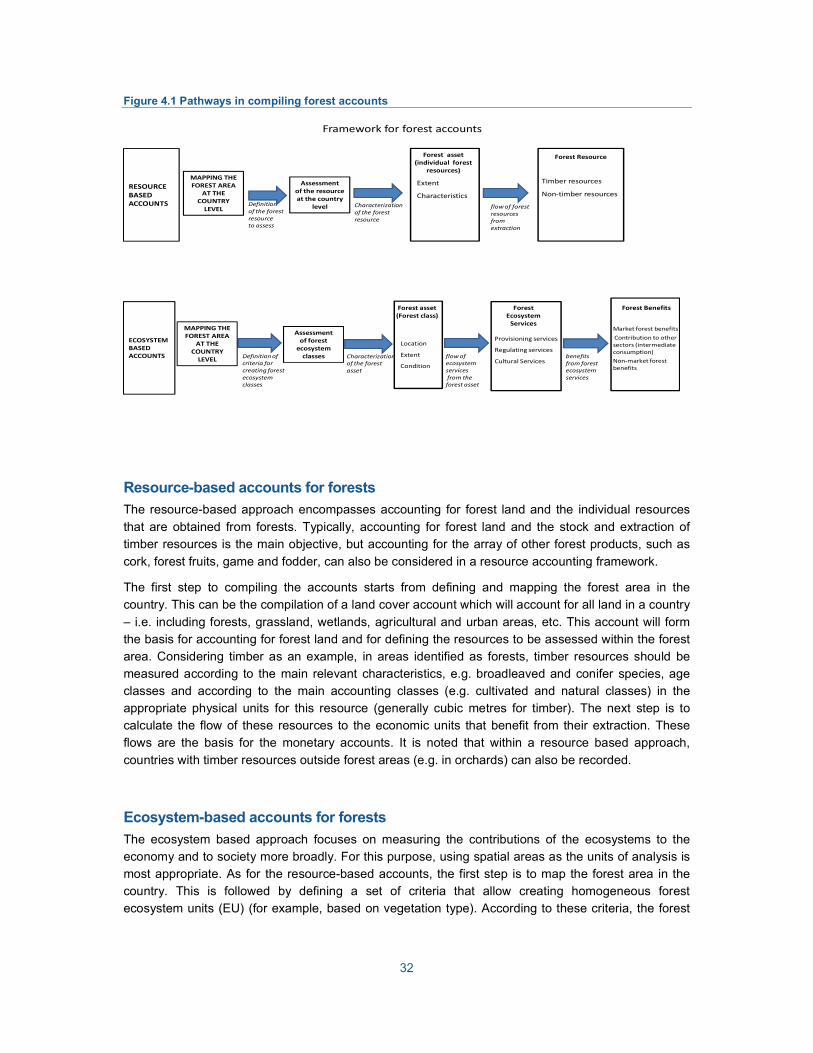
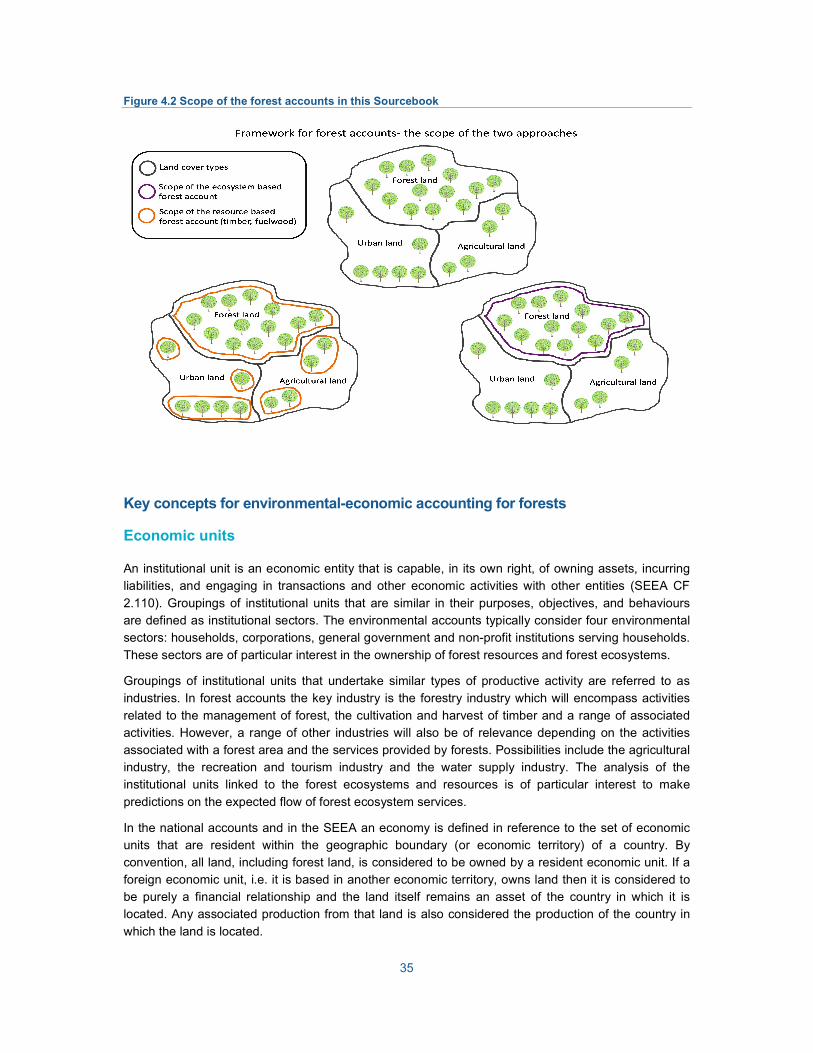
4.2 The framework for compiling forest accounts
4.3 Forest accounts following a resource-based approach
4.4 Forest accounts in the ecosystem-based approach
4.5 Environmental activity accounts and related flows
4.6 Challenges
5. Compiling physical accounts for forests
5.1 Background
5.2 Data sources
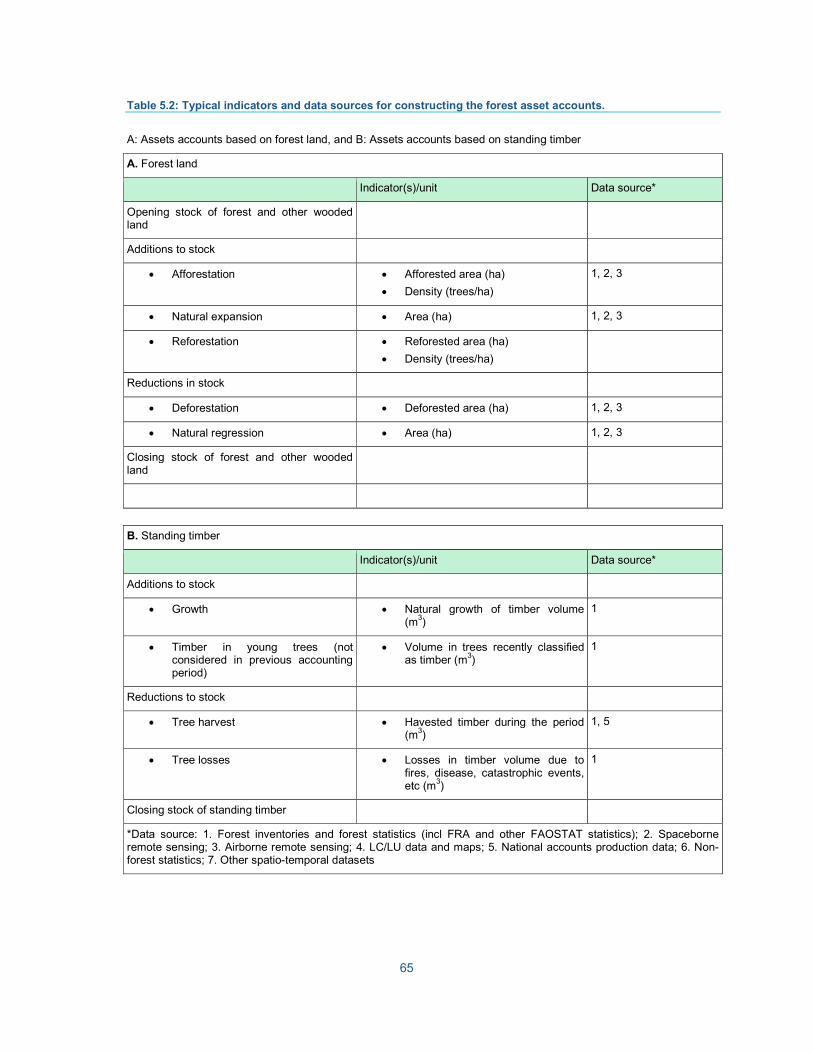
5.3 Compilation of asset accounts
5.4 Compiling measures of ecosystem service flows
5.5 Challenges
4
6. Compiling monetary accounts for forests
6.1 Background
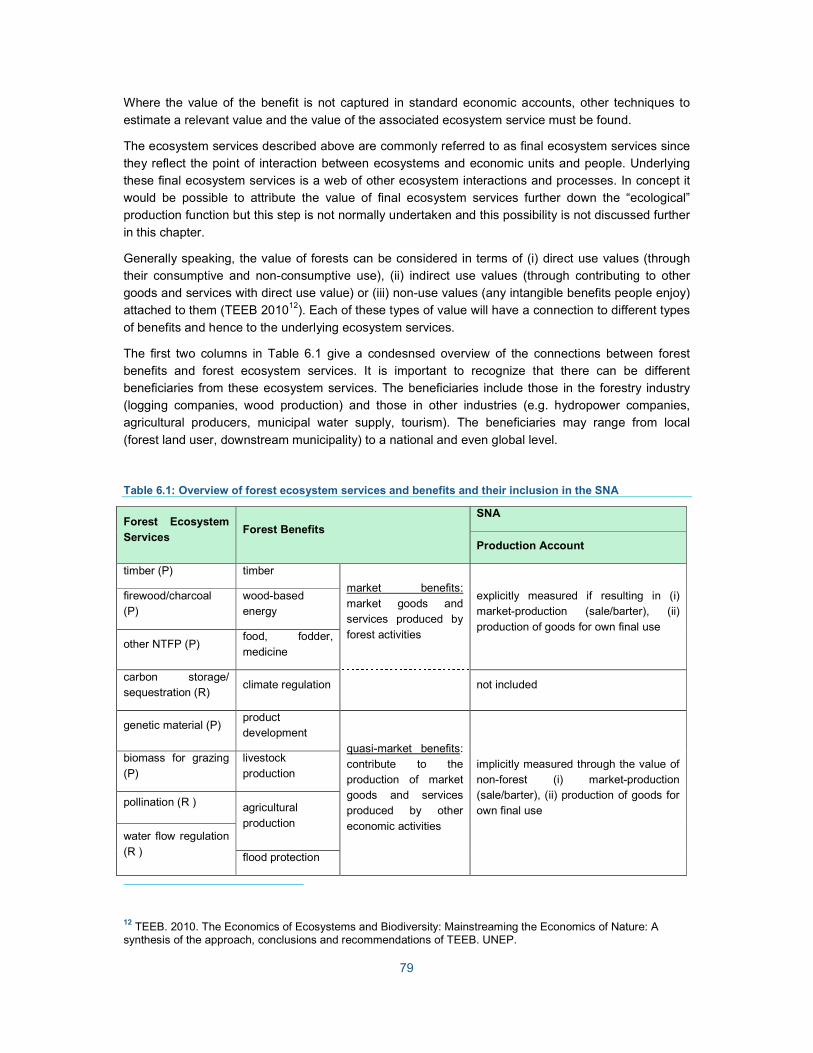
6.2 What to value?
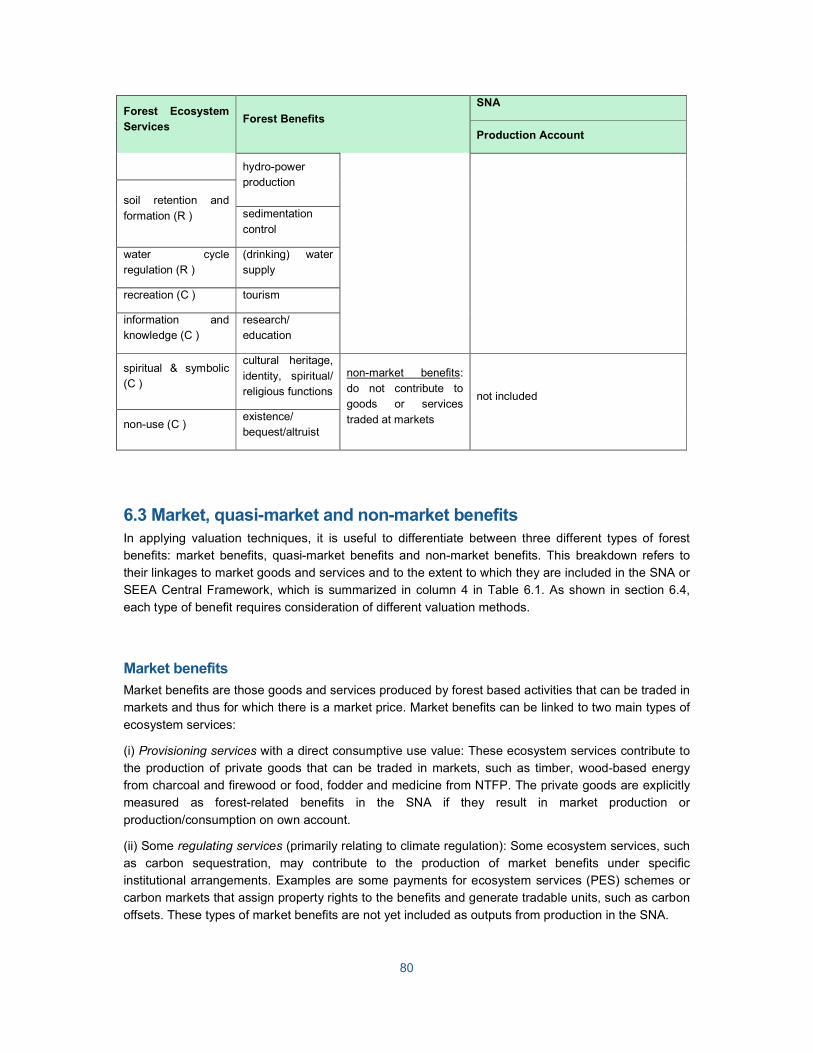
6.3 Market, quasi-market and non-market benefits
6.4 National accounts valuation concepts and principles
6.5 Methods for valuing ecosystem services and benefits
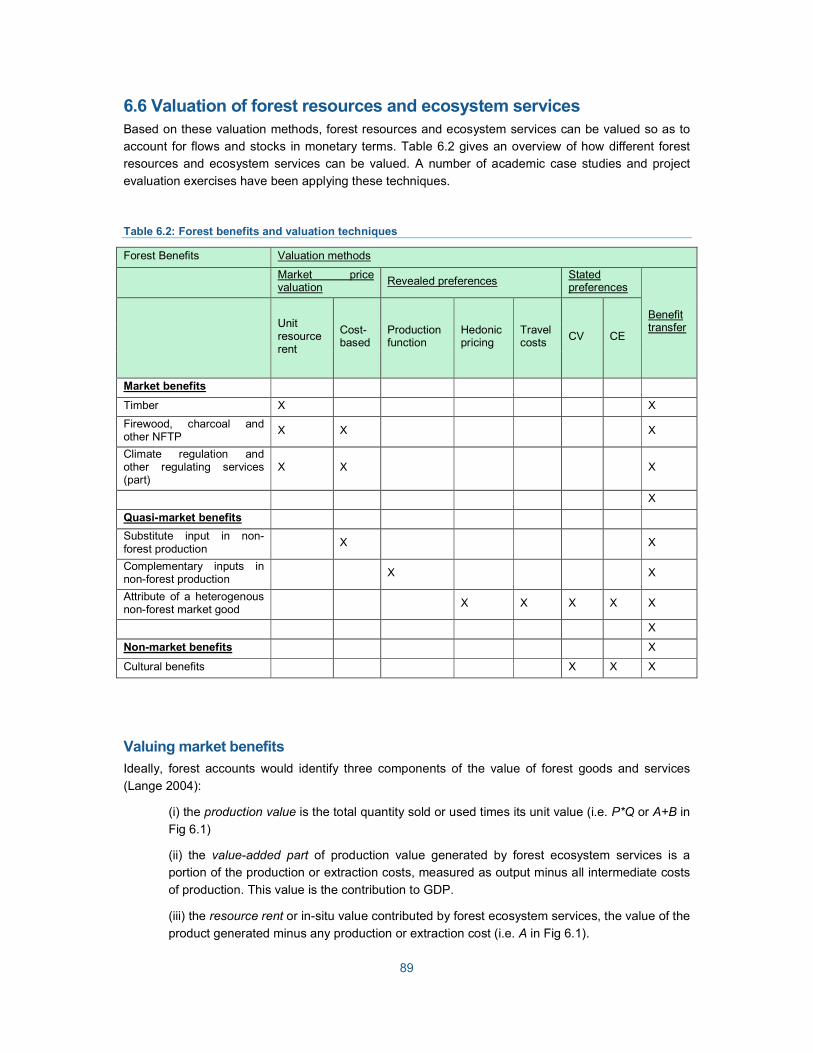
6.6 Valuation of forest resources and ecosystem services
6.7 Challenges
5
1. Introduction
For many countries forests play a key role in providing incomes and livelihoods, while contributing to climate change mitigation and other important ecosystem services. Taking forests into account in development planning and policy-making is critical for development.
This Forest Accounting Sourcebook (the Sourcebook) responds to the increasing demand for
harmonization across countries in the creation and implementation of forest accounts. It should be
especially useful for countries that have begun to compile forest accounts. The Sourcebook
summarizes information on forest accounting that is found among other information, in particular the
System of National Accounts (SNA) (EC et al. 2009) and the System of Environmental-Economic
Accounting (SEEA) UN et al. 2014). The Sourcebook brings together the different material in these
documents and makes the case for the relevance of forest accounts for policy planning and review. It
outlines relevant policy issues and how discussion of these issues can be supported using information
from the accounts, as well as illustrating analytical extensions (e.g. input-output analysis and general
equilibrium modeling). A feature of the Sourcebook is the link to examples and case studies that help
to describe the practical steps for overcoming common measurement issues. In this way the
Sourcebook helps to share knowledge and strengthen the global natural capital accounting community
of practitioners.
The primary target audiences of the Sourcebook are policy makers and analysts from government
agencies and ministries (data users) and agencies responsible for economic and environmental
statistics (data suppliers). Other audiences for the Sourcebook include the broader research network
of academics, non-government organizations, and local stakeholders. It is envisioned that the
Sourcebook can serve as a platform to enhance communication between various government
agencies, as well as different professional groups including economists, foresters, ecologists,
statisticians and social scientists.
The sourcebook is intended to be user-friendly and strike a balance between describing the technical
aspects of forest accounting and explaining the application of accounting to support discussion of
different policy issues. The main objectives of the Sourcebook are to:
• Raise awareness of the importance of forest accounting for policy planning and review
• Increase understanding of how forest accounts can help to address policy questions by describing and illustrating policy applications of forest accounts (including the use of indicators and modeling applications of the accounts)
• Provide guidelines for the compilation of forest accounts in line with the standard structures, concepts and classifications of the System of Environmental-Economic Accounting (SEEA)
• Provide insights into the new methods and tools for the physical measurement and valuation of relevant forest ecosystem services
The Sourcebook provides practical tools to aid data management and compilation according to
statistical standards. Special attention is given to show how remote sensing, spatial modeling, and
statistical analysis can provide in-depth information and data to compile the accounts. An additional
contribution of this document is to tackle aspects related to the measurement and valuation of forest
ecosystem services. Over time, in conjunction with the Sourcebook, various presentations and training
6
materials will be developed to assist countries in the implementation and application of forest
accounts.
1.1 The importance of forests in policy-making
Forests are a vital part of many countries’ economies, and are crucial ecosystems for creating green
economies and combating climate change (ref). Forests cover 31% of the global land area (FAO,
2015), and more than 1.6 billion people around the world depend on forests for various daily functions
(World Bank, 2002). Even though estimates of total economic contributions of forests vary widely,
FAO estimates that formal forest industries contribute nearly 1% of global GDP yearly or more than
$450 billion (FAO, 2012). In addition, more than 10 million people are formally employed by the forest
sector (FAO, 2015). Although deforestation trends are declining globally, more than 13 million
hectares of forests are being lost annually through conversion or natural losses (FAO, 2015). This
issue combined with the recognition that forests are interconnected to other sectors, has resulted in a
variety of global responses that attempt to encourage sustainable forest management.
To ensure that forest resources are available for future generations and that they continue to provide
benefits to society, various goals, targets, and international processes have been established. Box 1.1
introduces some of these initiatives including the UN Sustainable Development Goals, the strategic
plans under the Convention on Biological Diversity, programs on Green Growth and Green Economy
and the REDD initiative under the UN Framework Convention on Climate Change. Forest accounting
can provide information support discussion and analysis in each of these initiatives.
Box 1.1 International initiatives relevant to forest accounting
UN Sustainable Development Goals
In 2000, the United Nations (UN) developed a set of Millennium Development Goals (MDGs)
aimed at supporting development outcomes to the world’s poorest populations. Forests were
mentioned explicitly under MDG 7 – “Ensuring environmental sustainability”.
As the MDGs target date of 2015 is reached, the UN has just completed a new process for the
creation of 17 Sustainable Development Goals (SDGs) covering all countries and with a
heightened coverage of environmental factors. It was adopted by the UN General Assembly in
September 2015. Forests are again important, especially in respect of Goal 15 “To protect,
restore and promote sustainable use of terrestrial ecosystems and sustainably manage forests”.
Forests are also of direct relevance in relation to achieving goals 2 (on food security), goal 6 (on
water resources), and goal 12 (on sustainable production and consumption); and of indirect
connection to many goals and targets.
Convention on Biological Diversity (CBD)
Under the CBD, a Strategic Plan for Biodiversity for 2011-2020 has been developed. The plan
includes 20 Aichi Biodiversity Targets, and provides a framework for addressing biodiversity
issues. Many of the targets are related to forests including halving deforestation and loss of other
natural habitats by 2020 (Target 5) and restoring 15% of degraded lands by 2020 (Target 15).
Further, under Target 2, countries are encouraged to integrate the measurement of biodiversity
into national accounting systems by 2020 – the creation of forest accounts is directly relevant to
this target. Overall, the targets under the Strategic Plan represent global action on protecting
critical biodiversity and essential ecosystems, including forests.
7
UNDP Green economy and OECD Green growth initiatives
In recent years both UNDP and the OECD have developed initiatives aimed at supporting
countries to achieve economic growth and development while at the same time ensuring that their
environmental assets continue to provide the ecosystem services on which our well-being relies.
The initiatives provide a suite of economic and environmental policy options for countries and, to
support monitoring progress, a broad set of indicators has been developed. The OECD Green
Growth indicator set has a broad coverage and includes an indicator on changes in the area of
forest land.
UN Reducing Emissions from Deforestation and Forest Degradation (REDD) programme
Since 1994, the United Nations Framework Convention on Climate Change (UNFCCC) has made
key decisions and provisions for countries to mitigate climate change in the land-use, land-use
change, and forestry sector (LULUCF). In this context, the UN programme on Reducing
Emissions from Deforestation and Forest Degradation (UN-REDD) is a collaborative initiative
designed to support developing countries to implement REDD+ strategies.
REDD+ is a mechanism that provides incentives to protect and sustainably manage forest
resources and reduce emissions from deforestation and hence contribute to the fight against
climate change and to the conservation of biodiversity.
One aspect of the REDD+ mechanism is to establish a financial value for carbon stored in trees
and hence recognize that forests are more valuable standing than felled. At the same time there
is recognition that the conservation of forests holds a range of other benefits for developing
countries and local communities.
In addition, many initiatives both in the public and private sector are being established to promote legal
and sustainable timber trade and the overall goal of sustainably managed forest resources. These
include the Forest Law Enforcement, Governance and Trade (FLEGT) in the European Union and
certification schemes like the Forest Stewardship Council (FSC) and the Programme for the
Endorsement of Forest Certification (PEFC).
Multiple responses and initiatives have been established to combat various forest-related issues. It is
beyond the scope of this introduction to go into depth on any of these goals and targets, but from this
short list one can see the complexities involved in addressing global forest challenges. For each of the
aforementioned programs, an essential element is the measurement of forest resources. Through
detailed and integrated statistics, forest accounts provide improved forest related information and
indicators. Both the statistics and the associated indicators can be used for improved management of
forest resources. The compilation and subsequent use of forest accounts can help countries decide
how to manage trade-offs among competing forest uses; how to design economic policy instruments
(e.g. property rights, taxes and subsidies, creation of markets for non-market forest services, etc.)
(Lange, 2004); and provide the basis for monitoring policy implementation and effectiveness. In sum,
forest accounts can help countries achieve various policy targets and meet the goals of any future
initiative.
8
1.2 Why forests are not completely accounted for and how forest accounts can help
The System of National Accounts (SNA) is the standard international framework for the organization of
economic statistics and has been adopted around the world to judge economic progress and
performance. The data from the national accounts, including gross domestic product (GDP), are the
primary data inputs for policy analysis and the data figure prominently in many countries’ decision-
making processes.
While the SNA is widely adopted, it does not provide a fully integrated structure to capture the use of
environmental assets and the changes in stocks of those assets. For example, cultivated and natural
forests are treated as different types of assets. For cultivated/plantation forests the changes in stocks
and production are accounted for in an integrated way. However, for natural forests, while the income
generated through timber production is accounted for in GDP, any associated capital costs (i.e.
depletion of natural capital) are not deducted from income. As a result, a country could deplete stocks
of timber resources and raise GDP, but the costs of depletion would not be attributed.
Further, all national accounting in the SNA is undertaken in monetary terms. As a result unless the
information related to forests has a demonstrated economic value, generally in terms of observed
market prices, there is no recording in the accounts. A necessary extension therefore is the
incorporation of information on physical measures of stocks and changes in stocks that permits an
assessment of depletion and degradation in an accounting context.
The limitations of the accounting in the SNA have been recognized for many years but have gained
increasing attention as awareness of the need for sustainable development has grown. Sustainable
development, which has been on the forefront of multiple development agendas around the world, has
been expressed as “L development that meets the needs of the present without compromising the
ability of future generations to meet their own needs.” (World Commission on Environment and
Development, 1987).
As a contribution to the measurement of sustainable development, in the early 1990s the international
statistical community started the development of extensions to the SNA (often referred to as satellite
accounts) to demonstrate the potential to integrate environmental information in the national accounts.
These extensions were integrated in the System of Environmental-Economic Accounting (SEEA), first
released in 1993. (See Box 1.2) These satellite accounts are the forerunners of the forest accounts
described in this Sourcebook.
Box 1.2 History of the SEEA
The potential and need to better integrate measures relating to natural capital within the national
accounts framework emerged through the 1970s and 80s and led to the release of the first,
interim SEEA in 1993. Over the past 20 years there has been an important broadening of focus of
the SEEA from a primary focus on extensions and adjustments to GDP and national wealth, to
incorporating accounting structures for physical information on environmental stocks and flows
such as water, energy, emissions and waste, and most recently, to the measurement of
ecosystems. These three areas of the SEEA are covered through the twin publications of the
SEEA Central Framework and the SEEA Experimental Ecosystem Accounting (SEEA EEA).
The SEEA Central Framework was adopted as an international statistical standard by the UN
Statistical Commission in 2012 following a five year revision and broad consultation process. It
represents an important milestone in the advancement of natural capital accounting.
9
The SEEA EEA was endorsed by the UN Statistical Commission in 2013 as a starting point for countries to engage in the measurement of ecosystems and ecosystem services. It is not a
statistical standard but is considered a significant synthesis of much information on ecosystem
measurement.
There are many perspectives from which to view the relationship between the environment and
the economy. Consequently, there has been an ongoing release of sector and resource specific
applications of the general SEEA framework. Examples can be found for forestry (2000), fisheries
(2004), water (2012) and energy (forthcoming). A recent example currently being finalized is the
SEEA for Agriculture, Forestry and Fisheries (SEEA Agriculture) led by the FAO. It has a high
relevance in light of the current pressures on land use and water use and the issues of food
security that affect many countries.
In addition to better accounting for natural timber resources, there is now recognition that in all
countries, forest ecosystems also provide non-marketed goods and services that contribute to
livelihoods, but these are not usually recorded or identified in the national accounts. Relevant
examples of these goods and services include watershed protection, carbon sequestration, and air
filtration. By not recording these types of flows there is an underestimation of forest benefits.
Consequently, many economic sectors and decision makers are not fully aware of the economic and
societal dependence on forests.
In the SEEA Central Framework, the focus in relation to forest accounts is on improved accounting for
timber resources, including measurement of depletion, and improved accounting for land use and land
cover. Currently, work is underway to finalize an application of the SEEA Central Framework, titled the
SEEA for Agriculture, Forestry and Fisheries (SEEA Agriculture). For forestry, this will incorporate
material on accounting for timber resources and forest land from the SEEA Central Framework and
will add in accounting for forest product flows and inputs to forestry such as employment, capital
machinery and energy costs.
To address the measurement of forests as ecosystems and the associated ecosystem services, the
UNSC has endorsed a complementary volume, SEEA Experimental Ecosystem Accounting (SEEA
EEA) (UN et al 2014b). SEEA EEA provides a framework for the integration of information on
ecosystem extent, condition and capacity and information on ecosystem services, such that these
data can be integrated with existing SEEA and SNA based information. The SEEA EEA has drawn
inspiration from various non-statistical initiatives including the Millennium Ecosystem Assessment
(2005) and the UNEP TEEB (The Economics of Ecosystems and Biodiversity) study (2010).
1.3 Structure of the Forest Accounting Sourcebook
The Sourcebook comprises two parts. Part I is aimed at potential users of forest accounts, including
policy makers and analysts. Chapter 1 provides a short introduction, Chapter 2 provides a summary of
forest accounting – its motivations, solutions and experiences in different countries. Chapter 3 focuses
on applications of forest accounts to policy using country level examples to illustrate the potential use
of accounts across a number of policy issues.
Part II is aimed at compilers of forest accounts. Chapter 4 describes the various types of accounts that
are within scope of forest accounting. Chapter 5 provides guidance on the data sources and methods
for the compilation of accounts in physical terms and Chapter 6 has a focus on concepts and methods
10
in the valuation of forest stocks and flows. Examples and case studies are provided through these
chapters to support understanding of the concepts and to give appropriate starting points for compilers
of forest accounts.
The overall message of the Sourcebook is that forest accounts allow countries to integrate
environmental data with standard economic accounting information and hence better understand the
links between forests and the social and economic beneficiaries that rely on and affect those
resources. This is a tool that enables countries to make more informed decisions regarding the use of
forest resources and to design and monitor policies that can help to achieve sustainable development.
11
2. A summary of national capital accounting for forests
2.1 The need for forest accounts
In most countries there is information on forests, for example, in terms of the area of forest under
management for timber production or as protected areas. This information may also include
information on aspects such as canopy cover, species diversity and other ecological variables. Where
forests are logged for timber production there may also be specific information on the volume of
standing, the volume of timber harvested and the costs and expenses of the forestry industry. For
some forests there may be information on the condition of forests, for example in terms of disease or
the time since previous natural disturbances (e.g. fire, storm).
The objective in developing national level forest accounts is (i) to provide a framework in which these
and other information on forests can be brought together to give a more complete picture of forests
and (ii) to ensure that this information can be integrated within broader discussions on economic
development and planning.
This second ambition is often referred to as “mainstreaming”. The need for mainstreaming of forest
information emerges from the increasing recognition that societies and their economies have an
inherent dependence on their environment and that achieving ambitions of sustainable development
require more holistic and integrated ways of thinking. Natural capital accounting is a tool to support
this type of approach.
Much of the established information on forests has a focus on the added economic value of forests,
largely recognised in timber production. While this information is very relevant, there is a need to
consider forests more broadly. This is true from three main perspectives. First, ongoing timber
production without consideration of the stock of timber resources and the potential for re-growth in the
timber stock could lead to unsustainable levels of timber harvesting. An important aspect of forest
accounting is thus providing definitions and approaches for the measurement of the stock of timber, its
value and, where relevant, its depletion.
Second, in many countries there is a very close relationship between forests and people living nearby.
The information on forests thus needs to encompass the variety of non-wood forest products that
forests provide including food, energy, shelter and materials. The cultural connections between people
and forests also need to be better understood and included in decisions about forest management.
Third, over the past 10-15 years an increasing body of research has focused on the description and
measurement of a full range of ecosystem services. Beyond the more commonly identified goods that
are harvested from forests (i.e. timber and non-wood forest products), the measurement of ecosystem
services also recognises that forests play a generally unpriced role in supplying regulating services.
These include regulating and filtering water flows, filtering pollutants from the air, limiting the impacts
of floods and heavy rains, sequestering and storing carbon, and providing a habitat to many species,
including pollinators of agricultural crops. To ensure that the contribution of forests to society is
recognised as completely as possible, these regulating services should be accounted for.
This chapter provides a brief introduction to accounting for forests by providing an overview of the
accounting solutions that have been developed in recent years and in describing the key aspects of
accounting approaches. Part II of the forest source book provides a more complete description of the
compilation of forest accounts and the relevant accounting methods and techniques.
12
2.2 Forest accounting solutions
One of the challenges in mainstreaming information on forests and other natural resources is that the
most common metric for assessing overall economic activity, gross domestic product (GDP), does not
take into account the costs of extracting natural resources in an unsustainable manner. This has long
been recognized as a concern.
The solution that has been developed by the international statistical community, which also oversees
the standards for measuring economic activity, is the System of Environmental-Economic Accounting
(SEEA). Its focus is on organizing information such that the relationship between the economic and
the environment can be described as completely as possible. The SEEA uses as a base the same
accounting principles and measurement boundaries as applied in standard economic measurement
(reflected in the System of National Accounts (SNA)). By doing so the relevant environmental
information can be effectively integrated and mainstreamed.
This section describes three broad types of accounting relevant to forests that have emerged from the
SEEA and SNA frameworks.
Accounting for timber resources and forest land
With respect to forests the SEEA Central Framework applies existing knowledge of natural resource
accounting for timber and forest land into economic measurement and also draws heavily on the
measurement and definitions developed in the context of the FAO Global Forest Resources
Assessment (FRA).
The SEEA Central Framework describes standards and accounts in relation to:
• The definition of the stock of timber resources in physical terms (covering both natural and planation timber)
• Changes in that stock due to natural growth and loss, harvest and catastrophic loss (e.g. due to storms or disease)
• Approaches to the valuation of the timber stock and the measurement of depletion
• Accounting for the area of forest land and changes in area of forest land in the context of national level land cover and land use measurement (thus encompassing indicators for deforestation).
Overall, the approaches described in the SEEA Central Framework support the establishment of
ongoing monitoring of forests and timber resources at a national level and the integration of this
information into standard economic and planning discussions. Applications of these types of
accounting data are described in Chapter 3.
Accounting for non-timber forest products
Integrating more complete information on timber production and timber stocks may be considered
relatively straightforward since this activity is well known and generally appreciated. Accounting for
non-timber forest products often has a much lower profile since its economic value in terms of
contribution to GDP, especially in developed countries, may be considered small.
The appropriate framework for accounting for this non-timber activity is, in fact, the standard national
accounts of the SNA. Although not commonly appreciated, the SNA includes in its scope all activity
related to the collection of products from forests whether they are ultimately sold on markets or
13
consumed by households directly. Further, the international standards for the classification of products
(CPC v2.1) and for the classification of economic activities (ISIC rev 4) both include the production of
non-wood forest products in their scope. The measurement challenge is therefore not a conceptual
one but rather one of allocating resources to the measurement of this activity.
Since the SNA and the SEEA both use standard economic classifications it permits the integration of
other related information, for example on employment. Further, since these accounting frameworks
consider both production and consumption (to ensure the accounts are balanced) it is possible to
integrate information on the distribution of production and consumption – for example by household
type and income level, or by region within a country. These types of extension may be particularly
useful for the integration of information on non-timber related activity.
Accounting for ecosystem services
The most recent addition to natural capital accounting is the development of ecosystem accounting.
Approaches to ecosystem accounting emerged from the work on the development of the SEEA
Central Framework when it was recognized that the traditional approaches to natural capital
accounting were not sufficient to integrate information on the multiple and varied services of the
environment and measures of the overall extent and condition of ecosystems.
The SEEA Experimental Ecosystem Accounting was endorsed by the United Nations Statistical
Commission in 2013. It does not represent an international statistical standard, but it does provide the
initial basis for advancing this work.
Ecosystem accounting involves defining a set of ecosystems (defined as assets) across a country
each contained within a distinct spatial area. For example, at a high level, a country could be divided
into forests, wetlands, agricultural areas, etc.). For each ecosystem asset, the extent (area) and
condition can be recorded following ecological measurement approaches that have been developed
over many years. For example through assessment of tree density, canopy cover and leaf area.
Declines in condition, for example through excessive use, are considered ecosystem degradation.
In addition, ecosystem accounting records the flows of ecosystem services that each ecosystem asset supplies. These services are generally broken up into three types – provisioning services (e.g. of food,
fibre, energy, water); regulating services (e.g. of water flows, climate, floods); and cultural services
(e.g. recreation services and amenity). This break down builds on the work from the Millennium
Ecosystem Assessment (2005), and the TEEB (The Economics of Ecosystems and Biodiversity) study
(2010).
The ecosystem accounting framework of the SEEA places information on ecosystem assets and
ecosystem services in the same context and does so in a way that supports the integration of this
information with standard economic measurement. For example, a distinction is made between those
ecosystem services that contribute directly to current economic measures of production (e.g. the
contribution of pollination to agriculture) and those ecosystem services that represent additional
production and consumption (e.g. the filtration of air by trees). SEEA EEA Chapter 2 provides a
complete description of the ecosystem accounting model.
Accounting for ecosystem condition and ecosystem services can be undertaken in non-monetary
terms but there may be cases where valuation may be appropriate. This may be challenging since
there are generally no markets in ecosystem services aside from those associated with traded goods
such as timber. Without market based prices, it is difficult to estimate values that can be readily
integrated with standard economic measures. Nonetheless, a range of techniques is available and
14
research is continuing to investigate valuation possibilities and a range of other ecosystem accounting
measurement issues. Examples are discussed in Chapter 6.
Significantly, although still a developing field of measurement, a number of countries have seen the
merits of the more comprehensive measurement approach described by ecosystem accounting and
are involved in taking this work forward. Examples of nationally endorsed, ecosystem accounting work
based on the SEEA EEA framework are present in Australia, Canada, Chile, Indonesia, the
Netherlands, Peru, the Philippines, South Africa, and the United Kingdom.
<< Insert Box 2.1 on ecosystem accounting work in one country e.g. Philippines >>
2.3 The role of accounting
One of the challenges in making environmental information visible in economic and planning
discussions is the lack of comparability and coherence between different environmental data sets,
their, often incomplete, coverage and the lack of a clear link to existing economic data. In this context,
the SEEA based accounting solutions described in the section above have a number of features that
make them particularly suited to the task of mainstreaming environmental information into economic
and planning discussion. This section describes those features.
First, since the structure of the SEEA is aligned with the standard economic measurement framework
of the SNA, environmental information can be presented alongside economic data without concern as
to the comparability of the data sets. This is facilitated by the use of consistent classifications (for
example for industries and products). By way of example, the use of the SEEA framework requires
that the biophysical information concerning forests (e.g. area, cubic metres of timber removed, etc.)
aligns with the economic data (e.g. value added, employment).
Second, the use of national level accounting frameworks ensures broad coverage of environmental
assets such that all assets (produced, non-produced, financial) can be seen in context. This means
that the relative significance of changes in different assets can be assessed and that trade-offs
between policies can be considered. The integration and presentation of information on different
assets and activities is essential to macro-level decision making support.
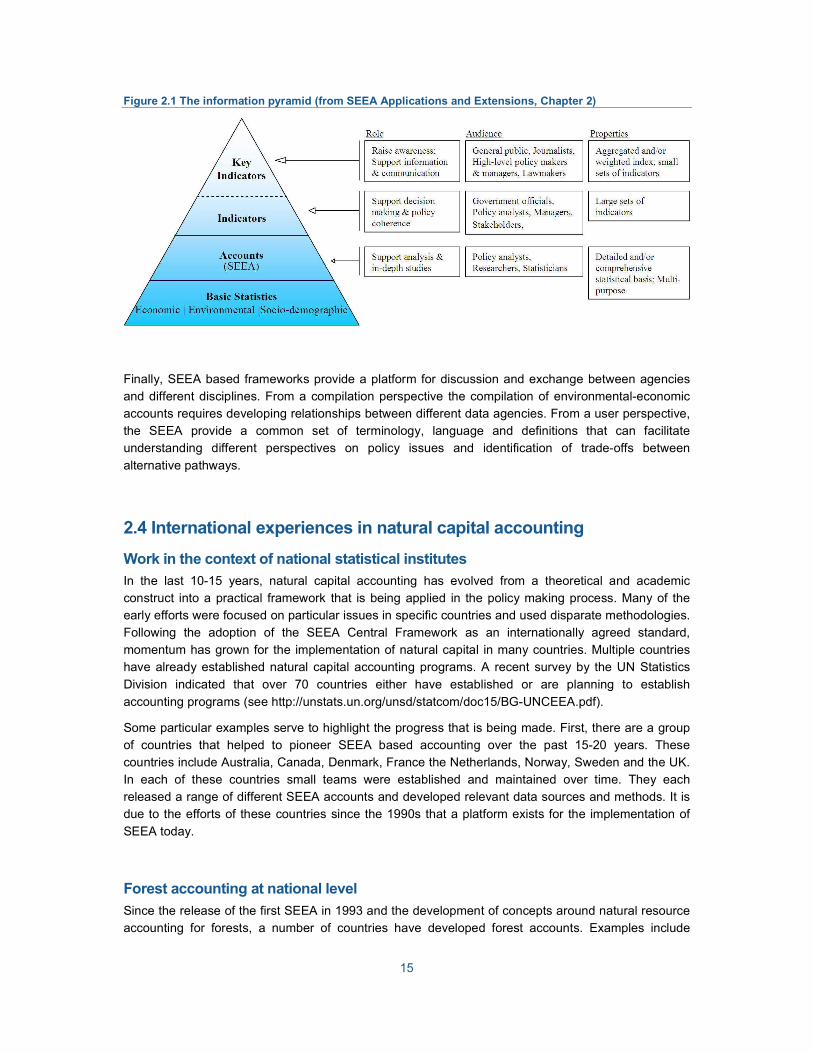
Third, accounting frameworks provide a summarizing role, bringing together much existing data. They
therefore provide a complementary set of data rather than competing data. This logic is shown in
Figure 2.1, known as the information pyramid. It shows that accounting frameworks can provide a link
between a wide range of basic data and statistics on the one hand, and aggregate indicators on the
other.
15
Figure 2.1 The information pyramid (from SEEA Applications and Extensions, Chapter 2)
Finally, SEEA based frameworks provide a platform for discussion and exchange between agencies
and different disciplines. From a compilation perspective the compilation of environmental-economic
accounts requires developing relationships between different data agencies. From a user perspective,
the SEEA provide a common set of terminology, language and definitions that can facilitate
understanding different perspectives on policy issues and identification of trade-offs between
alternative pathways.
2.4 International experiences in natural capital accounting
Work in the context of national statistical institutes
In the last 10-15 years, natural capital accounting has evolved from a theoretical and academic
construct into a practical framework that is being applied in the policy making process. Many of the
early efforts were focused on particular issues in specific countries and used disparate methodologies.
Following the adoption of the SEEA Central Framework as an internationally agreed standard,
momentum has grown for the implementation of natural capital in many countries. Multiple countries
have already established natural capital accounting programs. A recent survey by the UN Statistics
Division indicated that over 70 countries either have established or are planning to establish
accounting programs (see http://unstats.un.org/unsd/statcom/doc15/BG-UNCEEA.pdf).
Some particular examples serve to highlight the progress that is being made. First, there are a group
of countries that helped to pioneer SEEA based accounting over the past 15-20 years. These
countries include Australia, Canada, Denmark, France the Netherlands, Norway, Sweden and the UK.
In each of these countries small teams were established and maintained over time. They each
released a range of different SEEA accounts and developed relevant data sources and methods. It is
due to the efforts of these countries since the 1990s that a platform exists for the implementation of
SEEA today.
Forest accounting at national level
Since the release of the first SEEA in 1993 and the development of concepts around natural resource
accounting for forests, a number of countries have developed forest accounts. Examples include
16
Australia, Canada, Finland, Guatemala, New Zealand and the UK. For some of these countries the
initial development has been maintained and ongoing accounting for timber and forests takes place.
More commonly, however, forest accounting is undertaken as a one-off study. Examples include
Latvia, Guyana, Tanzania and Zimbabwe. In the latter three cases, the studies were not specifically
based on the SEEA and tended to capture a broad range of forest related goods and service flows.
Work in an EU context
Building on the work of the pioneering SEEA countries, the EU through its statistical agency, Eurostat,
has established piloting programs in many areas of natural capital accounting over the course of the
past 15 years. Based on findings from these pilot programs, in recent years, the EU has passed a
variety of regulations and directives related to natural capital accounting. For example, in 2011, the EU
passed regulation No. 691/2011 that requires all Member States to compile data for three modules: air
emission accounts, environmental taxes, and economy-wide material flow accounts,1 and additional
modules on energy flows, environmental protection expenditure and the environmental goods and
services sector are also planned.
In relation to forest accounting, the EU has been a leading player. Between 1999 and 2002 Eurostat
released four studies on forest related accounting issues including the Integrated Environmental-
Economic Accounting for Forests (IEEAF) in 1999, a forest valuation study in 2000, a study on forest
related recreational and environmental functions in 2002 and the results of pilot studies on forest
accounting in 2002.
A new EU forest strategy was adopted in 2013. The strategy is focused on sustainable forest
management, and providing true economic values for forest ecosystems. In addition, the strategy has
objectives to realize forests’ role in a green economy. 2 For all of the aforementioned directives and
strategies, natural capital accounts can help to provide systematic information and data on key
resources and ecosystems for informed policy decisions. Additionally the information garnered from
accounts can help to generate useful indicators for monitoring and evaluation frameworks. Aligned
with this the Eurostat reporting program on forest accounts is being reinvigorated (based on the work
15 years ago) with plans for an updated forest accounts questionnaire to commence in 2016 (tbc).
Increasingly, work on ecosystem accounting is being undertaken in broader contexts. For example,
under the EU Biodiversity Strategy to 2020, action 5 calls for Member States to map and assess the
state of ecosystems and their services, commonly referred to as MAES3. MAES will provide key
information on the status of terrestrial and marine ecosystems, and natural capital accounting can
provide the link to the overall economy.
Global initiatives to implement natural capital accounting
The establishment of the WAVES program in 2010 has had considerable momentum to the
implementation of natural capital accounting at national level. Significantly, the WAVES program has
1 Full details on the regulation can be found here: http://eur-lex.europa.eu/LexUriServ/LexUriServ.do?uri=OJ:L:2011:192:0001:0016:EN:PDF 2 A full report on the forest strategy can be found here: http://eur-lex.europa.eu/LexUriServ/LexUriServ.do?uri=COM:2013:0659:FIN:en:PDF 3 For more information on MAES see: http://ec.europa.eu/environment/nature/knowledge/ecosystem_assessment/pdf/MAESWorkingPaper2013.pdf
17
sought to move SEEA based measurement beyond the borders of the more statistically established
countries of Europe and North America, and support the process of establishing accounting work
programs in Latin America, Africa and Asia. Over 70 countries have signed up to the WAVES initiative
although implementation has been targeted to 8 countries at present – Botswana, Colombia, Costa
Rica, Guatemala, Indonesia, Madagascar, the Philippines and Rwanda. Forest accounts are
considered an important objective in many of these countries.
More broadly, a global SEEA implementation strategy has been endorsed by the UN Committee of
Experts in Environmental-Economic Accounting (UNCEEA). (ref) In the context of this global strategy,
various programs of SEEA implementation work are now being driven within the UN network of
regional commissions such as UNESCAP, UNESCWA, UNECLAC, UNECA and UNECE. In addition,
the FAO is starting to commence implementation support in the context of SEEA Agriculture, Forestry
and Fisheries.
Advances in ecosystem accounting
In more recent years, a new wave of implementation of natural capital accounting is emerging from the
development of ecosystem accounting. A number of countries are specifically focused on testing the
SEEA ecosystem accounting framework (e.g. Australia, Canada, Chile, Indonesia, Mexico and South
Africa). In other cases, the SEEA ecosystem accounting framework is becoming a part of already
established measurement projects. Examples include the UK National Ecosystem Assessment, the
UNEP TEEB study, and work on the measurement of ecosystem services in the Netherlands at the
University of Wageningen and by Conservation International in San Martin, Peru.
Support for implementation
To support implementation and ensure appropriate guidance on specific topics a range of supporting
documents have been developed. These include SEEA Water, SEEA Energy, SEEA Agriculture,
Forestry and Fisheries, SEEA Applications and Extensions and the SEEA Implementation Guide. This
sourcebook represents a further complement to these documents. There are also a range of training
courses and other materials that can be accessed for other environmental themes (e.g. the
International Recommendations on Water Statistics).
An important feature of the development of the SEEA has been the meetings of the London Group of
Experts on Environmental-Economic Accounting. This group, which first met in 1994, has provided a
forum for discussion and debate on measurement issues and has ensured an ongoing dialogue
among experts at country level. The papers and proceedings of these meetings are a valuable
resource for natural capital accounting (see http://unstats.un.org/unsd/envaccounting/londongroup/).
18
3. Applications of forest accounting
3.1 Introduction
The usefulness of forest accounts ultimately lies in the ability to use the information to inform decision-
making at sector or national level. The compilation of forest accounts as described in this Sourcebook
simply provides a tool to aid discussion and decision-making – forest accounts do not provide the
policy solutions directly.
This chapter provides an overview of the various possible applications of information from forest
accounts. A key observation is that all of the applications relate to a single forest accounting
framework – i.e. it is not necessary to create different sets of forest accounts for different policy
applications. It may be that in some cases more detail is required to support analysis in particular
areas but such detail can still be placed in the context provided by a single forest accounting
framework.
Three broad types of policy related applications are described: (i) policy monitoring and indicators; (ii)
macroeconomic and forestry sector analysis; and (iii) integrated development and land use planning,
including assessment of ecosystem services and biodiversity. There are necessarily overlaps between
these areas driven by the multifaceted role that forests play in our societies and economies. However,
the different groupings help to provide some sense of the variety of means in which forest accounts
can be used. The examples of applications provided here should not be considered fixed. It is likely
that other uses and applications will be found over time as the information set becomes known and
develops over time.
3.2 Policy questions
Natural capital accounts can provide improved indicators and statistics that can be used for informed
policy decisions. It is useful to consider the types of problem or issues that certain countries are facing
and develop a range of relevant policy questions that help to frame the issue in a way that clarifies the
information requirements.
Many of the policy uses will relate to the management of resources or developing cross-sectoral
policies. In this context the following policy questions emerge (Lange, 2004 and Lange, 2003):
1. What is the total economic contribution of forests and forest ecosystems and what are the
benefits from sustainable management?
2. What is the distribution of benefits from forests among different groups in society?
3. Is economic growth sustainable or is it based on the depletion of forests?
4. What are the trade-offs among competing users and how can resource utilization be
optimized?
5. What are the impacts of other sectors’ policies on forests?
6. Is the maximum rent being generated and recovered by forest management policies; if not,
are there other socio-economic objectives that are being met, such as support to rural
economies, or employment creation, and what is the economic cost of meeting these other
objectives?
19
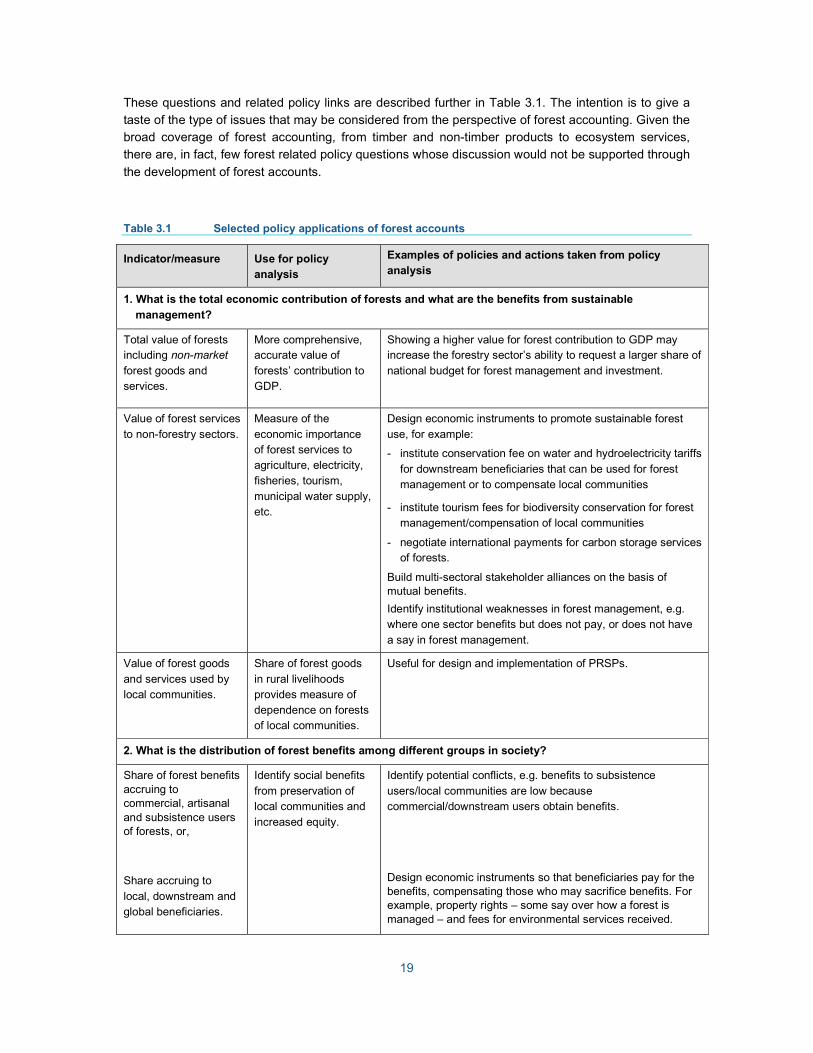
These questions and related policy links are described further in Table 3.1. The intention is to give a
taste of the type of issues that may be considered from the perspective of forest accounting. Given the
broad coverage of forest accounting, from timber and non-timber products to ecosystem services,
there are, in fact, few forest related policy questions whose discussion would not be supported through
the development of forest accounts.
Table 3.1 Selected policy applications of forest accounts
Indicator/measure Use for policy
analysis
Examples of policies and actions taken from policy
analysis
1. What is the total economic contribution of forests and what are the benefits from sustainable
management?
Total value of forests including non-market
forest goods and services.
More comprehensive, accurate value of
forests’ contribution to GDP.
Showing a higher value for forest contribution to GDP may increase the forestry sector’s ability to request a larger share of
national budget for forest management and investment.
Value of forest services
to non-forestry sectors.
Measure of the
economic importance of forest services to agriculture, electricity, fisheries, tourism,
municipal water supply, etc.
Design economic instruments to promote sustainable forest
use, for example:
- institute conservation fee on water and hydroelectricity tariffs
for downstream beneficiaries that can be used for forest management or to compensate local communities
- institute tourism fees for biodiversity conservation for forest management/compensation of local communities
- negotiate international payments for carbon storage services of forests.
Build multi-sectoral stakeholder alliances on the basis of mutual benefits.
Identify institutional weaknesses in forest management, e.g. where one sector benefits but does not pay, or does not have
a say in forest management.
Value of forest goods
and services used by local communities.
Share of forest goods
in rural livelihoods provides measure of dependence on forests of local communities.
Useful for design and implementation of PRSPs.
2. What is the distribution of forest benefits among different groups in society?
Share of forest benefits accruing to commercial, artisanal and subsistence users of forests, or,
Share accruing to
local, downstream and global beneficiaries.
Identify social benefits
from preservation of local communities and
increased equity.
Identify potential conflicts, e.g. benefits to subsistence
users/local communities are low because commercial/downstream users obtain benefits.
Design economic instruments so that beneficiaries pay for the benefits, compensating those who may sacrifice benefits. For example, property rights – some say over how a forest is managed – and fees for environmental services received.
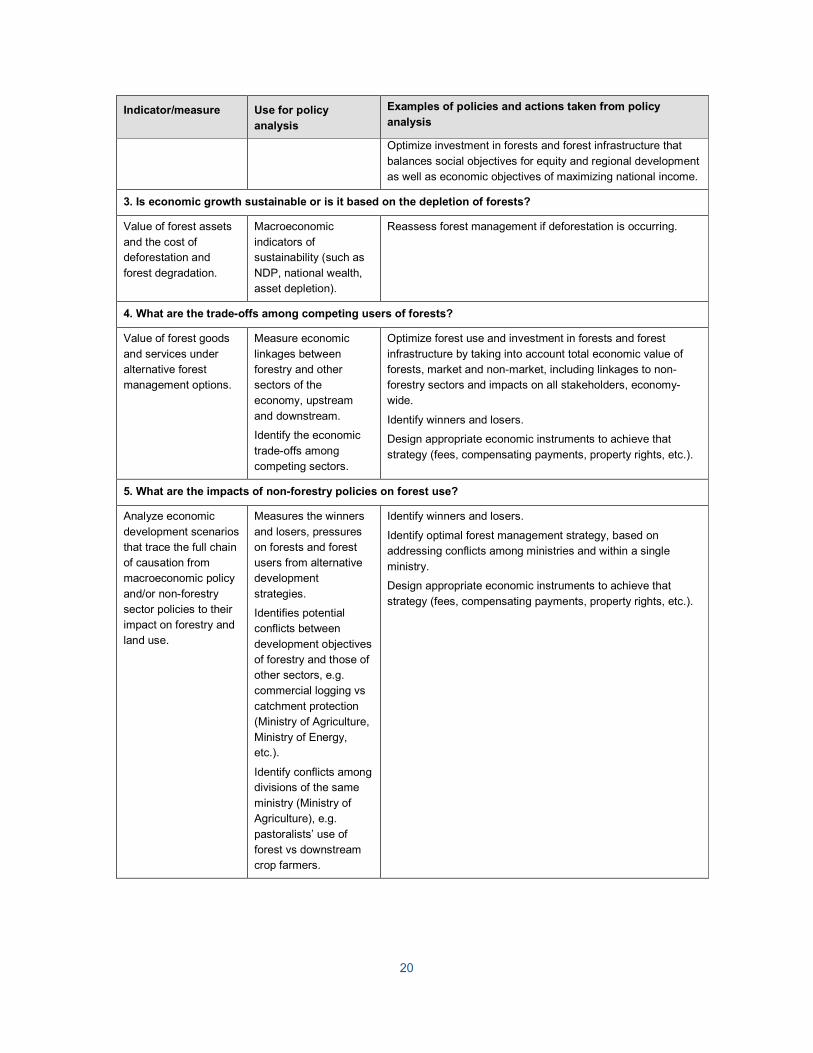
20
Indicator/measure Use for policy
analysis
Examples of policies and actions taken from policy
analysis
Optimize investment in forests and forest infrastructure that
balances social objectives for equity and regional development as well as economic objectives of maximizing national income.
3. Is economic growth sustainable or is it based on the depletion of forests?
Value of forest assets
and the cost of deforestation and
forest degradation.
Macroeconomic
indicators of sustainability (such as
NDP, national wealth, asset depletion).
Reassess forest management if deforestation is occurring.
4. What are the trade-offs among competing users of forests?
Value of forest goods
and services under alternative forest management options.
Measure economic
linkages between forestry and other sectors of the economy, upstream
and downstream.
Identify the economic
trade-offs among competing sectors.
Optimize forest use and investment in forests and forest
infrastructure by taking into account total economic value of forests, market and non-market, including linkages to non-forestry sectors and impacts on all stakeholders, economy-wide.
Identify winners and losers.
Design appropriate economic instruments to achieve that
The use of accounting based information for policy monitoring and the derivation of indicators is likely
the most common, but sometime forgotten, role of accounting frameworks. We tend to take for granted
the regular measurement of economic growth, balance of trade, corporate profits, investment flows,
measures of debt and similar indicators but all of these types of measures emerge from the
compilation of regular sets of corporate and national accounts. One key ambition of the development
of natural capital accounts in general and forest accounts in particular, is the regular production of
coherent information on the stock, changes in stock and relevant flows of goods and services from
environmental assets.
At an international level there are an increasing number of reporting requirements related to forest
information. From a country level perspective it would be beneficial if the relevant information could be
co-ordinated and integrated thus improving the quality of the information and also, potentially reducing
transaction costs in compiling and submitting data.
Examples of the types of international data and reporting that could be integrated within the scope of a
forest accounts framework include:
• Five yearly reporting to the FAO as part of the Global Forest Resources Assessment
• Regular reporting on the UN SDGs, in particular Goal 14 on the protection, restoration and promotion of terrestrial ecosystems
• Reporting requirements for the Aichi targets of the Convention on Biological Diversity.
• Measurement required in the context of implementation of Green Growth and Green Economy initiatives.
• The compilation of estimates of greenhouse gas inventories under the UNFCCC, particularly those related to land use, land use change and forestry (LULUCF).
In addition, there are international projects that are compiling estimates of wealth for all countries
where wealth is defined broadly to include natural capital. Two examples are the World Bank
estimates of comprehensive wealth and genuine savings and the UNDP/IHDP inclusive wealth
estimates. The development of these types of measures at national level for forests recognizes the
important role that regular monitoring of all aspects of wealth can play in understanding a country’s
longer term capacity for development.
At national level, the development of a set of forest accounts would direct support the preparation of
State of Environment reports which are legislated in many countries. As well, following the standards
described in the SEEA Central Framework, it is possible to compile depletion adjusted measures of
industry value added and GDP, which may provide important additional monitoring information. This specific objective of depletion adjusted measures of economic activity is a driver of forest accounting
work in India (see Gundimeda et al, 2007).
<<Insert Box 3.1 summarizing Gundimeda et al. >>
Since forest accounts can now be based on an agreed international standard, regular reporting will
also enable a comparison across countries as to the effectiveness of various policy choices since a
common set of metrics is being compiled.
22
It is important that regular reporting be seen as an essential aspect of forest accounting. Too often,
countries have established one-off investigations. These may be useful for considering a specific
policy question at a point in time but do not provide for the mainstreaming of forest related information
into the ongoing policy discourse. This is not to argue that very detailed accounts are required every
year but rather that a program of work that ensures the compilation and publication of a core set of
forest accounting information should be considered standard practice in all countries.
Macroeconomic and forestry sector analysis
A set of forest accounts can also provide a focus on the direct economic related questions relevant to
forestry. Table 3.1 provides some example of relevant policy questions that can be tackled using
forest accounts. Forest accounts, especially ecosystem based accounts, can identify potential
conflicts, at both a national level of with respect to development objectives and between local users of
forest resources. By quantifying the relative values, trade-offs among users can be assessed and
forest strategies designed that take into account all stakeholders. Forest accounts also assist in the
building of multidisciplinary relationships across ministries and among different stakeholders in the
private sector, as they realize the extent of their dependence on forests.
Investigating these questions using a standard set of forest accounts that can be integrated with
information for other economic activities is particularly useful. Indeed, an important part of the benefit
of using SEEA based accounting approaches is that the definitions and measurement boundaries
have been defined in a way that facilitates the integration of information.
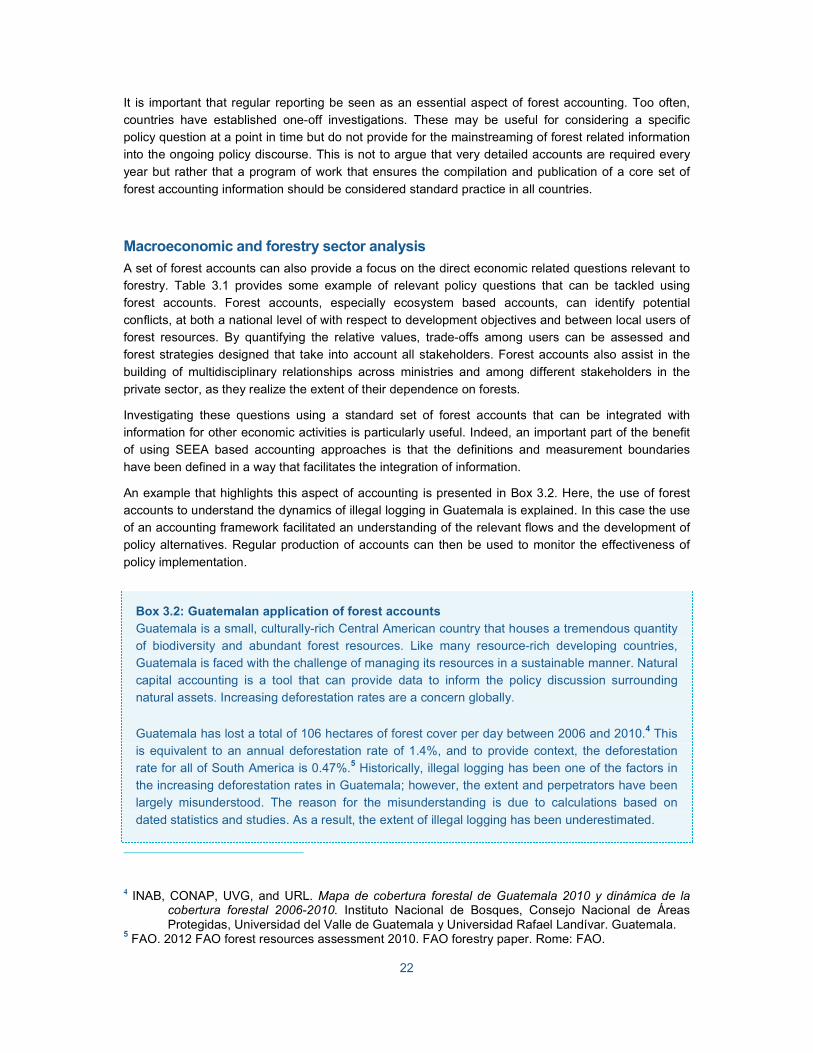
An example that highlights this aspect of accounting is presented in Box 3.2. Here, the use of forest
accounts to understand the dynamics of illegal logging in Guatemala is explained. In this case the use
of an accounting framework facilitated an understanding of the relevant flows and the development of
policy alternatives. Regular production of accounts can then be used to monitor the effectiveness of
policy implementation.
Box 3.2: Guatemalan application of forest accounts
Guatemala is a small, culturally-rich Central American country that houses a tremendous quantity
of biodiversity and abundant forest resources. Like many resource-rich developing countries,
Guatemala is faced with the challenge of managing its resources in a sustainable manner. Natural
capital accounting is a tool that can provide data to inform the policy discussion surrounding
natural assets. Increasing deforestation rates are a concern globally.
Guatemala has lost a total of 106 hectares of forest cover per day between 2006 and 2010.4 This
is equivalent to an annual deforestation rate of 1.4%, and to provide context, the deforestation
rate for all of South America is 0.47%.5 Historically, illegal logging has been one of the factors in
the increasing deforestation rates in Guatemala; however, the extent and perpetrators have been
largely misunderstood. The reason for the misunderstanding is due to calculations based on
dated statistics and studies. As a result, the extent of illegal logging has been underestimated.
4 INAB, CONAP, UVG, and URL. Mapa de cobertura forestal de Guatemala 2010 y dinámica de la
cobertura forestal 2006-2010. Instituto Nacional de Bosques, Consejo Nacional de Áreas Protegidas, Universidad del Valle de Guatemala y Universidad Rafael Landívar. Guatemala.
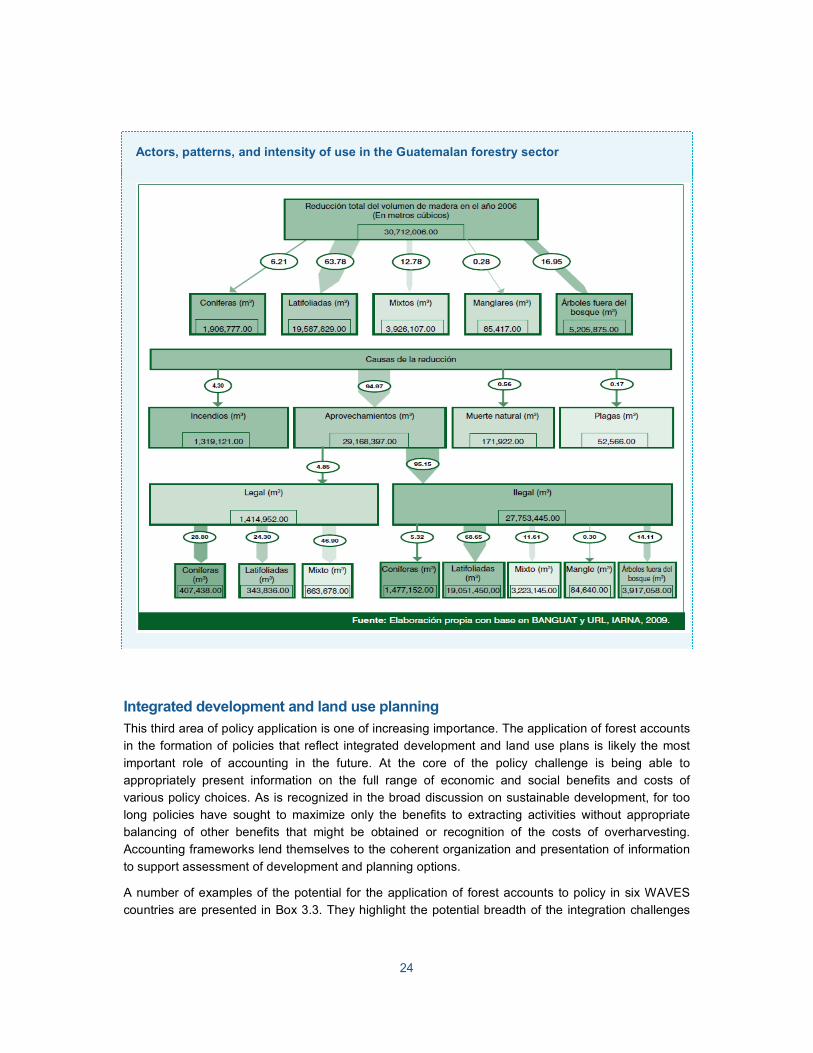
To more accurately understand the problem of illegal logging, academic institutions, government entities, and private organizations initiated the compilation of forest accounts according to the
SEEA in 2006. Before the compilation of the accounts, the relationships in the logging supply
chain were not understood. Moreover, the complete array of products and services that forests
supplied were not accounted for in previous studies. As a result of the development of forest
accounts, the distribution and relationship of all the actors in the logging chain are recognized and
the values for forest products are being more accurately valued. From the accounts, it became
evident that illegal logging was more of a problem than previously thought. In fact, more than 96%
of the timber extracted from Guatemalan forests came from illegal extractions (Figure 1).
The accounts also illustrated that illegal logging stems from two sectors of society: (i) households
and (ii) the private business sector. Household consumption is largely the result of the need of
wood for fuel to cook and for construction materials. The private sector is represented primarily by
the agriculture and timber industries. However, as the population grows and local people are
increasingly living at greater distances from forests, private sector wood brokers are relevant
economic units and the clearing of forests for commercial farming is more common.
Understanding the linkages and distribution of forest resources is an invaluable asset that was not
available for Guatemalan policy makers before the accounts were compiled.
Prior to the compilation of the forest accounts, the National Forest Policy of Guatemala
incentivized the development of a plantation silviculture industry and attempted to protect
strategic forest ecosystems. Unfortunately, the policy has not curbed the problem of illegal logging
and has not prevented an increase in deforestation rates. As a result of the accounts, policy
makers more fully understood the flows through the entire timber sector. Thus, Guatemala is
designing a new strategy to prevent illegal logging. The strategy will attempt to allow the timber
industry to grow in a sustainable manner, and at the same time, put safeguards in place to
decrease the amount of illegal logging. The objective is to provide incentives that will allow the
equitable flow of benefits to all of the actors in the logging chain. The development of the strategy
to stop illegal logging will help Guatemala manage forest resources to contribute to the economic
growth of the country while maintaining forest productivity and other environmental and
community services that forests provide.
24
Actors, patterns, and intensity of use in the Guatemalan forestry sector
Integrated development and land use planning
This third area of policy application is one of increasing importance. The application of forest accounts
in the formation of policies that reflect integrated development and land use plans is likely the most
important role of accounting in the future. At the core of the policy challenge is being able to
appropriately present information on the full range of economic and social benefits and costs of
various policy choices. As is recognized in the broad discussion on sustainable development, for too
long policies have sought to maximize only the benefits to extracting activities without appropriate
balancing of other benefits that might be obtained or recognition of the costs of overharvesting.
Accounting frameworks lend themselves to the coherent organization and presentation of information
to support assessment of development and planning options.
A number of examples of the potential for the application of forest accounts to policy in six WAVES
countries are presented in Box 3.3. They highlight the potential breadth of the integration challenges
25
with dimensions around forests including: tourism, watershed management and protection, distribution
of resources, coastal protection, green growth and climate change.
Box 3.3 Policy applications of forest accounts in WAVES countries
By determining essential benefits that forests provide, Madagascar can make informed decisions
about how to finance its protected area network that covers 6.9 million hectares and houses
unrivaled biodiversity. The potential economic benefits from tourism and watershed protection
across the network are estimated at $48 million per year; however, only $0.5 million per year (ref)
is being generated from tourists’ visitation fees. Forest accounts are being compiled that will
provide data to inform the development of a sustainable financing mechanism to be created for
the national protected area network that will ensure benefits help alleviate poverty and provide
equitable growth strategies for the country as a whole.
One of the greatest sources of wealth that Colombia can offer to the global market is the
country’s incredible biodiversity. To protect these resources and ensure that the distribution of
resources is equitable, accounts that value ecosystem services, especially those that flow from
forests, are necessary. By quantifying forest assets and constructing a supply-utilization matrix for
each watershed, the country can reduce uncertainty about data on supply and demand of timber
resources. From this information, Colombia will be prepared to design policy mechanisms to
incentivize sustainable forest management.
Only 19% of the land in the Philippines remains forested. To provide policy applications that will
help to manage competing land uses, develop sustainable forest industries, and increase benefits
to local communities, the Philippines needs tools that calculate values for all forest services.
Specifically, forest accounts are being developed for mangroves to provide important information
about coastal protection, carbon sequestration, and provisioning services that mangroves provide.
These data will help to inform a national development plan that emphasizes the reforestation of
mangroves to provide essential coastal services to the country’s inhabitants.
With ambitious goals associated with green growth, Costa Rica wants to ensure that the benefits
from forest ecosystems will continue to be a source of wealth for the country. By establishing
forest accounts, policy makers and the government can be conscious of the vast array of services
that forests provide when designing development plans. The forest accounts are being compiled
to ensure that Costa Rica has better analytical and decision-making tools to inform policy
decisions on sustainable forest management, including the REDD+ Strategy.
To address its vulnerability to climate change, Vietnam has enacted a Green Growth Strategy
that seeks to reduce the country’s greenhouse gas emissions and improve disaster preparedness
plans. Forest accounts provide necessary data to inform policies that will incentivize the
reforestation of various areas to simultaneously sequester carbon and provide erosion protection.
Botswana has experienced rapid economic growth built upon the diamond mining industry, but
now needs to diversify the country’s growth path based on natural capital. By incorporating values
of ecosystem services, forest accounts help inform policies to address the management of land to
realize benefits from tourism while simultaneously protecting vital watersheds.
One of the clear messages that emerges from these examples is the need for policy makers to
balance competing requirements and interests. In this regard it is important to understand that the
compilation of forest accounts does not advocate for a particular policy solution – accounting is, by
26
nature, policy neutral. The ambition is to ensure that those making decisions have as complete and
coherent set of information as possible. The example from Andalucia is relevant in this regard (Box
3.4).
Box 3.4 Policy example from Andalucía, Spain
The government for the region of Andalucia, Spain is financing a study to examine various
government subsidies and if they have contributed to the overall economy. Specifically, the study
aims to answer some key questions regarding subsidies to methods that aid in avoiding forest
fires. It is the hope that the study can demonstrate the value added by providing incentives to
avoid forest fires. In addition, the researchers and the government want to see whether the costs incurred for environmental protection are justified. The study is using environmental and forest
accounts to determine the actors and the flows of funds for the year 2010. In the future, the study
and the accounts will be used to inform or modify policies surrounding the management of forests
and environmental protection.
3.4 Analytical models based on forest accounting
The previous section gave a sense of the different ways in which forest accounts might support policy
discussion. Often, this support can be provided through the presentation of forest accounts or the
derivation of indicators from the accounts. In other cases, it will be appropriate to use the information
from forest accounts as inputs to analytical models. This section considers some possibilities of this
type.
Physical and monetary measures from environmental accounts have frequently been used for
computing environmental-economic macro-indicators, and as input to economic models, e.g.
environmental-economic Computable General Equilibrium (CGE) models and Integrated Assessment
Models (IAMs). Natural capital accounting information can also support the derivation of productivity
measures, the analysis of supply/value chains through the economy (for example assessing the
carbon and water embodied in traded goods) and the application of CGE models.
In Box 3.5, forest accounts are shown to provide the data to underpin the development of macro-
economic models – in this case an input-output model for the Scottish forestry industry.
<<Insert Box 3.5 - Example of Scottish analysis>>
In relation to the ecosystem services provided by forests, a variety of models can help to identify the
value of ecosystems and analyze tradeoffs of different development schemes. For example, the
InVEST Model, developed by The Natural Capital Project, combines the ecological production
functions with economic valuation approaches including market valuation, avoided costs, and
production economics. This tool is free to use, scientifically viable, and has many features that allow
for flexibility. InVEST is spatially explicit, focuses on the ecosystem services, details the relationships
among multiple resources, and is scenario driven. 6 This model relies on existing knowledge, but is
modular and allows users to deal flexibly with data availability and changing knowledge.
6 For more detailed information see: http://www.naturalcapitalproject.org/InVEST.html
27
Another tool, developed jointly by the Natural Capital Project and The Nature Conservancy, RIOS can
allow for users to design more efficient water resource investments to best preserve or enhance the
supply of services. RIOS combines biophysical information, information for feasible land use changes,
and ecological projections of their impacts on different parts of a watershed. This model is useful for
optimizing investments in a watershed and can develop investment portfolios to target different water
resource objectives including:
• Groundwater recharge enhancement
• Maintenance of base flows
• Sediment retention
• Reduce nutrient loading (nitrogen and phosphorus)
• Flood mitigation
• Biodiversity
These models can be useful in providing key information for policy makers and resource managers to
sustainably manage important forest areas. Forest accounts can help to organize and make coherent
key input data and information needed to run these models. In addition, natural capital accounts can
provide the information needed to run econometric models to evaluate different policy responses.
28
4. An introduction to structuring forest accounts
4.1 The need for forest accounts beyond the SNA
The SNA is particularly important because the data set that it underpins constitutes the primary source
of information about the economy. It is widely used for economic performance assessment, policy
analysis, and decision-making (Lange, 2004) and all countries are expected to compile estimates of
GDP within the national accounts framework. In the SNA, all economic resources entering the
economy of a country and flowing within a country are assessed or estimated using the same
standard concepts and definitions. Therefore, estimates of production, income, consumption and
investment become comparable across sectors and countries.
The way forests are considered in the measurement of GDP tends to be limited to recording the
activity of the forestry industry. Its activity is defined by the growing of trees, the production of timber,
and the production of other forest-related products and services by economic units that specialize in
these activities. However, forests also supply a range of goods and services not traded on markets,
such as air filtration services, carbon sequestration services and recreational opportunities. These
goods and services have no established market price, despite their significant contribution to human
wellbeing. The ecological and social significance of forest resources and their utilization also have
considerable effects on other parts of the economy and public welfare, and are of great political
concern (Sekot, 2007).
Vincent (1999) shows that frequently the industry value added, as conventionally defined, is
overstated from a social standpoint, because a portion of the forestry industry’s operating surplus
should be attributed to the natural inputs of timber provided by forests rather than being considered a
return to the investment in produced assets of the forestry industry. Further, forests provide
intermediate inputs to other activities, such as livestock grazing and tourism, but the value of these
inputs is not recognized (Lange, 2004). Thus, not only are the total benefits from sustainable forestry
underestimated, but other economic activities are not aware of their dependence on healthy forests
(Lange, 2004).
These examples show that the usual measurement scope of GDP has a number of shortcomings
regarding the treatment of forests. Hence, compiling forest accounts is useful to gain knowledge about
the economic and ecological interactions between forests and society and to obtain more complete
valuations (in monetary terms) for forest goods and services. These advances in information are is
important in underpinning improved management decisions, and environmental and economic policy
development (Kriström and Skånberg, 2001).
As Lange (2004) points out, establishing a forest accounting framework paves the way for establishing
a value closest to the true socio-economic value of forests in relation to the rest of the economy. The
total economic contribution of forests to the national economy could be calculated, as well as the
potential losses from changes in forest use. Furthermore, the beneficiaries and their distinct nature
(direct/indirect, local/downstream) could be identified. This information is necessary for optimizing
forest management to support achieving economic and social objectives (e.g., local community
preservation, increased equity).
Forest accounts provide detailed statistics that may be used in economy-wide models to assess the
impacts of non-forestry policies (in particular industrial, social and environmental policies) and to
design strategies for economic development that take into account all marketed and non-marketed
goods and services provided to all stakeholders.
29
4.2 The framework for compiling forest accounts
Environmental-economic accounts
The discussion of accounts in this sourcebook follows the recommendations and treatments in the
SEEA Central Framework and the SEEA EEA. In broad terms, the recommendations of the SEEA
Central Framework can be considered to reflect a resource-based approach to measurement while the
SEEA EEA presents an ecosystem-based approach - see Box 4.1
Box 4.1: The SEEA Central Framework and SEEA Experimental Ecosystem Accounting
Initially developed in the early 1990s, the SEEA is conceived as a comprehensive approach for
the organization of information concerning the relationship between the environment and the
economy. To provide a suitable coverage and to ensure that more recent developments on
ecosystem services could be incorporated, a two volume approach to the development of the
SEEA 2012 was applied.
The first volume, titled SEEA Central Framework, views the environment in terms of individual
environmental stocks and flows and hence provides standards to account for variables such as
stocks of timber, fish, mineral resources and land, and for flows of energy, water, emissions and
waste.
The second volume, titled SEEA Experimental Ecosystem Accounting, views the environment as
a set of ecosystems such as forests, wetlands, grasslands and agricultural land. The ecosystem
accounting model describes the measurement of the changes in condition and extent of the stock
of ecosystem “assets”; and the measurement of the ecosystem services that flow from those
assets.
There are connections between the two volumes (for example, between the measurement of the
stock of timber resources and the condition of forests). The intention is that the different
perspectives are seen as complementary rather than competing approaches to accounting for
natural capital.
The environmental-economic accounts of the SEEA follow three main structures – physical flow
accounts, asset accounts and economic activity and transaction accounts.
Physical flow accounts7
In the SEEA Central Framework, physical flow accounts record the flows of materials and energy (i)
from the environment to the economy (natural inputs); (ii) within the economy (products); and (iii)
between the economy and the environment (residuals). Physical flows are recorded in physical supply
and use tables. These tables are extensions of the monetary supply and use tables used in the SNA
for the recording of flows of products in monetary terms. To align the physical and monetary tables,
the ISIC classification for industries and the CPC classification for products are used. Generally,
7 Further detail on physical flow accounts is provided in the SEEA Central Framework Chapter 3 and details on the measurement of ecosystem services is provided in SEEA EEA Chapter 3.
30
physical flow accounts are designed to record flows relating to a single type of material or energy,
such as water, GHG emissions and energy, and hence a single unit of measure (tonnes, m3, pJ, etc.)
can be used. From a resource-based perspective, the forest flow accounts will focus on natural inputs
from forests, the products that have a forest origin and the use that different economic units make of
them.
Asset accounts8
Asset accounts record the opening and closing stock of an asset and the changes (additions and
reduction) to the stock over an accounting period. The term stock is employed to refer the total
quantity of assets at a given point in time. The asset accounts typically encompass accounts
measured in both physical and monetary terms. Physical asset accounts measure the stock and its
changes in the appropriate physical units (e.g. hectares, m3). Monetary asset accounts translate the
physical measurements into monetary units, generally using net present value techniques.
Economic activity and transactions related to the environment9
These accounts provide an approach to highlighting relevant transactions and flows from the standard
accounts defined in the SNA. Generally these transactions are not identifiable in standard
presentations. The approach taken is to define the relevant activities, goods and services that can be
considered to have an environmental purpose, i.e. that have as their primary purpose, the elimination
of pressures on the environment or the more efficient use of national resources. Economic activities
undertaken for environmental purposes can be separately identified and presented in functional
accounts, such as environmental protection expenditure accounts.
Ecosystem accounts
In the SEEA EEA, ecosystem-based approach, the focus of physical flow accounting is on the forest
ecosystem services that contribute to benefits used in economic and other human activity. In concept,
ecosystem services also include non-use existence values but the measurement of these flows is
difficult. The focus of the SEEA EEA excludes service flows within and between ecosystems that
relate to ongoing ecosystem processes, commonly referred to as intermediate or supporting services.
While these flows are not included in the flow accounts, they are considered part of the measurement
in the ecosystem assets (SEEA EEA 2.23). Further, the physical flow accounting in the SEEA EEA
takes no explicit account of so-called ecosystem “disservices”, such as pest and disease. To some
extent these flows will be reflected in reduced flows of some ecosystem services (e.g. lower flows of
provisioning services) (SEEA EEA 2.24).
8 Further detail on asset accounts is provided in the SEEA Central Framework Chapter 5 and the SEEA EEA Chapter 4. 9 Further detail on accounts related to environmental transactions is provided in the SEEA Central Framework Chapter 4.
31
Recognizing forests as environmental assets
In broad terms, assets are considered items of value for society and in economics these have been
defined as stores of value that, in many situations, also provide inputs to production processes (SEEA
Central Framework, 5.1). Thus, environmental assets are defined broadly in the SEEA Central
Framework as “the naturally occurring living and non-living components of the Earth, together
comprising the bio-physical environment that may provide benefits to the humanity” (SEEA Central
Framework, 2.17). The term “environmental asset” has been defined to acknowledge the value
inherent in the components that comprise the environment and the inputs that the environment
provides to society in general and the economy in particular.
Forests can be considered as environmental assets and measured from two perspectives: an
individual resource-based perspective and an integrated ecosystem-based perspective. This
Sourcebook encompasses both perspectives.
The resource-based perspective, as described in the SEEA Central Framework, reflects the more
traditional measurement approach in which forests are considered in terms of two primary
environmental assets: forest land and timber resources.
The ecosystem-based perspective, described in the SEEA EEA, considers forests as systems,
acknowledging their role in providing a multiplicity of services that benefit society. The focus of the
ecosystem-based approach is the measurement of ecosystem assets. Ecosystem assets are defined
in terms of spatial areas of similar type – for example, forests, grasslands, mangroves. Each
ecosystem asset will have a specific extent and condition that can be accounted for over time and will
also supply a “basket” of ecosystem services. The aggregation of all future ecosystem services for a
given basket provides, at a point in time, an estimated stock of ecosystem service flows (SEEA EEA,
2.31).
Pathways in compiling forest accounts
The compilation of forest accounts following either a resource-based or ecosystem-based approach
entails following a number of steps summarized in Figure 4.1. The departure point under either
approach is the mapping of forest areas in the country or region where the accounts are to be
developed. These are the land cover accounts described in the SEEA Central Framework and the
related ecosystem extent accounts described in the SEEA EEA.
The FAO provides an international classification of forests and criteria to distinguish classes of forest
land. Box 4.2 presents this classification. Although countries are encouraged to follow the FAO
definitions, in many cases they have developed their own definitions of forests.
32
Figure 4.1 Pathways in compiling forest accounts
Resource-based accounts for forests
The resource-based approach encompasses accounting for forest land and the individual resources
that are obtained from forests. Typically, accounting for forest land and the stock and extraction of
timber resources is the main objective, but accounting for the array of other forest products, such as
cork, forest fruits, game and fodder, can also be considered in a resource accounting framework.
The first step to compiling the accounts starts from defining and mapping the forest area in the
country. This can be the compilation of a land cover account which will account for all land in a country
– i.e. including forests, grassland, wetlands, agricultural and urban areas, etc. This account will form
the basis for accounting for forest land and for defining the resources to be assessed within the forest
area. Considering timber as an example, in areas identified as forests, timber resources should be
measured according to the main relevant characteristics, e.g. broadleaved and conifer species, age
classes and according to the main accounting classes (e.g. cultivated and natural classes) in the
appropriate physical units for this resource (generally cubic metres for timber). The next step is to
calculate the flow of these resources to the economic units that benefit from their extraction. These
flows are the basis for the monetary accounts. It is noted that within a resource based approach,
countries with timber resources outside forest areas (e.g. in orchards) can also be recorded.
Ecosystem-based accounts for forests
The ecosystem based approach focuses on measuring the contributions of the ecosystems to the
economy and to society more broadly. For this purpose, using spatial areas as the units of analysis is
most appropriate. As for the resource-based accounts, the first step is to map the forest area in the
country. This is followed by defining a set of criteria that allow creating homogeneous forest
ecosystem units (EU) (for example, based on vegetation type). According to these criteria, the forest
Forest BenefitsForest asset
(Forest class)
Forest
Ecosystem
Services
Provisioning services
Regulating services
Cultural Services
Assessment
of forest
ecosystem
classes flow of
ecosystem
services
from the
forest asset
benefits
from forest
ecosystem
services
Framework for forest accounts
Location
Extent
Condition
Characterization
of the forest
resource
ECOSYSTEM
BASED
ACCOUNTS
Forest asset
(individual forest
resources)
Assessment
of the resource
at the country
level
RESOURCE
BASED
ACCOUNTS
Definition of
criteria for
creating forest
ecosystem
classes
Extent
Characteristics
Forest Resource
Timber resources
Non-timber resources
flow of forest
resources
from
extraction
Market forest benefits
Contribution to other
sectors (intermediate
consumption)
Non-market forest
benefits
MAPPING THE
FOREST AREA
AT THE
COUNTRY
LEVELDefinition
of the forest
resource
to assess
MAPPING THE
FOREST AREA
AT THE
COUNTRY
LEVELCharacterization
of the forest
asset
33
EU will be classified into different forest classes. These forest EU will be the ecosystem assets which
provide flows of ecosystem services to society.
Once the forests assets have been delineated, the next step is to describe their location, extent,
condition and finally, their capacity to supply ecosystem services. The condition of these forest assets
will be described through key characteristics. Basic characteristics are those related to the ecological
nature of the EU in terms of species composition, structure and key ecological processes. Example
indicators include measures of tree density, canopy cover and species diversity and other proposals
are noted in Chapter 5. A list of key characteristics of the forest assets should be selected, together
with associated indicators of changes in those characteristics. The indicators should be responsive to
changes in the functioning and the integrity of the ecosystem.
Box 4.2: Forest land classification in FAO FRA2010
The FAO Forest Resource Assessment 2010 for forestland distinguishes among the following forest land classes:
Forest land is defined as: land spanning more than 0.5 hectares with trees higher than 5 metres and a
canopy cover of more than 10 percent, or trees able to reach these thresholds in situ. Forest land is classified according to different types of forest. The primary distinction is between naturally regenerated forest
and planted forest.
Naturally regenerated forest is forest predominantly composed of trees established through natural
regeneration. In this context, predominantly means that the trees established through natural
regeneration are expected to constitute more than 50% of the growing stock at maturity.
Two broad types of naturally regenerated forest are distinguished:
i. Primary forest is naturally regenerated forest of native species, where there are no clearly visible indications of human activities and the ecological processes are not significantly disturbed. Key characteristics of primary forests are that (a) they show natural forest dynamics, such as natural tree species composition, occurrence of dead wood, natural age structure and natural regeneration processes; (b) the area is large enough to maintain its natural characteristics; and (c) there has been no known significant human intervention or the last significant human intervention was long enough ago to have allowed the natural species composition and processes to have become re-established.
ii. Other naturally regenerated forest is naturally regenerated forest with clearly visible indications of human activities. These include (a) selectively logged-over areas, areas regenerating following agricultural land use and areas recovering from human-induced fires, etc; (b) forests where it is not possible to distinguish whether they are planted or naturally regenerated; (c) forests with a mix of naturally regenerated trees and planted/seeded trees and where the naturally regenerated trees are expected to constitute more than 50% of the growing stock at stand maturity; (d) coppice from trees established through natural regeneration; and (e) naturally regenerated trees of introduced species.
Planted forests are predominantly composed of trees established through planting and/or deliberate seeding. Planted/seeded trees are expected to constitute more than 50% of the growing stock at maturity, including coppice from trees that were originally planted or seeded.
Other wooded land is land not classified as forest land, spanning more than 0.5 hectares; with trees higher
than 5 metres and a canopy cover of 5-10 percent, or trees able to reach these thresholds in situ; or with a combined cover of shrubs, bushes and trees above 10%. It does not include land that is predominantly under
agricultural or urban land use.
Where possible accounts should be compiled using these distinctions between types of forest and other wooded land. In addition, countries may be interested to compile accounts based on the total area of different
tree species.
34
Asset characterization forms the basis to move to the next step where the flow of ecosystem services
from these assets to society is measured. Ecosystem services are classified into three main groups:
provisioning services (e.g. biomass for timber), regulating services (e.g. air filtration) and cultural
services (e.g. recreational opportunities). Society benefits from the flow of these services. The benefits
obtained from forest assets can either enter into the market directly (e.g. through the harvest and sale
of timber), contribute to the production of private benefits in other sectors (e.g. through the value
added earned by recreation based companies); or generate benefits to society that are not traded in
the markets (e.g. through the supply of cleaner air).
Similarities and differences between resource-based and ecosystem-based accounts
The two approaches are related as they both start from measurement of the forest area in a country
and they both assess forests following an accounting logic. However, while the ecosystem-based
accounting focuses on forest ecosystems in terms of spatial areas, the resource-based approach
focuses on individual components such as timber.
Nevertheless, the information compiled for individual resources included in the resource-based
approach, such as timber or extent of forest cover, will be a useful input in the assessment of the flow
ecosystem services. Thus, timber resources are included in ecosystem accounting as reflecting the
main provisioning services provided by forests. Most likely these will flow to the society as benefits
traded in markets. Further, measuring changes in the stock of timber resources and the area of forest
land via resource-based asset accounts is likely to provide some indication of pressures on ecosystem
condition.
While there is a common starting point for measurement for both approaches, there are some
similarities and differences in scope that are represented schematically in Figure 4.2. The key points
are that
• Land accounts will use as their starting point all types of land – forest, urban, agricultural, etc.
• Accounts for forest land will not incorporate all potential timber resources but they should
incorporate areas of forest that are not used for timber production either because they are
protected areas or because they are too remote to be economically viable.
• In a resource based account for timber resources it is possible to include tree-related
resources that are outside forest land, such as timber provided by trees in orchards or agro-
forestry systems. Such information may be useful for some policy purposes such as the
measurement of carbon sequestration and assessing sources of energy.
35
Figure 4.2 Scope of the forest accounts in this Sourcebook
Key concepts for environmental-economic accounting for forests
Economic units
An institutional unit is an economic entity that is capable, in its own right, of owning assets, incurring
liabilities, and engaging in transactions and other economic activities with other entities (SEEA CF
2.110). Groupings of institutional units that are similar in their purposes, objectives, and behaviours
are defined as institutional sectors. The environmental accounts typically consider four environmental
sectors: households, corporations, general government and non-profit institutions serving households.
These sectors are of particular interest in the ownership of forest resources and forest ecosystems.
Groupings of institutional units that undertake similar types of productive activity are referred to as
industries. In forest accounts the key industry is the forestry industry which will encompass activities
related to the management of forest, the cultivation and harvest of timber and a range of associated
activities. However, a range of other industries will also be of relevance depending on the activities
associated with a forest area and the services provided by forests. Possibilities include the agricultural
industry, the recreation and tourism industry and the water supply industry. The analysis of the
institutional units linked to the forest ecosystems and resources is of particular interest to make
predictions on the expected flow of forest ecosystem services.
In the national accounts and in the SEEA an economy is defined in reference to the set of economic
units that are resident within the geographic boundary (or economic territory) of a country. By
convention, all land, including forest land, is considered to be owned by a resident economic unit. If a
foreign economic unit, i.e. it is based in another economic territory, owns land then it is considered to
be purely a financial relationship and the land itself remains an asset of the country in which it is
located. Any associated production from that land is also considered the production of the country in
which the land is located.
36
The production boundary
In accounting terms, the economy is represented by both stocks and flows. The measurement of flows
centres on three economic activities: production, consumption and accumulation. Among these, the
production boundary is the most significant measurement boundary. All products (goods and services)
that are regarded as produced through a combination of labour and capital are considered to be within
the production boundary. This set of goods and services also defines the set of goods and services
that must be consumed or accumulated and defines the scope of measures of gross domestic product
(GDP). Flows between the economy and the environment are estimated in relation to the production
boundary as defined in the SNA. This aspect is further developed in the asset section.
Depletion and degradation
Depletion is the decrease in quantity of the stock of a natural resource over an accounting period that
is due to the extraction of the natural resource by economic units occurring at a level greater than that
of regeneration (see SEEA Central Framework 5.76 and section 5.4.2 for a detailed discussion). It
relates to the decline of an individual resource. In general, depletion will be recorded when the rate of
resource extraction surpasses the annual growth (e.g mean annual increment). It thus aligns well with
the concept of sustainable yield in silviculture. Typically, depletion is assessed within a resource-
based perspective.
Ecosystem degradation relates to the decline, due to human activity, in the condition of an ecosystem
asset that is also reflected in a decline in the capacity of that ecosystem asset to provide a basket of
ecosystem services in a sustainable manner. Attributing the declines in condition that are due to
human activity is not straightforward and may be a mixture of direct and indirect effects. Further,
because the focus in ecosystem accounting is on multiple ecosystem services it may well be that
some human activities lead to increases in some ecosystem services at the expense of supplying
other ecosystem services and the trade-off between the future supply of the total basket will need to
be assessed when measuring ecosystem degradation.
4.3 Forest accounts following a resource-based approach
Scope of the accounts
In the resource-based accounts of forests, the different forest resources are accounted for individually,
resource by resource. Traditionally, timber and forest land are the two environmental assets
considered. In recent years, forest accounts are also beginning to consider recording stocks and flows
of carbon. Forests also produce a number of resources that the resource accounts should record
when relevant. For example, the vast array of non-wood forest products, such as cork, berries,
mushrooms, game, or honey. Although practical examples in this sourcebook concern timber and
forest land, the methodology is generally applicable to accounting for other resources.
The physical asset accounts in a resource-based approach record all the environmental assets of that
particular type, even if they are not currently expected to deliver benefits to an economic owner.
However, in monetary terms the conceptual scope of the resource-based assessment is limited to
those parts of the assets that have an economic value. For example, the physical asset accounts for
timber resources should include all timber resources in a country whereas the monetary asset
37
accounts may exclude some resources such as remote forests since there may be no current
economic value associated with the stock of timber.
The boundary between cultivated and natural resources
A key issue in setting up a resource-based accounting framework for forests is the consideration of the
boundary between cultivated and natural resources. This distinction is based on the extent to which
there is active management over the growth of the resource (SEEA Central Framework 5.24). The
treatment is explained in Box 4.3.
One outcome of the treatment is that, since the growth of natural timber resources is not considered
production on an ongoing basis, there may be misleading economic signals about changes in a
natural forest. That is, income from over-exploitation is recorded as part of GDP, but the
corresponding depletion of the forest stocks would not be recorded as a cost against income (Lange,
2004). The SEEA Central Framework addresses this issue by defining clearly measures of depletion
of biological resources, including timber, and showing how the cost of depletion can be allocated
against the income of extracting economic units.
Box 4.3 The boundary between cultivated and natural timber resources
The SEEA Central Framework, differentiates cultivated and natural timber resources to enable
alignment with the SNA production boundary. In the SNA a distinction is made in the treatment of
biological resources between those whose growth is relatively highly managed (e.g. livestock and
orchards) and those whose growth has a low level of human inputs. This distinction can also be
applied to timber resources. Note that this treatment does not relate to the tree species or
ecological features of timber resources.
Cultivated timber resources are those grown under management practices that constitute a
process of economic production. These management practices should be significant relative to
the value of timber resources and should be directly connected with the growth of the timber
resources.
Examples of management practices include (i) control of regeneration (seeding, planting of
saplings); and (ii) regular supervision of the trees to remove weeds, attend to pests. It should be
the case that the process of production is one that is classified to forestry activity following ISIC
Division B.
Control over the harvesting is not sufficient to establish that a timber resource is cultivated. If it
were, any legislation controlling the use of virgin forests would be sufficient to cause a designation
of “cultivated”.
Natural timber resources are these that are not under regular management practices.
In the accounts, the growth of cultivated resources is considered to take place within the
production boundary. The growth of the trees is recorded on an ongoing basis as production and,
at the same time, as an increase in inventories/work-in-progress of those enterprises undertaking
the cultivation. Subsequently, when the cultivated timber is harvested/logged a decrease in timber
inventories is recorded together with an equivalent amount of sales.
38
The growth of natural timber resources, in contrast, is not considered to take place within the production boundary. These resources enter the production boundary only at the time the trees
are harvested.
For all biological resources, making the distinction between natural and cultivated resources may
be difficult and conventions may need to be applied. For forestry, because management practices
are likely to vary considerably across and within countries, no general rules for the allocation of
timber resources between these two classes can be determined. On the contrary, the countries
should determine the status of their timber resources based on these above mentioned criteria.
This process generally starts with the delimitation of the production boundary for the different land
classes where the timber resources grow.
Physical resource-based asset accounts
Forest land asset accounts
Physical asset accounts for land (land accounts) describe the area of land and changes in the area of
land over an accounting period. Land accounts can be developed for land use, land cover, or land
ownership classes (i.e. according to ownership by industry or institutional sectors). The concepts of
land cover and land use are separate but interrelated. Sometimes the relationship is clear, such as for
the land cover class crops where the use is agriculture. However, sometimes, the land use and land
cover cannot be inferred from each other. For example, for the land cover of forests, the land use may
be for timber production, for recreation or for maintenance of water supply. With data structured in an
accounting format, it is possible to link land cover to land use, including presenting matrices showing
the changes in land cover and land use over an accounting period.
Land accounts can be constructed for forest and other wooded land. Forest land accounts and timber
resource asset accounts have a different focus but are related since, in most countries, the majority of
timber resources in most countries are found in areas of forest and other wooded land. At the same
time, the scope of the accounts may be different since there are timber resources outside of areas of
forest and other wooded land, and also areas for forest that are not used for timber resources (e.g.
protected areas).
An initial step in compiling accounts is to define the scope of the forest and other wooded land
accounts. A standard approach is to define the forestland classes consistently with the definition in the
FAO Forest Resource Assessment 2010 (see Box 4.1) which are also included in the SEEA Central
Framework.
Table 4.1 presents a physical asset account for forest and other wooded land. It shows the opening
and closing stock by area and by type of forest, and the changes in the stock. Countries can further
divide the forest land classes to distinguish details that are of relevance to the country (such as
conifer/broadleaved/mixed forest land).
There are different additions and reductions in stock that should be recorded following the SEEA
Central Framework (para 5.291-5.294). Afforestation and natural expansion represent additions to the
stock. Afforestation represents an increase in the stock of forest and other wooded land due to either
the establishment of new forest on land that was previously not classified as forestland or as a result
of silvicultural measures such as planting and seeding. Natural expansion is an increase in area
resulting from natural seeding, sprouting, suckering, or layering.
39
Deforestation or natural regression can cause reductions in the stock. Deforestation represents a
decrease in the stock of forest and other wooded land due to the complete loss of tree cover and
transfer of forestland to other uses. Natural regression should be recorded when the stock of forest
and other wooded land reduces for natural reasons.
Table 4.1. Physical asset accounts for the area of forest and other wooded land (hectares)
Type of forest and other wooded land Primary
forest Other naturally regenerated forest
Planted forest Other wooded land
Total
Opening stock of forest and other wooded land Additions to stock Afforestation Natural expansion Total additions to stock Reductions in stock Deforestation Natural regression Total reductions in stock Closing stock of forest and other wooded land Source: SEEA Central Framework Table 5.15.
Timber resources asset account
The timber resources asset account records the volume of timber resources at both the beginning and
end of an accounting period and the change in the stock over the accounting period. A basic structure
of a physical asset account for timber resources is presented in Table 4.2.This structure can be
expanded by countries to increase the informative potential of their accounts, for example by including
information on important species of tree. This general accounting structure can also be used to record
other relevant forest resources such as rubber, game or berries.
In Table 4.2 timber resources are initially classified as either cultivated or natural (see Box 4.2 for
details). To support analysis, natural timber resources are further divided depending on their
availability for wood supply. Timber may not be available to be felled for wood supply due to physical,
economic, or regulatory reasons. The category “not available for wood supply” includes timber in remote areas where logging operations are not economically viable due to physical constraints or long
distances between the forest and the place of use. In addition, timber resources in protected areas
where logging is prohibited, such as National Parks, should be included in this category. This may be
most relevant to understand the significance of protected areas or remote forests.
Timber resources not available for wood supply are within the scope of the resource-based account in
physical terms. However, since these resources have no market value, no monetary values are
recorded in accordance with the valuation principles of the SNA and the SEEA Central Framework.
Timber resources are defined in the SEEA Central Framework following the definition provided by the
FAO Global Forest Resources Assessment 2010 (FRA2010). Timber resources are defined by the
volume of trees, living or dead, and include all trees regardless of diameter, tops of stems,
large branches and dead trees lying on the ground that can still be used for timber or fuel. The
volume should be measured as the stem volume over bark at a minimum breast height from
the ground level or stump height up to the top. (SEEA Central Framework 5.350) If a different
definition is used at country level, countries should make this clear to enable comparisons among
regions. It is also important to maintain the use of a single definition to support time series analysis.
40
Timber resource accounts should also include, where relevant, those resources that are found in
areas not classified as forest land such as orchards or along roadsides.
Table 4.2 The physical asset account for timber resource (cubic metres over bark)
Type of timber resource
Cultivated timber resources
Natural timber resources
Available for wood supply
Not available for wood supply
Opening stock of timber resources Additions to stock Natural growth Reclassifications Total additions to stock Reductions in stock Removals Natural losses Catastrophic losses Reclassifications Total reductions in stock Closing stock of timber resources Source: SEEA Central Framework Table 5.19
The main additions to the stock of timber resources are annual growth and reclassifications. The
SEEA Central Framework refers to the gross increment as annual growth, i.e. the volume of increment
over the period of reference trees with no minimum diameter. It applies to the trees that were already
in the opening stock. Increases in the area of forest, other wooded or other areas of land that lead to
an increase of timber resources are recorded under reclassifications. Also, reclassifications may be due to shifts in the resources already recorded in the opening stock due to changes in the
management practices (for example, moving from natural to cultivated).
The main reductions in the stock are due to removals, losses and reclassifications. Removals are
estimated as the volume of timber resources removed from forestland, other wooded land, and other
land areas during the accounting period. They include removals of trees felled in earlier periods, and
the removal of trees killed or damaged by natural causes. Felling residues arise because, at the time
of felling, a certain volume of timber resources is rotten, damaged, or considered excess in terms of
the size requirements.
Natural losses are the losses to the growing stock (i.e. living, standing trees) during an accounting
period due to mortality from causes other than felling. Examples include losses due to natural
mortality, insect attack, fire, wind throw, or other physical damages. Catastrophic losses represent
exceptional and significant losses due to natural causes. The volume of natural losses and
catastrophic losses should only be recorded against these categories when there is no possibility that
the timber resource can be removed. Countries should decide on the criteria to classify their losses as
either catastrophic or natural.
The monetary resource-based asset accounts
Forest land asset account in monetary terms
The physical asset accounts for forest and other wooded land are part of the general land accounts.
Since the value of land is likely to be most related to its use rather than the land cover it is likely to be
41
necessary to cross classify categories of land cover (particularly tree-covered areas) by categories of
land use. The most common land uses for tree-covered areas are agriculture, forestry, land used for
maintenance and restoration of environmental functions, and land not in use. For the purposes of this
sourcebook we consider that the estimate of the value of agricultural land with tree cover is not in
scope.
Most forest and other wooded land is classified under the land use “forestry”. Some forest and other
wooded land can be subject to protection as defined by IUCN (see Box 4.4). This land should be
classified in the category “Land used for maintenance and restoration of environmental functions”.
Finally, land where there are no clearly visible indications of human activities should be classified as
land not in use. This would be the case where timber resources are not available for wood supply or
there are primary forests which do not supply identified goods or services, i.e. they are subject neither
to management practices nor to legal protection and they do not play any policy-assigned role in
biodiversity preservation or in the protection of human assets.
Box 4.4 SEEA Central Framework Land use classification – Land use for maintenance and
restoration of environmental functions
This class includes protected areas as defined by IUCN, International Union for Conservation of
Nature, i.e., clearly defined geographical spaces, recognized, dedicated and managed, through
legal or other effective means, to achieve the long-term conservation of nature with associated
ecosystem services and cultural values. Protected areas should aim, where appropriate, to:
- Conserve significant landscape features, geomorphology and geology
- Provide regulatory ecosystem services, including buffering against the impacts of climate
change
- Conserve natural and scenic areas of national and international significance for cultural, spiritual
and scientific purposes
- Deliver benefits to resident and local communities consistent with the other objectives of
management
- Deliver recreational benefits consistent with the other objectives of management
- Facilitate low-impact scientific research activities and ecological monitoring related to and
consistent with the values of the protected area
- Use adaptive management strategies to improve management effectiveness and governance
quality over time
- Help to provide educational opportunities (including as regards management approaches)
- Help to develop public support for protection
(Source: SEEA Central Framework appendix 1.B, §1.5)
Changes in the ownership of land between institutional sectors can be detailed if monitoring these
changes is of interest in the country.
Table 4.3 shows the monetary asset accounts for land. The cells in grey show the classes where
forest land is most likely to be recorded. The opening value of the stock of forest land corresponds to
42
the sum of the values of the forest land (by type of land use) at the opening date, using the opening
land prices and land areas in each category. Land values may vary significantly across a country
depending on the accessibility of the land as well as physical and regulatory constraints on their uses.
Most physical changes in forest land concern the reclassification of land uses between agriculture,
forestry, built up and protected areas. Within the reclassification cells, the values given will correspond
to the value of the reclassified pieces of land as estimated at the opening of the stock in the opening
category. Revaluations include the change in value of land between the opening and the closing of the
accounting period that are due solely to changes in price.
Table 4.3 Monetary asset accounts for land (currency units)
Type of land use
Agriculture Forestry
Land used for aquaculture
Use of built up and related areas
Land used for maintenance & restoration of environmental functions
Other uses of land n.e.c.
Land not in use
Inland water
Opening value of stock of land
Additions to stock
Acquisitions of land
Reclassifications
Total additions to stock
Reductions in stock
Disposals of land
Reclassifications
Total reductions in stock
Revaluations
Closing value of stock of land
Source: SEEA Central Framework Table 5.16
Timber resources asset account in monetary terms
The monetary asset account for timber resources, Table 4.4, follows the same structure as the
physical asset account for timber resources. However, timber not available for wood supply is not
included in the monetary asset accounts. That part of the timber resource will not be harvested
because of legal or economic reasons. Therefore, no monetary returns are expected and the value of
timber not available for wood supply equals zero by definition.
The values of the opening and closing stock of timber resources will most commonly be estimated as
the net present value of future flows of income from timber extraction. The estimation of net present
values for timber is discussed further in Chapter 6 and at more length in SEEA Central Framework
section 5.8. Trends in harvest intensity and prices used to estimate the opening and the closing values
will impact on the net present value based estimates.
The valuation of the flows of timber resources should be based on the same prices that underpin the
valuation of the opening and closing stock. The aim is to measure the changes in the stock, in situ, i.e.
before extraction.
43
Catastrophic losses require a particular treatment since the resource might be only partly impacted.
The remaining value of the trees salvaged after storms (deducting the possible losses in quality)
should be accounted for in removals if removed. Similarly, the catastrophic losses only include the
reduction in value of trees that have died after an event such as fire.
Changes in the monetary asset are not only related to physical fluxes of timber resources, but also to
changes in present value of each unit of these resources, including changes in prices and in the
structure and composition of the resource. The changes are reflected as Reclassifications or
Revaluations.
Table 4.4 Monetary asset account for timber resources (currency units)
Type of timber resources
Cultivated timber resources
Natural timber resources Available for wood supply
Opening stock of timber resources
Additions to stock
Natural growth reclassifications Total additions to stock Reductions in stock Removals Natural losses
Catastrophic losses
reclassifications Total reductions in stock
Closing stock of timber resources
Source: SEEA Central Framework Table 5.20
Flow accounts in the resource based approach
Physical flow accounts
Forest resources can be recorded in physical flow accounts as materials (e.g. timber, NTFP) or
measured in terms of natural inputs of energy (i.e. fuelwood) – see for example SEEA Central
Framework Table 3.5. The resource-based flow accounts are aligned with the production boundary of
the SNA.
Supply and use tables (SUT), Table 4.5 show the origin of different forest products, the processing of
raw forest products into other products such as sawnwood and firewood, and the use of each product
by different industries in the economy as well as final users (households, government, capital
formation and exports). From these tables, commodity balances for forest products may be
constructed, as well as input-output (IO) tables and social accounting matrices (SAM) in which the
production of forest products is represented in physical terms (Lange 2004). Such tables can be
expanded to include other forest resources.
44
Table 4.5 Physical supply and use tables for wood products
Monetary flow accounts
Monetary supply–use tables record all flows of products in an economy between different economic
units in monetary terms. They describe the structure of an economy and the level of economic activity.
These tables are already in the SNA and forest products can be tracked within them although it may
be necessary to disaggregate the standard classifications of products to provide the appropriate level
of detail.
As shown in Table 4.6, which presents a stylised monetary supply and use table, these flows are
classified by type of product in the rows and by type of economic unit (enterprises, households,
government) and the rest of the world in the columns. Enterprises are classified to industries based on
their principal activity. An exception to this is the column titled “Accumulation”. Accumulation flows are
recorded separately since, while they concern supply in the current accounting period, they are not
used in the current period and instead accumulate for future use or sale by economic units and the
rest of the world – either in the form of inventories or in the form of fixed assets.
45
Table 4.6 Basic structure of a monetary supply and use table
Industries Households Government Accumulation Rest of the
world
Total
Supply table
Products Output Imports Total supply
Use table
Products Intermediate consumption
Household final consumption expenditure
Government final consumption expenditure
Gross capital formation (incl. changes in inventories)
Exports Total use
Value added
Note: dark grey cells are null by definition
Source: SEEA Central Framework Table 2.1
4.4 Forest accounts in the ecosystem-based approach
In the ecosystem based approach of the SEEA EEA ecosystem assets are represented in terms of
spatial areas that contain a combination of biotic and abiotic components and other characteristics that
function together (SEEA EEA 4.1). Forests ecosystems can therefore be considered ecosystem
assets.
Strictly ecosystems cannot be defined in terms of mutually exclusive spatial areas. However, for
accounting purposes there must be clear boundaries for ecosystems such that all ecosystems across
a country can be covered without gaps or overlaps.
In response to the accounting need for spatial units the SEEA EEA and subsequent advice has
developed a “units model” that describes three different but connected types of spatial area that are
relevant for accounting purposes. At the lowest level is the Basic Spatial Unit (BSU) which is most
commonly considered a small grid square (ideally between 10m2 and 100m2). Each BSU will have
some particular characteristics including slope, altitude, vegetation, etc.
Groupings of similar, contiguous BSU form an Ecosystem Unit (EU)10. Depending on the number of
characteristics taken into account there will be small or large numbers of different types of EU. One
possibility is that only land cover is taken into account. Then, at a high level, there may be around 15
types of EU including, for example, tree-covered areas. Conceptually, individual EU are likely to
represent the statistical approximation to ecosystems as commonly conceived.
For accounting and analytical purposes, it will be most common to record information about
geographical aggregations11 which are relatively large areas about which there is an interest in
recording, understanding and managing changes over time. Geographical aggregations should take
into account administrative boundaries, environmental management areas, large scale natural
features (e.g. river basins), and other relevant factors (e.g. protected areas). Defining geographical
10 In the SEEA EEA, EU had been termed Land Cover/Ecosystem Functional Units (LCEU) 11 In the SEEA EEA, geographical aggregations had been labeled Ecosystem Accounting Units (EAU).
46
aggregations for accounting purposes will also entail considering those aspects that will play a role in
the way flows of ecosystem services are provided.
For forest ecosystem accounting purposes, delineation of EU that may be considered forests, is an
important first step. Once these units are defined, they can be the focus of accounting in terms of
understanding their condition, their extent (total area) and the flows of ecosystem services they
provide. Importantly, the forest EU can be considered in relation to broader areas, such as river
basins, administrative areas, or the country as a whole. Note that, as appropriate, forest EUs can be
aggregated to obtain, for example, the total area of forests.
The physical accounts for ecosystem assets
Ecosystem condition and extent
Once the forest EUs are defined, we can proceed with their measurement for accounting purposes.
The assessment of ecosystem assets encompasses measurement of two key concepts:
1. Ecosystem extent, mainly related to the area and location of ecosystems
2. Ecosystem condition, involving measurement of key characteristics by selecting indicators of
each characteristic
The measurement of ecosystem extent is an extension of the approach to accounting for forest land.
For the measurement of ecosystem condition, the approach followed in ecosystem accounting does
not require users to measure every possible aspect of condition, but rather to identify the most
relevant characteristics of ecosystem assets to provide aggregated information on the condition of an
ecosystem and changes in that condition. This approach involves:
i) A description of ecosystem assets in terms of relevant characteristics
ii) An assessment of each characteristic in the context of the ecosystem as a whole, and to
identify relevant indicators for each characteristic
In the selection of relevant characteristics it will be relevant to consider the set (or basket) of
ecosystem services that are supplied by the ecosystem asset. In effect the condition of the ecosystem
should be assessed taking into consideration its use.
Assessing changes in ecosystem assets: degradation, conversion and
enhancement
Three major changes can take place related to ecosystem assets: degradation, conversions and
enhancement. Degradation of a forest ecosystem covers only declines in ecosystem condition due to
economic and other human activity and excludes changes due to natural influences (e.g. such as
storms) and reductions in ecosystem service flow that are not due to changes in ecosystem conditions
(reduced flow of timber due to a reduction in logging activities).
When the extent or composition of the ecosystem changes significantly or irreversibly, the change is
referred to as ecosystem conversion. Different perspectives exist for measuring conversion, which are
discussed in more detail in SEE EEA 4.32 to 4.35.
Ecosystem enhancement is the increase and/or improvement in an ecosystem due to economic and
other human activity and beyond activities that may simply maintain an ecosystem asset.
47
The ecosystem extent and condition accounts
There are two primary physical accounts for the measurement of ecosystem assets: the ecosystem
extent account and the ecosystem condition account. At a national level it is likely to be of interest to
compile an ecosystem extent account which covers all areas within a country and accounts for
changes in the mix of different EU types. The structure of this type of account is shown in Table 4.7.
The types of EU shown in Table 4.7 are at a high level of land cover type following the interim
classification of land cover in the SEEA Central Framework. For tree-covered areas, class 6,
additional detail on different types of forest may be added as appropriate. Note that the ecosystem
extent account should build on the forest land physical asset account.
Ecosystem condition accounts may be structured following Table 4.8. Here a selection of
characteristics has been made but this should be reviewed and considered specifically for forests in
each country. Additional characteristics and indicators are likely to be appropriate.
At a national level, it is likely to be relevant to measure the condition of different forest EUs and hence
compare the condition of forests in different locations. Alternatively a structure that takes into account
different types of forests, for example by altitude or species, may be of interest.
Accounts that assess ecosystem condition may benefit from using information from the resource-
based accounts for individual environmental assets as these contain basic information for specific
quantitative characteristics such as timber resources.
48
Table 4.8 Measures of ecosystem condition and extent at end of accounting period.
Ecosystem extent
Characteristics of ecosystem condition Vegetation Biodiversity Soil Water Carbon Type of EU Area Indicators
(e.g. biomass)
(e.g. species richness)
Indicators (e.g. organic matter content)
Indicators (e.g. water quality)
Indicators (e.g. net carbon balance)
Forest ecosystem units:
Broadleaved upland forest
Conifer upland forest
Conifer low land forest
Mixed upland forest
Flow accounts in the ecosystem based approach
Ecosystem services are a central concept to connect characteristics of ecosystem assets with the
benefits received from ecosystems by people through economic and other human activity. The flow
accounts in the ecosystem-based approach encompass the measurement of ecosystem services that
reflect flows of materials and energy, services related to the regulation of an ecosystem, and flows
related to cultural services (SEEA EEA 3.2).
To measure the flows of these ecosystem services, three broad categories of ecosystem services are
considered:
i. Provisioning services reflect material and energy contributions generated by or in an
ecosystem for example timber, game, berries, or fodder.
ii. Regulating services result from the capacity of ecosystems to regulate climate, hydrological
and bio-chemical cycles, earth surface processes, and a variety of biological processes.
These services often have an important spatial aspect. For instance, the flood control service
of an upper watershed forest is only relevant in the flood zone downstream of the forest.
iii. Cultural services are generated from the physical settings, locations, or situations which
lead to intellectual and symbolic benefits that people obtain from ecosystems through
recreation, knowledge development, relaxation, and spiritual reflection.
The Common International Classification of Ecosystem Services (CICES) provides additional detail
within these broad groups (see SEEA EEA table 3.1).
Commonly, ecosystem services are conceptualized in terms of the types of benefits to which they
contribute. The ecosystem-based approach enables users to identify a spectrum of benefits, ranging
from the market benefits, the quasi-market benefits, and the non-market benefits. Ecosystem services
contribute to the generation of all of these types of benefits.
49
Physical accounts for ecosystem services
The physical accounts of ecosystem services organizes the information on the supply and use of
ecosystem services by type of service, by ecosystem asset, and by economic units involved in
generating and using the various services (SEEA EEA 3.51):
• Provisioning services will generally be measured in units, which will reflect the relevant
physical properties of the underlying input such as tonnes or cubic metres of timber. All
measures should reflect the total flows of the ecosystem service over an accounting period,
usually one year.
• Regulating services will also be measured in a variety of units. For example, the service of
carbon sequestration would normally be measured in terms of tonnes of carbon sequestered.
• Cultural services are likely to be measured in units related to the people interacting with the ecosystem and using the ecosystem service (e.g. number of people visiting a site or the time
spent using the service).
Chapter 5 of this sourcebook shows examples of suitable indicators for the measurement of the
ecosystem services provided by forest ecosystems. Annex 4.1 shows some examples of
measurement approaches for the different types of services based on examples provided in the SEEA
EEA. Although the initial approach to assess the overall ecosystem should recognize the bundle of
ecosystem services supplied, a decomposition will need to be adopted to measure these services. A
useful starting point for the measurement of individual ecosystem services is likely to be at the level of
the EU.
Table 4.9 Physical flow of the supply of ecosystem services for different forest EU
Type of Forest
Broadleaved upland forest
Conifer upland forest
Conifer low land forest
Mixed upland forest
Type of ecosystem services (by CICES)
Provisioning services e.g. tonnes of timber
Regulating services e.g. tonnes of CO2
sequestered
Cultural services e.g. number of visitors/hikers
Following the supply use identity that operates in the flow accounts, the total generation of a single
ecosystem service should equal the total use of that service. However, because the ecosystem
approach is area-based, it is likely that the use (consumption) of services generated within a single
EU, may not take place within the same EU. Therefore, similar to the supply and use tables in the
resource-based approach, the supply and use of ecosystem services can be attributed to the different
types of ecosystem units. Table 4.10 illustrates how these transactions can be reflected.
50
Table 4.10 Supply and use of ecosystem services for a geographical aggregation
Supply of ecosystem services Use of ecosystem services
Enterprises
Households
Government
Rest of the world
Total Enterprises
Households
Government
Rest of the world
Total
Type of ecosystem
services (by CICES)
Provisioning services
Regulating services
Cultural services
Monetary flows
The estimation of the value of ecosystem services and ecosystem assets in monetary terms is
complex. In a purely accounting context, the complexity exists because generally, ecosystem services
and ecosystem assets are not traded in markets in the same way as other goods, services, and
assets. Valuation therefore involves the estimation of “missing prices” or the identification of prices
that are implicitly embedded in values of marketed goods and services. These aspects are further
developed in the Chapter 6 of this sourcebook.
One way of bringing this information together is to create combined presentations that combine
measures in physical terms for ecosystem services and ecosystem assets with standard economic
measures such as value added, income, and employment.
A second way of considering ecosystem accounting in monetary terms is to bring together valuations
of stocks and flows of ecosystem assets into an ecosystem asset account following the standard asset
account structure outlined in the SEEA Central Framework.
A third approach is to use valuations of ecosystem services and ecosystem assets in monetary terms
to augment the standard national accounts and aggregates. The motivations underpinning this
approach are that it may be beneficial to provide information on economic and other human activity
that take place outside the market and/or is not recorded in the standard economic measures of
production, consumption, income and wealth. Chapter 6 of this sourcebook provides a description of
approaches for the valuation of ecosystem services and ecosystem assets.
The ecosystem monetary asset account
The ecosystem monetary asset account follows the structure of the monetary asset accounts
described in the resource-based framework. However, this framework has to be broadened as in the resource-based approach only the provisioning services of timber resources are accounted for.
51
Therefore, the application of such a framework in an ecosystem asset framework requires that the
values of all ecosystem service flows are interpreted as analogous to income flows.
The basic structure of an ecosystem asset account is shown in Table 4.11. Since the estimates are
compiled in monetary terms, in theory, estimates for different ecosystem assets can be summed to
provide higher level aggregates. Given the potential for aggregation, it may be more practical to
consider the development of asset accounts for particular EUs and then form geographical
aggregations.
Table 4.11 Monetary ecosystem asset account
EU type Total area
Opening stock of ecosystem assets
Additions to stock
Regeneration - natural
Regeneration – through human activity
Reclassifications
Total additions to stock
Reductions in stock
Reductions due to extraction and harvest
Reductions due to ongoing human activity
Catastrophic losses due to human activity
Reductions due to natural events
Reclassifications
Revaluations
Closing stock of ecosystem assets
4.5 Environmental activity accounts and related flows
These accounts present transactions in monetary terms that are already recorded in the SNA but that
cannot be easily identified due to the structure of the accounts. The types of transactions recorded in
these accounts are:
• Transactions concerning activities undertaken to protect the environment that also can include
resource management activities
• Transactions such as taxes and subsidies that reflect efforts by governments to influence
behavior of producers and consumers with respect to the environment.
This information can be used to help assess whether economic resources are being used effectively to
reduce pressures on the environment and to also allow for different policies to be compared and
contrasted.
52
Environmental activities: scope and definition
The scope of environmental activities covers the economic activities whose primary purpose is to
reduce or eliminate pressures on the environment or to efficiently use natural resources. The various
activities are grouped into two broad types of environmental activity listed according to the
Classification of Environmental Activities (CEA) (SEEA Central Framework section 4.2.2):
1. Environmental protection activities are those activities whose primary purpose is the
prevention, reduction and elimination of pollution and other forms of degradation of the
environment the protection of biodiversity and landscapes, including their ecological functions;
monitoring of the quality of the natural environment (air, water, soil, groundwater); research
and development on environmental protection; and the general administration, training and
teaching activities oriented towards environmental protection.
2. Resource management activities are those activities whose primary purpose is preserving and
maintaining the stock of natural resources and hence safeguarding against depletion restoring
natural resource stocks (increases or recharges of natural resource stocks); the general
management of natural resources (including monitoring, control, surveillance and data
collection); and the production of goods and services used to manage or conserve natural
resources.
Beyond these environmental activities, two broad economic activities related to the environment can
also be analyzed. These activities are not considered environmental in the SEEA, due to the specific
and direct effect of their production processes on the environment. However, these activities may be
of particular interest in the assessment of environmental impacts and the development of
environmental policy. The two activities are
1. Natural resource use activities involve the extraction, harvesting, and abstraction of natural
resources and activities.
2. Activities associated with the minimization of the impact of natural hazards on the economy
and society. Activities such as provisioning for fighting the effects of forest fires would be
recorded in this section.
Environmental activity accounts and statistics
Two different sets of information can be compiled to provide information on environmental activities:
• Statistics on the Environmental Goods and Services Sector (EGSS)
The EPEA follows the accounting principles of the SNA. It is composed of a set of four tables that
show, from a demand perspective, the various expenditures undertaken by economic units for
environmental protection purposes. It can be used to analyze the extent of environmental protection
activities and to assess how expenditure on environmental protection is financed.
The EGSS considers environmental activities from a supply perspective and EGSS statistics present
information on the production of environmental goods and services in as much detail as possible. It
encompasses all products that are produced, designed, and manufactured for purposes of
environmental protection and resource management. The EGSS statistics show each type of output
of environmental goods and services, classified according to the CEA classification and linked to its
specific producer.
53
Although it has not been sufficiently developed, in principle it is possible to elaborate a resource
management expenditure account for specific resources, such as timber. Resource management
expenditure accounts, as for EPEA, would comprise accounts showing the production and the supply
and use of resource management specific services, as well as national expenditure on resource
management.
Finally, the flow of environmental taxes and subsidies may be of particular interest to analyze the role
of government in the interactions between the economy and forests. Although these transactions are
already recorded in the national accounts framework, they are not generally separately identified as
relating to the environment.
More information on these accounts and statistics may be found in Chapter 4 of SEEA Central
Framework.
4.6 Challenges
Challenges related to the informational status
To adopt ecosystem based accounting approaches countries will need to establish the relationship
between ecosystem condition and extent, and the capacity to supply ecosystem services for the
ecosystems in their countries. At present there is incomplete knowledge of the relationships between
ecosystem extent and condition and future flows of ecosystem services, although it is an active area of
ecological research. (SEEA EEA 2.34). Further there is the challenge of applying consistent valuation
techniques and the need to manage the involvement of multidisciplinary expertise.
Consequently, compiling basic resource accounts may provide a useful starting point for compilers. A
number of basic resource accounts that are fundamental to ecosystem accounting will typically need
to be developed. These include: land accounts, carbon accounts, and resource-based forest accounts.
A useful step for policy purposes would also be clearly defining the scope of resource management
activities in order to establish a resource management account for forests.
Longer term, the objective should be to develop a standard base of information on forest land, status
of forest ecosystems and flows of forest resources. As well, since the resource-based approach does
not value, in monetary units, those ecosystem services outside of the standard national accounts
boundary of production and income (i.e. primarily timber resources from forests), a longer term
objective should be valuing other forest ecosystem services in monetary units would allow
governments to highlight the importance of these flows and the broader importance of forests beyond
the harvesting of timber.
On the research agenda, it must be recognised that defining the depletion of forest related resources
is not straightforward and the conceptualization and measurement of this accounting term needs
further research and application.
Challenges related to the institutional efforts
Placing forest accounting, especially forest ecosystem accounting, firmly within the scope of national
accounting, requires many disciplines to consider measurement in new ways. For ecologists, it
requires creating clear distinctions between ecosystem assets and service flows within an ecosystem
and to differentiate between those aspects of ecosystems that provide direct benefits to economic and
other human activity and those aspects of ecosystems that, effectively, support the provision of these
54
benefits. For national accountants it requires broadening the production boundary and considering
alternative approaches to valuation. Engaging in the discussion of these topics between these and
other disciplines will be essential to making progress in this area.
55
Annex 4.1 Measurement approaches for ecosystem services
Measurement approaches for provisioning services
Provisioning services: provision of wood and non-timber forest products
A forest ecosystem from which wood and non-timber forest products are obtained is shown.
For logging or for extraction other forest products, such as cork or berries, a number of inputs are
required (e.g. labour, machinery, fuel). The product (benefit) resulting from the logging activity is
logged wood, with felling residues returned to the ecosystem. In this case, both the benefit (logged
wood or extracted cork, for example) and the ecosystem services (timber and cork) can be measured
in terms of kg/hectare/year. The difference between the two is that the ecosystem service represents
wood or cork at the moment immediately before it is felled/extracted, whereas the benefit arises
immediately after felling/extraction.
56
Measurement approaches for regulating services
Regulating services: sequestering of carbon and carbon storage
Often, the services of carbon sequestration and carbon storage are labelled by the single term “carbon
sequestration”. However, they are quite different ecosystem services, albeit linked within the broader
carbon cycle:
1. The service of the sequestering of carbon is equal to the net accumulation of carbon in an
ecosystem due to growth of the vegetation and due to accumulation in below ground carbon
reservoirs.
2. The ecosystem service of carbon storage is the avoided flow of carbon resulting from
maintaining the stock of above ground and below ground carbon sequestered in the
ecosystem. Therefore, the avoided emissions may be calculated. Under this approach, the
avoided emissions only relate to the part of the stored carbon that is at clear risk of being
released in the short term due to land use changes, natural processes (e.g. fire), or other
factors.
The conceptual model of the ecosystem service as a function of ecosystem state and enabling factors
is presented. Enabling factors is the term used to describe the context without which the ecosystem
service would not be delivered. In this case, the service of carbon sequestration arises due to the
presence of climate change and the increase in GHG emissions. Ecosystem management will
generally affect the net sequestration and/or the storage of carbon in the soil.
57
Measurement approaches for cultural services
Cultural services: tourism and recreation
Forest ecosystems provide an opportunity for tourism and recreation. The service usually involves
some degree of investment in the ecosystem. In physical terms, this ecosystem service can be
measured in terms of the number of people visiting the ecosystem. The benefits accrue to visitors
themselves, and to nearby suppliers of tourism and recreational facilities to the extent that they can
attribute their operation to the ecosystem. Physical measurement of the ecosystem involves recording
the number of visitors, in terms of visitor-days, or overnight stays, to ecosystems. As in the case of
provisioning services, the use of ecosystem services in tourism requires that a specific activity be
undertaken (i.e. the recreation activities by people in an ecosystem).
58
5. Compiling physical accounts for forests
5.1 Background
The structure of the physical accounts for forests was described in Chapter 4. This chapter highlights
the methodological aspects and alternative data sources that might be useful when compiling forest
accounts in physical terms.
The context in which different countries or regions decide to compile forest accounts can vary
significantly. The variances can be the result of data availability, frequency of data acquisition, and
access to pertinent datasets. As a result, this chapter focuses on describing general indicators of
forest stocks and flows, and proposing a number of potential data sources to track these indicators.
The final compilation will depend very much on the priorities of each country or region, data
availability, and the choice of meaningful indicators with ecological, societal and policy relevance.
This chapter is divided into three main sections. Section 5.2 presents an overview of possible data
sources for the compilation of physical forest accounts. Sections 5.3 and 5.4 propose a series of
generic indicators to be taken as pathways to compile the asset and flow accounts. In addition, ways
to process the data are described with the goal of populating the accounting core tables. Section 5.5
briefly outlines some measurement challenges.
5.2 Data sources
This section presents an overview of data sources for forests and forest resources that are relevant for
compiling forest accounts. Each data source has various areas of focus and hence a complete
coverage of information is not possible from one source. A key aim of the accounting frameworks
presented in this Sourcebook is to describe the means by which these various data sources can be
integrated.
The relevance of each data source will vary depending on the specific situation of a country or region.
It is beyond the scope of the chapter to have a complete set of indicators, and the final set of chosen
indicators and data sources will depend on the local conditions of important ecosystem services, data
availability, and linkages between forests and the economy as a whole. For this chapter, seven
categories of data sources are explained:
1. Forest inventories and forest statistics (including FAO forest resource assessment (FRA) and
other FAOSTAT statistics)
2. Spaceborne remote sensing
3. Airborne remote sensing
4. Spatial datasets for land cover and land use
5. Forestry production and income statistics from the national accounts
6. Non-forest statistics
7. Other spatio-temporal datasets
59
Forest inventories and forest statistics
The primary source of quantitative information for forest areas (stands) are forest inventories as well
as the dedicated collection of forestry statistics. Forest inventories are based on statistical sampling
over forest stands grouped in homogeneous strata. They are implemented at different levels of detail
and can be designed to assess forest resources at different scales: forest unit, municipal, regional,
national or supranational level.
In addition to forest inventories, data collected on a continuous basis by national forest authorities can
also aid in the compilation of forest accounts. The mandate of forest authorities normally includes
keeping track of management activities (e.g. thinning, harvesting) as well as data on afforestation,
reforestation, and land use change. Other institutions including research institutions, forester
associations, environmental organizations, and commercial forest companies may maintain valuable
datasets and could be questioned regarding specific forest-related topics in case inventories or official
forest statistics are not complete or up-to-date.
The Food and Agriculture Organization (FAO) provides an important source of forest data,
summarizing available national level data. Forest data from the entire world at a country level are
gathered by the FAO forestry department. These datasets are made public through the FAOSTAT
portal. The FAOSTAT database comprises a series of variables related to forestry production and
forestry trade flows.
Additionally, the FAO issues a Forest Resources Assessment (FRA) report every 5 years
(www.fao.org/forestry/fra/en/). The data in the FRA originate from country reports and remote sensing
and contain data on forest land, timber, employment, and other forest-related topics.
Notwithstanding the suitability of forest inventories data for constructing the asset accounts, some
drawbacks can be identified. The frequency with which forest inventories are conducted and the area
inventoried may not match the envisioned accounting period or the geographical coverage. When the
focus is on timber or other tree resources, conventional forest inventories may fail to include the stock
of trees outside the forest.
Also, the nation-wide nature of the information included in FRA may not be detailed enough to support
specific policy applications, which is an important goal of forest accounting. In this respect, the data
from inventories might be combined with routinely gathered forest statistics by the national forest
service and forester associations. New data are constantly added to those datasets and can be useful
in tracking changes in stock. Moreover, the national accounts and commercial statistics can be
queried to derive the volume of harvested and traded timber.
Spaceborne remote sensing
Developments in spaceborne remote sensing (RS) have been greatly motivated by the need to
monitor natural resources. Early missions like the Landsat-1 and the AVHRR sensor onboard the
NOAA satellites were pioneers in the use of earth observation for environmental applications.
Spaceborne RS is possible because of the reflective properties of vegetation. Spaceborne RS
measures energy interacting with objects on the earth’s surface. Sensors on satellite platforms are
able to capture energy reflected by objects on earth in certain electromagnetic regions. Due to growing
interest in monitoring vegetation from space, several satellite platforms have sensors that are able to
capture the distinctive reflective properties of vegetation. That is important for forest accounting as the
main concern will be the quantification of vegetative systems. Figure 5.1 illustrates the typical
reflectance pattern of vegetation over a segment of the electromagnetic spectrum encompassing the
60
visible (represented with blue, green and red background), near-infrared (pink background) and short-
wave infrared (light-blue) regions. Figure 5.1 shows the reflectance pattern of green healthy vegetation
and dry vegetation.
Figure 5.1: Typical reflectance pattern of vegetation
Source:??
The developments in spaceborne RS are ongoing and have seen a surge in applications because of
increases in computational power and the need for addressing environmental challenges at a global
level. Spaceborne RS can be an important data source for forest accounting because it is likely to be
an efficient data collection mechanism, especially for countries with large forested areas such as
Canada, USA, Brazil and Russia. Three particular features of spaceborne RS stand out:
a. Georeferencing: One can think of forests as spatial entities. Many of the environmental
services provided by forests are related to the forest’s position in respect to other landscape
elements (urban areas, floodplains, agriculture areas, steep slopes, etc). Data from RS are
related to specific locations on earth according to a particular geographical projection. One
can therefore combine remote sensing imagery with other spatial datasets when quantifying
forest resources within the administrative or water catchment boundaries, localizing the
provision of ecosystem services or implementing modeling schemes.
b. Spatial and temporal resolution: One of the most appealing factors of remote sensing is the
pace at which images are generated and the increasing spatial resolution of the products. The
Terra and Aqua satellites (carrying the MODIS sensor) visit every point on earth every day or
every second day and Landsat covers the earth in 16 days. Terra and Aqua satellites deliver products with 250, 500 and 1000m, while Landsat produces pixels of 30m. Considering the
spatial and temporal resolution, the selection of RS products often presents a tradeoff in that
high spatial resolution accompanies low temporal resolution and vice versa.
c. Affordability: In addition to the suitability of the technical aspects of RS for studying vegetation,
it is also relatively inexpensive to access RS data. High resolution data or on-demand
61
delivered data offer valuable information that serve specific purposes but may not be
affordable for projects with budget constraints. Fortunately, an increasing number of RS
datasets are offered free of charge by public institutions. Some of the most common RS data
sources for vegetation studies are listed in Table 5.1. In addition to the growing access to RS
data sources it is important to mention that software options for managing geographic
information has been growing as well. In particular, free and open source options are
becoming more available (10).
Table 5.1: Commonly used spaceborne RS data sources for vegetation studies
Platform/sensor Features More information
Early Landsat missions http://landsat.usgs.gov
Landsat ETM+ Resolution:120 m for thermal infrared band and 30 m for multispectral bands. Each scene
covers an area of 185 x 185 km. Temporal resolution is 16 days.
http://landsat.usgs.gov
Landsat 8 Launched in 2013 http://landsat.usgs.gov
SPOT-Vegetation Resolution: 1 km. Launched in 1998; specially meant for monitoring vegetation globally
http:/vito-eodata.be
http://www.gmes-geoland.info/
PROBA-V Resolution: 300 m. Launched in 2013. Follow-up mission of SPOT-Vgt
http:/vito-eodata.be
MODIS Resolution: 250-500-1000 m. Multispectral sensor onboard Terra (from 2000 to present) and Aqua (from 2002 to present)
https:/lpdaac.usgs.gov
AVHRR 1-km ground sampling distance with multispectral data. Onboard the NOAA satellite series. (1980 to present)
http://edc2.usgs.gov/1KM/avhrr_sensor.php
IKONOS Commercial satellite deliering high resolution imagery: 1m (panchromatic) and 4 m (multispectral bands)
http://www.digitalglobe.com
QuickBird High resolution imagery (2.4 – 0.6 m) and panchromatic and multispectral imagery from a constellation of aircrafts.
http://www.digitalglobe.com
ASTER Spatial resolution: 15-90 with 14 spectral bands. Onboard the Terra satellite. Data from 2000 to present
http://asterweb.jpl.nasa.gov/data.asp
Hyperion Spatial resolution: 30m. Hyperspectral images with 220 bands ranging from visible to short wave infrared;
http://eo1.usgs.gov/sensors/hyperion
Sentinel-2 Not yet launched. European Spatial Agency. 10, 20, 40 m. Temporal resolution: 5 days
Forest accounts do not record sub-annual changes and, in this sense preference greater accuracy in
data collection. Therefore, one may select remote sensing products offering high spatial resolution. In
this respect, Landsat imagery represents an interesting option. The large area coverage (about 185 x
185km), the spectral information, and the spatial resolution of Landsat images have been regarded as
most suitable for operational use combined with forest inventory plots (12). However, a moderate to
high temporal resolution may be required for certain measurements in forest accounting. In particular,
estimation requiring the analysis of time series will require higher temporal resolution. For example,
the assessment of trends in forest ecosystem productivity by means of time series of RS-derived
biophysical parameters, or the segmentation of vegetative areas by function of phenology, should
have a temporal resolution of ??
Airborne remote sensing
Airborne remote sensing (RS) has a long history in forest measurement. Aerial photographs and
photogrammetric techniques are part of the conventional toolkit of forest surveyors. Optimal use of
aerial photos takes place when the flight campaign has been designed such that there is overlap
between two consecutive aerial photos and between adjacent flight lines. This feature makes
interpretation of photos with stereoscopic views (3D) possible. Stereoscopy eases the stratification of
forest by function of species, ages, density, or other useful criteria as well as the classification of forest
stands by function or location with respect to topographic features (valleys, hill tops, slopes, aspect,
etc). The scale may allow the derivation of mathematical relations between tree crown and standing
timber volume, the estimation of tree heights, and other variables of interest.
The spectral resolution of traditional aerial photos covers the visible region and, sometimes, the
infrared region. These photos can be produced in gray tones, real color, or false color. The
possibilities have expanded significantly in recent years as new sensors have been developed and the
incorporation of those innovations in forest measurement is evolving at a fast rate.
Other developments relating to forest measurement include airborne hyperspectral remote sensing,
Light Detection and Ranging (LiDAR) and unmanned-airborne-vehicles. LiDAR systems measure the
distance between objects on Earth’s surface and the sensor. The distance measurement is based on
recording the time interval between the emission of a laser pulse and its reflected return signal. The
application of this technology in forest measurement has evolved substantially from the early studies
in the 1990s(6). Data from LiDAR systems can be used for segmenting the forest into height and age
classes, ecologic succession phases, density, crown characteristics, etc.
Spatial datasets for land cover and land use
Spatial datasets for land cover and land use provide information on the location and extent of land
cover types and land uses at country or region level. Commonly, the information is presented in the
form of maps. A number of aspects can be highlighted with regard to the relevance of land cover maps
for forest accounting.
First, a land cover map is a basic source of information from which the location and dimensions of
forested land can be obtained. This meets the requirement of accounting for the surface covered by
wooded land and forest, which is an important aspect of physical accounts.
63
Second, in contrast to national level estimates, land cover maps allow the derivation of the spatial
distribution of ecosystem services related to specific forest ecosystems. This is a fundamental input
towards the quantification and understanding of linkages between forest resources and economy.
Third, the classification system used to partition the surface into land use and land cover regimes
indicates the classes that are relevant in the local context. Although global classification systems have
been defined (FAO, CORINE, Globcover, etc.), forest accounting may favor the use of locally defined
classification systems as they may reflect the forest categorization that is most relevant for ecological,
management, and policy considerations at a local level. However, where local classification systems
are used it is highly recommended to embed or concord these classifications with international
systems to support cross country comparisons and global reporting.
While the potential to develop spatial datasets and maps is significant and likely of great value in
forest accounting, it is important to understand that these data are a two dimensional representation of
a three dimensional real world. The translation of data from three to two dimensions requires a range
of assumptions and the application of modeling techniques. Further testing is needed to consider
which assumptions and models are most appropriate for forest accounting, particular in relation to
comparisons across different areas and ecosystem types and over time.
Forestry production and income statistics from the national accounts
Various forest products are part of the intermediate or final consumption of many economic activities
and many products are part of the final consumption by households. These important flows are
recorded in the national accounts. Therefore, a country’s national accounts constitute an important
data source for information on flows of forest goods to the different economic sectors. The information
in the national accounts can also be the basis for a regional analysis of flows of forest goods and
services. If data on the spatial distribution and size of companies are available, the demand of
companies for forest goods and companies can be tracked to the different forest ecosystems across
the country or region under consideration.
Non-forest statistics
There is a large and varied set of data sources that can support the elaboration of forest physical
accounts. Some examples are:
• Livelihood and household surveys: rural populations demand goods and services that are
related to both forests and trees outside forests. For trees outside forests the demand for
timber, firewood, hunting resources and other supplies is typically not considered in forest
inventories or forest surveys. This kind of connection between humans and ecosystems are
more likely registered in surveys addressing livelihood-related issues.
<< Insert Box 5.1 giving example of country livelihood survey or equivalent with information on forest
incomes etc. – possibly Vietnam>>
• Economic statistics: Although many forest products are part of the national accounts, detailed
information on forest products regarding pricing, origin, trade, losses, etc. may be registered in
different levels of detail by other potential data providers. For instance, entrepreneurs
organizations, trade unions, etc.
• Air pollution, water budget, and water quality statistics: Air pollutants may damage forest
foliage. In accounting for forest health, records on exposure of forest areas to air pollutants
64
are important. Data on stream and river discharge and indicators of water quality can also be
relevant for forest accounting as the regulation of water cycle is an important environmental
service related to forest cover.
• Tourism and recreation statistics: It is common for forests to be places for tourism and
recreation. Information on visitation rates to forests, particularly to national parks, are
commonly compiled, and often studies are undertaken assessing the economic contribution of
tourism to areas in which forests are located. Separately, studies may also be completed on
the health benefits to populations from forests in terms of both physical health (clean air,
water, etc) and mental well-being. Spiritual and cultural connections to forests may also be
areas of interest for measurement.
• Agriculture and livestock statistics: Various forest ecosystem services are related to
agriculture production. For instance, improving livelihoods by implementing agro-forestry
schemes or grazing in silvo-pastoral systems are important in many countries. Data on these
services are likely to be found in agriculture or livestock statistics.
Other spatio-temporal datasets
The nature and magnitude of the ecosystem services provided by forests is greatly determined by
their geographical location with respect to (i) other landscape elements and topographical features
and (ii) the spatio-temporal context in which they exist. Both of these factors will have considerable
impact on the assessment of the relative importance of forests and associated valuations of forests.
The existence of geo-referenced datasets on human settlements, topographic features, soil types, and
other relevant variables are basic requirements for understanding and describing the condition of
forests and assessing the flow of ecosystem services to the economy. Since several variables defining
the flow of ecosystem services can be highly variable over time, the dynamic character of several
determinants of ecosystem services should be accounted for.
In ecosystem management and the definition of rights over forest goods and services, natural
boundaries are often subject to administrative borders that determine the roles of authorities and users
in governing and managing the natural resources. Therefore, spatial datasets on the different levels of
administrative organization of the country are important as well (i.e. municipalities, districts, counties,
etc).
5.3 Compilation of asset accounts
Typical indicators and data sources
Forest assets can be expressed as land covered by forest ecosystems (ecosystem based accounts)
or as the stock of one or more forest products of interest (resource based accounts). In the first case,
the stock and its changes over an accounting period are recorded in surface units (hectares, square
kilometers, etc). In the resource based accounts the stocks are recorded in relevant units (typically a
volumetric unit, m3) depending on the resource(s). Table 5.2 presents the basic components of the
asset accounts and a non-exhaustive list of indicators and potential data sources.
65
Table 5.2: Typical indicators and data sources for constructing the forest asset accounts.
A: Assets accounts based on forest land, and B: Assets accounts based on standing timber
A. Forest land
Indicator(s)/unit Data source*
Opening stock of forest and other wooded land
Additions to stock
• Afforestation • Afforested area (ha)
• Density (trees/ha)
1, 2, 3
• Natural expansion • Area (ha) 1, 2, 3
• Reforestation • Reforested area (ha)
• Density (trees/ha)
Reductions in stock
• Deforestation • Deforested area (ha) 1, 2, 3
• Natural regression • Area (ha) 1, 2, 3
Closing stock of forest and other wooded land
B. Standing timber
Indicator(s)/unit Data source*
Additions to stock
• Growth • Natural growth of timber volume (m3)
1
• Timber in young trees (not considered in previous accounting period)
• Volume in trees recently classified as timber (m3)
1
Reductions to stock
• Tree harvest • Havested timber during the period (m3)
1, 5
• Tree losses • Losses in timber volume due to fires, disease, catastrophic events, etc (m3)
1
Closing stock of standing timber
*Data source: 1. Forest inventories and forest statistics (incl FRA and other FAOSTAT statistics); 2. Spaceborne remote sensing; 3. Airborne remote sensing; 4. LC/LU data and maps; 5. National accounts production data; 6. Non-forest statistics; 7. Other spatio-temporal datasets
66
Approaches to land cover mapping
When following an ecosystem-based approach, land cover, land use, and forest maps are essential
data sources. Land cover maps constructed at national or sub-national level are preferable data
sources as they contain highly detailed information and are based on locally relevant land cover
classification systems. Alternatively, if no up-to-date data are available, one can consider obtaining an
approximation of the location and extent of forest land from global land cover maps like ESA's
Globcover (3), the MODIS land cover product, Ecoclimap (1), and similar sources.
In certain circumstances, alternatives to the available land cover maps may be required as the maps
may be outdated, more detailed land cover data may be required, or the classes in the land cover map
may not reflect a meaningful segmentation of the study area for the ecosystem services of interest. In
that case, a land cover/land use map can be built using multispectral imagery.
The elaboration of land cover maps from multispectral imagery is based on the fact that the land cover
classes exhibit characteristic spectral patterns. In other words, land cover classes can be defined as a
function of the reflectance values in different regions of the electromagnetic spectrum. Therefore, the
construction of land cover maps is based on the statistical clustering of pixels of similar reflectance
values in different regions of the electromagnetic spectrum. Two main methodological approaches can
be followed for constructing a land cover map from multispectral imagery: supervised and
unsupervised classification. These approaches are illustrated in the scheme of Figure 5.2.
Figure 5.2 Methodological approaches to land cover mapping
In the supervised classification approach, one starts from existing knowledge about the correct
classification based on a number of sites in the area of interest. This information is registered such
67
that the reflectance values of the known locations are associated with the land cover classes of those
locations. This phase is referred to as the training phase. The information collected in the training
phase is used in the clustering algorithm to steer the clustering process such that all pixels in the area
of interest are assigned to one of land use classes. In a next step, the spectra of all pixels are
analyzed and each pixel is associated to a class based on its similarity to the spectral signatures
obtained during the training phase.
The unsupervised classification approach does not start from previous knowledge of locations and the
class they belong to. A cluster analysis is performed such that the area of interest is partitioned into a
user-defined number of classes. A numerical value is assigned to each class. The resulting partition
should then be interpreted to give a physical meaning to the obtained classification.
Figure 5.3 provides an example of this classification approach. The region of study is the Pacific coast
in South-Eastern Guatemala. The most notable permanent vegetation type in this region is the
mangrove forest. This forest ecosystem fulfills various ecological and economic functions in the
region. Yet, it is threatened by factors like expansion of marine salt exploitation facilities, wood
harvest, reduced discharge of rivers, urbanization, etc. Figure 5.3A shows the area as seen by
Landsat 8 in real color and Figure 5.3B presents the results of unsupervised classification into an
arbitrarily defined five classes. In this exercise, the forested areas were grouped in one class, depicted
in 5.3B in light-blue. Within this class, the mangrove area stands out as the forested area along the
coast. Water is represented in yellow and the cropped area in red, purple, and green as that class
presented different degrees of bare soil influence and humidity.
Figure 5.3: Unsupervised classification with an arbitrarily defined five classes in a coastal region in South-Eastern Guatemala
A B
Conducting this kind of analysis at different timestamps allows the assessment of gains and losses in
the extent of forest land and the overall evolution of the spatial arrangement of landscape elements.
In this respect, it is pertinent to mention that various methodologies have been developed to detect
change in land cover. Coppin et al (2) present a review on different methods of digital change
detection for ecosystem monitoring.
68
For illustrative purposes, Figure 5.4 shows a hypothetical area where forest cover has been
monitored. The status of forest cover is presented for two timestamps, Figure 5.4A and 5.4B, which
are taken, respectively, as the beginning and the end of the accounting period. The change recorded
by the end of the accounting period is indicated in Figure 5.4B (losses in red, gains in blue).
Additionally, maps on the elevation and a grid-like zoning of the area are presented.
Figure 5.4: Hypothetical region. A. Forest cover at the beginning of the accounting period; B. Forest cover and location of gains (blue) and losses (red) by the end of the accounting period; C. Elevation in meters above sea level; D. Zoning for landscape analysis
A B
C
D
69
Forest land asset accounts
Table 5.3 presents the general forest asset account for the region and accounting period under study.
The data in Table 5.3 are an example of the simplest way forest asset extent accounts can be
presented. For the purposes of policy evaluation and planning, a more detailed table that partitions the
data according to the drivers of change may be necessary. For instance, additions may be due to new
forest plantations, natural succession, change in land use regulations, etc. More specific information
could also be important to assess the share of the different kinds of forest losses, e.g. due to fires,
expansion of agriculture or urban areas, harvesting, etc.
Table 5.3: General forest land asset account for a hypothetical area and one accounting period
Forest land (ha)
Opening stock 59498.37
- Additions 1554.21
- Reductions 3118.32
Closing stock 57934.26
The forest asset extent accounts could also measure the dynamics of different forest types. For
instance, a distinction could be made between broad-leaved, mixed and coniferous forest; natural and
cultivated forest; protected and non-protected, etc. Compiling the forest accounts in such a way that
data are organized per geographical units is particularly useful. The advantages of such approach are
related to the local nature of forest management measures, suitability of policy decisions, and
assessment of ecosystem service flows. In this respect, the information given in Figures 5.4C and
5.4D is useful to exemplify the importance of partitioning the study area in smaller regions. Figure
5.4C is the digital elevation model of the region and allows partitioning the area in altitudinal strata.
Figure 5.4D partitions the area in arbitrarily defined grid elements. In real applications, the partitioning
can be made in accordance with criteria like administrative units, water catchments, territorial planning
units, etc.
Table 5.4 presents the results of using the digital elevation model from Figure 5.4C to assess changes
in forest land during the accounting period within different altitudinal strata. Following this approach
may be particularly useful in regions where altitude is related to forest functions like flood protection,
soil conservation, water cycle regulation, etc. The digital elevation model allows users to link the
information on forest dynamics to other topographical variables like slope and aspect. The data in
Table 5.4 show that the intensity of additions and reductions with respect to the opening forest land
stock was not equally distributed across the study area. Forest land reductions were greater than the
additions in three out of four altitudinal ranges.
70
Table 5.4: Forest land asset accounts by altitudinal range (hectares)
Together with reporting opening and closing stocks and the source of additions and reductions in
forest land cover, it is important to include an assessment of relevant characteristics of the forest
ecosystem conditions in the forest accounts. The selection of forest condition characteristics should be
focused at monitoring the capabilities of forest ecosystems to provide ecosystem services. The
ecosystem characteristics to be considered in such an assessment and the suitable indicators for
evaluation are region-specific. They should reflect the priorities and sensitive issues of each region.
Table 5.6 presents a short list of common characteristics in the assessment of forest ecosystem
condition together with a number of proposed indicators and potential data sources.
Table 5.6: Parameters of forest ecosystem condition, indicators and possible data sources
Indicator/unit Data source*
Defoliation • Litter fall measurements (kg)
• Leaf Area Index (LAI) based indicator
1
Forest health • Presence of pathogens and plagues
• Status of bark
• Mortality rate
1
Forest fires • Burnt area 1, 2
Fragmentation • % of forest area in categories (core, interior, connected, patchy)
• Effective mesh size
• Size of forest fragments
• Length of fragment edge
2, 3, 4
Aerosol pollutants • Ozone concentration
• Nitrogen deposition
• Sulfur deposition
6**
*Data source: 1. Forest inventories and forest statistics (incl. FRA and other FAOSTAT statistics); 2. Spaceborne remote sensing; 3. Airborne remote sensing; 4. LC/LU maps; 5. National accounts; 6. Non-forest statistics; 7. Other spatio-temporal datasets
** ICP-Forests in Europe and FHM (http://fhm.fs.fed.us) and FIA (http://fia.fs.fed.us) programs in the US gather various forest health indicators. One point of interest is the assessment of the effect
of air pollutants
An important indicator of forest health and vitality is defoliation. Certain regions have monitoring
networks in place where several indicators of forest health are constantly measured. The magnitude of
defoliation is one of those indicators and is commonly measured by weighing the leaves collected by
litter traps. At larger scales, monitoring the trends in Leaf Area Index (LAI) can be a useful proxy for
quantifying defoliation. LAI is defined as the half the ratio of the area of leaves to the forest? area.
Estimates of LAI can be derived from RS imagery; for instance MODIS LAI product
(https://lpdaac.usgs.gov/products/modis_products_table/mod15a2), Geoland2 (www.geoland2.eu) and
Global Land Surface Satellite (GLASS) product (http://glcf.umd.edu/data/lai/).
72
Forest fires can be a major threat to forest ecosystems integrity and functioning. Although several
regions have efficient systems for detecting and quantifying the extent of forest fires, the effect of fires
on forest ecosystems in large regions of the world is not well known. Complementary information on
the temporal and spatial patterns of forest fires can be derived from RS; particularly from specially
designed products. For instance, the MODIS burned area product (MCD45A1).
Deforestation, urbanization, agriculture expansion, extreme events, and other alterations of forest
ecosystems may cause reductions in the forest stocks. Beyond the physical reduction in the stocks,
these alterations lead to forest fragmentation. Forest fragmentation can be thought of as a break in the
continuity of forest ecosystems. Fragmentation has multiple effects including changes in ecological
processes, reduction in biological diversity, allows for the spread of invasive species from disturbed
edges (11), and reduction in the attractiveness of forests for recreation activities. In the framework of
forest accounting, forest fragmentation can be thought of as a source of variation in the capability of
forests to provide ecosystem services.
Various indicators of forest fragmentation exist. In measuring forest fragmentation a common
approach is to track the mean size of forest patches or fragments and the length of the edge of the
patches. Alternatively, the studied region can be represented as an arrangement of cells (grid) where
each cell is labeled as forest or non-forest. The forest cells can then be classified based on the
number of surrounding cells that are also labeled as forest. The result of this second approach is the
calculation of the number of forest cells as core, interior, connected, or isolated forest cells. Other
approaches are possible including the effective mesh size and the degree of landscape division. The
former represents the size of the areas when the region under study is divided into areas with the
same degree of landscape division; the smaller the value the more fragmentation. The degree of
landscape division is the probability that two randomly located points in the studied area fall in the
same forest patch.
Tables 5.7 and 5.8 present the values of a number of fragmentation indicators for the hypothetical
example depicted in Figure 5.4. The comparison of the values in both tables shows the importance of
the size of the area units (or spatial scale) chosen for the assessment of forest fragmentation. The
subdivision of the study area into four areas using altitudinal strata, results in large spatial areas where
the effect of changes in forest cover is hardly reflected in the values of fragmentation indicators.
Conversely, the values in Table 5.8 which are based on the smaller grid units from Figure 5.4D, show
the forest cover dynamics more clearly and support interpretation of the ecological and policy-related
implications of changes in forest cover.
Table 5.7: Indicators of forest fragmentation at the beginning and end of the accounting period for four altitudinal strata of the studied region
Table 5.8: Indicators of forest fragmentation at the beginning and end of the accounting period for different units representing grid elements in which the studied area was partitioned
Compiling the physical flow accounts requires measurement of the flows of forest ecosystem services
from the natural system to the economy in physical units. Since there are many different forest
ecosystem services, it is difficult to set a generic measurement approach for quantifying these flows.
Table 5.9 presents a series of possible indicators for the ecosystem services associated with forest
ecosystems. The list of indicators in Table 5.9 is general and, as mentioned earlier, the final list of
indicators and data sources should be a response to national priorities, critical policy-related topics,
and data availability.
74
Table 5.9: Typical indicators and data sources for estimating ecosystem services
Indicator(s)/unit Data source*
Provisioning services
• Timber • Harvested timber (m3; m3/ha) 1, 3, 5
• Firewood/charcoal • Volume ( m3) 1, 4, 5, 6
• NTFP • Volume ( m3); Weight (kg; ton);
Number of units
1, 4, 5, 6
• Genetic material • Composition
• Diversity
6
• Grazing • Number of animals in silvo-pastoral system
• Weight units of produced animal product
• Energy uptake
6
Regulating services
• Atmospheric/climate regulation
• Net carbon storage (gains-losses) 2, 6, 7
• Water flow regulation • Canopy cover fraction in recharge areas
• Average daily and annual water flow in rivers
• Cover in strategic locations (floodplains, steep slopes, wetlands, etc)
2, 6, 7
• Water cycle regulation • BOD
• Turbidity in waterways
2, 6
• Pollination • Abundance and variety of pollinator species 5, 7
• Soil retention and formation
• Erosion rates
• Cover (or bare soil) fraction in vulnerable areas
• Turbidity in waterways
7
Cultural services
• Recreation • Number/area of national parks
• Area of parkland within cities
5, 7
• Information and knowledge
• -
• Spiritual and symbolic • -
*Data source: 1. Forest inventories and forest statistics (incl. FRA and other FAOSTAT statistics); 2. Spaceborne remote sensing; 3. Airborne remote sensing; 4. LC/LU maps; 5. National accounts; 6. Non-forest statistics; 7. Other spatio-temporal datasets
Provisioning services
A substantial portion of the flows related to forest provisioning services is accounted for in the SNA.
Yet, gathering comprehensive datasets on these flows is not an easy task; especially when following a
resource based approach and if trees outside the forest are considered as sources of timber and
firewood. The availability of data on non-timber forest products (NTFP) varies considerably among
regions. Depending on the relevance and the market value of NTFP, some estimates of the flows of
75
these products may be derived from forest or economic statistics. Products like mushrooms, tree nuts,
cinnamon, understory plants like xate (Chamaedorea sp), and ferns might be registered as market
goods.
Household surveys can also provide valuable information on the use of NTFP; especially in rural
environments. Data on grazing associated to forest may be obtained in agriculture or livestock surveys
and household surveys. Considering silvo-pastoral and agroforestry systems (like the dehesas in
Spain and Portugal) as classes when elaborating land cover/use maps can be an important input to
quantifying and localizing the flows related to these kinds of integrated production systems.
Regulating services
Accounting for forest regulating services entails exploring a more diverse range of methods and data
sources. The measurements and modeling schemes often encompass other disciplines like hydrology,
physics, edaphology, geostatistics, amongst others. As such, incorporating theses flows in the forest
physical accounts requires the integration of multidisciplinary teams and inter-institutional
collaboration.
There is a global concern for quantifying the role of forests in the overall carbon balance. In this
respect, estimates of carbon storage in forests, carbon sequestration, the effect of land use change
and deforestation, etc. are all relevant components within forest flow accounts. In addition, the
development of carbon markets will allow for this flow to be expressed in monetary terms too.
Field surveys for measuring carbon sequestration follow very much the methodological and statistical
principles of forest inventories; their detail and scope is, however, more comprehensive. They aim at
measuring different carbon pools both above and below ground. Live and dead plants in the different
vertical layers of the forest canopy are included as well the soil (8). In measuring the different
elements of the forest profile, the emergence of terrestrial LiDAR scanning systems is in full
development in recent years. As for accounting for urban trees, McPherson et al (5) propose a
methodology that combines field surveys and RS. FRA data have also been used for estimating
carbon gains across the European Union countries (9).
Satellite RS can be exploited to support estimates of atmospheric carbon capture by forests. The
possibilities include the RS-based land cover classification for segmenting the forest in homogeneous
strata prior to field surveys (7) and modeling approaches where forest productivity is derived from
energy reflectance and ancillary data.
Regarding the role of forest land in the regulation of the water cycle, a suite of modeling alternatives is
available to estimate surface (and sometimes groundwater) flows. Specific examples are the SWAT
(Soil and Water Assessment Tool) model (and its implementation in ArcGIS -ArcSwat), TopModel
(implemented in GRASS GIS and the topmodel R package) and MIKE-SHE.
Prevention of soil erosion is one of the most important ecosystem services of forests. Soil erosion
reduces the land’s productivity potential, increases sedimentation in waterways, increases the risk of
landslides and floods, and increases the vulnerability of people to extreme climatic events. Indicators
related to this ecosystem service can focus on the erosion itself (i.e. measuring or simulating the
volume of eroded soil for different scenarios of landscape configuration) or on the impact in water flow
and quality. The classical way of modeling erosion is based on the Universal Soil Loss Equation
(USLE). This equation estimates average annual soil loss (A) as the multiplication of 5 factors: a
rainfall and run-off factor (R), a soil erodability factor (K), a slope factor (LS – length and steepness), a
crop and cover management factor (C), and a conservation practice factor (P). The effect of forest
76
cover on soil erosion in a water catchment can be assessed by replacing the C factor by other
alternative land cover classes. Improvements of USLE have resulted in alternative models; notably,
the Water Erosion Prediction Project (WEPP) which has been implemented in software tools like
GeoWEPP (http://geowepp.geog.buffalo.edu/).
A great deal of eroded soil ends up in stream channels and causes sedimentation and turbidity.
Moreover, soil erosion causes an increase of organic matter in water which, in turn, boosts the oxygen
demand. These effects can be monitored through common indicators of water quality like turbidity and
biochemical oxygen demand (BOD).
Cultural services
Statistics on the numbers of visitors to forests are the primary data source for assessing the
recreational value of forest ecosystems. Whenever the assessment of recreational value is desired for
large areas (e.g. country level), on-site surveys are likely not available. In that case, modeling the
number of visitors is an option for determining the magnitude, origin, and destination of visitors to
forests and green urban areas. Factors like size of forests, quality of the site, distance to human
dwellings, and conditions of the road network have often been found to be significant determinants of
numbers of visitors for recreation.
Applying these factors in modeling schemes lends itself to GIS-based analysis where distance over
road networks can be estimated, road quality classes can be expressed in friction values (that can be
related to travel time and cost), and location and size of forests and urban areas can be modeled as
polygons or raster layers. A simple modeling scheme can be based in a gravity model where the flow
of visitors is assumed to be directly proportional to the size of forests and population of potential
visitors and inversely proportional to the square of distance between forests and human dwellings. In
accounting for distance, current GIS tools (like ESRI's ArcGIS Network Analyst extension and the
tools for network analysis in GRASS GIS) allow the use of distances over a road network instead of
Euclidian distances and publicly available datasets like Open Street Map (www.openstreetmap.org)
can be useful in obtaining road network data.
In addition to the modeling alternatives mentioned in previous paragraphs, it is important to underline
recent modeling efforts towards the description of ecosystem services like the Artificial Intelligence for
Ecosystem Services (Aries - http://www.ariesonline.org) and the Social Values for Ecosystem Services
(SolVES - http://solves.cr.usgs.gov/). Aries is a modular set of deterministic and Bayesian modeling
tools including, amongst others, estimates on carbon sequestration and storage, sedimentation, and
recreation. SolVES is a GIS-based tool to quantify the perceived social values of ecosystem services.
Thus, the system relies on community-based evaluation of the non-monetary value of environmental
services.
5.5 Challenges
Despite the numerous datasets and methods devoted to the study of forest resources and services,
the timely and consistent acquisition of data and the coupling thereof to economic statistics is a major
challenge for countries compiling forest accounts.
Developments in RS of vegetation and modeling of ecosystem services are promising alternatives to
ensure coverage of large areas at short time steps. RS data can be especially useful when searching
for indicators of non-measured variables or when registering the conditions of non-surveyed regions.
However, it is important to note that the usability of RS data is not free of errors and the reliability and
77
comparability of measurements is dependent on many factors including atmospheric conditions,
cloudiness, slope and shadow effects, illumination conditions, etc. There are also particular difficulties
in translating information about a 3 dimensional world into 2 dimensional datasets and maps.
Therefore, exploring different methods for data processing and searching robust validation sources
are important characteristics for incorporating RS in a forest accounting scheme.
Forest accounting is focused on describing the interactions between society and the natural system.
Therefore, data comparison across time is of paramount importance in forest accounting. In this
respect, the use of different criteria and methods for updating forest inventories, land cover maps,
household surveys, census, or other essential datasets hampers the identification of trends and the
evaluation of the effects of policies (or the lack thereof).
78
6. Compiling monetary accounts for forests
6.1 Background
In order to aggregate measures of forest resources and ecosystem services and to compare them to
other economic estimates, such as financial costs, a single measurement unit of currency is needed.
Monetary valuation provides a straightforward decision-making metric that is widely used and
accepted in decision making processes and facilitates integration with the standard economic
accounts of the SNA.
Putting a monetary value on forest resources and ecosystem services also supports, for example, (i)
raising awareness of the relative importance of forests and mainstreaming their value into decision-
making, (ii) comparing the economic importance of different asset types, including forests, and (iii)
informing economic decisions about different land use choices (e.g. cost-benefit analysis).
Notwithstanding these merits, valuation of forest resources and ecosystem services can be
challenging and requires a number of special considerations for accounting purposes. Most
importantly, they can only be valued through the benefits they provide to humans. For those forest
resources that enter markets, notably, timber and wood products, market prices can be observed or
imputed and used to value the benefits and the relevant ecosystem services. However, the benefits
from the use of many other forest ecosystem services, mostly non-provisioning services, are not
exchanged in markets and do not have market prices that can underpin valuation.
In what follows we discuss what can be valued before outlining how to value these benefits by
describing the valuation principles of the SNA and SEEA Central Framework and the available
valuation approaches. We then show in more detail how market, quasi-market and non-market
benefits from forests can be valued and how such estimates cam be integrated asset and flow
accounts. We will briefly outline how to compile forest related environmental activity accounts before
some of the challenges will be discussed.
6.2 What to value?
Forest ecosystem services can be valued through the benefits they provide for humans. Put
differently, for accounting purposes it is relevant to apply the notion of a chain of values where
ecosystem services contribute or are inputs to the value of benefits. These benefits comprise goods
and services that directly generate utility and alter human welfare. Benefits may be:
• intermediate goods and services that are produced within the economy and serve as inputs to
the production of other goods and services. The outputs of agriculture and forestry are good
examples.
• consumed directly by households from the environment and hence represent final goods and
services. Household collection of mushrooms and berries from forests are examples. These
final goods and services would be considered part of economic production in the SNA.
• outside the production and income boundary of the SNA that are either (i) used, perhaps
unknowingly, by economic units within their production processes (e.g. soil retention and
water flow regulation by upland forests) or (ii) consumed by households or society as a whole
(e.g. amenity benefits from scenic landscapes and carbon sequestration services).
The values of these benefits may be captured in standard economic accounts and, if so, techniques
can be applied to estimate the value of the benefit and to estimate the value of the associated
ecosystem service – i.e. the value of the contribution of the ecosystem to the generation of the benefit.
79
Where the value of the benefit is not captured in standard economic accounts, other techniques to
estimate a relevant value and the value of the associated ecosystem service must be found.
The ecosystem services described above are commonly referred to as final ecosystem services since
they reflect the point of interaction between ecosystems and economic units and people. Underlying
these final ecosystem services is a web of other ecosystem interactions and processes. In concept it
would be possible to attribute the value of final ecosystem services further down the “ecological”
production function but this step is not normally undertaken and this possibility is not discussed further
in this chapter.
Generally speaking, the value of forests can be considered in terms of (i) direct use values (through
their consumptive and non-consumptive use), (ii) indirect use values (through contributing to other
goods and services with direct use value) or (iii) non-use values (any intangible benefits people enjoy)
attached to them (TEEB 201012). Each of these types of value will have a connection to different types
of benefits and hence to the underlying ecosystem services.
The first two columns in Table 6.1 give a condesnsed overview of the connections between forest
benefits and forest ecosystem services. It is important to recognize that there can be different
beneficiaries from these ecosystem services. The beneficiaries include those in the forestry industry
(logging companies, wood production) and those in other industries (e.g. hydropower companies,
agricultural producers, municipal water supply, tourism). The beneficiaries may range from local
(forest land user, downstream municipality) to a national and even global level.
Table 6.1: Overview of forest ecosystem services and benefits and their inclusion in the SNA
Forest Ecosystem
Services Forest Benefits
SNA
Production Account
timber (P) timber
market benefits:
market goods and services produced by
forest activities
explicitly measured if resulting in (i) market-production (sale/barter), (ii)
production of goods for own final use
firewood/charcoal (P)
wood-based energy
other NTFP (P) food, fodder,
medicine
carbon storage/ sequestration (R)
climate regulation
not included
genetic material (P) product development
quasi-market benefits:
contribute to the production of market goods and services produced by other
economic activities
implicitly measured through the value of non-forest (i) market-production (sale/barter), (ii) production of goods for own final use
biomass for grazing
(P)
livestock
production
pollination (R ) agricultural
production water flow regulation
(R ) flood protection
12 TEEB. 2010. The Economics of Ecosystems and Biodiversity: Mainstreaming the Economics of Nature: A synthesis of the approach, conclusions and recommendations of TEEB. UNEP.
80
Forest Ecosystem
Services Forest Benefits
SNA
Production Account
hydro-power production
soil retention and
formation (R ) sedimentation
control
water cycle regulation (R )
(drinking) water supply
recreation (C ) tourism
information and knowledge (C )
research/ education
spiritual & symbolic (C )
cultural heritage,
identity, spiritual/ religious functions
non-market benefits:
do not contribute to goods or services
traded at markets
not included
non-use (C ) existence/ bequest/altruist
6.3 Market, quasi-market and non-market benefits
In applying valuation techniques, it is useful to differentiate between three different types of forest
benefits: market benefits, quasi-market benefits and non-market benefits. This breakdown refers to
their linkages to market goods and services and to the extent to which they are included in the SNA or
SEEA Central Framework, which is summarized in column 4 in Table 6.1. As shown in section 6.4,
each type of benefit requires consideration of different valuation methods.
Market benefits
Market benefits are those goods and services produced by forest based activities that can be traded in
markets and thus for which there is a market price. Market benefits can be linked to two main types of
ecosystem services:
(i) Provisioning services with a direct consumptive use value: These ecosystem services contribute to
the production of private goods that can be traded in markets, such as timber, wood-based energy
from charcoal and firewood or food, fodder and medicine from NTFP. The private goods are explicitly
measured as forest-related benefits in the SNA if they result in market production or
production/consumption on own account.
(ii) Some regulating services (primarily relating to climate regulation): Some ecosystem services, such
as carbon sequestration, may contribute to the production of market benefits under specific
institutional arrangements. Examples are some payments for ecosystem services (PES) schemes or
carbon markets that assign property rights to the benefits and generate tradable units, such as carbon
offsets. These types of market benefits are not yet included as outputs from production in the SNA.
81
Quasi-market benefits
Quasi-market benefits are those benefits provided by ecosystem services that in turn contribute to the
production of market goods or services by other economic activities. For example, the water regulating
services of forests to the production of hydropower. Although these contributions are not explicitly
measured and valued, they are implicitly included in the market value of these goods and services and
hence they are implicitly accounted for in the SNA. Special valuation methods are needed to reveal
their values and to report them in forest accounts. Three broad types of ecosystem services
contributing to quasi-market benefits can be distinguished:
(i) Substitutable ecosystem services that are inputs to non-forest production: These services
can include water cycle regulation increasing drinking water quality (reducing need for water
treatment), water flow regulation providing water to agriculture (reducing irrigation needs) or
soil retention control reducing sedimentation (reducing dredging or protection infrastructure
needs).
(ii) Complementary ecosystem services that are inputs to non-forest production: These
services include genetic material contributing to the development of new products, pollination
or grazing services for agricultural and livestock production or water flow regulation for
hydropower production. The differentiation between substitute and complementary inputs
depends on the availability of alternative production inputs or technologies.
(iii) Attribute of a heterogeneous non-forest market good: These ecosystem services are
recognised in cases where there is a more complex market good that involves interaction with
the environment and hence the ecosystem is one component or attribute in determining the
value of the good. Examples include recreational services for a forest resort that contribute to
tourism revenues; and information and knowledge services from a unique forest ecosystem
that attracts research and education activities.
Non market benefits
Non-market benefits reflect inputs from forest ecosystem services to benefits that do not contribute to
market goods or services.13 In most cases the relevant ecosystem services are cultural services with
public good characteristics. These services include cultural heritage, local identities, spiritual and
religious functions from spiritual or symbolic services. Broadly speaking, they have non-consumptive
use values and represent public goods mainly of importance at a local level.
Non-market benefits also include non-use values which cannot be attributed to specific ecosystem
services. Examples of non-use values include bequest values (from knowing that future generations
will have access to these ecosystem services), altruist values (from knowing that other people have
access to these services) and existence values (from knowing that the ecosystem exists).
The value of these non-market benefits is not included in the SNA.
13 It is important to recognize that the use of the term “non-market” in economics differs from the use of “non-market” in national accounting. Here “non-market” is used in its economic sense to indicate that there is no exchange between economic agents (households, companies, etc). In national accounting non-market refers to situations where the exchange of goods and services takes place are prices that are not “economically significant”. Examples of national accounts non-market pricing includes government provision of health and education services.
82
6.4 National accounts valuation concepts and principles
General concepts
To ensure compatibility with SNA estimates, valuation of forest resources and ecosystems need to be
based on the exchange value. This is the value at which goods, services, labor or assets are in fact
exchanged or else could be exchanged for cash (SNA, 2008: 3.118). These values should be based
on market prices for transactions, i.e. money that willing buyers pay to acquire something from willing
sellers (SNA 2008: 3.119). Where such prices are not available, valuation according to market price
equivalents should be used to provide an approximation to market prices (SNA, 2008, 3.123).
In neoclassical economics, exchange values result from the price (P) and the quantity (Q) exchanged
at the equilibrium of supply and demand (see Fig 6.1). Without going into details, area A reflects the
consumer surplus arising from a price lower than the consumers’ willingness to pay which should
equal their marginal utility gained from consuming one more unit of the service (as portrayed in their
demand curve). Area B is the producer surplus arising from a price higher than the producer’s
willingness to accept which equal their marginal production costs, C (as portrayed in their supply
curve). The value entered into the SNA is P*Q or B+C in Fig 6.1. This means that A, the consumer
surplus, is not included in SNA based valuations.
Exchange values do not necessarily reflect social values. The measurement of social values is not
standardized but plays a key role in the economic valuation of forest resources and ecosystems.
Social values represent the full benefits that accrue to society, today and in the future, in terms of
changes in welfare (or total economic value). Generally, social values would be estimated based on
changes in both producer and consumer surplus (thus include area A in Fig 6.1). Social values aim to
capture the ecosystem services that never enter markets due to the presence of externalities or
market imperfections.
Although following the standard valuation principles of the SNA these additional values are not
captured there is ongoing discussion, in the context of the SEEA EEA, of whether through the concept
of ecosystem services, it is possible to estimate exchange values for forest ecosystem services that
are not directly traded in markets. This will be discussed further in sections 6.3 and 6.4.
The real challenge from an accounting perspective is that many valuation methods that are applied
aim to estimate a willingness to pay from changes of consumer surplus in different scenarios. Such
values go beyond the exchange value concept by including consumer surplus, which would rather
correspond to a social value concept. Therefore matching valuation methods to the required valuation
concept is a key issue for ecosystem accounting.
83
Figure 6.1: Consumer surplus (A), producer surplus (B) and production costs (C).
It has been argued that for the same market good different prices may be recorded according to the
price function that arises in some particular market situations (see Day 2013).14 Hence, depending on the market institutions and the level of price discrimination, prices need not be constant at P as shown
in Fig 6.1. Rather they would vary with the consumers’ willingness to pay in order for the producer to
“capture” the consumer surplus. Thus, in situations of very high degrees of price discrimination, i.e.
where there is customer specific pricing, consumer surplus would be eliminated and exchange values
and welfare values would align. Since for many ecosystem services there are no observable markets,
this potential alignment cannot be assumed.
Concepts in valuing ecosystem services at exchange values
Following the SNA and as described in the SEEA EEA, there are three ways to estimate exchange
values for forest products and ecosystem services.
(i) Market prices: Goods and services exchanged in markets can be valued based on their
observed market price. Strictly speaking, market prices are defined as amount of money that
willing buyers pay to acquire something from willing sellers (SNA 2008: 3.119).
(ii) Market-price equivalents: Goods and services not exchanged in markets can be valued by
the prices of the same or similar products if this price is believed to be the price expected to
be paid by market participants and if the additional market supply of these goods or services
does not have any price effect.
(iii) Cost of production: Alternatively, these goods and services can be valued by the sum of all
costs of producing the good (e.g. land rents, machinery and labor costs).
14 Day, B., 2013. An overview of valuation techniques for ecosystem accounting. Issue Paper 1.1, Valuation for Accounting Seminar. November 2013.
84
Concepts in valuing assets at exchange values
Ideally, observable market prices should be used to value the stock of forest resources and forest
ecosystem assets. According to the SNA (2008, 13.18), in estimating the current market price, a price
averaged over all transactions in a market can be used if the market is one in which the items in
question are regularly, actively and freely traded. If market prices cannot be observed, an attempt has
to be made to estimate prices.
For valuing forest assets, there are three options to estimate exchange values following the SNA
(2008, Ch. 13.B) and SEEA Central Framework (ch. 5.4.3):
(i) Land values observed in markets: Where market prices are listed at regular intervals and
for homogenous land types, relevant land prices can be used to value forest ecosystems
(even if they are actually not traded) (SEEA Central Framework 5.6).
(ii) Written down replacement cost: The current acquisition price of an equivalent new asset
less accumulated consumption of fixed capital. When reliable, directly observed prices for
used assets are not available, this procedure gives a reasonable approximation of what the
market price would be were the asset to be offered for sale. However, since forest land is not
depreciable this method is not appropriate for forest valuation.
(iii): Net Present Value (NPV): The discounted value of future returns from forest resource
stocks or the discounted value of all flows of ecosystem services from forests (see Box 6.1)
For the valuation of timber resources, the recommended approach is the use of NPV, since market
transactions or set of acquisition prices are hardly observed, This is in line with the SEEA Central
Framework that highlights NPV for the valuation of environmental assets while recognizing the market
price principles of the SNA.
For the valuation of forest land other considerations need to be taken into account. In principle the
value of the timber resources should be valued separately from the land “under” the timber resources
themselves. This separation recognizes that, for accounting purposes, the timber resources may be
depleted while the land itself remains. Tracking these different but combined assets is therefore
conceptually ideal.
The estimation of the value of forest land may however be challenging. In some cases, where the only
relevant income stream is from harvesting timber then the value of the land itself may be very low and
hence the value of forest land and the value of timber resources are effectively the same. On the other
hand where forest land can be converted to alternative land uses, for example for agriculture or
housing, the market value of the land may be quite distinct from the value of the timber resources
since other potential income streams might be considered. In some countries there are active markets
in forest land and this information can be used in determining appropriate values.
Where forest land values are not directly observed (e.g. via land markets), estimating the benefits from
alternative land used can be an alternative valuation method. Such an “opportunity cost” approach is
an attractive solution if the benefits from alternative land uses are easy to compute, for example when
agricultural price and production data are available. This valuation approach assumes that land users
only forgo benefits from alternative uses if the use of the land as forest provides them with benefits
that exceed the opportunity costs. In which case the valuation represents a lower bound on the value
of the forest land.
Note that the use of these values for accounting purposes must take into account the likelihood of the
alternative uses. Thus if there is no prospect of the forest being used in other ways, for example due
85
to existing legislation, then the value of alternative uses is an interesting calculation for analysis but
not appropriate for accounting.
Forest land may also be valued with respect to ecosystem services. In this case it is relevant to
include not only the future streams of value associated with flows of timber but also the NPV of flows
of other ecosystem services being supplied by the area of forest land. However, the potential trade-
offs between different ecosystem services (e.g. between timber extraction and carbon storage) need
to be considered when making projection or assumptions about future flows of ecosystem services.
Further, the value of alternative land uses, as just described, should be considered in addition to the
NPV of ecosystem services.
Box 6.1 Calculating net present values (NPV)
The general aspects for calculating a NPV are discussed in detail in SEEA Central Framework
5.4.4 and Annex A.5. The main elements are as follows:
(i) Current and expected returns on resource stocks or forest lands: Returns are defined as the
economic rent or surplus value that is attributable to the timber resource or ecosystem service.
For resources there are a number of standardized approaches to calculate resource rents (e.g.
residual value, appropriation and access price method; see SEEA Central Framework, section
5.4.5). These methods ensure that net returns are estimated and also that the user costs of fixed
capital are deducted. For ecosystem services more broadly, a number of valuation techniques
can be applied (see section 6.2).
To value future flows of resources and ecosystem services, the expected returns are important.
These are determined by the expected quantity of resources to be extracted or use patterns, and
future extraction and management costs, and resource prices. Where these are highly volatile
and uncertain, it is often assumed that these are constant based on past extraction patterns.
(ii) Time span and expected extraction or use pattern: Estimates of the asset life are required to
provide the time frame over which the NPV is to be calculated. Generally, any returns beyond a
20 time span do not affect the NPV, but this depends on the choice of the discount rate. Where
future extraction or use patterns are known (e.g. resources are only to be extracted after 10
years) these need to be accounted for. Otherwise, current extraction and use patterns can be
assumed to remain constant. If there is unsustainable use of a resources, resulting in depletion or
degradation, the resulting impact on supply of forest resources or ecosystem services should be
reflected in the resulting calculations.
(iii) Discount rate: To value future returns at their present value, the returns need to be
discounted. A discount rate expresses time preference (i.e. how far one is willing to trade-off
income in the present with income in the future). The higher the preference for current income the
higher is the discount rate and the less valuable is income earned in the future. This can also
represent risk aversion. SEEA Central Framework recommends a market-based discount rate
that is equal to the assumed rate of return on produced assets. This allows the estimation of
exchange values that can be integrated with other national accounts balance sheet values and
compared to measures of production and income, for example for estimating productivity.
However, for other analysis it may be relevant to apply social discount rates which take into
account more explicitly long-term values to society. SEEA Central Framework Annex A5.2
explains relevant considerations.
86
Note that where the future returns are estimated in terms of constant prices (i.e. it is assumed the resource price remains the same into the future) the discount rate applied should be in real terms
– i.e. after taking out the effect of inflation. Where forecasts of future prices are incorporated then
a nominal discount rate should be applied.
6.5 Methods for valuing ecosystem services and benefits
There are a number of well-established valuation methods that have evolved and have been widely
applied in environmental and ecosystem service valuation. Most of these techniques are, however, not
explicit, about the extent to which they are consistent to the exchange or social value concept.
Depending on the framing and design of the valuation exercise these methods can derive values that
are compatible with the SNA and SEEA EEA.
Further in both design and application the methods are often not clear as to whether the focus of
valuation is the benefits being derived or the ecosystem services that are contributing the benefits.
This section gives a brief overview of different methods and the following section provides discussion
on the application in an accounting context.
It is recognized that the methods described in this chapter focus only on the estimation of values in
monetary terms, and that methods to undertake valuation in non-monetary terms are used, for
example by ranking ecosystem services in terms of relative importance (ref). Generally, the
accounting frameworks described in the Sourcebook can support and organize the information
required for either monetary or non-monetary valuation.
Market price based valuation methods
These methods are based on actual market data (quantities, prices, costs), which is usually relatively
straightforward to obtain. The methods can normally only be applied for market benefits and to a
limited extent for ecosystem services that are substitutes for inputs into production.
(i) Unit resource rent methods: Values of ecosystem services can be calculated based on market
price data for forest resources and provisioning services directly sold and brought at a market and
adjusting for the costs of extraction including costs of fixed capital. There are three main approaches
to estimating resource rents, and in principle all should derive the same result.
- Residual value: Under this method resource rent is estimated by deducting user costs of
produced assets from gross operating surplus after adjustment for any specific subsidies and
taxes.
- Appropriation method: Resource rent is estimated using the actual payments made to
owners of forest land.
- Access price method: Resource rent is based on payments for the purchase of licenses or
quotas to access a forest area.
Where market prices include rents for labor and other asset, these should be deducted to calculate the
rent for the forest resource or ecosystem services only. Valuation based on these rents needs to
reflect any unsustainable use (e.g. over-harvest of forest resources) or ecosystem degradation.
87
(ii) Cost-based methods: Values of ecosystem services can be estimated through the costs of
replacing them or the costs of losing them. The latter are also called ‘costs of inaction’.
- Replacement costs value ecosystem services through the costs for replacing an individual
service by a produced facility that provides the same service, such as a water treatment plant
filtering water, dredging to remove soil sedimentation, or building landslide protection
mechanisms. All of these are services that can be provided by ecosystems.
- Damage costs value forest benefits by the costs of losing ecosystem services. Examples
include damages due to increased flooding from less regulated water flows or due to
landslides caused by from soil erosion.
Revealed preference methods
These methods seek to reveal values through observations from market transactions by trying to
single-out the price effect of the ecosystem services. These methods can be used for valuing quasi-
market benefits.
(i) Production/Cost/Profit function methods estimate the value of an ecosystem service by
recognizing the ecosystem service as an input into the production of a market good or service
(e.g. pollination services) using relevant production, cost or profit functions or productivity
changes. These methods require an understanding of the linkages between the ecosystem
service and the production of the final output.
(ii) Hedonic pricing methods derive the implicit price for an ecosystem service by modelling
land values on a set of explanatory variables (characteristics of the land) including ecosystem
related proxies. Hedonic pricing has been mostly applied in context of well-established
property markets to price characteristics such as cleaner air.
(iii) Travel cost methods calculate the value of ecosystem services (mostly recreational) by
the time and travel costs people incur to visit a forest area that provides these services.
(iv) Averting behavior methods analyze individual choices to improve certain outcomes. From
data on expenditure for certain measures (e.g. install water filter to reduce pollutants in
drinking water at home), the willingness-to-pay for an ecosystem service (e.g. water filtration)
can be derived.
Stated preference methods
These methods derive values for environmental benefits by identifying people’s preferences in
hypothetical market contexts. Their main strengths as opposed to the other approaches is that they
can be designed for any ecosystem services context and can also be used to value non-market
benefits. At the same time there are a number of concerns that have been raised in applying these
approaches in an accounting context.
(i) Contingent valuation methods (CV) are based on surveys asking people how much they
would be willing to accept as a compensation payment for the loss of environmental benefits
or how much they are willing to pay for improving environmental benefits.
(ii) Choice experiments (CE) analyze decision-making processes from data related to people
ranking/choosing of a limited number of hypothetical options. Each of these options is related
88
to a number of choice attributes including a monetary value (price, costs) and an ecosystem
service supply level.
Benefit transfer
The methods described above can all be designed to estimate a range of different values and
ecosystem services. Ideally, the methods would be implemented through the collection of data
pertaining to specific ecosystem locations and/or specific ecosystem services. Given the time and cost
implications, and given the growing body of valuation studies, benefit transfer methods become more
prominent. These methods support the use of information from one location or ecosystem in the
valuation of similar ecosystems in other locations. Four benefits transfer methods are described
below. Since various assumptions are needed to apply any of the methods care should be taken in
their application and in the interpretation of results.
(i) Unit benefit transfer method simply takes the unit value of forest benefits (e.g. per hectare
or per person) from an original study as a reference value for the forest ecosystem to be
accounted for and adjusts for the size or population.
(ii) Adjusted unit transfer methods adjust the same unit value by controlling for economic
conditions (e.g. living standards) or ecosystem characteristics (e.g. tree coverage).
(iii) Value/demand function transfer methods apply parameters from an original study
determining the importance of ecosystem characteristics though a demand or value function
(e.g. to impacts of slope and rainfall on soil retention control values). These parameters are
then combined with data from the forest ecosystem.
(iv) Meta-analytic function transfer methods estimate such parameters for an aggregated
demand or value function for a number of original studies. Then these aggregated parameters
are combined with forest ecosystem characteristics.
To support benefit transfer work, and based on the growing number of valuation studies, a number of
databases are being developed to support valuation. One example is the work of The Economics of
Ecosystems and Biodiversity (TEEB) initiative.15
15 The database is available at http://www.fsd.nl/esp/80763/5/0/50.
89
6.6 Valuation of forest resources and ecosystem services
Based on these valuation methods, forest resources and ecosystem services can be valued so as to
account for flows and stocks in monetary terms. Table 6.2 gives an overview of how different forest
resources and ecosystem services can be valued. A number of academic case studies and project
evaluation exercises have been applying these techniques.
Table 6.2: Forest benefits and valuation techniques
Forest Benefits Valuation methods
Market price valuation
Revealed preferences Stated preferences
Benefit transfer
Unit resource rent
Cost-based
Production function
Hedonic pricing
Travel costs
CV CE
Market benefits
Timber X
X
Firewood, charcoal and other NFTP
X X
X
Climate regulation and other regulating services (part)
X X
X
X
Quasi-market benefits
Substitute input in non-forest production
X
X
Complementary inputs in non-forest production
X
X
Attribute of a heterogenous non-forest market good
X X X X X
X
Non-market benefits
X
Cultural benefits
X X X
Valuing market benefits
Ideally, forest accounts would identify three components of the value of forest goods and services
(Lange 2004):
(i) the production value is the total quantity sold or used times its unit value (i.e. P*Q or A+B in
Fig 6.1)
(ii) the value-added part of production value generated by forest ecosystem services is a
portion of the production or extraction costs, measured as output minus all intermediate costs
of production. This value is the contribution to GDP.
(iii) the resource rent or in-situ value contributed by forest ecosystem services, the value of the
product generated minus any production or extraction cost (i.e. A in Fig 6.1).
90
Often the resource rent and value-added part are calculated based on the production value (as in the
residual value method), as this is easiest to derive or can be directly be observed. Generally speaking,
market price valuation methods can be applied for the valuation of forest ecosystem services with
market benefits so as to derive the production value, value-added and resource rent (see Table 6.2).
Valuing timber
As timber is often traded at markets, the valuation of timber flows and stocks based on unit resource
rents is relatively well-established (see SEEA Central Framework, chapter 5.8 and Lange 2004,
chapter 7.1). Resource rent on timber can be derived as follows:
(i) Appropriation methods: In some instances resource rents rent can be estimated directly by
using estimates of the stumpage price, i.e. the amount paid per cubic metre of timber by the
harvester to the owner of the timber resource (SEEA CF 5.380).
(i) Residual value method: In cases where such transactions cannot be observed, because,
for example, the forest operations are conducted in part by forest owners, it must be
calculated. Resource rent can be derived as the gross operating surplus from the harvest of
timber resources less the value of the user costs of produced assets used in the harvesting
process (SEEA Central Framework 5.378). For individual companies, stumpage value equals
raw wood prices minus the logging, transportation and stacking costs.
Using these resource rents, the stock of timber resources or future ecosystem service flow from the
timber stock can be valued following three approaches (mathematical details are given in Lange 2004:
Box 7.1):
(i) The NPV approach calculates the discounted value of the economic benefits from timber
that will be generated over a defined time span. It may be implemented using the average
stumpage price for all removals or by distinguishing stumpage prices for different timber
species. It can further differentiate between different cutting ages for different timber species
and the total area in age species age-class, while controlling for actual removals and natural
regrowth.
(ii) The Stumpage value approach is a highly simplified version of the NPV approach. It
multiplies physical stock with the average stumpage price of the timber removed. Where there
is a market for standing trees, the stumpage values are directly observable. In the absence of
such markets (or where market prices may be distorted), the stumpage value can be
estimated. Under highly restrictive assumptions (that the discount rate equals the natural
regrowth rate of the forest), this approach is the same as the NPV approach. This approach
may be refined by applying the stumpage price for different species to the remaining stock of
each species.
(iii) The Consumption value approach is a variant of the stumpage value approach where
stumpage value is distinguished not only by species but by age or diameter class as well. The
distinction between the two is that the stumpage approach uses the structure of fellings for
weighting stumpage prices, whereas the consumption approach uses the structure of the
stock.
91
Valuing firewood, charcoal and other NTFP
The resource rent generated by NTFP is the production value minus its extraction costs, which is
comparable to the stumpage value of timber. It is, in principle, the amount that someone would be
willing to pay to rent the forest in order to have access to the product.
If these NTFP are exchanged in formal markets and result in monetary transaction they are reported in
the SNA. Yet often NTFP, especially in developing country contexts, are exchanged in informal
markets or used to meet subsistence needs being produced or extracted for own-use (e.g. collection
of firewood from a nearby forest). The SNA has established principles for the inclusion of such non-
monetary transactions allowing three different approaches:
(i) Unit resource rent approach: Even if NTFP are widely used for informal exchanges or self-
consumption, market prices for the same or very similar product can be observed nearby (e.g. buying
charcoal at a local market). Local market prices for these goods may be used to value non-market
production taking care to account for regional variations in prices.
(ii) Replacement cost approach: A variation of this approach is to value forest products at the cost of
replacing them with close substitutes. For example, instead of eating bush meat, forest dwellers could
buy other meat at a local market.
(iii) Production cost approach: If there are no representative local market prices or close substitutes,
the production costs of the product can be taken. Where labor is the most significant production cost is
labor, products may be valued at the opportunity cost of the time it takes to gather them. An average
local wage can be used, which is adjusted for factors local and household-specific factors. Where
significant, additional, non-labor inputs are required, these should be included in estimating the
production cost.
As a general observation, forest accounts have most often measured the physical quantities and
production value of NTFP, but have not always calculated the value-added part or the resource rent.
In many contexts, such as the collection of firewood or hunting, the primary input is “free” household
labor without any cost expenditure being reported. In these contexts, the distinction between total value-added and in situ value is highly sensitive to the assumptions made about the opportunity cost
of labor. Only where there is extensive commercialization of forest products, other costs, such as
transportation, may become important.
Often estimates rely on local surveys of household NTFP extraction and self-consumption and sales
(such as in Godoy et al. 200016; Schaafsma et al. 201217). These are then upscaled to a regional or
even national level assuming the same values across different communities or even regions. Although
this is a practical approach, these values may differ substantially from the real, locally specific values.
As the use and value of non-market forest products depends on many local factors which can vary
enormously even within a region, such as the availability of forest products, alternatives available to
local communities, opportunities for selling products in local markets and local demand, locally
differentiated values should be applied where possible.
16 Godoy, R., Wilkie, D., Overman, H., Cuvas, A., Cubas, G., demmer, J., McSweeney, K., Brokaw, N. (2000). Valuation of consumption and sale of forest goods from a Central American rain forest. Nature 406, 62-63. 17 Schaafsma, M., Morse-Jones, S., Posen, P., Swetnam, R.D., Balmford, A., Bateman, I.J., Burgess, N.D., Chamshama, S.A.O., Fisher, B., Green, R.E., Hepelwa, A.S., Hern+índez-Sirvent, A., Kajembe, G.C., Kulindwa, K., Lund, J.F., Mbwambo, L., Meilby, H., Ngaga, Y.M., Theilade, I., Treue, T., Vyamana, V.G., Turner, R.K. 2012. Towards transferable functions for extraction of Non-timber Forest Products: A case study on charcoal production in Tanzania. Ecological Economics 80, 48-62.
92
Valuing climate regulation and other regulating services
Given the importance of carbon sequestration and storage for climate change mitigation, there are a
number of market-based solutions being discussed that would generate payment flows for the
provision of such regulating services and thus turn them into market benefits (such as PES and
trading schemes). Although the value of carbon stored in timber resources and in forest ecosystems is
increasingly considered, up-to date there are no-commonly agreed accounting standards for its
valuation. With an increasing number of countries interested to take part in REDD+ activities, this,
however, becomes increasingly important. For the valuation of carbon related ecosystem services
(carbon sequestration and carbon storage) some different options may be possible:
(i) Damage cost approach: This approach estimates the costs of the global damage from climate
change averted by reducing emissions by a unit (e.g. tonne) of carbon. This value corresponds to a
social value concept. Exchange values are unlikely to be equivalent to these costs. The US
government recently decided to use a range of estimates centered at $21/tCO2 in cost-benefit
analyses.
(ii) Production costs approach: The costs of avoiding climate damages can be estimated through the
costs of climate change mitigation. These mitigation costs can be based on the production cost of
reducing emissions from deforestation and forest degradation, most of all the opportunity costs from
not converting forest land into other uses (see for detailed guidance World Bank, 201118). This
estimate can serve as a lower bound value as any market price would need to be above these
production costs. However, the link to the valuation of the specific ecosystem services needs to be
determined.
(iii) Rents: If market-based mechanisms are established rents per land unit can be calculated based
on the carbon sequestered and stored in above and below ground biomass. Payment levels per unit of
carbon could be based on:
- Carbon emissions tax: If countries levy such a tax, the tax per emission unit can be used to
value the carbon emission reductions through carbon sequestration.
- Price of carbon offsets: Carbon markets are currently discussed for an international climate
deal and a future REDD+ mechanisms. There are already a number of voluntary carbon
markets that trade carbon offsets. In 2011 carbon credits generated from REDD+ projects
have ranged between $4 and $11.5 per tCO2 emission reductions over the whole project
lifespan (Peters-Stanley et al. 201219).
- Payments for emission reductions: Carbon sequestration and storage could also be priced if
payment were made to land users through direct transfers from a national or international
climate fund, as is also discussed as part of an international climate deal and REDD+
mechanisms.
With the growing application of markets or payments for ecosystem services for other regulating
services (most prominently water-related services), these could also be considered for accounting
18 The World Bank. 2011. Estimating the opportunity costs of REDD+. A training manual. World Bank Institute, Washington DC. 19 Peters-Stanley, M., Hamilton, K., Yin, D., 2012. Leveraging the Landscape State of the ForestCarbon Markets 2012. Ecosystem Marketplace
93
purposes. Nonetheless, using these values is problematic as payments are often not outcome based
(i.e. conditional on the actual ecosystem services delivered), but activity-focused (i.e. conditional on a
certain land use practice which sometimes has not a clear link to the ecosystem services to be
provided) and there are large variations in payment levels depending on the location and purchaser.
Another example of ecosystem services that can form a forest related market good is genetic material.
Companies or research institutions pay for bio-prospecting schemes that grant research institutions or
private companies the right to use. Despite of being widely appraised as a potential market solution for
conserving forest biodiversity in the 1990s, they have only found limited application.
Valuing quasi-market benefits
Depending on the type of quasi-market benefit, they can be valued using different valuation
techniques, based on cost-based or revealed preference methods (see Table 6.2). Quasi-market
benefits enter the SNA through the production of the final market goods they contribute to. As such
they are implicitly recorded in the SNA. The valuation techniques described here only help to
portioning transactions so as to identify the contribution of forest ecosystem services. Accordingly,
these methods are based on observed market transaction.
Valuing ecosystem services that are substitutable inputs into non-forest
production
Ecosystem services that constitute substitutable inputs into non-forest production can be replaced by
other human produced services. Investment in these alternatives will only be made if the expected
damage from losing the ecosystem service is greater that the replacement costs. Such ecosystem
services can be valued based on the following cost-based approaches:
(i) Replacement cost method: The values of ecosystem services can be valued through the observed
expenditure for activities undertaken to compensate for a decline in the supply of this ecosystem
services. Examples include: costs of switching to alternative water sources or costs of water treatment when water quality in one source deteriorates, increased irrigation costs when water flows fluctuate,
dredging costs to remove soil sedimentation, or building landslide protection mechanisms in areas
prone to soil erosion.
(ii) Damage costs: Alternatively, the same ecosystem services could be valued through their damages
caused by their loss, such as health impacts due to deteriorated water quality, production losses due
to water shortages or landslide impacts due to soil erosion. Depending on the factors considered
these costs may not equate to an exchange value.
Valuing ecosystem services that are complementary inputs into non-forest
production
Ecosystem services that represent complementary inputs cannot be (easily) replaced by other inputs.
Losing these ecosystem services can cause damage costs, but these can only be estimated through
production functions.
94
(i) Production function method: These methods require an understanding of the relationship between
different inputs in production. They link production data to ecosystem conditions that relate to an
ecosystem service: for example changes in pollination activity and coffee yields20, soil retention and
increased farm productivity21, hydrological services and agricultural production22 as well as
hydropower generation through reduced soil sedimentation23. Based on assumptions about the
probability of finding a new species for pharmaceutical product development and the expected returns
of a new product, the value of genetic material has been estimated.24 25
Valuing ecosystem services that contribute to a heterogeneous market good
While some ecosystem services cannot be exchanged directly at markets due to their public good
characteristics, they can form a unique attribute of another market good. For example, recreational
services from forests can play a key role in tourism. Similarly, proximity to forest ecosystems with
unique species can provide knowledge and information services that research facilities or education
institutions (universities, schools) can benefit from.
Income flows related to forest-based tourism and research and education are recorded in the SNA
through a number of related industries, such as hotels, accommodation, restaurants and transport
benefiting from national and international tourists and housing, retail and transport benefiting from
people working in forest-related research and education. The contribution of forests to these income
flows may be singled out through entrance fees for national parks, hunting permits or access rights to
forest ecosystems. However, where these payments are not required, special valuation techniques are
needed.
(i) Hedonic price method have been widely applied to assess how environmental amenities affect
property prices – mostly in urban contexts. For ecosystem services with spatial variation, this method
can be applied to reveal the marginal price (or implicit price) of forest related attributes (e.g. proximity
to forest or presence of unique animal or plan species). The advantage of these methods is that they
present the value of an ecosystem service based on the market transactions for a standard market
good. The drawback is that in most developing country contexts, the data available to apply this
method will not provide a sufficient sample size.
(ii) Travel cost method: Data collected from visitors to a specific forest site can reveal the value of the
recreational services provided by that site through the travel costs and time incurred. As consumers
would only be willing to accept this cost, as long as the benefits from the recreational services
provided are larger, travel costs can be interpreted as a marginal value for these services. There are
several shortcomings though. Firstly, travel costs only represent part of the full costs incurred. And
20 Ricketts, T.H., Daily, G.C., Ehrlich, P.R., Michener, C.D. 2004. Economic value of tropical forest to coffee production. Proceedings of the National Academy of Sciences of the United States of America 101, 12579-12582. 21 Pattanayak, S. K., Mercer, E.. 1998. Valuing soil conservation benefits of agroforestry practices: Contour hedgerows in the eastern Visayas, Philippines. Agricultural Economics 18 (1): 31–46. 22 Klemick, H. 2011. Shifting cultivation, forest fallow and externalities in ecosystem services: Evidence from the Eastern Amazon. Journal ofEnvironmentalEconomicsandManagement61(2011)95–106 23 Arias, M. E., Cochrane, T. A., Lawrence, K. S., Killeen, T. J., & Farrell, T. A. 2011. Paying the forest for electricity: a modelling framework to market forest conservation as payment for ecosystem services benefiting hydropower generation. Environmental Conservation 38(4): 473-484. 24 Costello, C., Ward, M.B. (2006) Search, bioprospecting and biodiversity conservation. Journal of Environmental Economics and Management 52(3): 615-624 25 Simpson, R. D., Sedjo, R. A., and Reid, J. W. 1996. Valuing Biodiversity for Use in Pharmaceutical Research. Journal of Political Economy, 104 (1): 163-185.
95
more importantly, it only relates to the benefits experienced in one specific site (e.g. having access to
a certain area of natural forests) and does not compare to other sites (e.g. having access to a larger
area of natural forest somewhere else). Applying discrete choice models with data collected from
different sites can help to explain how much consumers would be willing to pay to travel to a forest site
with specific attributes.
(iii) Stated preference methods have found wide application in the environmental economics literature
to value recreational services in forest contexts through the willingness to pay for visits to forest
reserves, including CV in Costa Rica26 and Bolivia27 and CE in Uganda.28 In order to derive values that
are compatible with SNA estimates, stated preference need calculate marginal values. Such values
can be calculated through a special framing of the survey questions (e.g. willingness to pay to have
access to one more hectare of a forest ecosystem), although this can bring design challenges and
marginal values for unconstrained goods are likely to be zero.
Valuing non-market benefits
Non-market benefits represent public goods (non-rival and non-excludable) that are not linked to any
market good, such as the cultural heritage value for local forest dwellers in the Amazonian rainforest
or the existence and/or altruist value for a consumer in Europe from knowing that this rainforest area
exists and others take benefit from it.
The contribution of ecosystems to these benefits cannot be linked to any market goods and thus
cannot be inferred from any market transactions. However, their economic values can be estimated
through stated preference methods.
(i) Stated preference methods can return values for any ecosystem service based on the consumers’
choices of different scenarios in hypothetical market contexts (e.g. choose between paying a donation
for preserving a unique forest ecosystem and no payment but degradation of that forest). Some
studies have applied these methods to derive consumers’ willingness to pay for the existence of
forests with unique plants, animals and/or landscapes in other places.29
While these methods can be designed so as to calculate marginal values, for non-market benefits that represent unconstrained goods these would be zero. Furthermore, by definition non-use benefits
cannot be linked to an exchange value concept
26 Chase, l.C., Lee, D.R., Schulze, W.D., Anderson, D.J., 1998. Ecotourism demand and differential pricing of national park access in Costa Rica. Land Economics 74 (4): 466–482. 27 Ellingson, L., Seidl, A. 2007.Comparative analysis of non-market valuation techniques for the Eduardo Avaroa Reserve, Bolivia. Ecological Economics 60 (3): 517–25. 28 Naidoo, R. and Adamowicz, W. L. 2005. Economic benefits of biodiversity exceed costs of conservation at an African rainforest reserve. Proceedings of the National Academy of Sciences of the United States of America, 102 (46): 16712-16716. 29 Rolfe, J., Bennett, J., and Louviere, J. 2000. Choice modelling and its potential application to tropical rainforest preservation. Ecological Economics, 35 (2): 289-302.
96
6.7 Challenges
Although there are a growing number of valuation studies, many of these suffer from some of the
following general shortcomings:
(i) it is often difficult to quantify ecosystem services and the benefits from them and the data
availability in many developing countries is rather weak,
(ii) the methods and underlying assumptions can vary so that monetary estimates are often
not comparable,
(iii) many valuation studies do not follow the SNA principles so that values are not comparable
to national accounts data; and
(iv) the distinction between the valuation of ecosystem services and benefits is not made
clearly and hence application of values for accounting purposes is difficult.
In addition, all valuation methods have a number of methodological barriers to implementation,
including:
(i) direct market valuation methods rely on observable market data which is often not available
for ecosystem services;
(ii) revealed preference methods are built on detailed information about individual behavior in
real market context and collecting sufficient quantities of such data to make the estimates
representative may be difficult;
(iii) stated preference methods have been challenged for their hypothetical nature and their
technical complexity;
(vi) benefit transfer methods depend very much on the number and quality of existing
valuation studies undertaken in similar contexts.
Consequently, while designing existing valuation methods so that values are compatible with SNA is
possible, it is likely to require the collection of new data. This bring with it the challenge of upscaling
estimates for a number of study sites to a whole country.
The following points highlight some specific aspects and other challenges in measurement and
interpretation:
• Marginal values (i.e. the value of small incremental changes in land use) are more meaningful
in informing policy decisions than absolute values or average values, but are more difficult to
compute.
• Valuation is challenging under non-linear relationships and threshold effects, which would
require the consideration of large value changes for small changes in ecosystems.
• Monetary values depend on understanding where resources and ecosystem services originate
and where they create benefit for humans, but often these spatial relationships are highly
complex (e.g. flow of water or sediments through space).
• Estimates of NPV depend on assumptions about the future (which is highly unpredictable) and
discount rates (which is often a political choice).
• Values are highly sensitive to fluctuating commodity prices and changing personal
preferences.
97
• There is a risk of double counting when valuing different ecosystem services.
• Estimation using exchange values only will likely under-value the contribution of forests to the economy from a social policy perspective. The same is true for the valuation of health and
education in the national accounts. Thus for different policy purposes different valuation
considerations and methods should be applied.
• Monetary valuation is based on the concept of weak sustainability so that monetary accounts
will suggest that all natural capital could be replaced by human-made capital (but there are
critical functions, tipping points and irreversible changes).
• Putting values on forests may be politically contested (e.g. commodification of nature)
• Monetary valuation ignores multiple dimensions of human well-being and the plural ways
values are expressed.
98
References
(to be completed)
99
www.wavespartnership.org
Wealth Accounting and the Valuation of Ecosystem Services
Wealth Accounting and the Valuation of Ecosystem Services (WAVES) is a global
partnership led by the World Bank that aims to promote sustainable development
by ensuring that natural resources are mainstreamed in development planning