56
Forest Governance and Timber Trade Flows within, to and from Eastern and Southern African Countries Tanzania Study February 2014

ForestGovernanceandTimberTradeFlows
within,toandfromEasternandSouthernAfricanCountries
TanzaniaStudy
February 2014

Trade Flows within, to and from East African Countries, Tanzania Study 2| Page
Table of Contents ABBREVIATIONS ............................................................................................................................................ 4
BACKGROUND .............................................................................................................................................. 6
EXECUTIVE SUMMARY .................................................................................................................................. 7
1. INTRODUCTION ................................................................................................................................... 10
2. THE FOREST SECTOR ............................................................................................................................ 11
2.1 TYPES, USE AND OWNERSHIP STATUS .................................................................................................................... 11 2.2 GOVERNMENT INDUSTRIAL PLANTATIONS ............................................................................................................... 11 2.3 FORESTS ON GENERAL LANDS ............................................................................................................................... 12 2.4 PRIVATE COMPANY AND LOCAL COMMUNITY PLANTATIONS ....................................................................................... 12 2.5 PRODUCTION NATURAL FORESTS ........................................................................................................................... 13
3. CITES ................................................................................................................................................... 14
4. FOREST ADMINISTRATION ................................................................................................................... 15
4.1 CENTRAL GOVERNMENT ...................................................................................................................................... 15 4.2 LOCAL GOVERNMENT AUTHORITIES (LGA) .............................................................................................................. 16 4.3 POLICE, JUDICIARY AND TANZANIA REVENUE AUTHORITY (TRA) ................................................................................. 16 4.4 VILLAGE GOVERNMENTS ...................................................................................................................................... 17 4.5 THE PUBLIC, PARLIAMENT & POLITICAL PARTIES ...................................................................................................... 17 4.6 CIVIL SOCIETY ORGANISATIONS (CSO) ................................................................................................................... 17 4.7 DEVELOPMENTS PARTNERS .................................................................................................................................. 17
5. THE REGULATORY FRAMEWORK FOR TIMBER PRODUCTION AND HARVESTING, PROCESSING, TRANSPORT AND MARKETING ..................................................................................................................... 19
5.1 FOREST POLICY .................................................................................................................................................. 19 5.2 NATIONAL FOREST PROGRAMME (NFP) (2001 – 2010) .......................................................................................... 19 5.3 FOREST LEGISLATION ........................................................................................................................................... 20 5.4 LICENSING PROCEDURES FOR FOREST HARVESTING ................................................................................................... 20 5.5 LAW ENFORCEMENT ........................................................................................................................................... 21 5.6 INFORMATION AND MONITORING SYSTEM .............................................................................................................. 23 5.7 CERTIFICATION SYSTEMS ...................................................................................................................................... 24
6. THE FUELWOOD MARKET .................................................................................................................... 25
7. FOREST UTILISATION ........................................................................................................................... 25
7.1 WOOD AND NON‐WOOD PRODUCTS...................................................................................................................... 25 7.2 ECOTOURISM ..................................................................................................................................................... 25 7.3 FOREST CARBON TRADE ...................................................................................................................................... 26
8. THE FOREST INDUSTRY SECTOR AND DOMESTIC TIMBER MARKET ........................................................ 26
8.1 GENERAL .......................................................................................................................................................... 26 8.2 TIMBER ............................................................................................................................................................ 26 8.3 POLE TREATMENT PLANTS ................................................................................................................................... 27 8.4 WOOD BASED PANELS INDUSTRIES ........................................................................................................................ 27 8.5 PULP AND PAPER................................................................................................................................................ 27 8.6 ARTISANAL WOOD INDUSTRY ............................................................................................................................... 28 8.7 NON‐TIMBER FOREST INDUSTRY ........................................................................................................................... 28
9. TIMBER TRADE .................................................................................................................................... 28
9.1 EXPORT AND IMPORT OF PROCESSED WOOD PRODUCTS AND LOGS ............................................................................. 28 9.2 UTILITY POLES ................................................................................................................................................... 33 9.3 PROCEDURE FOR EXPORT OF FOREST PRODUCTS ...................................................................................................... 33 9.4 CUSTOMS PROCEDURES ....................................................................................................................................... 34
Trade Flows within, to and from East African Countries, Tanzania Study 3| Page
10. TRENDS AND KEY ISSUES...................................................................................................................... 34
11. ANECDOTAL INFORMATION AND STAKEHOLDER PERCEPTIONS ON ILLEGAL LOGGING AND TRADE ....... 35
11.1 GENERAL ..................................................................................................................................................... 35 11.2 SYSTEMIC MANIPULATION OF VOLUMES ............................................................................................................ 36 11.3 CORRUPTION ................................................................................................................................................ 37 11.4 LOW LEVELS OF AWARENESS ........................................................................................................................... 37 11.5 SHORTFALLS IN REVENUE ................................................................................................................................ 37 11.6 LOW LEVELS OF ENFORCEMENT OF LAWS ........................................................................................................... 37 11.7 UNFAIR BUSINESS PRACTICES ........................................................................................................................... 37
12. CONCLUSIONS AND RECOMMENDATIONS ........................................................................................... 38
12.1 CONCLUSIONS ............................................................................................................................................... 38 12.2 RECOMMENDATIONS ...................................................................................................................................... 39
REFERENCES ................................................................................................................................................. 41
ANNEX 1 TANZANIA’S TRADE IN SELECTED GROUPS OF WOOD‐BASED PRODUCTS (2000‐2011, BY PARTNER COUNTRY) .................................................................................................................................................... 42
ANNEX 2 LIST OF PEOPLE MET ...................................................................................................................... 50
ANNEX 3 TABLES OF THE UN COMTRADE DATA USED ................................................................................... 51
List of Tables
TABLE 1 FOREST DISTRIBUTION BY TYPE, USE AND LEGAL STATUS (000HA) ................................................................................. 11 TABLE 2 DISTRIBUTION OF GOVERNMENT FOREST PLANTATIONS ............................................................................................... 12 TABLE 3 PRIVATE COMPANY INDUSTRIAL FOREST PLANTATIONS ................................................................................................ 13 TABLE 4 POLE TREATMENT PLANTS IN IRINGA REGION OF TANZANIA (2010) ............................................................................... 27
List of Figures
FIGURE 1 TANZANIA’S TRADE IN WOOD‐BASED PRODUCTS (RWE VOLUME BASIS) ......................................................................... 29 FIGURE 2 TANZANIA’S SAWN WOOD EXPERTS (BY DESTINATION COUTRY) .................................................................................... 30 FIGURE 3 TANZANIA’S TRADE IN WOOD‐BASED PRODUCTS (2011) ............................................................................................. 31 FIGURE 4 TANZANIA’S EXPORTS OF LOGS (BY DESTINATION COUNTRY) ......................................................................................... 32 FIGURE 5 TANZANIA’S IMPORTS OF VPA CORE PRODUCTS ........................................................................................................ 42 FIGURE 6 TANZANIA’S EXPORTS OF VPA CORE PRODUCTS ......................................................................................................... 43 FIGURE 7 TANZANIA’S IMPORTS OF OTHER TIMBER SECTOR PRODUCTS ........................................................................................ 44 FIGURE 8 TANZANIA’S EXPORTS OF OTHER TIMBER SECTOR PRODUCTS ......................................................................................... 45 FIGURE 9 TANZANIA’S IMPORTS OF PAPER SECTOR PRODUCTS .................................................................................................... 46 FIGURE 10 TANZANIA’S EXPORTS OF PAPER SECTOR PRODUCTS .................................................................................................. 47 FIGURE 11 TANZANIA’S EXPORTS OF LOGS ............................................................................................................................. 48 FIGURE 12 TANZANIA’S EXPORTS OF SAWN WOOD .................................................................................................................. 49
List of Boxes
Box 1 Procedure and Conditions for Forest Harvesting ............................................................................................... 21

Trade Flows within, to and from East African Countries, Tanzania Study 4| Page
Abbreviations
AAC Annual Allowable Cut
CBFM Community Based Forest Management
CDC Commonwealth Development Corporation
CDM Clean Development Mechanism
CE Chief Executive
COC Chain of Custody
CSO Civil Society Organisation
CSO Civic Society Organisation
DC District Commissioner
DED District Executive Director
DFHC District Forest Harvesting Committee
DFO District Forest Officer
EAC
EU
East African Community
European Union
FAO Food and Agriculture Organisation
FBD Forest and Beekeeping Division
FLEGT Forest Law Enforcement, Governance and Trade
FMP Forest Management Plan
FR Forest Reserve
FSC Forest Stewardship Council
FSU Forest Surveillance Unit
FTI Forestry Training Institute
GDP Gross Domestic Product
GO Governmental Organisation
GoT Government of Tanzania
GRL Green Resources Limited
IGO Inter‐governmental Organisation
ISSMI Integrated Stock Survey Management Information
LGA Local Government Authority
MAB
MDF
Management Advisory Board
Medium Density Fiberboard
MEAs Multilateral Environmental Agreements
MNRT Ministry of Natural Resources and Tourism
MPM Mufindi Paper Mills
NBS National Bureau of Standards

Trade Flows within, to and from East African Countries, Tanzania Study 5| Page
NEMC National Environment Management Council
NFP National Forest Programme
NGO Non‐Governmental Organisation
NTFP Non‐ Timber Forest Products
PA Protected Area
PERS. COM. Personal Communication
PMO Prime Minister’s Office
RA Regional Administration
REDD Reduction of Emissions From Deforestation and Forest Degradation
RNRO Regional Natural Resources Officer
SFM Sustainable Forest Management
TAFORI Tanzania Forest Research Institute
TANAWAT Tanganyika Wattle Company
TFS Tanzania Forest Service
TFWG Tanzania Forestry Working Group
TIN Tax Identification Number
TRA Tanzania Revenue Authority
VAT Value Added Tax
VCS Voluntary Carbon Standard

Trade Flows within, to and from East African Countries, Tanzania Study 6| Page
Background This study of timber flows within, to and from Tanzania has been prepared as a part of a wider study
that covered nine countries in Eastern and Southern Africa, with an identical objective in each to these
countries that consisted of two main parts:
1. To provide a baseline of the wood based trade flow information
2. To provide an overview and analysis of the regulatory framework for timber production,
processing and trade.
The study is quite timely considering that widespread illegal logging in recent years has had a
devastating effect on the valuable forest resources in the countries in this part of Africa, which has had
not only environmental consequences but also economic and social ones. The response by the European
Commission has been the introduction of FLEGT, the Forest Law Enforcement, Governance and Trade
Action Plan, to provide a set of measures to prevent illegally harvested timber from reaching the
European markets. With the European Union Timber Regulation, EUTR, the placing of illegal timber on
the European market has been prohibited starting from 3 March 2013.
Against this background, it becomes important to understand the dynamics of the timber trade flows
not only in Tanzania but also in Eastern and Southern Africa, including the volume and value of the
trade, within, to and from these countries, and the potential interest that individual countries might
have in improving forest management and entering into VPAs. This study has therefore identified many
burning issues that need to be addressed to prevent illegal logging and trade in illegally harvested
products, in Kenya as well as in the other countries of the study.
The study has produced nine comprehensive country reports, each of 50‐60 pages, covering Burundi,
Kenya, Madagascar, Mozambique, Rwanda, South Africa, Tanzania, Uganda and Zambia, in addition to
one Summary Report. This particular country report, on Tanzania, was prepared by Jones Ruhombe.
Trade Flows within, to and from East African Countries, Tanzania Study 7| Page
Executive Summary Tanzania has about 33 million ha of forests and woodlands, or almost 40% of the total land area of the
mainland. About 13 million ha of the forests are gazetted as forest reserves including 85,000 ha of
industrial plantations and 1,6 million ha of strategic forests that serve important water catchment
functions. Mangrove forests cover some 115,000 ha.
There are 223 gazetted forest reserves, protective as well as productive, under the management of the
central government while 168 forest reserves are under local governments. The latter reserves are a
major source of income generation for the districts, covering 1.5 million ha.
Major species in the plantations include pines, cypress, eucalypts and teak. The Sao Hill Forest
Plantation covers about 50% of the total planted area and dominates the wood supply in the country,
currently supplying over 85% of the raw material consumed by the forest industries.
Forests on general land, covering 19 million ha, are outside of the protected areas. Most production of
timber and fuelwood takes place in these forests which the rural population depend on for livelihoods
and survival. The general land’s forests are poorly managed and prone to constant pressure from
conversion to other land uses especially agriculture, shifting cultivation and settlements.
There are also hundreds of smaller so called village land forest reserves, a most unique concept whereby
villages and villagers now are managing their own forest resources, working through village forest
management plans and village bylaw in such a cost effective and sustainable manner that it has become
an example to other countries when it comes to participatory forest management.
Tanzania’s trade in wood based products is on the increase with timber exports being at the level of
250,000 m3. Export of sawn wood has increased while the export of logs has ceased. Kenya is a major
export market for sawn timber coming from the plantations. Other export destinations include the EU,
Japan and China. India has traditionally been the destination for most of Tanzania’s exports of sawn
wood, mostly teak. Much hardwood timber is being produced from the natural forests, by pit sawyers,
and the illegal harvesting is a major issue in the utilization of the indigenous forests.
Tanzania’s imports of timber primarily comprise sawn wood from Malawi and Mozambique and
plywood, other panels and furniture from China. The bulk of sawn wood from Mozambique comes from
natural forests, most of it illegally across the Ravama River, forming the southern border. South Africa
and the EU account for most of the paper which Tanzania imports. EU does not import a substantial
quantity of wood based products from Tanzania, i.e. a round‐wood equivalent volume smaller than
3,000 m3 each year.
Until 2011, the mandate for forest management and administration was under the Forest and
Beekeeping Division, a line department in the Ministry of Natural Resources and Tourism. The Forest
and Beekeeping Division was also responsible for technical training, research and deployment of staff to
manage central government forests. In 2011 there was a sector reform which created a semi‐
autonomous agency, the Tanzania Forest Service with functions to manage central government forest
reserves and forest resources on general land. The Forest and Beekeeping Division remains with
responsibilities of policy development and legislation and the supervision of their implementation.
The current forest policy came into force in 1998. The policy was given legal force by the Forest Act of
2002 and was operationalized through the Forest Regulations of 2004 which vests the responsibility of
managing forest resources into various stakeholders. The policy emphasises participatory management
and decentralization. These are radical changes from the earlier forest policy and legislation that
focused on preservation and control under centralized management.

Trade Flows within, to and from East African Countries, Tanzania Study 8| Page
The Tanzania Forest Act of 2002 and the Forest Regulations of 2004 provide the principal legislation for
management of all forests in Tanzania. The Act is a comprehensive and enabling law that captures all the
tenets of contemporary principles of forest management.
A number of sections in the Forest Act of 2002 apply to the harvesting and trade in forest products. It
prohibits anyone from removing any forest produce within a national or local forest reserve without the
necessary concession, license or permit. The procedures for applying for, screening, granting and
revoking such permits are also specified by the Act. The Forest Regulations of 2004 outline procedures
and conditions for the application, grant, variation, refusal, extension or cancellation of licenses, permits
or concessions. The regulation of felling, removal and transportation of forest produce is also well
covered.
To control the utilization of forest products and to ensure that harvesting and transportation are done in
accordance with regulations and procedures laid down in Forest Act, the Forest Surveillance Unit (FSU)
was established in 2005/2006. During patrols and at checkpoints, documents are examined for
authenticity and logs inspected for hammer‐marks. The FSU staff can stop any truck on any road for
inspection, they can mount temporary checkpoints, visit harvesting areas and stores for forest produce.
Any forest produce that is non‐compliant is impounded.
According to the Forest Act (2002) timber exporters are required to possess a valid export certificate
issued by the Director of Forestry and Beekeeping for each shipment. Applications for the permission to
export forest products are to be accompanied by a range of documents including a valid trading license,
tax clearance certificates etc. Export certificates may only apply to graded timber whose origin and
grade tallies with the timber markings. Timber inspection before export, including grading and marking,
can only be conducted by those authorized by the Director. An authorized timber grader must conduct
grading before the shipment is made. It should be noted that export of logs of any tree species is
prohibited by law.
Forest certification in Tanzania is confined mainly to a handful of commercial forest plantations in the
southern highlands of the country. One estate of around 30,000 ha is certified, some have stopped and
some others are interested.
Prior to commencement the privatization policy in the 1990s, the forest industry in Tanzania was
dominated and owned by the government through Tanzania Wood Industry Corporation, TWICO.
Activities at the time revolved around mechanical wood processing through sawmilling, furniture
making and joinery but also other forest‐based industries including small‐scale paper and board
production, match making, poles production, chipboard, fibreboard and blackboard manufacturing and
tannin extraction. Industrial wood consumption stood at an average 750,000 m3 a year.
Currently, the wood‐based forest industry in Tanzania is dominated by sawmilling and furniture making.
The number of registered sawmills is now almost 400, most of which are small‐scale with an annual log
input not exceeding 5,000 m3 and employing about 5‐8 persons. The total utilization capacity of these
mills is, however, less than 50% of the theoretical capacity. The government plantations are supplying
80% of the industrial round‐wood, most of them found at the Sao Hill forest plantation. One pulp and
paper mill at Mufindi produces 40,000 ton of kraft paper annually, for domestic and international
markets. There are several pole treatment plants producing good quality poles.
There are reportedly far reaching problems of corruption in Tanzania. Illegal activities take the form of
logging without documentation, logging in unauthorized areas, under‐declaration of volumes leading to
undervaluation and the use of invalid export documentation. One result is a considerable shortfall in
revenue collection.

Trade Flows within, to and from East African Countries, Tanzania Study 9| Page
Although the forestry sector of Tanzania has gone through a substantial sector reform which has given
communities wide and unique responsibilities when it comes to forest management and protection as
well as access to forestry products, the institutional capacity in law enforcement needs substantial
strengthening in order to curb illegal harvesting and trade in forest products.

Trade Flows within, to and from East African Countries, Tanzania Study 10| Page
1. Introduction The National Bureau of Standards (NBS) estimates the population of Tanzania at 34.6 million growing at
a rate of 2.8% per annum. Over 80% of Tanzanians live in rural areas depending on land and natural
resources for their subsistence. Agriculture is the mainstay of economy, contributing 45‐50% of Gross
Domestic Product (GDP) and employing 80% of the work force. With the second largest deposits in
Africa, gold accounts for 60% of exports and is replacing agriculture in terms of export value (Khan et al.,
2005).
Forests are important in Tanzania due to the many goods and services they provide, including wood and
wood products, water catchment protection, food security, fodder, medicine, fuel, shelter, employment,
recreation, habitats for wildlife, landscape diversity and carbon sinks and reservoirs. The forests contain
unique natural ecosystems, biological diversity and genetic resources and generate revenue from
various products and services, especially timber and non‐timber products, export earnings and tourism.
On average, the sector contributes over 3.3% of GDP per annum and employs about 3% of paid labour
and even a bigger proportion of people in informal forestry related activities. Forests are also important
safety nets for both rural and urban livelihoods. Total economic value of forest goods and services is
estimated at USD 2.2 billion per year, equivalent to 20% of the GDP (Ministry of Natural Resources and
Tourism ‐ MNRT, 2008).

Trade Flows within, to and from East African Countries, Tanzania Study 11| Page
2. The Forest Sector
2.1 Types, Use and Ownership Status Tanzania has about 33.6 million ha of forests (defined as land with at least 10 % tree crown cover,
naturally grown or planted, and/or 50 % or more of a shrub and tree regeneration cover including all
forest reserves of whatever kind declared under the law) and woodlands (having 5‐10% canopy cover)
constituting almost 40% of the total land area of the mainland. About 13 million ha of the forests are
gazetted as Forest Reserves (FRs) (forest area, either for production of forest products or for the
protection of water catchments and biodiversity values and controlled under the Forest Act of 2002.),
including 85,000 ha of industrial plantations and 1.6 million ha of strategic forests for water catchment
protection in addition to coastal mangroves. Gazetted forests are owned and managed by the central
and local governments through the Ministry of Natural Resources and Tourism. About 600,000 ha are
owned and managed by local governments. Forests on the general lands (non‐reserved forests) cover 19
million ha. Private and community forests include farm forests, natural forests on leasehold land and
traditional forests/trees and are estimated to cover 70,000‐150,000 ha. Forest distribution is given in
Table 1. Mean yield rates for plantations at 13m3/ha/year (Pine) and 16m3/ha/year (Eucalypts). Forest
loss, or deforestation, is estimated at over 400,000 ha per year (about 1%) and main causes for this are
charcoal production and pressure from other land uses.
Table 1 Forest Distribution by Type, Use and Legal Status (000ha)
Forest Type
Forests (other than mangrove forests) 1,141 (3.4%)
Mangrove forests 115 (0.3%)
Woodlands 32,299 (96.2%)
Use of forest land
Production forest area 23,810 (71%)
Protection forest area (mostly catchment areas) 9,745 (29%)
Legal status
Forest Reserves (public) 12,517 (37.3%)
Forests/woodlands in National Parks (public) 2,000 (6%)
Non‐reserved forest on general land (on private and public land) 19,038 (56.7%)
Source: National Forest Programme (2001)
2.2 Government Industrial Plantations Government of Tanzania (GoT) ‐ owned industrial plantations cover 85,000 ha. Major species include
pines (most dominant), cypress, eucalypts and teak. Annual allowable cut (AAC) potential is estimated at
about 1 million m3. Sao Hill Forest Plantation covers about 50% of the total planted area and dominates
the wood supply. It is currently supplying over 85% of raw material consumed by industries. Geographic
distribution of the government forest plantations in Tanzania is shown in Table 2. Each plantation has a
forest management plan covering 5 years.

Trade Flows within, to and from East African Countries, Tanzania Study 12| Page
Table 2 Distribution of Government Forest Plantations
Plantation Location Area (ha) Growing Stock (m3)
AAC 2009 (m3)
Sao Hill Iringa 41 604 10 231 598 1 034 765
Meru/Usa Arusha 5 710 419 089 14 423
North Kilimanjaro Kilimanjaro 6 200 394 068 25 000
West Kilimanjaro Kilimanjaro 6 019 302 987 17 931
Buhindi Mwanza 3 210 246 669 30 360
Kiwira Mbeya 2 637 118 735 1 738
Rondo Lindi 2 599 28 105 660
Kawetire Mbeya 1 956 128 243 7 585
Rubya Mwanza 1 906 125 933 4 964
Shume/Magamba Tanga 3 804 317 423 15 000
Longuza Tanga 2 450 155 892 18 459
Ukaguru Morogoro 1 700 18 897 ‐
Mtibwa Morogoro 1 410 87 271 24 155
Matogoro Songea 868 22 833 5 217
Ruvu‐Woodfuel Coast 633 ‐ ‐
Rubare Kagera 285 36 649 ‐
Total 82 991 12 634 392 1 200 257
Source: Forestry and Beekeeping Division (FBD, (2010)
2.3 Forests on General Lands Forests on general land are outside of Protected Areas (PAs), which include national, local authority and
village land forests and National Parks and Game Reserves, where the latter two are managed by
“Tanzania National Parks”. Most timber, wood‐fuel and non‐timber forest products (NTFPs) harvesting
takes place on general land. Rural people depend on them for livelihoods. These forests are poorly
managed and prone to pressures from conversion to agriculture, livestock grazing, settlements and
industrial development and also periodic fires. There has been no incentive for systematic management
of these forests leading to their degradation (30,000 ‐ 500,000 ha per year). The Draft Forest Policy
(2011) proposes to promote sustainable forest management (SFM) in these forests by establishing
village forest reserves (VFRs) with surveyed boundaries and management plans and managed under
Community Based Forest Management (CBFM). To‐date, 2,345,000 ha of VFRs are successfully being
managed under CBFM, representing 11.6% of unreserved forests (Axberg G. et al., 2011). There is no
information on how existing VFR are distributed in the country and it is not clear whether more VFR are
being created.
2.4 Private Company and Local Community Plantations Forest plantation development by the private sector is a new development in Tanzania, following
enunciation of the National Forest Programme (NFP) in 2001. Table 3 shows the key private companies
operating industrial plantations in the country. Privately‐owned forest plantations are some of the best‐
managed in Tanzania with some, as shall be seen later, qualifying for international certification. Tree
planting by local communities is taking place all over Tanzania and the area planted is estimated at
70,000 ‐ 150,000 ha.

Trade Flows within, to and from East African Countries, Tanzania Study 13| Page
Table 3 Private Company Industrial Forest Plantations
Planted Area (ha) Available Land (ha)
Mufindi Paper Mill 3 600 40 000
Tanganyika Wattle Company 14 500 Not known
Green Resources As 12 000 70 000
Kilombero Valley Teak Company 8 148 28 132
The New Forests Company 1 400 4 000
TOTAL 39 648 ~142 000
Sources: Tanzania Market Study (Indufor, 2011)
2.5 Production Natural Forests Total production area is estimated at 23.8 million ha with 9.3 million ha in 223 government FRs and 169
local governments FRs with a total area of 1.58 million. These produce about 4.5 ‐ 5.3 m3/ha of wood
annually (Forest and Bee‐Keeping Division – FBD, 2003) and are a major source of revenue for the
districts. The remaining 12.9 million ha is general land which also supplies most of wood‐fuel and some
of the timber. The forests on general land are relatively less stocked and are assumed to produce
between 0.58 – 3 m3/ha of wood annually (GoT, 2008). AAC in the forests is estimated at 87.7 million
m3. The main species exploited include Brachystegia spp in the “Miombo Woodlands”, Dalbergia
melanoxylon, Pterocarpus angolensis, Khaya anthotheca, Melicia excelsa and Afzelia quanzensis.
Trade Flows within, to and from East African Countries, Tanzania Study 14| Page
3. CITES Tanzania has been and continues to participate in the international forest policy dialogue and has
internalised most of the decisions into numerous national forest management instruments. The country
participated in the 1992 Earth Summit and is a signatory to all the three “multilateral environment
agreements” (MEAs) that were agreed. It “paid attention” to the MEAs and the ‘Non‐Legally Binding
Authoritative Forest Principles” that were also agreed to at Rio, as it reformed forest sector governance.
Tanzania was active in the subsequent dialogues under the Inter‐governmental Panel on Forests, Inter‐
governmental Forum on Forests and the United Nations Forum on Forests and is signatory to the
Convention on Trade in Endangered Species (CITES), the World Trade Organisation, International Tropical
Timber Organisation, African Tropical Timber Organisation, Convention for the Protection, Management
and Development of the Marine and Coastal Environment of the Eastern African region and related
Protocols and the Montreal Process. The country associates with the Committee on Forestry of the FAO
and African Forestry and Wildlife Commission, World Forestry Congress and Economic Commission for
Africa. There are also regional agreements such as the East African Community (EAC) and Southern
African Development Community and similar initiatives relating to forests to which Tanzania is signatory.
Tanzania ratified CITES in 1979 and the Convention entered into force in that country in 1980. Tanzania
has submitted annual reports every year since 1982. According to UNEP (2007), Tanzania does not
report export of any timber from species listed under CITES except “bark and extract” from Prunus
Africana, which is listed by IUCN as “vulnerable”. During 1998 ‐ 2005, exports reportedly amounted to
40,519 kg of bark, mostly exported for commercial purposes (94%) or scientific purposes (6%). The EU
was a significant importer of the bark. EU countries, however, reported import of 76,335kg of the bark
during 1998‐2005 from Tanzania. The variance is as a result of Tanzania failing to gather accurate
information (ibid). There is no up‐to‐date information regarding this trade.
Trade Flows within, to and from East African Countries, Tanzania Study 15| Page
4. Forest Administration
4.1 Central Government FRs (about 13 million ha) fall under authority of the GoT (National FRs), District Councils (Local Authority
FRs), village government (Village Land FRs), Private forests and Community FRs and are either
designated for production (managed for forest products) or protection (managed for water catchment
and/or biodiversity conservation functions). The remaining 19 million ha of forests, found outside the
reserve network, are on village and general lands. Forest management institutions include:
(i) Forest and Beekeeping Division (FBD);
(ii) Tanzania Forest Service (TFS);
(iii) National Environment Management Council (NEMC);
(iv) Tanzania Forestry Research Institute (TAFORI);
(v) Forestry Training Institute, Olmotonyi (FTI);
(vi) Local Government Authorities;
(vii) Tanzania National Parks; and
(viii) Ngorongoro Conservation Area Authority.
Until 2011, the mandate for forest management and administration was under FBD, a line department
in the MNRT. FBD was also responsible for technical training, research and deployment of staff to
manage central government forests. In 2011 there was sector reform with FBD remaining with the
responsibilities of policy development and legislation and supervising their implementation. In tandem,
there was created a semi‐autonomous agency, the TFS, with functions to, inter alia, to:
(i) Establish and manage central government natural forests, forest plantations and bee
reserves;
(ii) Manage forest and bee resources in general land;
(iii) Enforce forest a and beekeeping legislation in areas of TFS jurisdiction;
(iv) Provide forest and beekeeping extension services in areas of TFS jurisdiction;
(v) Develop TFS human resources;
(vi) Collect forestry and beekeeping revenue;
(vii) Market forest and bee products and services; and
(viii) Ensure ecosystem stability through conservation of forest biodiversity, water
catchments and soil conservation.
The Minister of MNRT appoints the Chief Executive (CE) of TFS. The Chief Executive is directly
answerable to the Permanent Secretary of MNRT, the latter being responsible for overseeing the
interests of GoT in general. There is a Ministerial Advisory Board (MAB) that advises the Minister on the
performance of TFS. In addition to the CE, the senior management team comprises of 3 “Directors”, 4
“Heads of Unit” and eight “Zonal Managers” (Eastern ‐ Coast, Morogoro and Dar es Salaam, Western ‐
Tabora, Rukwa and Kigoma, Southern ‐ Mtwara, Lindi and Ruvuma, Central ‐ Dodoma, Manyara and
Singida, Northern ‐ Arusha, Kilimanjaro and Tanga, Southern Highlands ‐ Mbeya and Iringa and Lake ‐
Mwanza, Shinyanga, Kagera and Mara). Zonal Managers are responsible for, inter alia, law enforcement.
TFS employs over 1700 professional, technical and support staff but while TFS is off to a good start, it is
Trade Flows within, to and from East African Countries, Tanzania Study 16| Page
still hampered by severe shortage of competent staff and the necessary logistics in view of the vast size
of the country.
4.2 Local Government Authorities (LGA) There are 30 administrative “Regions” in Tanzania each with a Regional Administration (RA) office. These
are field offices of the Prime Minister’s Office (PMO). As such they are parts of the central government
administration tasked with linking line ministries such as the FBD and TFS of MNRT and the independent
District government authorities. The Regional Natural Resources Officer (RNRO) from the respective RA
is supposed to advise and facilitate the implementation of Tanzania’s forest policy and strategy
downwards to district level. The RNRO is a central government employee reporting to PMO and not to
MNRT.
LGAs in Tanzania fall under the PMO, which is responsible for the development and delivery of services
to districts and villages. LGA is led by the District Executive Director (DED), reporting to the District
Council Chairman. Councillors make all decisions and set the policy direction for the district. Another
important figure is the District Commissioner (DC), directly appointed by the President and in charge of
the police and security services. At all sub‐national levels, forest management and administration is
under the PMO, save for central government FRs. MNRT and PMO are not structurally or functionally
linked to work together, which makes forest management and administration problematic. Departments
and LGAs tend to report to their line ministries and horizontal collaboration across ministries is not an
obligation.
Each of the 99 districts in Tanzania has a District Forest Harvesting Committee (DFHC) comprising of (i)
DC (Chairperson), (ii) DED (Secretary), (iii) District Water Engineer, (iv) District Forest Officer (DFO), (v)
District Natural Resources Officer, (vi) Village Executive Officers of adjacent villages and (vii) Village
chairpersons of adjacent villages. The functions of the committee include the following: (i) to receive
and process applications, (ii) to coordinate harvesting activities, (iii) to update harvesting plans for the
district, determine royalty for natural forests, and (iv) to receive quarterly reports on the harvesting
activities from the District Forest Officer (DFO). The committee meets four times a year in its ordinary
scheduled time. These functions together with other directives contained in the guidelines have been
gazetted as Government Notices No. 69 and 70. The main objective of creating the DFHC in 2006 was to
promote transparency and empower local communities to manage forest resources. The District
Forestry Officer is appointed by the elected District Council and is solely responsible for all technical
aspects of the work of the DFHC. In general, LGAs are plagued by unclear lines of command and political
interference of all kinds. They are also hampered by inadequate funding, corruption, poor downward
accountability and limited technical capacity.
Under the Environmental Management Act (2004), every village in Tanzania should have a Village
Environmental Committee. The Village Natural Resources Committee is a sub‐committee of the Village
Environment Committee. The principal functions of this latter committee are to oversee and manage
the harvesting of natural resources products, including forest products, from village forest, including
firewood, charcoal, logs, timber and poles. The committee determines harvesting areas within the
village forest and then prepares and coordinates harvesting plans and reviews quarterly reports on
harvesting activities with the Ward and District Forest Officers.
4.3 Police, Judiciary and Tanzania Revenue Authority (TRA) Laws and policies on forest resources require the TFS, police and judiciary to administer and enforce
them. TRA collects all the dues on forest products and bring to book the non‐compliant in accordance
Trade Flows within, to and from East African Countries, Tanzania Study 17| Page
with relevant laws. There is limited coordination between these four and accordingly many of the illegal
activities will persist.
4.4 Village Governments Village Governments have elected leaders in the Village Council headed by the Village Chair and
supported by a Village Executive Officer reporting to the LGA. At village level, the full Village Assembly
(every person above age of 18), the Village Chair, Village Executive Officer and subject matter specialists
(the latter appointed by the district) make all decisions, including those related to forestry. Village
communities live in and around forests which provide resources that are often a major asset and input
to their livelihoods. They want more ownership rights to the forests. They are both custodians and a
threat to forest resources depending on what incentives are driving their actions. Where agriculture
provides a more secure income and controls are weak, communities expand agricultural land into
forests. When livelihoods cannot be sustained by agriculture due to drought, marketing problems or
poor prices, people fall back to forests to provide an income. Also where and when the selling of forest
products provides greater incentives than conserving them, people fall back on exploiting them. Village
governments have no capacity whatsoever to administer and manage forests under their jurisdiction.
4.5 The Public, Parliament & Political Parties The general public in Tanzania is exposed to information about illegal logging and rampant corruption in
the forestry sector mainly through the media. Headlines in the print media such as “Corruption Cause of
Illegal Logs Trade” (Daily Times, 2nd November 2004), “Illegal Logging: Minister Admits Staff
Involvement” (The Guardian, 10th May 2006) and “Mayor’s Son in Wrangle over Illegal Logs Export” (This
Day, 1st December 2006) are quite common. The plunder of resources is seen as a loss to the nation and
the connection is made regularly between the loss of resources and the loss of revenue that could have
been used to improve social services in the country. Opposition parties are growing in strength on the
promise of dealing with corruption and mal‐practice, and the incumbent political party is trying to
resolve issues of corruption and poor governance in its own ranks. The parties still need to develop their
identity as current manifestos are not clear on policy on natural resources. However all parties are
currently mainly focussing on the overarching issue of corruption which is seen as requiring urgent
attention. Parliament has had heated debates on this issue and there is a new spirit of investigative
criticism and preparedness to identify the possible perpetrators of corruption. Ministers have had to
resign their posts due to the renewed interest.
4.6 Civil Society Organisations (CSO) Tanzania Forest Working Group (TFWG), a voluntary network of over 45 CSOs, is working on forestry
issues including forest law enforcement, governance and trade (FLEGT). TFWG membership includes
both local and international non‐governmental organisations (NGO). These organisations have access to
a broad range of stakeholders in their extensive networks. Eighteen TFWG member organizations are
collaborating on improving FLEGT and this collaboration has proved to be helpful. In this regard, the
work done by TRAFFIC on illegal logging in southern Tanzania in 2007 and the planned “Mama Misitu”
(mother forest) on FLEGT are of specific reference (Milledge, S. Et al., 2007).
4.7 Developments Partners Several development partners including, governmental (GOs), inter‐governmental (IGOs) and NGOs have
been and are still active in Tanzania’s forestry sector. GOs and IGOs have organised themselves into the
“Tanzania Development Partners Group” (DPG) in the belief that collective actions and coordinated

Trade Flows within, to and from East African Countries, Tanzania Study 18| Page
efforts should lead to significant improvement in effectiveness and quality of development assistance
while concurrently reducing transaction costs. DPG members supporting forestry include, inter alia,
Belgian Technical Cooperation, Canadian International Development Agency, Danish International
Development Agency, Norwegian Agency for International Development, (Africa Development Bank,
FAO, Finnish International Development Agency, Japan International Cooperation Agency, EU, United
States Agency for International Development, United Nations Development Programme, Ireland,
Netherlands, Swedish International Development Agency, Department for International Development of
the UK and the World Bank. Many international NGOs are also active in Tanzania’s forestry including
TRAFFIC, International Union for Conservation of Nature, World Wildlife Fund for Nature and CARE
International. The foregoing indicates that forestry in Tanzania is not short of “official development
assistance”.
Trade Flows within, to and from East African Countries, Tanzania Study 19| Page
5. The Regulatory Framework for Timber Production and Harvesting, Processing, Transport and Marketing
5.1 Forest Policy The current Forest Policy came into force in 1998. The policy was given legal force by the Forest Act No.
14 of 2002 (Cap. 323) and is operationalized through the Forest Regulations of 2004. It vests the
responsibility for managing forest resources into various stakeholders. The policy emphasises
participatory management and decentralization. These are radical changes from the earlier forest policy
and legislation that focused on preservation and control under centralized management. The overall
goal of the policy is “to enhance the contribution of the forest sector to the sustainable development of
Tanzania and the conservation and management of her natural resources for the benefit of present and
future generations”. Its objectives include to:
(i) Ensure sustainable supply of forest products and services by maintaining sufficient forest
area under effective management;
(ii) Increase employment and foreign exchange earnings through sustainable forest‐based
industrial development and trade;
(iii) Ensure ecosystem stability through conservation of forest biodiversity, water catchments
and soil fertility; and
(iv) Enhance national capacity to manage the forest sector in collaboration with other
stakeholders.
Since its enunciation in 1998, there have been changes in national macro‐economic and environmental
frameworks and global obligations, which have necessitated its revision. A final draft of an updated
policy was issued in November 2011, emphasising the same broad objectives but with a few innovations.
Although GoT is portrayed as an omnipotent actor in charge of almost everything in the sector and other
stakeholders are left with marginal and/or supportive tasks, current state of forest degradation
convincingly indicates that GoT does not have the requisite capacity. For example, experience from
existing community based forest management projects has shown that communities can play a positive
role in FLEGT if given the full authority to manage the forests, yet there is no mechanism to link the non‐
governmental stakeholders to participate in planning for SFM.
5.2 National Forest Programme (NFP) (2001 – 2010) NFP was formulated and adopted as an instrument in 2001 for implementing the Forest Policy. The
objectives of the NFP are:
(i) Sustainable supply of forest and bee services to meet the needs at the local and national
levels;
(ii) Enhanced national capacity to manage and develop the forest and beekeeping sector in a
collaborative manner;
(iii) Enabling legal and regulatory framework for the sectors in place; and
(iv) Increase economic contribution, employment and foreign exchange earnings through
sustainable forest and beekeeping based industry development and trade of forest and bee
products.
NFP has four sub‐programmes including one on “Legal and Regulatory Framework”. It focuses on the
development of regulatory issues including the Forest Act, rules, regulations and guidelines to facilitate

Trade Flows within, to and from East African Countries, Tanzania Study 20| Page
operations of the private sector and participatory management. Implementation of the NFP has had
mixed results, especially in the area of FLEGT.
5.3 Forest Legislation The Tanzania Forest Act (No. 14 of 2002) and Forest Regulations (2004) provide the principal legislation
for management of all types of forests in Tanzania, irrespective of tenure or type. Revisions to forest
legislation have included the Forest Amendment Regulations (2006) and Charcoal Preparation,
Transportation and Selling Regulations (2006). The Act is a comprehensive enabling law that captures all
the tenets of contemporary principles forest management, providing for, among others:
(i) “Result‐based management” of forests through forest management plans (FMP);
(ii) Establishment and management of private forests;
(iii) Declaration and management of FRs;
(iv) Granting and administration of permits and licenses;
(v) Trade in forest products;
(vi) Conservation of trees and wild flora and fauna;
(vii) Management of forest fires;
(viii) Financing and establishment of the “Forest Fund”;
(ix) Offences and penalties thereof; and
(x) Miscellaneous sections on a wide range of issues.
While the Act is the “first call”, actual management of forests in Tanzania is supposed to reflect on a
number of other relevant laws, including (i) Local Government Authorities Act – 1982, (ii) Land Act –
1999, (iii) Village Land Act – 1999, (iv) Mining Act – 1998, and (v) National Environment Management
Council Act – 1983. These are the main laws anyone engaged in forest‐based business in Tanzania needs
to take into account. Tanzania is widely recognised as having a good policy and legal framework for the
forest sector. The forest management instruments are modern and well harmonised. The main problem
is inadequate implementation at all levels.
5.4 Licensing Procedures for Forest Harvesting A number of Sections of the Forest Act (2002) apply to harvesting of, and trade in, all forest products
irrespective of source. Section 26 prohibits anyone from removing any forest products within a national
or sub‐national forest without the necessary permission. The procedure for applying for, screening,
granting and revoking such permission is specified in Section 49 of the Act. Part V of the Forest
Regulations (2004) outlines procedures and conditions for the application, grant, variation, refusal,
extension or cancellation of the permission. Regulation of felling, removal and transportation of forest
products is covered in Part II of the regulations. All permissions are supposed to be governed by relevant
FMPs, and specify the forest, fees/royalties, commencement and expiry dates and other conditions.
Three types of harvest permissions are available (i) harvesting trees, logs and poles (FD1), (ii) firewood
collection (FD2), (iii) commercial charcoal and firewood collection (FD3).

Trade Flows within, to and from East African Countries, Tanzania Study 21| Page
Box 1: Procedure and Conditions for Forest Harvesting
Any person wishing to deal in forest product business must obtain a license from the GoT, specifying the
species and volume to be harvested;
Clients submit license applications to the DFHC;
Documents required to be attached with applications for a harvesting license include a valid trading license,
“Tax Identification Number (TIN) certificate, letter from the forest officer or village government and valid
license to trade in forest products;
DFHC receives and processes applications. It meets quarterly to receive and determine applications for
harvesting of forest products, coordinating harvesting activities and preparing a district harvesting plan;
After receiving the license, harvesters are required to report to the respective village government and to
present their felling license showing that all duties have been fully paid. Felling license indicates the harvest
area, species and volume and only marked trees are felled;
GoT forest officer has to first go to into the forest, measure the standing or felled trees to be harvested, and
mark them. Measurements taken must include the standing volume (in the case of standing trees) or log
volume (felled trees);
Harvestable trees must exceed the minimum girth, which is defined for each species (e.g. 75 cm for Dalbergia
melanoxylon, 165 cm for Afzelia quanzensis);
After felling at least 15 cm above ground and cross cutting, the stump should be marked with the licensee’s
registered property mark and stump number, whilst both ends of all logs should be marked with the property
mark, tree number and log number;
The harvester will obtain a transit pass from the forest office in order to move the products;
Traders should stop at all checkpoints named on the Transit Pass for inspection (the designation of forest
products and wood product checkpoints for enforcement and monitoring purposes is given in the Forest
(Amendment) Regulations (2006)
Traders are also expected to maintain a “Forest Products Stock Register”, and to maintain books and permits
for any future inspections;
It is an offence to remove forest products from the harvesting area without these documents;
Conditions pertaining timber felling include the volume, type, specification and quality of timber to be felled,
for sawmills, the operational hours of the day and for forest products exports, the quality, quantity,
specification controls and exit points.
Use of chainsaws for ripping is prohibited. It is allowed only for felling. Only manual saws and sawmills are
allowed for ripping;
License fees should be charged for standing trees or felled trees, and not on logs or planks removed from the
forest (e.g. in store, at landing site, or on lorry);
Village government, in collaboration with District Forest Officers, are supposed to supervise harvesting to
ensure that the harvesters are following the volumes, species and harvest areas specified on their license.
5.5 Law Enforcement During the peak of timber trade activity in southern Tanzania up to mid‐2004, collected revenue
represented barely 4% of what should actually have accrued from the timber harvested and
transported. In the last decade and in response to the foregoing and visible forest degradation, GoT has
implemented wide‐ranging measures to regulate the timber trade, to increase the financial benefits to
legitimate players and to control corruption. The measures introduced management tools and systems
but they are yet to bring under control trade in illegally acquired forest products. The measures include:
(i) Review of procedure for issuing licences for harvesting and transporting forest products;
(ii) Empowerment of village governments to manage forests;
(iii) Ban of exportation of all types of logs since July 2004;
(iv) Issuance of guidelines on forest harvesting and formation of and gazetting DFHC in 2006;
Trade Flows within, to and from East African Countries, Tanzania Study 22| Page
(v) Establishment of Forest Surveillance Unit (FSU) within TFS in 2006 with over 100 staff to
elicit compliance with the law;
(vi) Strengthening of checkpoints and improved security of documents used for harvesting;
(vii) Introduction of scanning of forest product exports at ports of exit;
(viii) Countrywide assessment of sawmills in 2005;
(ix) Establishment of a forest resources database in TFS; and
(x) Development and implementation of an improved forest revenue collection strategy.
TFS has had a “strategic plan” for the period July 2010‐June 2013 in which one of the objectives was to
reduce illegal activities to 20%, through strengthening law enforcement. In this regard, the following
have been done by the FSU:
(i) Eight FSU sub‐units in the 8 zones have been facilitated to carry out 65,000 patrol days;
(ii) A total of 100 staff have been trained on terrestrial surveillance techniques and 15 staff
trained on marine techniques;
(iii) Mangrove areas have increased by 16% from 115,500 ha to 133,480 ha;
(iv) “Water‐mark” documents for licensing have been introduced to control forgeries;
(v) 15 forest staff were trained on timber grading and inspection; and
(vi) Imposed a ban on export of all types of timber more than 4 inch thickness since July
2008 except for value added products.
The objective of establishing the FSU is to control the utilization of forest products by ensuring that
harvesting and transportation are done in accordance with regulations and procedures laid down in
Forest Act. Each of the eight Zonal Offices has an FSU crew of 15 Forest Offices in addition to support
staff that is on stand‐by “twenty four/seven”. They compile and maintain a database relating to all
aspects of law enforcement for the particular Zone. Two marine units equipped with speedboats have
also been established, one to patrol Dar‐es‐Salaam to Tanga and the other Dar‐es‐Salaam to Mtwara on
the Indian Ocean. The specific duties of the FSU include, among others, to:
(i) Make sure that rules, regulations and procedures of harvesting and transporting forest
products are adhered to;
(ii) Carry out patrols;
(iii) File monthly reports;
(iv) Control illegal harvesting of forest products;
(v) Control transportation of forest products;
(vi) Prosecute and handle cases in the court of law;
(vii) Protect forest and bee resources;
(viii) Collaborate with other patrols units from other sub‐sectors of the Ministry in protecting
illegal harvesting and transportation of forest products; and
(ix) Liaise with both the urban and local communities in the protection and control of harvesting
of forests products.
During patrols and at checkpoints, documents are examined for authenticity and logs inspected for
hammer‐marks. The FSU staff can stop any truck on any road for inspection; they can mount temporary
checkpoints, visit harvesting areas and stores containing forest products. Any forest products that are
Trade Flows within, to and from East African Countries, Tanzania Study 23| Page
non‐compliant are supposed to be impounded. Impounded forest products are auctioned. FSU,
however, faces a number of operational challenges including:
(i) Shortage of necessary logistics;
(ii) High demand for timber, which entices many to take risk because of the high profits;
(iii) Culprits transport illicit timber in closed trucks (box‐bodies) that are difficult to detect;
(iv) Political interference;
(v) Some of the culprits carry firearms which compromises the security of FSU crews;
(vi) Language barrier regarding imports from Mozambique as documents are in Portuguese and
FSU crew do not know the language;
(vii) Mixing of species and sizes of timber which makes inspection time‐consuming;
(viii) Un‐manned crossing points along rivers;
(ix) Timber products are shipped from places away from official ports;
(x) Low cooperation with the Zanzibar government. Timber is reported entering Zanzibar from
the mainland illegally. Whenever requested to stop allowing illegal forest products into
Zanzibar from the mainland, they retort “what does Zanzibar benefit from the Union”
(Tanganyika and Zanzibar forms the United Republic of Tanzania). This is reportedly
politically sensitive;
(xi) Over‐dependence on forests by some districts for their revenue which often makes them lax
when handling law enforcement.
At the sub‐national level, where most of the licensing for harvesting occurs, the system is compromised.
According to the guidelines for sustainable harvesting and trade in forest products, DFOs are on the
frontline of regulating forest management. They are advisors to the DFHC, issue harvesting licenses and
are required to assess harvesting inside the forest before hammer‐marking logs and stumps. Forest
products are transported within the District according to permits issued by DFOs, who are responsible to
the District Council and not to FBD or TFS. In this context, they are often under pressure to optimize
collection of revenues at the expense of sustaining forests and yet the share of forest royalties collected
is skewed 95% to 5% in favour of GoT. Thus DFOs may not be allocated a fair share of the District’s
budget since they are perceived to generate little benefit to the District. In many cases, DFOs do not
send data to FBD and TFS on licensed harvesting, fines and transit passes issued. The ability of TFS to
enforce this requirement is largely hampered by the fact that DFOs have no administrative link and
responsibility to MNRT but to PMO.
5.6 Information and Monitoring System Zonal Offices are supposed to maintain databases on law enforcement and these should feed into the
mega‐database at TFS headquarters (Selewin, R., per. com.). This mega‐database stores information on
exports, imports, domestic production, dates, species, volume, payments (in US$ and Tanzania Shillings),
products and licensees and can provide information depending on the query. FSU crews also prepare
monthly, quarterly and annual reports and briefs on special operations. The officer in charge of the
database was unwilling to divulge more information regarding the database and access to it. There is a
permanent unit responsible for forest inventory and is about to complete a forest inventory covering
the country for the first time ever.

Trade Flows within, to and from East African Countries, Tanzania Study 24| Page
5.7 Certification Systems Forest certification in Tanzania is not widespread and is confined mainly to commercial forest
plantations in the southern highlands of the country. Tanganyika Wattle Company (TANWAT) in Njombe,
originally owned by Commonwealth Development Corporation (CDC) was the first company to be
certified under the Forest Stewardship Council (FSC). The company manages close to 15,000 ha of forest
plantations composed mainly of Acacia mensii, pine and eucalypts. The company changed ownership
five years ago and the new owners are not keen on certification and FSC certification for TANWAT has,
therefore, been withdrawn due to the company’s failure to demonstrate willingness to manage their
forests according to the FSC principles, as the cost is high.
The second company to be certified under FSC in Tanzania is Green Resources Limited (GRL). Three
afforestation projects with a total area of 32,000 ha have been certified. The company has been able to
demonstrate the use of good practices in the management of their forests and this has resulted in
renewal of their FSC certification for the last 4 years consecutively. Kilombero Valley Teak Company
owned by CDC and FINFUND has attempted to be certified on several occasions without success. The
company with over 10,000 ha of high quality teak plantations has failed on account of not adhering to
the FSC principles and criteria in forest management. There have been issues related to land ownership
and conversion of natural forests into teak plantations.
Mpingo Project in Kilwa, has recently been FSC certified. The project deals with sustainable
management of African Blackwood (Dalbergia melanoxylon), a species threatened by over‐harvesting on
the coastal forests of Southern Tanzania. The project has assisted households in forming an association
for managing their natural forests on a sustainable basis. The focus is on management of the African
Blackwood, a valuable species famed for wood carvings. The project also involves controlled harvesting
and encouragement of natural regeneration and enrichment planting. As a result of FSC certification,
members of the association have gained recognition by the GoT and have accessed overseas markets for
FSC certified “African Blackwood”.
State forest plantations are not certified. GoT does not regard certification as a priority for its
plantations despite the fact that they continue to face management challenges due to shortage of funds,
occurrence of forest fires, attack by pests and diseases, illegal settlement and uncontrolled harvesting,
issues that can though be addressed through a proper management system guided by FCS principles.
The following features characterise forest certification in Tanzania:
(i) There is general ignorance on forest certification as a tool for good forest management;
(ii) Many forest companies reject certification because economic benefits are not obvious;
(iii) Certification costs are prohibitive. Only large forest owners can afford the fees; and
(iv) GoT is apathetic towards forest certification, yet as a custodian of public trust it has to take
the lead, which includes having state forests certified, in order inculcate a sense of confidence
in this effort. The recently‐formed national certification group is a positive step in the right
direction.

Trade Flows within, to and from East African Countries, Tanzania Study 25| Page
6. The Fuelwood Market The energy balance in Tanzania is dominated by biomass particularly wood‐fuel and this accounts for
about 90% of energy supply. Petroleum and electricity account for about 8% and 1% respectively while
solar, wind, and coal account for less than 1% of the energy consumed. For the foreseeable future,
wood‐fuel will continue to be the major source of energy in Tanzania. Total wood consumption was
estimated at 42 million m3 in 1999, of which 40.4 million m3 or 95% was consumed as wood‐fuel. Out of
this 26 million m3 was consumed in rural areas as fuel‐wood and 13.4 million m3 in the urban areas,
mainly as charcoal. Main rural industries using wood‐fuel in priority order are tobacco curing, fish
smoking, salt production, brick making, bread baking, tea drying, pottery, lime production and
processing of beeswax. Main sources of wood‐fuel for household domestic use in rural areas are trees in
farmland and unreserved village forest areas. Wood‐fuel supply in most of the rural areas is regarded as
a free good, and only cost input being labour spent to collect it. In the predominantly surplus rural areas,
the opportunity cost of such labour is almost zero. In urban and peri‐urban areas, however, supply
sources of fuel‐wood are relatively few because of depleted forests in their vicinity. Increasing demand
of charcoal in urban area has increased deforestation in the production areas mainly in unreserved
forestland and in some FR. The Tanzania public is becoming increasingly aware of the potential damage
to environment and livelihoods posed by uncontrolled tree harvesting. Many CSOs have been formed
and are fighting this scourge, an example of which is “Mama Msitu” public campaign.
The basic problem related to high dependence on wood‐fuel is lack of affordable alternative sources of
energy and shortage of wood energy conserving technologies. The fact that wood‐fuel is almost a free
good works as a disincentive for development of new technologies and utilization. Efforts to enhance
sustainable supply of wood‐fuel fall far short of the growing demand. It will remain difficult to alleviate
poverty in the country without ensuring sustainable and affordable energy supplies to the majority of
the people. This notwithstanding, 98 per cent of the Tanzania national budget on energy is directed to
development of electricity and fossil fuels, which account for only 9% of the total energy consumed and
is accessible to less than five per cent of the total population. The budget needs to reflect on the reality
on the ground.
7. Forest Utilisation
7.1 Wood and Non‐wood Products Use of forests in Tanzania is both extractive and non‐extractive. The former includes production of
timber, poles, panel products, paper and wood‐fuel while the latter is mainly tourism and forest carbon
trade (refer to Chapters 5 and 6 above for details on extractive use).
7.2 Ecotourism Eco‐tourism is considered as one of the alternative uses of natural forests, which has low negative
impacts to the ecosystem. It is a potential source of income and revenue for the government and
communities living adjacent to natural forests, as well as to private sector (tour operators, hotels etc.)
that could render services to tourism. Especially natural forests with high biodiversity values and scenic
beauty are considered to provide potential for ecotourism. The potential of eco‐tourism as an income‐
generating activity in forestry is still to be assessed and a strategy developed. Some issues, which will
slow down the development of this area, are poor infrastructure and lack of services and marketing.
Trade Flows within, to and from East African Countries, Tanzania Study 26| Page
7.3 Forest Carbon Trade Green Resources is the only company fully certified for carbon trade. Two of their projects have been
certified under the Voluntary Carbon Standard (VCS) while one project which started after the year 2000
has been certified as a “Clean Development Mechanism (CDM) project. In order for the projects to
improve on eligibility and quality of carbon offsets and attract good buyers, the forests have also been
certified under the Community, Carbon, and Biodiversity Alliance. This standard ensures that community
interests are safeguarded by companies seeking to sell carbon offsets in the market and that biodiversity
is not threatened in pursuit of generating carbon offsets.
Apart from the large planters like GRL, small scale tree planting by farmers is on the increase in the
southern highlands of Tanzania. Farmers are keen to access carbon funds but the process of getting into
carbon trade is not only complicated but expensive. Certification for carbon costs more than USD 20,000
per visit by overseas consultants and several visits are required before certification is concluded. Small
scale tree planters cannot afford such high expenses. Attempts are being made to form tree grower
associations in order to bring many small scale planters together and aggregate their potential credits
and hence lower the transaction costs.
Tanzania is one of the pilot countries for “Reduction of Emissions from Deforestation and Forest
Degradation (REDD+). With the assistance of the Norwegian government, nine pilot projects have been
started all covering natural forests and woodlands in the country. The pilot projects aim at collecting
data on the current status of forests in the country including an estimate of the growing stock. The
REDD+ process will be based on the VCS and it is expected that the government and the communities
will be compensated for protecting natural forests from destruction, which leads to release of carbon
from such forests. Not much information is available from the National REDD process at the moment.
8. The Forest Industry Sector and Domestic Timber Market
8.1 General Prior to commencement of the privatization policy in the 1990s, the forest industry in Tanzania was
owned by the government through Tanzania Wood Industry Corporation (TWICO). Activities included
mechanical wood processing through sawmilling, furniture making and joinery. The other forest‐based
industries were small‐scale paper and board production, match making, poles production, panel
products manufacturing and tannin extraction. Industrial wood consumption stood at an average
750,000 m3 a year distributed as follows ‐ industrial sawmilling 51%, pitsawing 20%, wood‐based
products 3%, pulp and paper mills 21% and joinery and furniture industry 5%. In 2001, industrial wood
consumption per capita was estimated at 1 ‐ 1.5 m3 per annum. Demand for sawn wood in the domestic
markets was expected to grow between 4 ‐ 6% per annum during the following ten years, i.e., 12,000 to
16,000 m3 a year and sustainable supply of saw‐logs from industrial plantations is estimated at 540,000‐
600,000 m3 a year. Most of the hardwood round‐wood is sourced from “general lands”. The formal
forest industry employs over 8000 skilled and non‐skilled workers (Milledge, S. Et al., 2007).
8.2 Timber Currently, the wood‐based forest industry in Tanzania is dominated by sawmilling, furniture and other
processed wood products. The number of mills has increased from about 140 in 1998 to 367 registered
in 2005 (Indufor, 2011). Most of these mills, however, are small‐scale with annual log input not
exceeding 5,000 m3 and employing about 5 ‐ 8 persons. The total installed capacity of the mills is

Trade Flows within, to and from East African Countries, Tanzania Study 27| Page
2,662,185 m3 per year of which 2,203,703 m3 is softwoods and 458,482 m3 is hardwood representing
83% and 17% respectively (FBD 2005), up from 750,000 m3 in 2001. The total utilization capacity of
these mills is, however, less than 50% of the installed capacity mainly due to shortage of saw‐logs.
Current saw log supply is estimated at 1.46 million m3, with government plantations supplying 79% of
the industrial round wood. In addition, there are over 400 small‐scale wood processing machinery
(locally fabricated circular saw or roller bench with rails), most of them operating at the Sao Hill forest
plantation, processing saw logs.
8.3 Pole Treatment Plants There are several pole treatment plants in the country and many of them produce good quality poles,
especially those using standard pole treatment plants. However, many are also producing poor quality
poles, especially those using local treatment by soaking or dipping poles into chemicals. These poles are
also found in the market causing consumers to be confused by poor quality products. In the poles sector
there are also numerous smaller operators as the business has been lucrative. Sourcing is done on
village level from family woodlots, only purchasing a few raw poles at a time. The poles are then often
treated in the local facilities and sold to larger operators. The largest treatment plants are listed in Table
4. It is noted that all have proper operating equipment. Total capacity is 350,000 annually, although
production is currently estimated at much less.
Table 4 Pole Treatment Plants in Iringa Region of Tanzania (2010)
Company District Capacity
Sheda Mafinga 15 000
TANSCAN Mafinga 15 000
Sao Hill Industries Mafinga 160 000
Tanwat Njombe 40 000
Lesheya Mufindi 30 000
MWPT Mufindi 70 000
Mwijage Makambako 15 000
TOTAL 345 000
Source: NFP (2001)
8.4 Wood Based Panels Industries Production of wood based panels in Tanzania is fairly small and there are about 3 factories only
(plywood and block‐board). TANWAT plans to build a new plywood mill in Tanzania and is also
considering an MDF investment. Raw material for an MDF plant is available but the economics of
sourcing have not been analysed yet. TANWAT has currently 14,000 ha of plantations, and is willing to
expand them, but has not been able to acquire suitable land for this purpose.
8.5 Pulp and Paper Mufindi Paper Mills (MPM) produces 40,000 tons of kraft paper annually. It sells its products to both
domestic and international markets, the latter including Kenya, Uganda, Malawi, Zambia, India, Sri
Lanka, Bangladesh, Malaysia, Vietnam, Iran, Egypt and Saudi Arabia. Plans are to increase the
production capacity to 100,000 tons and this will raise pulp wood consumption to 750,000 m3.
Additionally, annual fuel wood consumption at MPM will increase to 300,000 m3. Total round wood
consumption of the MPM would therefore exceed 1 million m3 annually. MPM is investing into its own

Trade Flows within, to and from East African Countries, Tanzania Study 28| Page
plantations. The company has a land bank of 30,000 – 40,000 ha and is planting annually 2,000 ha and
has in recent years planted a total of 4,000 – 5,000 ha.
8.6 Artisanal Wood Industry There are no reliable data to assess the supply and demand potentials and income generation
opportunities in this industry yet the products play a key role in improving rural livelihoods and
alleviating poverty. The major products are black‐wood pieces, carvings and curios. In 1999 the export
earnings from these products amounted to US$ 1.1 million or 30% of the total export value of forest
products including bee products. Development of artisanal wood‐based products is hampered by a
narrow and declining resource base (e.g. Muhuhu and Mpingo), lack of efficient production technologies
and poor marketing systems. Wood carving skills are also disappearing due to lack of prestige and
attractiveness of this profession.
8.7 Non‐Timber Forest Industry There is a large variety of NTFPs in Tanzania namely food, fruit, nuts, medicinal plants, gums, resins,
barks, natural dyes, aromatics and fibres. Some of these products have a significant positive impact on
rural households in terms of generating cash income and supplementing every day’s diet. Production of
NTFPs suffers from decline of forest cover, inadequate information on location and types of products,
non‐existence of local processing capacity to produce value‐added products. In addition the marketing
chain is inadequate , in terms of lack of organized marketing channels and availability of market
information. There is also poor awareness as regards the income‐generation and food security
potentials of NTFPs.
Only 3.5% of the production potential of the beekeeping sector is realized, with the national honey and
beeswax production being 4860 tons and 324 tons yearly, respectively. In 1999/2000 the export value of
bee products (i.e. beeswax and honey) was US$ 1.3 million or 35% or the total export value of the forest
products.
9. Timber Trade
9.1 Export and Import of Processed Wood Products and Logs TRA keeps a record of all trade, including forest products, for purposes of tax collection. It works
independently of line ministries and has a database. TFS itself maintains a registry for trade data of
forest products but these data are not well managed to generate regular information. Zonal Offices also
collect export data. TRA records show that there were large amounts of sawn timber passing through
Tanzania in 2007‐2008 – and sawn timber was imported from Malawi and then later exported to Kenya.
Figures 2 and 3 respectively show the volumes of export of assorted wood products and the destination
of the exports.

Trade Flows within, to and from East African Countries, Tanzania Study 29| Page
Figure 1 Tanzania’s Trade in wood‐based products (RWE volume basis)
Source: UN Comtrade, 2012
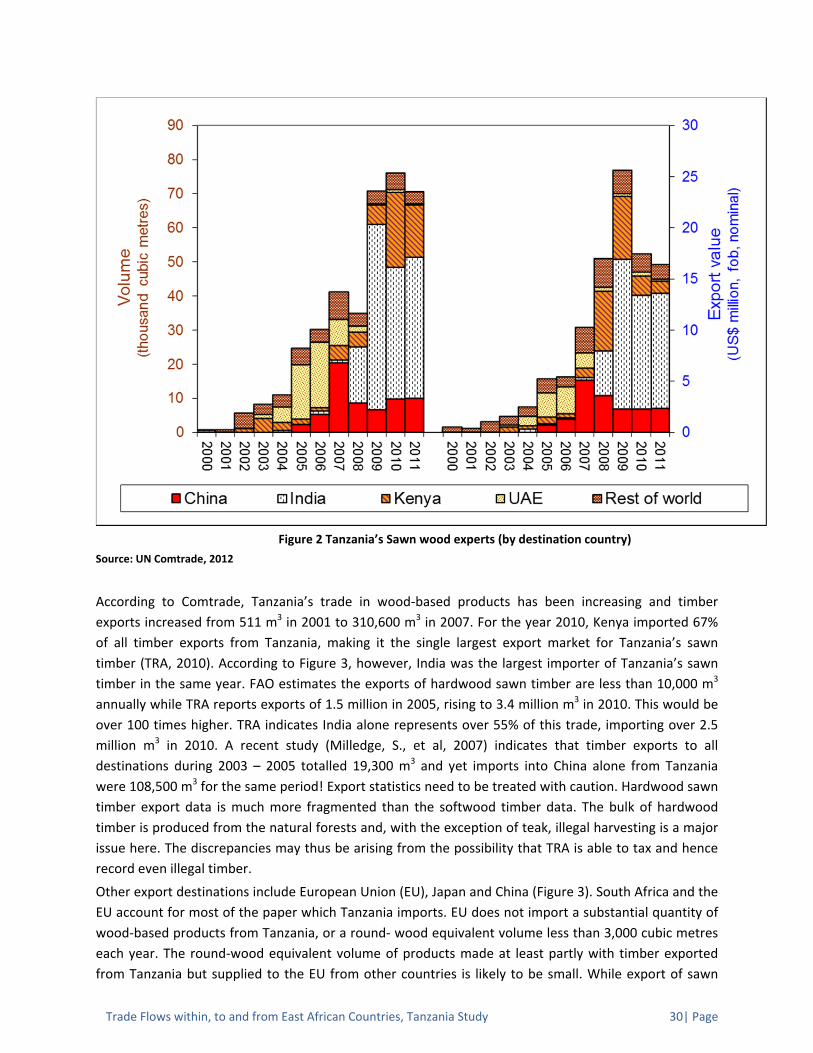
Trade Flows within, to and from East African Countries, Tanzania Study 30| Page
Figure 2 Tanzania’s Sawn wood experts (by destination country)
Source: UN Comtrade, 2012
According to Comtrade, Tanzania’s trade in wood‐based products has been increasing and timber
exports increased from 511 m3 in 2001 to 310,600 m3 in 2007. For the year 2010, Kenya imported 67%
of all timber exports from Tanzania, making it the single largest export market for Tanzania’s sawn
timber (TRA, 2010). According to Figure 3, however, India was the largest importer of Tanzania’s sawn
timber in the same year. FAO estimates the exports of hardwood sawn timber are less than 10,000 m3
annually while TRA reports exports of 1.5 million in 2005, rising to 3.4 million m3 in 2010. This would be
over 100 times higher. TRA indicates India alone represents over 55% of this trade, importing over 2.5
million m3 in 2010. A recent study (Milledge, S., et al, 2007) indicates that timber exports to all
destinations during 2003 – 2005 totalled 19,300 m3 and yet imports into China alone from Tanzania
were 108,500 m3 for the same period! Export statistics need to be treated with caution. Hardwood sawn
timber export data is much more fragmented than the softwood timber data. The bulk of hardwood
timber is produced from the natural forests and, with the exception of teak, illegal harvesting is a major
issue here. The discrepancies may thus be arising from the possibility that TRA is able to tax and hence
record even illegal timber.
Other export destinations include European Union (EU), Japan and China (Figure 3). South Africa and the
EU account for most of the paper which Tanzania imports. EU does not import a substantial quantity of
wood‐based products from Tanzania, or a round‐ wood equivalent volume less than 3,000 cubic metres
each year. The round‐wood equivalent volume of products made at least partly with timber exported
from Tanzania but supplied to the EU from other countries is likely to be small. While export of sawn

Trade Flows within, to and from East African Countries, Tanzania Study 31| Page
wood has increased, export of logs is supposed to have ceased having been banned in 1993. As Figure 1
shows, however, it is still going on albeit at a reducing scale. “Wood flour” has accounted for a
substantial share of Tanzania’s exports of wood‐based products during recent years. Tanzania’s
increasing exports of paper are destined mainly to Kenya (Figure 4).
Figure 3 Tanzania’s Trade in wood‐based products (2011)
Source: UN Comtrade, 2012
Tanzania’s trade in wood-based products (2011)
Key to products:
Sawn wood
Other wood
Logs
Paper
Fuel wood
Key to quantities:
20,000 m3
50,000 m3
100,000 m3
(arrow width proportional to roundwood equivalent volume)
estimated roundwood equivalent volume, based on data provided by Tanzania but presented in UN Comtrade
Note: excludes large, anomalous exports of wood flour to “Kenya”

Trade Flows within, to and from East African Countries, Tanzania Study 32| Page
Figure 4 Tanzania’s exports of logs (by destination country)
Source: UN Comtrade, 2012
Tanzania’s imports of timber primarily comprise sawn wood from Malawi and Mozambique and
plywood, other panels and furniture from China. The bulk of sawn wood from Mozambique comes from
natural forests and very little of that wood is reported as exports by Mozambique (tending to confirm
that it is illegal). It is unclear how much of the timber from Malawi originates from Mozambique, and
how much is subsequently exported to Kenya and elsewhere.
Based on data collected from the road checkpoint at Kibiti in 2007, approximately 12,000 m3 of sawn
timber was imported from Mozambique annually, worth around US $6 million. TRA estimated the value
of the timber at US $0.5 million in import tax and VAT and yet the amount actually may be as high as US
$2 million/yr. The amount of timber being imported from Mozambique has been steadily increasing
since 2006, as Tanzanian traders have been moving to Mozambique due to a combination of factors
including increased royalty rates, reduced issuance of harvesting licenses and increased enforcement in
S. Tanzania.
Timber enters Tanzania from Mozambique at four official entry points – by dhow at Mtwara port
(Shangani beach) and by canoe or boat across the R. Ravuma at Mwambo, Newala and Mtambaswala.
The bulk of the timber (around 90%) enters at Mtambaswala, about 250km inland from the coast and at
three unofficial entry points downriver between Mtambaswala and Newala. FSU visits the inland import
locations twice a month, on the 15th and 30th of each month and over the course of 2‐3 days, officials
travel to the official and unofficial entry points, check origin paperwork, hammer‐stamp the timber
which has built up at collection points in nearby villages, and issue letters to Tanzanian Customs
(Mtwara, TRA) confirming the legal origin of the wood and the quantity. Traders are then required to
visit the Mtwara TRA office to pay import duties before FSU issues transit pass to move the timber to
Trade Flows within, to and from East African Countries, Tanzania Study 33| Page
Dar es Salaam. Officials allow timber to enter the country at unofficial entry points although this is
prohibited.
Tanzania’s Auditor General considers the bulk of Tanzanian wood supplied for end use within Tanzania is
associated with at least some illegality. Much of this seems attributable to undocumented production.
However, others consider that there has been a substantial improvement in legality overall, particularly
since an exposé by TRAFFIC (Milledge, S. Et al, 2007). The failure of GoT to effectively minimise trade in
illegal timber has prompted at least one independent initiative to make it attractive for local peoples in
some parts of Tanzania to manage their high value trees through a fair trade scheme (which includes
some FSC‐certified products). The programme by “Mpingo Conservation Development Initiative” known
as “Sound and Fair” focuses on species of interest to the music industry and is a response to the
declining availability of suitable timber.
Eight further charts are presented in Annex 1. Six of these illustrate trends in the imports and exports of
three specific groups of product – “VPA core products” (defined as the products which must be included
in a VPA ‐ namely, logs, sawn wood, veneer and plywood), other products for the timber sector, and
products for the paper sector. The other two illustrate trends in products of particular relevance, for
example, in some cases, charcoal.
9.2 Utility Poles Utility poles export increased from 905 poles in 2004 to 31,200 in 2008. Kenya is the main market by far,
the market share ranging between 55% and 98% of exports. Kenya reports to be importing some 45,000
poles annually from Tanzania while the TRA information shows a similar level, ranging from 50,000 poles
to 150,000 poles annually. Accounting for the trade in utility poles is hard as practices vary, some
register units, some cubic meters and some running meters.
9.3 Procedure for Export of Forest Products Exporting logs of any tree species is prohibited by law in Tanzania. Permission to export forest products
is obtained from the GoT and is to be renewed annually. Applications are to be accompanied by a range
of documentation including (i) valid trading license, (ii) TIN and certificate, (iii) VAT certificate, (iv) tax
clearance certificate, (v) company certificate of incorporation, (vi) contracts, (vii) list of workers, and
(viii) previous year’s earnings. According to the Section 58 of the Forest Act (2002) (Part VII Trade in
Forest Products), timber exporters are required to possess a valid export certificate issued by the
Director of FBD (now CE of TFS) for each shipment.
Export certificates are valid for three months and may only apply to graded timber whose origin and
grade tallies with the timber markings. Timber inspection before export, including grading and marking,
may only be conducted by those authorized by the Director FBD (now CE of TFS). All exporters are
required to give notice of at least one month prior to shipment for the timber to be inspected for
grading. An authorized timber grader must conduct grading within two weeks before the shipment is
made. Acquisition of CITES export documentation where appropriate is covered under Regulation
50(14). Exporting companies are further required to submit to FBD monthly and annual export returns
indicating quantity exported (m3), destination and total foreign currency earnings for each consignment
exported. It should be recalled that this procedure existed prior to establishment of TFS and was thus
being implemented by FBD. TFS has now taken over all the functions.
Trade Flows within, to and from East African Countries, Tanzania Study 34| Page
9.4 Customs Procedures The EAC countries have modernised their Customs Services in the past five years as part of a trade
facilitation programme. This and other measures such as improvement of Customs infrastructure,
adoption of computerised systems (such as Asycuda), adoption of the 2009 Customs Management Act
and the Common External Tariff, and adoption of standard internationally used codes (HS codes) for
commodities traded, have greatly improved the quality of information being collected across the EAC.
Timber is handled like any other commodity that crosses the Tanzania borders. Customs officials are not
trained on the uniqueness of this commodity nor are they exposed to technical terms necessary to
authenticate documentation, species and values. At the border, therefore, timber is just declared,
valued according to what is presented, verified, dues paid and released. Normally Customs will require
the following documents from the exporter:
(i) Registration as a timber dealer and as exporter of forest products from the FBD;
(ii) Letter of approval for export of forest products from MNR;
(iii) Export License from MNR (TFS) following inspection, grading and payment of fees ;
(iv) Grading Certificate from a FBD timber grader;
(v) Transit pass for wood products from FBD;
(vi) Business License with a TIN number;
(vii) Copy of “Letter of Credit”; and
(viii) Phytosanitary certificate.
At Customs, two documents are prepared namely Form “C12” and “Bill of Entry”. These forms contain
details of the forest products being exported (species, volumes, value). Once Customs is satisfied with
the details provided, they seal the containers of the wood products in the presence of (i) a Forest
Officer, (ii) Customs Officer, and (iii) officer from “Intelligence” service. The containers will then be
transported to the harbour or point of exit. The complete set of export documents will be presented to
Customs again at point of exit for authorisation of the cargo to leave the country.
10. Trends and Key Issues There has been a sharp increase in the demand for wood products in the local and international
markets, with especially exports going to the Middle East, Kenya, Rwanda, Burundi and Uganda. Sawn
timber import is also growing especially from Mozambique and Malawi. There is, however, very little
information regarding movement of timber in the region, including prices and demand in importing
countries. This makes it difficult for individuals as well as big private companies to tap into this market
potential.
Although, the volume of sawn timber exports has increased, most of the timber is consumed in local
markets as the quality is low and the products cannot compete in advanced international markets. A
recent study (FBD, 2009) indicated that trade in forest products in Tanzania is affected by a number of
factors including distance from production to markets, weak transport infrastructure, poor quality of
forest products, inadequate export financing, lack of appropriate trade policy, trade barriers and
cumbersome bureaucracy. Private sector operators in particular suffer from distorted incentive
structure and weak enforcement of basically good legal frameworks. In the processing industry, a key
problem is lack of incentives. Instead of using performance criteria based on contribution to national
economy, efficient use of raw materials, quality of products and compliance with environmental and
human safety regulations. The current practice favours essentially illegal small mobile sawmills, which
Trade Flows within, to and from East African Countries, Tanzania Study 35| Page
do not meet the above criteria while efficient medium‐ and large‐scale operators fail to get enough raw
materials on a regular basis. Thus the conditions for creating a viable and sustainable forest industry are
being undermined systemically.
Illegalities in the sector have been reported on extensively (see Milledge, S. et al; 2007). They emanate
from (i) corruption, (ii) low awareness of citizens’ rights (iii) poor implementation of forest and other
relevant laws and (iv) a “business sector” that is informal and inadequately regulated. Illegalities
manifest in a number of features that currently characterise the forest sector including (i)
underpayment or no payment at all of royalties and taxes, (ii) undervaluation through false and/or
inaccurate declarations, (iii) setting of royalty rates administratively instead of allowing market forces,
(iv) deception, and (iv) collusion. Some actors involved in the trade of illegal timber and other wood
products are able to operate through normal channels, which is indicates collusion by some GoT
officials, a few of whom may even have a stake in the business. Today, there are no incentives that can
appeal to law‐abiding investors to engage in the forest industry in a transparent and accountable
manner.
Generally, governance of the sector is inadequate and GoT institutions responsible for forestry have low
capacity to manage the forests. In addition to the foregoing, there are problems emanating from poor
coordination between MNRT and PMO, but also between the Ministry of Finance and the other GoT
ministries, particularly with regard to financial management. TFS “strategic plan” has an objective to
enhance “good governance”, among other things. Indeed Tanzania is undertaking measures to ensure
that good governance prevails throughout all its agencies, all of which are required to internalize good
governance principles in their management including, among others, transparency, accountability,
ethics and rule of law. The narratives and rhetoric are excellent but implementation is still poor.
11. Anecdotal Information and Stakeholder Perceptions on Illegal Logging and Trade
11.1 General While FSU has impounded large quantities of illegal forest products including timber, charcoal and poles
since its inception and despite the elaborate system of surveillance and regulations aforementioned,
there are still high levels of non‐compliance. The guidelines, laws and regulations are not fully
implemented or evenly applied. In 2004, before creation of the FSU, for instance, the bulk of timber
products traded in from Southern Tanzania was harvested in an irregular or illegal manner. According to
Regie S. (TFS staff – pers. Com.), it is estimated that 40% and 20% of hardwood timber respectively on
the domestic and export markets is illegal while Anyemike, G. (TFS – pers. com.) puts corresponding
figures at 60% and 40%. Of the 28,000 bags of charcoal that are sold in Dar‐es‐Salaam each day, only
7000 bags (25%) are legal. It has been noted that larger and well‐connected companies continue
operating illegally, while small scale timber traders disproportionately bear the brunt of enforcement.
There is still widespread corruption (normally in the form of small‐scale bribery both for need and
greed) and highly organised patronage by senior public officials.
Trade in timber to Zanzibar from Southern Tanzania takes place via a network of more than 30 places
that serve as ports along the coast, mostly in Rufiji and Kilwa districts. Although TFS officials are aware
of the locations, resources do not allow regular monitoring. Dhows can only load timber during rare high
tides (2‐3 times per month) and can only transport the wood to Zanzibar when winds are also
favourable. Aware of these facts, FSU officials are targeting enforcement efforts during these times.
Trade Flows within, to and from East African Countries, Tanzania Study 36| Page
Zanzibar buyers normally visit the major coastal towns (such as Kilwa Masoko, Kilwa Kivinje and
Somanga), where they do deals with local middlemen – normally licensed timber harvesters. Middlemen
in turn visit villages in the cutting areas (principally in Liwale, Kilwa and Rufiji districts), either purchasing
planks which have been cut already or arranging timber to be cut to order. Timber is slowly collected
together over a period of weeks in a house or yard at a village some distance from the coast, then
trucked down to the coast and loaded on the dhow in the space of a few hours. The few land‐based
seizures that occur are normally a result of tip‐offs at the point where the timber is being transported by
truck to the coast.
Though the illegal timber is not hammer‐stamped and cannot easily be laundered, middlemen
nevertheless benefit from being registered and also handling some legal timber. This is because ‘excess’
illegal timber found in shipments of legally harvested wood are treated more leniently by officials,
provided a small fine and harvesting duties are paid. Traders are allowed to keep such excess where it is
less than 5 per cent of the timber in transit. This enables legal traders to transport illegal wood alongside
legal wood with little risk. The FSU marine unit, established in December 2008, had during its first three
months of existence already seized around 3000 pieces of timber from dhows heading to Zanzibar from
Southern Tanzania. Zanzibar official figures suggest around 4000 pieces of timber are arriving each
month, while FSU officials estimate that around 5000 pieces a month are being exported from the 30
illegal landing sites spread along the coast. The figures also suggest that the FSU marine unit is
intercepting around one in every five shipments.
It does not appear that significant quantities of illegal Tanzanian timber are being laundered as
originating in Mozambique at or near the border itself. The FBD have gone to considerable lengths to
ensure the legal origin of the timber being imported, requiring presentation of a range of Mozambique
documents including harvesting licenses, transit permits and phyto‐sanitary certificates, samples of
which are often taken to the Mozambique embassy in Dar es Salaam for translation and verification.
Such requirements go beyond Tanzanian law (which requires only that import duties are proven to have
been paid), and are significantly more stringent than official checks on legal origin of timber imports
conducted elsewhere. Variations in the forms received suggest that forgery may be occurring, however,
and it is impossible in many cases to reconcile quantities on harvest and transit permits with actual
imports.
Indeed there are large discrepancies between the amount of timber being recorded as legally imported
from Mozambique by the FSU and the amount of timber passing the Kibiti checkpoint near Dar es
Salaam which is recorded as originating in Mozambique. FSU at Lindi recorded 167,000 pieces of
Mozambique timber entering Tanzania in 2006, while Kibiti records show that 54,000 pieces were
passing in just one month in October 2008. This suggests that illegally imported Mozambique timber or
illegally logged Tanzanian timber is being laundered as legal Mozambique wood using false or corruptly
issued paperwork.
11.2 Systemic Manipulation of Volumes One of the ways to estimate the difference between licensed harvesting and actual harvesting has been
to compare the transit passes given for transport of timber to the felling licenses. Study by Milledge and
Kaale (2005) suggests the actual harvesting level could be 5 times larger in certain areas than the
recorded or official harvesting. Another way to compare the licensed and actual harvesting is to look at
the industry structure and registered production capacity. Another study (FBD, 2005) gives a registered
hardwood sawmilling capacity of some 473,000 m3 while the registered production was only 55,000 m3,
i.e. 12% capacity utilization rate. Anecdotal evidence seems to suggest that sawmillers usually manage
Trade Flows within, to and from East African Countries, Tanzania Study 37| Page
to get more raw materials from the black markets but this cannot naturally be reported as actual
production. The capacity utilization rate is most likely much higher and, therefore, the production of
hardwood sawn timber is most likely much higher than reported in the official statistics. According to
Milledge and Elibariki (2005), actual harvest volume in Rufiji district would have been some 500,000 m3
in year 2003 while licenses were issued only for harvesting of 21,000 m3. The data supplied by TFS shows
harvesting level of 1,500 m3 in year 2003! Estimate for firewood was 2.1 million m3 while the
commercial harvesting volume was recorded at 42,000 m3, i.e. 50 times higher.
11.3 Corruption There are complex and far reaching problems of corruption and patrimony in Tanzania. Illegal activities
take the form of logging without documentation, logging in unauthorized areas, under‐declaration of
volumes leading to undervaluation and the use of invalid export documentation. Bribery reportedly
occurs at all levels, even where timber has been harvested legally. At central and district levels, there
are examples of patrimony and cronyism between government and private sector actors. According to
Milledge, S. et.al. (2007), there is a network of high‐ranking officials in the timber trade that negatively
affects transparency, fair decision making and impartiality. This in turn allows over‐exploitation of
valuable timber species, loss of revenue, and loss of control over the management of the resource itself.
Local people are becoming increasingly powerless as deals are made without their involvement, by‐
passing the rule of law and local governance institutions.
11.4 Low Levels of Awareness There is limited understanding of the economic value of timber and that harvesting regulations need to
be followed. Timber species represent a valuable resource, which if utilised properly, could contribute
significantly toward sustainable development of Tanzania. Timber values and markets are not well
understood and dealers are prepared to fell and transport timber at a fraction of its real economic value.
Awareness of citizens’ rights to natural resources and land remains generally low at all levels of society.
Communities are completely unaware of their rights as caretakers under the Village Land Act and the
Constitution. This translates into limited capacity to voice concerns or articulate demands on virtually
anything.
11.5 Shortfalls in Revenue There are considerable shortfalls in revenue from the trade in forest products at all levels, from village
and district to export revenues. According to TRAFFIC (ibid), only 4% of potential revenue due is
collected, and annual losses of revenue to the country could be at the level of $60 million.
11.6 Low Levels of Enforcement of Laws Currently forest crime is not systematically reported or tracked. The FSU cannot always follow up
reported incidents, leading to frustration of those who report forest crimes and others doing legitimate
business. There is generally a distrust of the relevant law enforcement authorities at community level, as
well as of forestry staff who are suspected of working with illegal harvesters.
11.7 Unfair Business Practices The current allocation system for permits severely distorts markets. The number of “customers” has
increased in the past years although the number of sawmills has not increased that rapidly. Increasing

Trade Flows within, to and from East African Countries, Tanzania Study 38| Page
share of wood allocation is, therefore, going to “brief case saw‐millers”. These do not have sawmills but
sell the licenses/permits. Also a share of licenses (about 20%) goes as social welfare to a variety of
institutions (for example schools) that again sell their licenses/permits to saw‐millers. There is thus an
illegal wood market in the country, developed by those who have wood allocation permits but do not
have sawmills. This market pays a higher price for logs than the license fees set by GoT, clearly indicating
possibility of official under pricing. GoT has no control over this market. Under pricing of logs attracts
middlemen, who corruptly acquire permits that they resell. This makes it difficult for legitimate owners
of sawmills to access reliable supplies of saw logs. The lack of transparent markets and level playing
ground for the operators has led to a situation where the forest resource is being finished and there are
no high quality products in the markets. Serious saw‐millers have suffered from the situation and will
continue to suffer for years to come as forest resources have been wasted.
12. Conclusions and Recommendations
12.1 Conclusions Growing demand for forest products in the country and her neighbours has generated functional
challenges that have stretched the ability of the GoT institutions responsible for forestry to deliver on
their mandate. Also, forests are generally viewed as a common resource, and even in FRs, mechanisms
to control forest use is inadequate. Below are some of the challenges specific to FLEGT;
(i) Weak institutional capacities in terms of human and financial resources to curb illegal trade
in forest products;
(ii) Uncontrolled deforestation and forest degradation due to encroachment and over‐
utilization;
(iii) Unclear FR boundaries;
(iv) Haphazard management;
(v) Illegal and uncontrolled commercial timber harvesting;
(vi) Inefficient revenue collection;
(vii) Lengthy licensing processes that encourage unethical behaviour;
(viii) Parallel administrative systems/authorities in the management of forests;
(ix) Unclear tree and land tenure which does not encourage investment in forests;
(x) Restricted access and benefit sharing mechanisms in FRs;
(xi) Politically/ commercially motivated forest excisions; and
(xii) Open access to public lands that is resulting to unregulated use of forests.

Trade Flows within, to and from East African Countries, Tanzania Study 39| Page
12.2 Recommendations National Level
(i) Responsibility for forest management in Tanzania needs to be brought under one bureaucratic
Authority. The sector needs a more coordinated institutional framework that will enable
implementation of the NFP to ensure sustainable sector development. In this context, only
MNRT, FBD and TFS should be the institutions responsible for forestry in order to reduce
administrative overlaps and hence conflicts, curtail the currently excessive bureaucracy, lower
transaction costs, streamline revenue collection systems and enhance FLEGT;
(ii) Categories of forest tenure regimes need to be reduced to one (FRs) for ease of control,
accompanied by structural and functional reconfiguration of the various stakeholders in the
forest sector. Outside of the TFS, all the other stakeholders (PMO, Regional and District
Administrations) lack the technical capacity to manage forests. The DFHC should be abolished
and its role taken over by TFS in tandem with establishing a mechanism for sharing revenue with
the district and village governments;
(iii) It is necessary to strengthen institutional capacity in law enforcement, monitoring and
administration in order to curb, especially, illegal forest harvesting. In this regard, FSU needs to
be beefed up with more people and logistics. In this context, TFS must work closely with LGAs
and other government institutions (TRA and security agencies) to curb illegal forest utilisation
and improve revenue collection and sharing.
(iv) Awarding licenses/permits should be through “competitive bidding” to free market forces so
that the various products fetch a price the market is “willing” to pay instead of the current
practice of fixing royalty rates administratively;
(v) Business people need to be encouraged to appreciate the role of better Forest Law Enforcement
and Governance (FLEG) as this will reduce current high transactions costs and improve long term
sustainability of their business. They should not be seen as “criminals” on the receiving end and
to be beaten into line. Instead, they should be viewed by GoT as partners in the business and be
able to actively participate in FLEG. In this context, possibilities of self‐regulation coupled with a
set of incentives for compliant business people should be explored;
(vi) There is need to develop country FSC standards against which to certify forests in Tanzania.
Also, as most of the forest certifiers come from Europe and South Africa, a pool of locally trained
certifiers is required as a means to create national capacity and to reduce certification costs;
(vii) There is a severe paucity of up‐to‐date reliable data on almost all aspects of forestry in Tanzania.
While the ongoing countrywide biometric inventory is a step in the right direction, there is
urgent need for biodiversity inventories and to establish computerized and user‐friendly
databases for trade (export, import, consumption) and impounded forest products and licenses.
The Norwegian grant of USD100 for REDD+ “readiness” could partly address the issue of
comprehensive and integrated inventories and the accompanying databases;
(viii) Effective tracking requires individual identification of each log/timber piece being traded.
Hammer branding of logs, the current method of labeling in Tanzania, has the disadvantage of
being easily forged. It is used in Tanzania to identify logs to district level, not to an individual
stump. Whilst no one would call this technique ideal (most secure techniques are prohibitively
costly), experimentation with bar‐coded plastic labels and the “Integrated Stock Survey and
Management Inventory” (ISSMI) developed and used in Uganda are recommended. In this
regard, EU may wish to consider supporting TFS to develop a more robust CoC system; and
Trade Flows within, to and from East African Countries, Tanzania Study 40| Page
(ix) Deforestation and forest degradation are partly triggered and driven by overwhelming
dependency on wood‐fuel. While it may not be practically feasible to significantly reduce the
dependency, rigorous promotion of wood‐fuel saving technologies and establishment of sources
outside natural forests could be sustainable coping mechanisms.
Regional Level
(x) Affected Customs and FSU officials should be trained in the Portuguese, French, English and
Swahili languages to enable them handle import/export documents effectively. The EU could
sponsor a regional programme in this regard, in which case relevant documents relating to
timber harvesting and movement could be harmonised and training in their use undertaken. In
this context, the work started by WWF/Tanzania to collaborate with WWF/Mozambique,
WWF/Kenya and WWF/China is quite instructive and should be enhanced;
International
(xi) The EU does not import a substantial quantity of wood‐based products from Tanzania (a round‐
wood equivalent volume smaller than 3,000 m3 per year). Also, the round‐wood equivalent
volume of products made at least partly with timber exported from Tanzania but supplied to the
EU from other countries is likely to be small. In view of the foregoing, therefore, negotiating a
VPA with Tanzania would not be a viable option.

Trade Flows within, to and from East African Countries, Tanzania Study 41| Page
References
Axberg, G., Ngaga Y., Maganga F., Virtnen P. (2011) Strategic planning for Finnish Support to Forestry in
Tanzania
GoT (1998), National Forest Policy. Dar‐es‐Salaam, Tanzania.
GoT (1998), Forest Policy. Dar‐es‐Salaam, Tanzania.
GoT (2001), National Forestry Programme. Dar‐es‐Salaam, Tanzania.
GoT (2001), National Forest Programme. Dar‐es‐Salaam, Tanzania.
GoT (2002), Tanzania Forest Act and Regulations. Dar‐es‐Salaam, Tanzania.
GoT (2004), Environment Management Act. Dar‐es‐Salaam, Tanzania.
GoT (2010), Tanzania Forest Service Framework Document. Dar‐es‐Salaam, Tanzania
GoT (2010), Tanzania Forest Service Strategic Plan (2010 – 2013). Dar‐es‐Salaam, Tanzania.
GoT (2011), National Forest Policy (Final Draft). Dar‐es‐Salaam, Tanzania.
HTSPE (2009), Designing an Independent Monitoring of FLEG in Tanzania. Dar‐es‐Salaam, Tanzania.
IM‐GLEG (2009), Independent Monitor of FLEG in Tanzania. Dar‐es‐Salaam, Tanzania.
Mama Misitu (2011), Campaign to improve Forest Governance in Tanzania. Dar‐es‐Salaam, Tanzania.
Milledge, S. Gelvas, J. & Ahrends, A. (2007). Governance and National Development: Lessons Learned
from Logging Boom in Southern Tanzania. TFRFFIC, Dar‐es‐Salaam, Tanzania.
Rider,R., T. Tuomasjukka & W. Mathu (2007). FLEGT Fact Finding Mission to East Africa (Back‐to‐
Office‐Report). European Forestry Institute, Finland.
Sola, P. (2010), Status of Forest Law Enforcement, Governance and Trada in SADC Countries. Africa
Forest Forum, Nairobi, Kenya.
UN‐REDD (2009), National Programme Document. Dar‐es‐Salaam, Tanzania.
UNEP/WCMC (2007), United Republic of Tanzania: A review of trade in CITES‐listed species. Cambridge,
United Kingdom

Trade Flows within, to and from East African Countries, Tanzania Study 42| Page
Annex 1 Tanzania’s trade in selected groups of wood‐based products (2000‐2011, by partner country)
Figure 5 Tanzania’s imports of VPA core products
Source: UN Comtrade; 2012

Trade Flows within, to and from East African Countries, Tanzania Study 43| Page
Figure 6 Tanzania’s exports of VPA core products
Source: UN Comtrade; 2012

Trade Flows within, to and from East African Countries, Tanzania Study 44| Page
Figure 7 Tanzania’s imports of other timber sector products
Source: UN Comtrade; 2012

Trade Flows within, to and from East African Countries, Tanzania Study 45| Page
Figure 8 Tanzania’s exports of other timber sector products
Source: UN Comtrade; 2012

Trade Flows within, to and from East African Countries, Tanzania Study 46| Page
Figure 9 Tanzania’s imports of paper sector products
Source: UN Comtrade; 2012

Trade Flows within, to and from East African Countries, Tanzania Study 47| Page
Figure 10 Tanzania’s exports of paper sector products
Source: UN Comtrade; 2012

Trade Flows within, to and from East African Countries, Tanzania Study 48| Page
Figure 11 Tanzania’s exports of logs
Source: UN Comtrade; 2012

Trade Flows within, to and from East African Countries, Tanzania Study 49| Page
Figure 12 Tanzania’s exports of sawn wood
Source: UN Comtrade; 2012

Trade Flows within, to and from East African Countries, Tanzania Study 50| Page
Annex 2 List of people met
1. Selewin Regie TFS
2. H. M. Ngibuini New Forests Company
3. P. Sumbi WWF
4. M. Makela Embassy of Finland
5. F. Mukone TFS
6. J. Chenga TRAFFIC
7. B. Bobllier EU Mission
8. G. Anyemike TFS

Trade Flows within, to and from East African Countries, Tanzania Study 51| Page
Annex 3 Tables of the UN Comtrade data used
a) Imports of Core VPA products
Source Estimated RWE Volume Import value
(thousand cubic metres) (US$ million, cif, nominal)
2000 2001 2002
2003
2004
2005
2006
2007
2008
2009
2010
2011
2000
2001
2002
2003
2004
2005
2006
2007
2008
2009
2010
2011
Total 4 5 13 16 23 17 19 21 52 76 56 93 1 1 1 2 3 2 2 3 10 9 10 13
Study countries: 3 3 3 4 7 4 7 9 31 53 34 62 1 0 0 0 1 1 0 1 5 4 5 7
Kenya 3 3 3 3 3 3 2 1 2 2 2 7 0 0 0 0 0 1 0 0 0 0 0 1 Malawi 0 0 0 0 2 0 4 6 9 25 5 25 0 0 0 0 0 0 0 0 1 1 0 1
Mozambique 0 0 0 0 0 0 0 0 9 21 22 26 0 0 0 0 0 0 0 0 1 1 2 2 South Africa 0 0 1 1 3 0 0 0 6 0 3 2 0 0 0 0 1 0 0 0 3 0 2 1
Others 0 0 0 0 0 0 0 1 5 4 2 2 0 0 0 0 0 0 0 0 0 0 0 1
Rest of Africa 0 0 0 0 0 0 0 0 0 0 0 0 0 0 0 0 0 0 0 0 0 0 0 0
China 0 0 0 1 1 3 9 7 15 18 18 21 0 0 0 0 0 1 1 1 4 4 4 4
EU‐27 0 0 0 0 1 0 0 0 0 1 0 0 0 0 0 0 0 0 0 0 0 0 0 0
Rest of World: 1 2 9 11 13 10 3 5 5 4 3 10 0 0 1 1 1 1 1 1 1 1 1 2
India 0 0 6 8 11 9 1 1 0 1 1 4 0 0 0 1 1 1 0 0 0 0 0 1 Thailand 0 0 1 1 0 0 0 1 1 1 0 4 0 0 0 0 0 0 0 0 0 0 0 1
United Arab Emirates 0 1 1 1 1 1 2 3 3 2 1 1 0 0 0 0 0 0 0 0 0 0 0 0 Others 0 1 1 1 1 1 0 1 0 1 0 0 0 0 0 0 0 0 0 0 0 0 0 1
Source Estimated RWE Volume Import value
(thousand cubic metres) (US$ million, cif, nominal)
2000 2001 2002 2003 2004 2005 2006 2007 2008 2009 2010 2011 2000
2001
2002
2003
2004
2005
2006
2007
2008
2009
2010
2011
Total 24 25 25 27 46 64 85 71 77 109 96 110 6 8 10 9 19 17 18 24 31 31 30 35
Study countries: 15 14 14 10 11 12 16 11 8 11 10 19 2 3 2 3 4 4 5 7 7 4 4 7
Kenya 3 3 3 2 2 4 2 2 4 7 6 7 0 1 0 0 0 1 0 0 3 2 1 2 South Africa 1 4 4 4 4 3 7 5 4 4 4 12 1 2 1 2 3 2 4 6 3 3 2 5
Zimbabwe 9 7 7 3 2 3 1 0 0 0 0 0 1 1 1 0 0 0 0 0 0 0 0 0 Others 1 0 1 1 3 3 6 4 0 0 0 0 0 0 0 0 0 0 1 1 0 0 0 5
Rest of Africa
0 0 0 0 0 0 0 0 0 0 0 0 0 0 0 0 0 0 0 0 0 0 0 0
China 0 1 1 3 8 25 45 24 31 55 56 65 0 0 0 1 2 3 4 7 10 12 14 16
EU‐27 2 2 2 2 2 2 1 2 2 3 2 3 1 1 1 1 1 1 1 1 2 3 3 1
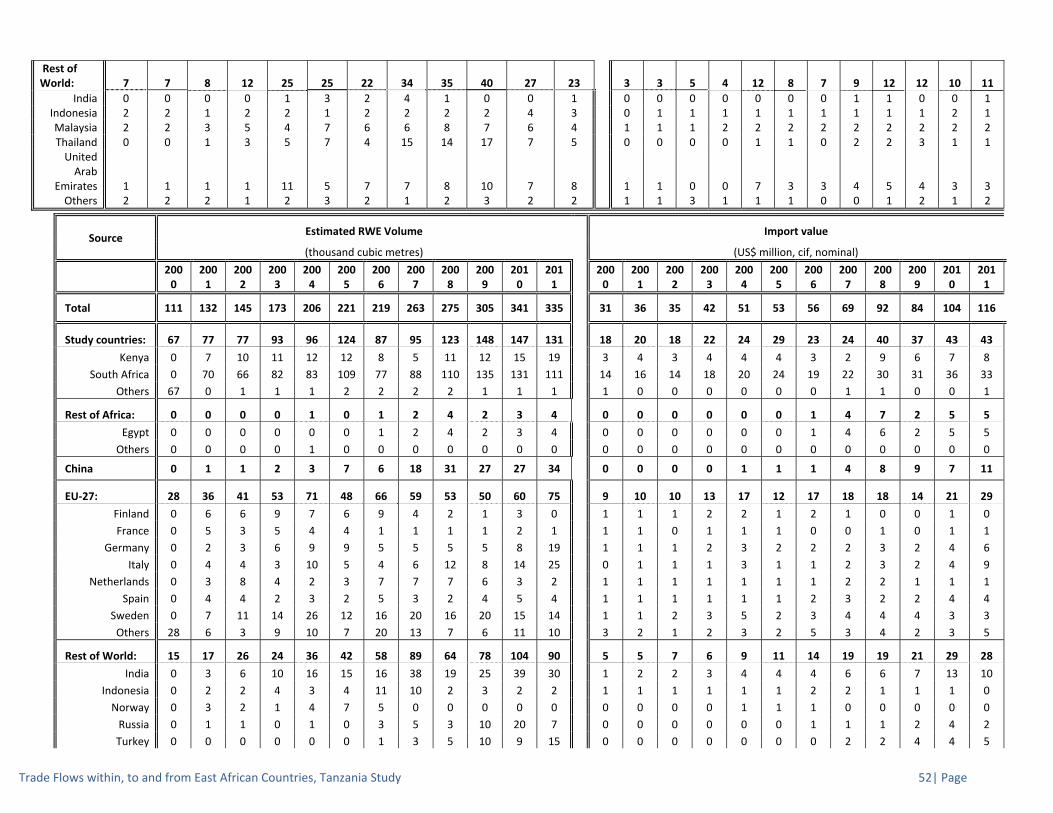
Trade Flows within, to and from East African Countries, Tanzania Study 52| Page
Rest of World: 7 7 8 12 25 25 22 34 35 40 27 23 3 3 5 4 12 8 7 9 12 12 10 11
India 0 0 0 0 1 3 2 4 1 0 0 1 0 0 0 0 0 0 0 1 1 0 0 1 Indonesia 2 2 1 2 2 1 2 2 2 2 4 3 0 1 1 1 1 1 1 1 1 1 2 1 Malaysia 2 2 3 5 4 7 6 6 8 7 6 4 1 1 1 2 2 2 2 2 2 2 2 2 Thailand 0 0 1 3 5 7 4 15 14 17 7 5 0 0 0 0 1 1 0 2 2 3 1 1 United Arab
Emirates 1 1 1 1 11 5 7 7 8 10 7 8 1 1 0 0 7 3 3 4 5 4 3 3 Others 2 2 2 1 2 3 2 1 2 3 2 2 1 1 3 1 1 1 0 0 1 2 1 2
Source Estimated RWE Volume Import value
(thousand cubic metres) (US$ million, cif, nominal)
2000
2001
2002
2003
2004
2005
2006
2007
2008
2009
2010
2011
2000
2001
2002
2003
2004
2005
2006
2007
2008
2009
2010
2011
Total 111 132 145 173 206 221 219 263 275 305 341 335 31 36 35 42 51 53 56 69 92 84 104 116
Study countries: 67 77 77 93 96 124 87 95 123 148 147 131 18 20 18 22 24 29 23 24 40 37 43 43
Kenya 0 7 10 11 12 12 8 5 11 12 15 19 3 4 3 4 4 4 3 2 9 6 7 8
South Africa 0 70 66 82 83 109 77 88 110 135 131 111 14 16 14 18 20 24 19 22 30 31 36 33
Others 67 0 1 1 1 2 2 2 2 1 1 1 1 0 0 0 0 0 0 1 1 0 0 1
Rest of Africa: 0 0 0 0 1 0 1 2 4 2 3 4 0 0 0 0 0 0 1 4 7 2 5 5
Egypt 0 0 0 0 0 0 1 2 4 2 3 4 0 0 0 0 0 0 1 4 6 2 5 5
Others 0 0 0 0 1 0 0 0 0 0 0 0 0 0 0 0 0 0 0 0 0 0 0 0
China 0 1 1 2 3 7 6 18 31 27 27 34 0 0 0 0 1 1 1 4 8 9 7 11
EU‐27: 28 36 41 53 71 48 66 59 53 50 60 75 9 10 10 13 17 12 17 18 18 14 21 29
Finland 0 6 6 9 7 6 9 4 2 1 3 0 1 1 1 2 2 1 2 1 0 0 1 0
France 0 5 3 5 4 4 1 1 1 1 2 1 1 1 0 1 1 1 0 0 1 0 1 1
Germany 0 2 3 6 9 9 5 5 5 5 8 19 1 1 1 2 3 2 2 2 3 2 4 6
Italy 0 4 4 3 10 5 4 6 12 8 14 25 0 1 1 1 3 1 1 2 3 2 4 9
Netherlands 0 3 8 4 2 3 7 7 7 6 3 2 1 1 1 1 1 1 1 2 2 1 1 1
Spain 0 4 4 2 3 2 5 3 2 4 5 4 1 1 1 1 1 1 2 3 2 2 4 4
Sweden 0 7 11 14 26 12 16 20 16 20 15 14 1 1 2 3 5 2 3 4 4 4 3 3
Others 28 6 3 9 10 7 20 13 7 6 11 10 3 2 1 2 3 2 5 3 4 2 3 5
Rest of World: 15 17 26 24 36 42 58 89 64 78 104 90 5 5 7 6 9 11 14 19 19 21 29 28
India 0 3 6 10 16 15 16 38 19 25 39 30 1 2 2 3 4 4 4 6 6 7 13 10
Indonesia 0 2 2 4 3 4 11 10 2 3 2 2 1 1 1 1 1 1 2 2 1 1 1 0
Norway 0 3 2 1 4 7 5 0 0 0 0 0 0 0 0 0 1 1 1 0 0 0 0 0
Russia 0 1 1 0 1 0 3 5 3 10 20 7 0 0 0 0 0 0 1 1 1 2 4 2
Turkey 0 0 0 0 0 0 1 3 5 10 9 15 0 0 0 0 0 0 0 2 2 4 4 5

Trade Flows within, to and from East African Countries, Tanzania Study 53| Page
United Arab Emirates 0 3 2 3 4 7 8 9 11 9 14 14 1 1 1 1 1 1 2 2 3 2 3 4
USA 0 2 1 0 2 1 1 1 1 0 3 2 1 1 0 0 0 0 0 0 0 0 1 1
Others 15 2 12 6 6 8 13 22 24 21 16 21 1 1 3 2 2 3 3 6 6 5 4 6
Source Volume Import value
(thousand cubic metres) (US$ million, cif, nominal)
2000
2001
2002
2003
2004
2005
2006
2007
2008
2009
2010
2011
2000
2001
2002
2003
2004
2005
2006
2007
2008
2009
2010
2011
Total 1 0 0 0 2 0 0 0 6 0 5 6 0 0 0 0 1 0 0 0 3 0 2 3
Study countries: 1 0 0 0 2 0 0 0 6 0 5 6 0 0 0 0 1 0 0 0 3 0 2 3
Mozambique 0 0 0 0 0 0 0 0 0 0 0 2 0 0 0 0 0 0 0 0 0 0 0 1 South Africa 0 0 0 0 2 0 0 0 6 0 3 2 0 0 0 0 1 0 0 0 3 0 2 1 Zimbabwe 0 0 0 0 0 0 0 0 0 0 0 2 0 0 0 0 0 0 0 0 0 0 0 1
Others 1 0 0 0 0 0 0 0 0 0 1 0 0 0 0 0 0 0 0 0 0 0 0 0
Rest of Africa 0 0 0 0 0 0 0 0 0 0 0 0 0 0 0 0 0 0 0 0 0 0 0 0
China 0 0 0 0 0 0 0 0 0 0 0 0 0 0 0 0 0 0 0 0 0 0 0 0
EU‐27 0 0 0 0 0 0 0 0 0 0 0 0 0 0 0 0 0 0 0 0 0 0 0 0
Rest of World 0 0 0 0 0 0 0 0 0 0 0 0 0 0 0 0 0 0 0 0 0 0 0 0
Source Volume Import value
(thousand cubic metres) (US$ million, cif, nominal)
2000
2001
2002
2003
2004
2005
2006
2007
2008
2009
2010
2011
2000
2001
2002
2003
2004
2005
2006
2007
2008
2009
2010
2011
Total 0 0 0 0 1 0 2 4 13 29 15 27 0 0 0 0 0 0 0 0 2 3 2 3
Study countries: 0 0 0 0 1 0 2 4 13 27 15 27 0 0 0 0 0 0 0 0 2 3 2 3
Malawi 0 0 0 0 1 0 2 3 5 14 3 13 0 0 0 0 0 0 0 0 1 1 0 1 Mozambique 0 0 0 0 0 0 0 0 5 11 12 13 0 0 0 0 0 0 0 0 1 1 2 2
Others 0 0 0 0 0 0 0 1 3 2 0 0 0 0 0 0 0 0 0 0 0 0 0 0
Rest of Africa 0 0 0 0 0 0 0 0 0 0 0 0 0 0 0 0 0 0 0 0 0 0 0 0
China 0 0 0 0 0 0 0 0 0 0 0 0 0 0 0 0 0 0 0 0 0 0 0 0
EU‐27 0 0 0 0 0 0 0 0 0 0 0 0 0 0 0 0 0 0 0 0 0 0 0 0
Rest of World 0 0 0 0 0 0 0 0 0 1 0 0 0 0 0 0 0 0 0 0 0 0 0 0
Volume (thousand cubic metres) Export value (US$ million, fob, nominal)
Counterpart data: 2000
2001
2002
2003
2004
2005
2006
2007
2008
2009
2010
2011
2000
2001
2002
2003
2004
2005
2006
2007
2008
2009
2010
2011
Exports by Malawi 0 0 0 0 0 0 0 1 1 7 0 6 0 0 0 0 0 0 0 0 0 1 0 1 Exports by
Mozambique 0 0 0 0 0 0 0 0 0 0 0 0 0 0 0 0 0 0 0 0 0 0 0 0
Destination Estimated RWE Volume Export value
(thousand cubic metres) (US$ million, fob, nominal)
2000
2001
2002
2003
2004
2005
2006
2007
2008
2009
2010
2011
2000
2001
2002
2003
2004
2005
2006
2007
2008
2009
2010
2011

Trade Flows within, to and from East African Countries, Tanzania Study 54| Page
Total 12 7 28 55 50 69 75 98 68 132 149 134 2 2 3 5 5 8 9 14 18 28 21 18
Study countries: 0 1 7 8 7 4 9 15 13 13 42 29 0 0 1 1 1 1 2 3 7 8 3 1
Kenya 0 0 3 8 4 4 6 11 11 12 41 28 0 0 0 1 0 1 1 2 6 8 2 1 Rwanda 0 0 0 0 0 0 0 0 0 0 0 0 0 0 0 0 0 0 0 0 0 0 0 0 Others 0 1 4 1 2 1 3 4 2 0 1 1 0 0 0 0 0 0 1 1 1 0 0 0
Rest of Africa: 1 0 1 0 2 1 1 1 1 1 1 1 0 0 0 0 0 0 0 0 0 0 0 0
Sudan 0 0 0 0 0 0 0 0 0 0 0 0 0 0 0 0 0 0 0 0 0 0 0 0 Others 1 0 1 0 2 1 1 1 1 1 1 1 0 0 0 0 0 0 0 0 0 0 0 0
China 1 1 5 12 17 8 10 37 16 12 18 20 0 0 0 1 1 1 1 5 4 2 2 3
EU‐27: 1 0 3 2 3 1 1 1 1 4 4 1 1 1 1 1 1 0 0 1 1 2 1 0
Italy 0 0 1 0 1 0 0 0 0 3 3 1 0 0 0 0 0 0 0 0 0 1 1 0 Others 0 0 2 2 2 1 0 1 1 1 1 0 1 0 1 1 0 0 0 1 1 1 1 0
Rest of World: 10 5 12 32 22 54 54 43 37 103 84 83 1 1 2 3 2 6 6 6 6 16 15 13
India 1 3 4 8 4 12 17 21 30 99 76 77 0 1 1 1 1 2 3 3 4 15 13 12 Malaysia 0 0 0 0 0 0 0 1 0 1 3 2 0 0 0 0 0 0 0 0 0 0 0 0 Singapore 0 0 0 1 0 0 0 0 1 1 1 2 0 0 0 0 0 0 0 0 0 0 0 0
Switzerland 1 0 2 11 2 3 2 0 0 0 0 0 0 0 0 1 0 0 0 0 0 0 0 0 Taiwan 0 1 3 4 3 2 0 1 0 1 0 0 0 0 0 0 0 0 0 0 0 0 0 0
Thailand 0 0 1 5 0 2 0 6 0 0 0 0 0 0 0 0 0 0 0 1 0 0 0 0 United Arab
Emirates 7 0 0 2 9 31 35 14 3 1 1 1 1 0 0 0 1 3 3 2 0 0 0 0 Others 0 1 2 1 4 4 1 0 2 0 1 1 0 0 0 0 0 1 0 0 1 0 1 0
Destination Estimated RWE Volume Export value
(thousand cubic metres) (US$ million, fob, nominal)
2000
2001
2002
2003
2004
2005
2006
2007
2008
2009
2010
2011
2000
2001
2002
2003
2004
2005
2006
2007
2008
2009
2010
2011
Total 4 5 5 7 16 14 19 95 59 42 94 110 1 1 1 2 3 4 3 15 10 5 12 7
Study countries: 1 1 3 2 3 2 9 77 55 40 85 105 0 0 0 0 0 1 1 12 6 4 8 5
Kenya 0 0 3 1 2 1 9 77 55 39 84 104 0 0 0 0 0 0 1 11 6 4 5 4 Others 1 0 0 0 1 0 0 0 0 0 0 1 0 0 0 0 0 0 0 0 0 0 3 0
Rest of Africa 1 0 0 0 0 0 0 0 0 0 0 3 0 0 0 0 0 0 0 0 0 0 0 0
China 0 0 0 1 5 1 7 16 1 0 0 0 0 0 0 0 0 1 1 2 0 0 0 0
EU‐27 1 1 1 1 1 2 1 0 1 1 1 1 1 1 1 1 1 1 1 1 1 1 2 0
Rest of World: 1 2 1 3 7 8 1 1 1 1 8 1 0 0 0 1 1 2 0 1 3 1 2 2
India 0 0 0 0 1 3 0 0 0 1 7 0 0 0 0 0 0 0 0 0 0 0 2 0 Switzerland 0 0 0 0 4 1 0 0 0 0 0 0 0 0 0 0 0 0 0 0 0 0 0 0
Taiwan 0 1 0 1 1 0 0 0 0 0 0 0 0 0 0 0 0 0 0 0 0 0 0 0 United Arab
Emirates 0 0 0 0 0 2 0 1 0 1 0 0 0 0 0 0 0 0 0 0 2 0 0 0 Others 1 1 0 1 1 2 1 0 1 0 0 0 0 0 0 0 0 1 0 1 1 0 0 2
Destination Estimated RWE Volume Export value
(thousand cubic metres) (US$ million, fob, nominal)
2000
2001
2002
2003
2004
2005
2006
2007
2008
2009
2010
2011
2000
2001
2002
2003
2004
2005
2006
2007
2008
2009
2010
2011

Trade Flows within, to and from East African Countries, Tanzania Study 55| Page
Total 4 2 1 2 3 19 42 60 127 99 114 120 1 1 0 0 1 3 9 13 26 24 30 35
Study countries: 4 2 1 1 1 17 31 25 90 96 106 113 1 0 0 0 0 3 6 6 22 23 26 33
Kenya 0 0 0 0 0 15 29 23 84 88 71 98 0 0 0 0 0 2 5 5 20 20 23 27 Malawi 1 0 0 0 0 1 1 0 1 2 7 3 1 0 0 0 0 0 0 0 0 1 0 1
Mozambique 0 0 0 0 0 0 1 1 0 1 1 2 0 0 0 0 0 0 0 0 0 0 1 1 Uganda 2 1 0 0 0 0 1 1 4 4 25 8 0 0 0 0 0 0 0 0 1 1 1 3 Others 0 0 1 0 0 1 0 1 2 1 1 3 0 0 0 0 0 0 0 0 1 0 0 1
Rest of Africa 0 0 0 0 0 1 0 1 2 1 1 2 0 0 0 0 0 0 0 0 1 0 2 1
China 0 0 0 0 0 0 0 0 0 0 0 0 0 0 0 0 0 0 0 0 0 0 0 0
EU‐27 0 0 0 0 0 0 0 0 0 0 0 0 0 0 0 0 0 0 0 0 0 0 0 0
Rest of World: 0 0 0 2 1 1 10 34 35 2 7 5 0 0 0 0 1 0 3 6 4 1 3 1
India 0 0 0 0 0 0 1 2 1 0 1 0 0 0 0 0 0 0 0 0 0 0 0 0 Iran 0 0 0 0 0 0 2 11 0 0 1 3 0 0 0 0 0 0 0 2 0 0 0 1
Sri Lanka 0 0 0 0 0 0 4 12 23 0 3 0 0 0 0 0 0 0 1 2 2 0 1 0 United Arab
Emirates 0 0 0 0 0 1 1 1 8 1 1 1 0 0 0 0 0 0 0 0 1 0 0 0 Vietnam 0 0 0 0 0 0 0 4 2 0 0 0 0 0 0 0 0 0 0 1 0 0 0 0 Others 0 0 0 2 1 0 2 4 0 1 2 0 0 0 0 0 0 0 1 1 0 1 1 0
Destination Volume Export value
(thousand cubic metres) (US$ million, fob, nominal)
2000
2001
2002
2003
2004
2005
2006
2007
2008
2009
2010
2011
2000
2001
2002
2003
2004
2005
2006
2007
2008
2009
2010
2011
Total 10 5 17 39 30 24 16 23 4 2 9 4 2 1 2 3 3 3 3 4 1 2 3 1
Study countries: 0 1 3 1 1 1 0 3 4 2 1 1 0 0 0 0 0 0 0 1 1 2 0 0
Kenya 0 0 1 1 0 1 0 3 3 2 1 0 0 0 0 0 0 0 0 1 0 2 0 0 Others 0 1 2 0 1 0 0 0 1 0 0 0 0 0 0 0 0 0 0 0 0 0 0 0
Rest of Africa 0 0 1 0 2 0 0 0 0 0 0 0 0 0 0 0 0 0 0 0 0 0 0 0
China 1 1 4 11 17 4 0 0 0 0 0 1 0 0 0 1 1 0 0 0 0 0 0 0
EU‐27 1 0 2 1 1 0 0 0 0 0 1 0 1 0 0 0 0 0 0 0 0 0 0 0
Rest of World: 9 3 7 26 9 19 16 20 0 0 6 2 1 1 1 2 1 3 3 3 0 0 2 1
India 0 2 4 8 3 12 15 19 0 0 5 2 0 0 1 1 0 2 3 3 0 0 2 1 Switzerland 1 0 1 10 2 2 0 0 0 0 0 0 0 0 0 1 0 0 0 0 0 0 0 0
Taiwan 0 0 0 3 3 1 0 0 0 0 0 0 0 0 0 0 0 0 0 0 0 0 0 0 United Arab
Emirates 7 0 0 0 0 2 0 0 0 0 0 0 1 0 0 0 0 0 0 0 0 0 0 0 Others 0 0 2 4 1 3 0 0 0 0 1 0 0 0 0 0 0 1 0 0 0 0 0 0
Volume (thousand cubic metres) Import value (US$ million, cif, nominal) Counterpart data:
2000
2001
2002
2003
2004
2005
2006
2007
2008
2009
2010
2011
2000
2001
2002
2003
2004
2005
2006
2007
2008
2009
2010
2011
Imports by China 1 1 6 45 42 21 4 18 2 1 2 1 0 1 2 16 13 8 1 7 1 1 1 0 Imports by
Kenya 0 0 0 0 2 1 3 8 6 3 11 0 0 0 0 0 0 0 1 1 1 1 2 0 Imports by India 2 2 2 6 7 18 8 9 0 1 1 2 1 1 1 3 3 11 3 4 0 0 1 1
of which: teak 10 9 8 0 1 4 3 3 0 0

Trade Flows within, to and from East African Countries, Tanzania Study 56| Page
other spp. 5 1 0 0 5 1 0 0
Destination Volume Export value
(thousand cubic metres) (US$ million, fob, nominal)
2000
2001
2002
2003
2004
2005
2006
2007
2008
2009
2010
2011
2000
2001
2002
2003
2004
2005
2006
2007
2008
2009
2010
2011
Total 1 1 6 8 11 25 30 41 35 71 76 71 1 0 1 2 3 5 5 10 17 26 17 16
Study countries: 0 0 2 4 3 2 3 7 5 6 22 16 0 0 0 1 0 1 1 2 6 6 2 1
Kenya 0 0 1 4 2 2 1 4 4 6 22 15 0 0 0 0 0 1 0 1 6 6 2 1 Others 0 0 1 0 1 0 2 2 1 0 0 0 0 0 0 0 0 0 1 1 0 0 0 0
Rest of Africa 0 0 1 0 0 1 1 1 0 0 0 0 0 0 0 0 0 0 0 0 0 0 0 0
China 0 0 0 0 0 2 5 20 9 7 10 10 0 0 0 0 0 1 1 5 4 2 2 2
EU‐27 0 0 1 0 1 0 0 0 1 2 1 1 0 0 0 0 0 0 0 1 1 2 1 0
Rest of World: 0 0 2 3 7 19 21 13 20 56 43 44 0 0 0 1 2 3 3 3 6 16 12 12
India 0 0 0 0 0 0 1 1 17 54 39 41 0 0 0 0 0 0 0 0 4 15 11 11 United Arab
Emirates 0 0 0 1 5 16 19 8 2 0 1 0 0 0 0 0 1 2 3 2 0 0 0 0 Others 0 0 2 2 2 3 1 5 2 2 3 2 0 0 0 0 0 1 0 1 1 1 1 1
Volume (thousand cubic metres) Import value (US$ million, cif, nominal) Counterpart data:
2000
2001
2002
2003
2004
2005
2006
2007
2008
2009
2010
2011
2000
2001
2002
2003
2004
2005
2006
2007
2008
2009
2010
2011
Imports by China 0 0 0 0 1 3 3 8 4 4 9 9 0 0 0 0 0 1 1 4 2 2 4 4 Imports by India 0 0 0 0 0 0 0 1 8 28 26 26 0 0 0 0 0 0 0 0 4 10 10 11
Imports by Kenya 0 0 0 0 1 0 2 4 3 1 6 0 0 0 0 0 0 0 1 1 1 1 2 0
Imports by UAE 0 0 0 0 0 28 0 12 1 1 0 0 0 0 0 0 0 4 0 2 0 0 0 0 Imports of teak by India in Financial Year 0 0 1 6 22 16 13 0 0 0 2 8 7 6


