76
| Date post: | 21-Mar-2019 |
| Category: |
Documents |
| Upload: | truongthuy |
| View: | 214 times |
| Download: | 0 times |


Foreword
Institute for Optical Systems IOS - one of the HTWG key research institutes
The HTWG Konstanz started in 2007 an intensive internal discussion on defining key topics that shouldbe supported to extend the success in research and technology transfer. Criteria in the discussion at thattime have been:
• Existing success and promising success in future
• Interdisciplinary
• Perceptibility
• Linked to study programs
• Interest of society and researchers to the topic
One of the key topics that have been defined led to the founding of IOS Institute for Optical Sys-tems: Optical Technologies and Image Processing. Professors with different research emphases withinthis framework from different HTWG departments focussed their activities under the brand of IOS, usingsynergies and cooperating in applying for different public grants and private money. Their individualsuccess and the success of the institute itself are demonstrated in the present annual report.
IOS links professors, doctoral and master students together to each other and to industry effecting resultsin applied research and supporting the study programs of HTWG as well.
I wish the IOS ongoing success in its wide and challenging subject.
Prof. Dr.-Ing. Gunter VoigtVice-President for Research, University of Applied Sciences Konstanz
IOS Annual Report 2009 3

Preface
The present report gives an overview over the research and development activities of the Institute forOptical Systems (IOS) Konstanz in the year 2009. Our main fields of interest are optical metrology,image processing, computer graphics and light engineering, thus representing the fundamental disciplinesof current optical technology. The focus on optical systems as a whole allows us to offer competentpartnership to the local industry in all relevant aspects. The IOS was founded in April 2008 by fourprofessors from three different faculties of the University of Applied Sciences at Konstanz and is led byProf. Dr. Braxmaier (director) and Prof. Dr. Franz (associate director).
The following project descriptions present ongoing activities mainly on a status report level. Most of thereports are written by students working on their diploma, bachelor, master or Ph.D. theses. They reflectthe largely varying levels of content, practice and insight that are characteristic for an institution involvedin academic education. Due to its interdisciplinary nature, research at the IOS combines approaches fromoptics, metrology, light engineering, sensor technology, computer graphics, image and signal processing,typically resulting in optical systems on a prototype level, either in prephase research or in cooperationwith local industry.
On the occasion of our second annual report, we would like to thank all of our students and co-workersfor their enthusiasm and dedication which makes our still rudimentary institute a great place to be. Weare also indebted to the administration and staff of the HTWG Konstanz for their help and support duringthis startup phase, especially president Dr. Kai Handel and Prof. Dr.-Ing. Gunter Voigt, for the supportand start-up funding and the faculties of Mechanical Engineering, Electrical and Information Engineering,and Computer Science with the deans Prof. Dr.-Ing. Carsten Manz, Prof. Dr.-Ing.Werner Kleinhempel andProf. Dr.-Ing. Oliver Bittel for their assistance. Furthermore we appreciate the support of the Institute forApplied Research (IAF) Konstanz, especially Prof. Dr. Horst Werkle and Dipl.-Ing. FHAndreas Burger.
4 IOS Annual Report 2009

Contents
Institute Profile 7IOS Building and Location Plan . . . . . . . . . . . . . . . . . . . . . . . . . . . . . . . . . . 9Institute Members . . . . . . . . . . . . . . . . . . . . . . . . . . . . . . . . . . . . . . . . . 10IOS Staff . . . . . . . . . . . . . . . . . . . . . . . . . . . . . . . . . . . . . . . . . . . . . . 11External Fundings and Grants . . . . . . . . . . . . . . . . . . . . . . . . . . . . . . . . . . . 11Cooperations with Research Institutions and Industry . . . . . . . . . . . . . . . . . . . . . . 12Theses and Student Projects . . . . . . . . . . . . . . . . . . . . . . . . . . . . . . . . . . . 13Publications . . . . . . . . . . . . . . . . . . . . . . . . . . . . . . . . . . . . . . . . . . . . 14Laboratories . . . . . . . . . . . . . . . . . . . . . . . . . . . . . . . . . . . . . . . . . . . . 18
Research Activities 21Picometer and Nanoradian Heterodyne Interferometry . . . . . . . . . . . . . . . . . . . . . . 23Setup of an Ultra-Stable Interferometer Using Novel Integration Techniques . . . . . . . . . . 25Development of RF Quadrant Photodetectors . . . . . . . . . . . . . . . . . . . . . . . . . . 27Development of an Ultraprecise Digital RF Phasemeter . . . . . . . . . . . . . . . . . . . . . 29Laser Frequency Stabilization to Optical Resonators . . . . . . . . . . . . . . . . . . . . . . . 31Validation of In-Field Pointing Concepts for LISA . . . . . . . . . . . . . . . . . . . . . . . . 33Investigations towards µN High Efficiency Multistage Plasma Thrusters . . . . . . . . . . . . . 35High Precision Optical Metrology . . . . . . . . . . . . . . . . . . . . . . . . . . . . . . . . . 37Measurements on Single Mode Waveguides in a Mid-Infrared Test Interferometer . . . . . . . 39Development of a Tilt Actuated Mirror . . . . . . . . . . . . . . . . . . . . . . . . . . . . . . 43Space Time Asymmetry Research – STAR . . . . . . . . . . . . . . . . . . . . . . . . . . . . 45High Resolution Optical Profilometry . . . . . . . . . . . . . . . . . . . . . . . . . . . . . . . 473D-Digitization Using Fringe Projection and HDR Methods . . . . . . . . . . . . . . . . . . . 49Preparation of the ‘Fertigungs-Messtechnik 2’ Laboratory . . . . . . . . . . . . . . . . . . . . 51The Statistics of Vegetation Echoes as Received by Echolocating Bats . . . . . . . . . . . . . 53Steganalysis Using Stochastic Image Models . . . . . . . . . . . . . . . . . . . . . . . . . . . 55The Optical Radar - a Multidisciplinary Research Project . . . . . . . . . . . . . . . . . . . . 57A Bracket for a Rapidly Rotating Mirror . . . . . . . . . . . . . . . . . . . . . . . . . . . . . 59Calibration of the Sensor Axis . . . . . . . . . . . . . . . . . . . . . . . . . . . . . . . . . . . 61Removal of Complex Lens Distortions . . . . . . . . . . . . . . . . . . . . . . . . . . . . . . . 63Texture Continuation with Texture Synthesis and Inpainting . . . . . . . . . . . . . . . . . . . 65Digital Image Steganography . . . . . . . . . . . . . . . . . . . . . . . . . . . . . . . . . . . 67Real-Time Multi-Camera Matching for 3D Reconstruction . . . . . . . . . . . . . . . . . . . . 69Adaptive Tetrahedral Subdivision for Finite Element Analysis . . . . . . . . . . . . . . . . . . 71Optische Drehzahlmessung nach dem Korrelationsverfahren . . . . . . . . . . . . . . . . . . . 73
IOS Annual Report 2009 5

6 IOS Annual Report 2009

Institute Profile

8 IOS Annual Report 2009

IOS Building and Location Plan
Institute for OpticalSystems
Brauneggerstraße 55Building E
3rd and 4th floor78462 Konstanz
Location Plan
IOS Annual Report 2009 9

Institute Members
Prof. Dr. Claus Braxmaier:
Diploma in precision engineering at University of Applied Sciences Furtwangen. Diploma in physicsand doctoral degree at the University of Konstanz in the field of fundamental tests of physics. Post-Doc at University of Konstanz. At EADS Astrium GmbH, system responsible for scientific and earthobservation missions for ESA and head of group ’Mission Metrology‘. Since 2005 professor for physicsand control theory at the University of Applied Sciences Konstanz. Member of ’Institut für AngewandteForschung (IAF)‘ and ’Institut für Naturwissenschaften und Mathematik‘ Konstanz. Since 2008 directorof the ’Institute for Optical Systems (IOS) Konstanz‘. Head of optical metrology research labs atHTWG and EADS Astrium GmbH. Main research: high resolution optical metrology for industrial andspace applications.
Prof. Dr.Matthias Franz:
M.Sc. in Atmospheric Sciences from SUNY at Stony Brook, Diploma in physics from the Eberhard-Karls-Universität, Tübingen and doctoral degree in 1998. Thesis research in visual insect and robotnavigation at the MPI for Biological Cybernetics and as a PostDoc at the Australian National Uni-versity in Canberra. In industry he worked on various aspects of autonomous vision systems. 2002, hereturned to the MPI as a group leader in the area of machine learning and computer vision. Since2007 professor at the University of Applied Sciences in Konstanz and head of cognitive systems lab.Member of ’Institut für Angewandte Forschung (IAF)‘. Main research activities in the development ofautomatically generated vision systems, optimisation and probabilistic modeling, with applications inindustrial machine vision, texture analysis and steganalysis.
Prof. Dr. Georg Umlauf:
Diploma in computer science from University of Karlsruhe, 1996. Doctoral degree in computer sciencefrom University of Karlsruhe, 1999. PostDoc at University of Karlsruhe and University of Florida,Gainesville, USA, 1999-2000. Software development and senior researcher at Tebis AG, Hamburg,2000-2002. Assistant professor for geometric algorithms at University of Kaiserslautern, 2002-2009.Interim professor for computer graphics at University of Karlsruhe, 2009. Since 2009 professor forcomputer graphics at University of Applied Sciences Konstanz and head of the computer graphics lab.Since 2010 member of the ‘Institute for Optical Systems (IOS)’ and ‘Institute for Applied Research(IAF)’. Main research interests: Computer graphics, geometric modeling (splines, subdivision), reverseengineering, physical simulations.
Prof. Dr. Bernd Jödicke:
Study of physics at the University of Kalrsruhe. Doctoral degree at Technical University Hamburgand University Karlsruhe in the field of high frequency technology. After that, industrial work atABB Baden, Switzerland, as executive director for R&D. Since 1992 professor for applied physics atUniversity of Applied Sciences Konstanz. Member of ’Institute for Applied Research (IAF)‘, ’Institutfür Naturwissenschaften und Mathematik (INM)‘, ’Institute for Optical Systems (IOS) Konstanz‘ and’Deutsche Lichttechnische Gesellschaft‘. Head of laboratory for light engineering at HTWG. Mainresearch activities in color and light measurements and color camera systems.
Prof. Dr. Klaus-Dieter Durst:
Study of physics at the University of Stuttgart, 1986 doctoral degree in the field of magnetism atthe Max-Planck-Institute of metal research. Thereafter research center Weissach of the Dr. Ing. h.c.F. Porsche AG, responsible for the central unit ’measurement technologies‘. Since 1993 professorfor measurement engineering and sensor technology at the University of Applied Sciences Konstanz.Member of ’Institut für Naturwissenschaften und Mathematik‘ and ’Institute for Optical Systems‘Konstanz. Head of laboratories for measurement and sensor technology and production metrology.Currently director of ’Institut für Naturwissenschaften und Mathematik‘ Konstanz. Activities in theaccreditation and surveillance of testing laboratories and inspection bodies.
10 IOS Annual Report 2009

IOS Staff
Professors Claus Braxmaier, director IOSMatthias Franz, associate director IOSGeorg UmlaufBernd JödickeKlaus-Dieter Durst
Officer Ruven Spannagel
Technical Staff (INM) Hermann RichterKarl-Heinz WallerDietmar Merk
Academic Staff Mohammed Allab, mechanical engineeringStefan Jacob, computer science, Breuckmann
PhD Students Thilo Schuldt, physicsMartin Gohlke, physics, EADS AstriumAndreas Keller, physics, EADS AstriumJürgen Keppler, computer scienceLe Pham Hai Dang, computer scienceKlaus Denker, computer scienceTrendafil Ilchev, mechanical engineering
Student Assistants Stefan Lang, computer scienceMarkus Messmer, computer science
Interns Pius Höger (BOGY)
IOS Annual Report 2009 11

External Fundings and Grants
• ZAFH PHOTONn (European Union under EFRE and Baden-Württemberg funding); "MiniaturLasersensor", 1 PhD student and equipment funds.
• BMBF (Federal Ministry of Education and Research) grant ("Young Engineers" funding line);"Optische 3D-Mess- und Digitalisierungssysteme für den Einsatz im Maschinenbau", 2 academicstaff and equipment funds.
• BMBF (Federal Ministry of Education and Research) grant ("Young Engineers" funding line):"Detection of steganography in images using statistical models", 1 PhD student and equipmentfunds.
• Structure and Innovation Fund for Research, Baden-Württemberg, grant: "Automation and Com-munication", equipment funds.
• Baumer Inspection GmbH, Konstanz: "Inspection of surfaces", contract research.
• Medav GmbH; Ilmenau: "Detection of steganography in images using statistical models", contractresearch.
Cooperations with Research Institutions and Industry
Academic and Institutional Cooperations
• HTW Aalen
• HFU Furtwangen
• Humboldt-Universität zu Berlin
• Stanford University, USA
• NASA AMES Research Center, USA
• KACST, King Abdulaziz City for Science and Technology, Riyadh, Kingdom of Saudi Arabia
• ZARM (drop tower), Center of Applied Space Technology and Microgravity, Bremen
• DLR Institut für Raumfahrtsysteme Bremen
• University of Tübingen
• Max-Planck-Institute for Biological Cybernetics, Tübingen
• German Federal Office for Information Security (BSI), Bonn
• Weizmann Institute of Science, Rehovot, Israel
• INCM-CNRS UMR, Marseille, France
12 IOS Annual Report 2009

Industry Cooperations
• EADS Astrium, Immenstaad
• Breuckmann GmbH, Meersburg
• Chromasens GmbH, Konstanz
• Medav GmbH, Ilmenau
• Baumer Inspection GmbH, Konstanz
• Procon-System GmbH, Thierstein
Theses and Student Projects
Diploma Theses
• M. Schwierz, Modularer Aufbau und Charakterisierung des hochauflösenden und optischen, Sub-Nanometer-Profilometer (kurz: NANO-PRO) genannten, Messsystems mit linearer Aktorik,DiplomaThesis (2009), computer science.
• M. Jawinsky, Kolorimetrische Kalibrierung eines multispektralen Aufnahmesystems, Diploma The-sis, (2009), computer science.
• A.T. Abchir, Gaußsche Prozesse für große Datenmengen, Diploma Thesis, (2009), computer sci-ence.
• F. Andriamahandrimanana, Prädiktion von prozessorientierten Veränderungen des Farbeindrucks,Diploma Thesis, (2009), computer science.
• T. Gräb, Unüberwachte adaptive optische Oberflächenkontrolle von Möbelplatten, Diploma Thesis,(2009), computer science.
• C. Balles, Oberflächenkontrolle von beschichteten Holzfaserplatten mittels intelligenter Auflicht-beleuchtung, Diploma Thesis, (2009), computer science.
• C. Kungel, Umsetzung eines Prototypen zur robusten Fahrzeugdetektion und Fahrzeugverfolgungin Echtzeit in monokularen Verkehrssequenzen, Diploma Thesis, (2009), computer science.
Master Theses
• T. Gekeler, Umfeldkartierung mit Bildverarbeitung aus Rundum-Videosensorik für Einparkfunktionim Automobil, Master Thesis, (2009), computer science.
• I. Schiffler, Entwicklung eines IR-Spektralphotometermoduls, Master Thesis (2009), mechanicalengineering.
• D. Kessler, Visualisierung der Strömungsphänomene von Öl mit definiertem Luftgehalt in Innen-zahnradpumpen, Master Thesis (2009), mechanical engineering.
IOS Annual Report 2009 13

Bachelor Theses
• S. Ressel, Integration Technologies for Optical Components and Design of a High Precision Inter-ferometer, Bachelor Thesis (2009), mechanical engineering.
• A. Oguz, Aufbau eines Testbeds zur Messung des relativen Intensitätsrauschens von Lasern, Bach-elor Thesis (2009), electrical engineering.
• M. Maurer, Entwicklung eines Quadranten-Photodetektors zur hochgenauen Phasen- und Wellen-frontmessung bis 20 MHz, Bachelor Thesis (2009), electrical engineering.
• F. Kittelmann, Entwicklung eines FPGA-basierten ultrapräzisen RF-Phasenmeters, Bachelor Thesis(2009), information technology.
• R. Spannagel, Integration und Test der Aktorik für ein Laserinterferometer zur hochauflösendenoptischen Profilometrie, Bachelor Thesis (2009), electrical engineering.
• C. Beurer, Optische 3D-Koordinatenmesstechnik mit codierter Streifenprojektion und Bildverar-beitung mit Schwerpunkt Flächenrückführung, Bachelor Thesis (2009)d, mechanical engineering.
Internships
• A. Pereyra, Aufbau eines optischen Metrologie-Systems zur Charakterisierung von schmalbandigenLasersystemen für Weltraumanwendungen, Internship Report (2009), electrical engineering.
• F. Kittelmann, Implementation of a Phasemeter in a FPGA, Internship Report (2009), informationtechnology.
• S. Waimer, Hochpräzise Bestimmung des linearen thermischen Ausdehnungskoeffizienten mittelseinem hochsymmetrischen Heterodyn-Inteferometers, Internship Report (2009), electrical engineer-ing.
• D. Küsters, Hochauflösende dynamische Charakterisierung eines Walking Piezo Motors, InternshipReport (2009).
Student Projects
• M. Liebhart und W. Baumgartner, Konzeption, Design und Realisierung einer Messstrahlaktuationfür die höchstauflösende optische Profilometrie, Master Project (2009), mechanical engineering.
• D. P. Fink, A. F. Zillinger, Inbetriebnahme einer 3D-Koordinatenmesseinrichtung mit Bildverar-beitungssensor, Bachelor Project (2009), mechanical engineering.
• A. Resch, Schlupffreie Geschwindigkeitsmessung nach optischem Korrelationsverfahren, MasterProject (2009), mechanical engineering.
• T. Pitzner, S. Voigt, Inbetriebnahme einer 3D-Mess- und Digitalisierungseinrichtung, BachelorProject (2009), mechanical engineering.
14 IOS Annual Report 2009

Publications
Journal Papers
• T. Schuldt, M. Gohlke, D. Weise, U. Johann, A. Peters, and C. Braxmaier, Picometer and nanora-dian optical heterodyne interferometry for translation and tilt metrology of the LISA gravitationalreference sensor, Classical and Quantum Gravity 26 (2009).
• J. Cordero, T. Heinrich, T. Schuldt, M. Gohlke, S. Lucarelli, D. Weise, U. Johann, and C. Braxmaier,Interferometry based high-precision dilatometry for dimensional characterization of highly stablematerials, Meas. Sci.Technol. 20 (2009).
• T. Schuldt, M. Gohlke, R. Spannagel, S. Ressel, D. Weise, U. Johann, and C. Braxmaier, Sub-Nanometer heterodyne Interferometry and its Application in Dilatometry and Industrial Metrology,Int. J. Opt. Mech. 3, 187 – 200 (2009).
• H. Schneckenburger, R. Börret, C. Braxmaier, R. Kessler, P. Kioschis, D. Kühlke, U. Mescheder,W. Schröder und C. Nachtigall, Dem Energiestoffwechsel von Tumorzellen und Bioreagenzien aufder Spur, BioPhotonik, 26 – 28, (September 2009).
• Y. Yovel, P. Stilz, M.O. Franz, A. Boonman, H.-U. Schnitzler, What a Plant Sounds Like: TheStatistics of Vegetation Echoes as Received by Echolocating Bats. PLoS Comput. Biol. 5(7):e1000429. doi:10.1371/journal.pcbi.1000429 (2009).
• Y. Yovel, M.L. Melcon, M.O. Franz, A. Denzinger, H.-U. Schnitzler, The Voice of Bats: How GreaterMouse-eared Bats Recognize Individuals Based on Their Echolocation Calls. PLoS Comput. Biol.5(6): e1000400. doi:10.1371/journal.pcbi.1000400 (2009).
• W. Kienzle, M.O. Franz, B. Schölkopf, F.A. Wichmann, Center-surround patterns emerge as opti-mal predictors for human saccade targets. Journal of Vision, 9(5):7, 1-15, http://journalofvision.org/9/5/7/, doi:10.1167/9.5.7 (2009).
• T. Bobach, G. Farin, D. Hansford, G. Umlauf: Natural neighbor interpolation using ghost points,Computer Aided-Design, 41(5): 350-365 (2009).
Peer Reviewed Papers in Conference Proceedings
• M. Gohlke, T. Schuldt, D. Weise, U. Johann, A. Peters, and C. Braxmaier, A high sensitivityheterodyne interferometer as a possible optical readout for the LISA gravitational reference sensorand its application to technology verification, in: Journal of Physics: Conference Series 154 -Proceedings of the 7th International LISA Symposium (2009).
• M. Gohlke, T. Schuldt, D. Weise, U. Johann, A. Peters, and C. Braxmaier, Development of anultrasensitive interferometry system as a key to precision metrology applications, Proc. SPIE Vol.7389, 73890V (2009). SPIE Europe – Optical Metrology, Munich.
• T. Schuldt, M. Gohlke, R. Spannagel, S. Ressel, D. Weise, A. Peters, U. Johann, and C. Braxmaier,High-resolution dimensional metrology for industrial applications, Proc. of ISMTII, (2009). ISMTII,St. Petersburg.
IOS Annual Report 2009 15

• M. Gohlke, T. Schuldt, D. Weise, A. Peters, U. Johann, and C. Braxmaier, A High PrecisionHeterodyne Interferometer for Relative and Absolute Displacement Measurement, IEEE ConferenceProc. ISOT (2009). ISOT, Istanbul.
• T. Schuldt, M. Gohlke, D. Weise, U. Johann, and C. Braxmaier, A high-precision dilatometer basedon sub-nm heterodyne interferometry, IEEE Conference Proc. ISOT (2009). ISOT, Istanbul.
• A. Barbero, M.O. Franz, W. v. Drongelen. J.R. Dorronsoro, B. Schölkopf, M. Grosse-Wentrup,Implicit Wiener Series Analysis of Epileptic Seizure Recordings, Proc. 31st Annual InternationalConference of the IEEE Engineering in Medicine and Biology Society (EMBC’09), Minneapolis,MN, USA, 5304-5307, 2009.
Conference Talks (without Proceedings)
• M. Gohlke, T. Schuldt, D. Weise, U. Johann, A. Peters, and C. Braxmaier, A High ResolutionInterferometer for LISA and its Application to Technology Verification, DPG – Frühjahrstagung,Hamburg (2009).
• S. Waimer, M. Gohlke, D. Weise, T. Schuldt, U. Johann, A. Peters, and C. Braxmaier, Ein optischesDilatometer zur hochpräzisen CTE-Wert Bestimmung, DPG – Frühjahrstagung Hamburg (2009).
• T. Schuldt, M. Gohlke, D. Weise, U. Johann, A. Peters, and C. Braxmaier, Picometer and Nanora-dian Interferometry for the LISA Gravitational Reference Sensor and its Application to TechnologyVerification, CLEO Europe, Munich (2009).
• K. Denker, G. Umlauf, Real-time triangulation of point streams, SIAM Conference on Mathematicsfor Industry: Challanges and Frontiers, San Francisco, USA (2009).
• D. Burkhart, G. Umlauf, An adaptive tetrahedral subdivision scheme for finite element analysis,SIAM/ACM joint Conference on Geometrical and Physical Modelling, San Francisco, USA (2009).
• G. Umlauf, Real-time triangulation of point streams, SIAM/ACM joint Conference on Geometricaland Physical Modelling, San Francisco, USA (2009).
• G. Umlauf, Adaptive tetrahedral subdivision for FEM simulations, Workshop: Subdivision and Re-finability, Pontignano, Italien (2009).
• G. Umlauf: Real-time triangulation of point streams, Symposium Geometric modelling, visualizationand image processing, FH Stuttgart (2009).
• G. Umlauf, Online triangulation of laser scan data, Workshop Industry challanges in geometricmodelling, CAD and simulation, TU Darmstadt (2009).
• B. Jödicke, Baumgartner, Drotleff, Hellbrück, et.al: Einfluss und Wechselwirkung von dynamis-chem Licht und Akustik auf die Leistungsfähigkeit von Mitarbeitern, 14. Symposium Licht undArchitektur; Staffelstein (02/2009).
Papers, not Reviewed
• B. Jödicke, Büroeffizienz. Das Projekt und die Ziele, Züblin, Stuttgart (Dezember 2009).
16 IOS Annual Report 2009

Awards
• K. Denker, Nachwuchspreis des Bezirksverbandes Pfalz, Kaiserslautern, 07.11.2009, Preisgeld 5000e.
Selected Media Coverage
• BBC: http://news.bbc.co.uk/2/hi/science/nature/8085477.stm, voice recognition in bats
• Tehran Times:http://www.tehrantimes.com/index_View.asp?code=196162, voice recognition inbats
• Ynet: http://www.ynet.co.il/articles/0,7340,L-3732275,00.html, voice recognition in bats
• Focus online: http://www.focus.de/finanzen/karriere/berufsleben/arbeitsplatz/arbeitsplatz-suche-nach-dem-wohlfuehl-buero_aid_380761.htmlDasWohlfühlbüro, Das Wohlfühlbüro
• Esslinger Zeitung: Das Wohlfühlbüro
• Main Post: Das Wohlfühlbüro
• Interview Radio Hamburg: Das optimale Büro der Zukunft
IOS Annual Report 2009 17

Laboratories
LET – Laboratory for EnablingTechnologies
The Laboratory for Enabling Technologies (LET)was founded in 2007 at Astrium Friedrichshafenwithin the department Science Missions & Sys-tems (AED41, head: Dr. Ulrich Johann). It is man-aged in close collaboration with the optical metrol-ogy group of Prof. Braxmaier of the IOS Kon-stanz and devoted to research and development ofnovel technologies crucial to the success of futurespace missions and systems. Led by Prof. ClausBraxmaier (HTWG) and Dr. Dennis Weise (As-trium), the LET provides the framework for studentprojects carried out in PhD., master and bachelortheses as well as internships where the main fields ofstudies are mechanical engineering, electrical engi-neering, information technology/computer scienceand physics. The highly-motivating atmosphere to-gether with interdisciplinary leading-edge space re-
search attracted numerous students over the pastyears. The direct interaction with the scientific com-munity is considered as a key success factor for theLET effectiveness.
The LET comprises state of the art optical labequipment, including vibration isolated optical ta-bles, frequency and wavelength analysis and lasersystems (including an iodine stabilized referencelaser).
Current activities include the development of fol-lowing key technologies for future space missions:
• Space laser metrology for inertial sensors
• AI technology for optical systems
• �N thrusters
• Actuators for space applications
• Frequency references
• Test beds for future missions
18 IOS Annual Report 2009

Laboratories
Laboratory for Applied Optics
The laboratory for applied optics is located inbuilding G of HTWG and is led by Prof. Claus Brax-maier. On the one hand, this lab includes researchactivities of the IOS in the field of applied optics(which are also detailed in the research activitiesdescriptions), on the other hand this lab representsthe basis for optical experiments carried out by stu-dents during different study programs. Several fun-damental optical experiments are build up for stu-dent education, including
• Optical profilometry
• Actuators for beam manipulation
• Interferometry (Michelson, Mach-Zehnder)
• Optical data transmission
• 3D optical digitalization using fringe method
• Fizeau interferometry for topography
• Triangulation measurement
• Basic optical experiments (e.g. diffraction,dispersion)
Several bachelor, master and diploma thesisas well as student projects were carried out inthe laboratory for applied optics. This includesstudents from different faculties such as Me-chanical Engineering, Electrical Engineering andInformation Technology, Computer Sciences.
IOS Annual Report 2009 19

Laboratories
Computing Infrastructure
The compute and network environment of the in-stitute is based on Intel and AMD multicore ar-chitectures connected with 1 GBit Ethernet. The20 workstations use the operating systems UbuntuLinux, Microsoft Windows and Mac OS. The cen-tral file server is integrated in the cluster system. Forcomputation-intensive applications, such as multi-spectral image processing or the training of learningmachines, we run a compute cluster under UbuntuLinux. The cluster consists of a master node and acompute node with Intel Xeon CPUs, providing 40processor kernels and 256 GB of RAM. Both nodesare mounted in a liquid-cooled rack with a 10 kWUPS. The internal cluster communication uses 2GBit Ethernet and connects via FibreChannel to aRAID 6 storage system with 3.5 TB capacity toguarantee a high data throughput. Resources aremanaged with the SUN GridEngine. The cluster isconnected to the backbone of the HTWG networkvia 10 GBit FibreChannel. Data backup is guaran-teed by the central computer services of the HTWG.
Image Sensor Laboratory
The Image Sensor Laboratory is used to build, eval-uate and calibrate the various camera systems usedin the image processing projects of the IOS. Prelim-inary experiments are run directly in the IOS mainoffice in a laboratory section which can be isolatedwith a light-proof curtain, whereas higher preci-sion experiments are done in various laboratories onthe HTWG campus with appropriate facilities. Forhigh-resolution multispectral imaging, we disposeof a Peltier-cooled pco.4000 14 bit camera with a4008�2672 CCD array and a VariSpec Tunable Fil-ter that allows for selecting an arbitrary 30 nm wideband in the visual range via a computer interface.For inspecting and processing colour images, weuse a specialised graphics workstation with a high-fidelity calibrated colour display. Spectral measure-ments are done with a KonicaMinolta CS 2000 ab-solute spectrometer. In applications requiring highCCD sensor sensitivities (such as the optical radarproject), we have another Peltier-cooled pco.1600colour camera with less resolution, but higher sen-sitivity.
20 IOS Annual Report 2009

Research Activities

22 IOS Annual Report 2009

Optical Metrology
Picometer and Nanoradian Heterodyne Interferometry
Martin Gohlke, Thilo Schuldt, Achim Peters, Ulrich Johann, Dennis Weise, and Claus Braxmaier
We present a symmetric heterodyne interferometer as prototype of a highly sensitive trans-lation and tilt measurement system. It was developed as possible candidate for the opticalreadout aboard the LISA (Laser Interferometer Space Antenna) satellites and becomes thekey technology for LISA related performance tests during the last years, for example: ex-pansion measurements in a dilatometer or high precision measurements of piezo actuatorsand mechanisms. We show the current performance of the interferometer and the resultsof the performed noise studies in 2009.
Introduction
The planned LISA Mission aims to detect gravita-tional waves in the frequency band from 1mHz to1 Hz [1]. Gravitational waves stretch and shrink thespace-time – consequently a typical gravitationalwave causes a small change of the distance L be-tween two proof masses, i.e. ∆L/L � 10-21. Inthe LISA concept, three satellites – a free fallingproof mass aboard of each – are forming an equi-lateral triangle with an edge length of around 5million km. The edge length changes about few pm(10�12meter) when a gravitation wave passes. Thisleads to the requirements for the positioning sensorsaboard the satellites:
• translation measurement noise
< 1 pm �r
1 +�2.8mHz
f
�4
• measurement of the proof mass tilt
• low interaction with the proof mass
• measurement band from 1 mHz to 1 Hz
An optical readout (ORO) is the current baseline inthe LISA concept.
EADS Astrium (Friedrichshafen), in collabora-tion with the Humboldt University Berlin andHTWG Konstanz, has realized a prototype ORO
over the past years. The heterodyne interferom-eter [2] is based on a highly symmetric designwhere both, measurement and reference beam havea similar optical pathlength and the same fre-quency and polarization. The technique of differ-ential wavefront sensing (DWS) for tilt measure-ment is implemented. With this setup noise lev-els below 5 pm Hz�1=2 for translation and below10 nrad Hz�1=2 for tilt measurements – both for fre-quencies above 10 mHz – were demonstrated. Withthis excellent noise performance the interferometeris a useful tool for many applications in the LISAcontext and other concept studies.
In 2009 we investigated noise sources of the ex-isting setup, especially the phasemeter, the analog-digital converters (ADCs) and the front-end elec-tronics (photo diodes). Beside these "noise hunt-ing" activities we also plan a new interferometersetup. The baseplate will be made of Zerodur, anultra stable glass ceramic with a low coefficient ofthermal expansion (CTE � 0.02 10�6 K�1) insteadof aluminum as in the current setup.
Current Status
The interferometer setup can be divided into fourparts: laser, optical setup, front-end electronics andphasemeter. In 2009 we have investigated the noise
IOS Annual Report 2009 23
sources starting at the phasemeter.Our digital phasemeter is implemented on a field
programmable gate array (FPGA) board. The eightincoming analog signals are converted by 16-bitanalog-digital converters at 160 kHz. Each digitizedsignal is mixed with an internal 10 kHz sinusoidalsignal, the product passes a low-pass filter. After-ward the phase-containing signal can be stored inFIFO (first-in-first-out) memory. The FIFO infor-mation is used by a LabView program to computetranslation and tilt of the proof mass.
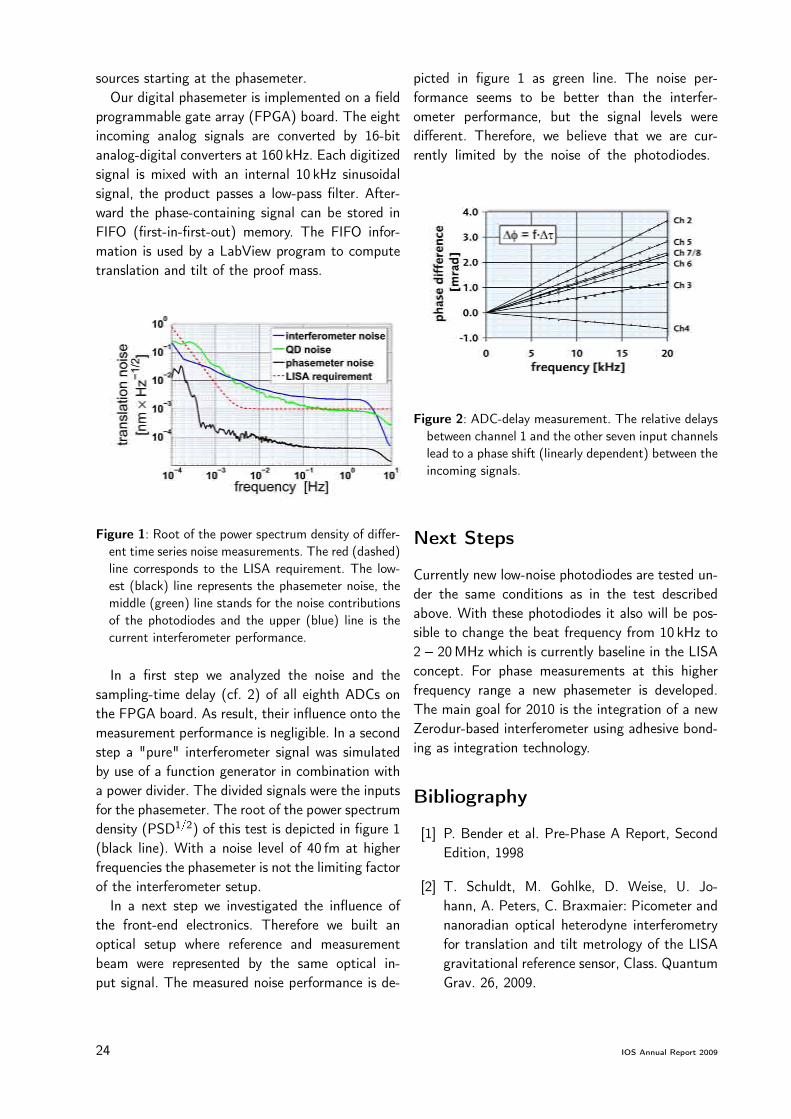
Figure 1: Root of the power spectrum density of differ-ent time series noise measurements. The red (dashed)line corresponds to the LISA requirement. The low-est (black) line represents the phasemeter noise, themiddle (green) line stands for the noise contributionsof the photodiodes and the upper (blue) line is thecurrent interferometer performance.
In a first step we analyzed the noise and thesampling-time delay (cf. 2) of all eighth ADCs onthe FPGA board. As result, their influence onto themeasurement performance is negligible. In a secondstep a "pure" interferometer signal was simulatedby use of a function generator in combination witha power divider. The divided signals were the inputsfor the phasemeter. The root of the power spectrumdensity (PSD1=2) of this test is depicted in figure 1(black line). With a noise level of 40 fm at higherfrequencies the phasemeter is not the limiting factorof the interferometer setup.
In a next step we investigated the influence ofthe front-end electronics. Therefore we built anoptical setup where reference and measurementbeam were represented by the same optical in-put signal. The measured noise performance is de-
picted in figure 1 as green line. The noise per-formance seems to be better than the interfer-ometer performance, but the signal levels weredifferent. Therefore, we believe that we are cur-rently limited by the noise of the photodiodes.
Figure 2: ADC-delay measurement. The relative delaysbetween channel 1 and the other seven input channelslead to a phase shift (linearly dependent) between theincoming signals.
Next Steps
Currently new low-noise photodiodes are tested un-der the same conditions as in the test describedabove. With these photodiodes it also will be pos-sible to change the beat frequency from 10 kHz to2� 20 MHz which is currently baseline in the LISAconcept. For phase measurements at this higherfrequency range a new phasemeter is developed.The main goal for 2010 is the integration of a newZerodur-based interferometer using adhesive bond-ing as integration technology.
Bibliography
[1] P. Bender et al. Pre-Phase A Report, SecondEdition, 1998
[2] T. Schuldt, M. Gohlke, D. Weise, U. Jo-hann, A. Peters, C. Braxmaier: Picometer andnanoradian optical heterodyne interferometryfor translation and tilt metrology of the LISAgravitational reference sensor, Class. QuantumGrav. 26, 2009.
24 IOS Annual Report 2009

Optical Metrology
Setup of an Ultra-Stable Interferometer Using Novel IntegrationTechniques
Thorsten Meisner, Scarlett Strohmaier, Simon Ressel, Dominik Rauen, Martin Gohlke,Ulrich Johann, Dennis Weise, and Claus Braxmaier
A new high-sensitivity and ultra-stable heterodyne-interferometer is developed which is anadvanced version of an already existing system. With help of special integration techniquesthe interferometer setup realized on an aluminum base plate will be transferred to a base-plate made of Zerodur. The aim is to measure resolutions on picometer and nanoradianlevel fulfilling the LISA requirements concerning acceptable noise levels. In particular it isassumed that thermal noise will be reduced because Zerodur shows a very low coefficientof thermal expansion and is therewith qualified to withstand high temperature gradients.Further effort is the miniaturization of the existing system. In this report the design andthe integration technique is described.
Based on the experience with our high sensitivityheterodyne interferometer, an advanced interferom-eter setup is developed where the baseplate is madeof Zerodur, a glass ceramics with a very low coef-ficient of thermal expansion of 2 � 10�8 K�1. Theoptical components are made of fused silica andfixed to the baseplate using adhesive bonding tech-nology. In this report we describe the integrationtechnology, the design of the new interferometerand the development of specific adjustment toolsneeded for interferometer integration.
Integration technology
The methods of adhesive bonding and hydroxide-catalysis bonding were evaluated with respect tofixing the optical components to the Zerodur base-plate. A testboard with 6 mirrors fixed to a base-plate made of Zerodur using both integration tech-niques was set up and vibration and shock testswere carried out in the Vibration Test Facilitiesof EADS Astrium in Friedrichshafen. While the vi-bration tests were realised with a sine and a ran-dom stimulation, the shock tests were performedaccording the ECSS and the LISA Pathfinder re-quirements. A temperature cycling stability was alsocarried out. The testboard was placed in a thermal
chamber and according to the LISA requirementsthe temperature range was controlled from -20�C to50�C. This range was cycled eight times during 51hours with a temperature change rate of 2�C/min.Before and after these tests the alignment of themirrors concerning their angles to each other wasmeasured. The measured deviations lay within themeasurement error bars. In both investigations, noappreciable disadvantage of one of the two bondingmethods could be observed. However, for the designof the new interferometer it is decided to use themethod of adhesive bonding. For the integration ofthe optical components on Zerodur it is advisableto have enough time to align the components ifapplicable. Since a broader time frame and lowerrequirements of space-qualified adhesives, adhesivebonding is more feasible.
Design of the new interferometer
The new heterodyne interferometer was plannedwith the CAD software Autodesk Inventor. Thebeam path of the new interferometer is shown infigure 1 (top), it is placed on a breadboard with thedimensions 200 � 200 � 40 mm3 (l � w � h).
IOS Annual Report 2009 25
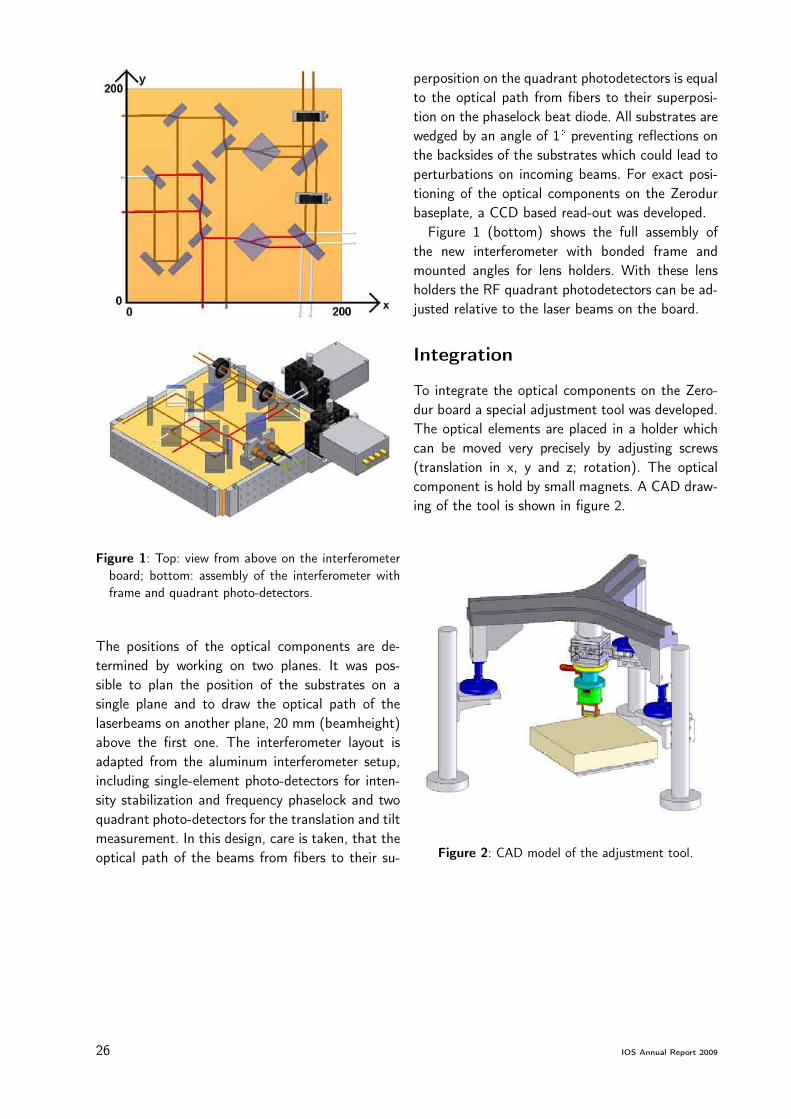
Figure 1: Top: view from above on the interferometerboard; bottom: assembly of the interferometer withframe and quadrant photo-detectors.
The positions of the optical components are de-termined by working on two planes. It was pos-sible to plan the position of the substrates on asingle plane and to draw the optical path of thelaserbeams on another plane, 20 mm (beamheight)above the first one. The interferometer layout isadapted from the aluminum interferometer setup,including single-element photo-detectors for inten-sity stabilization and frequency phaselock and twoquadrant photo-detectors for the translation and tiltmeasurement. In this design, care is taken, that theoptical path of the beams from fibers to their su-
perposition on the quadrant photodetectors is equalto the optical path from fibers to their superposi-tion on the phaselock beat diode. All substrates arewedged by an angle of 1� preventing reflections onthe backsides of the substrates which could lead toperturbations on incoming beams. For exact posi-tioning of the optical components on the Zerodurbaseplate, a CCD based read-out was developed.
Figure 1 (bottom) shows the full assembly ofthe new interferometer with bonded frame andmounted angles for lens holders. With these lensholders the RF quadrant photodetectors can be ad-justed relative to the laser beams on the board.
Integration
To integrate the optical components on the Zero-dur board a special adjustment tool was developed.The optical elements are placed in a holder whichcan be moved very precisely by adjusting screws(translation in x, y and z; rotation). The opticalcomponent is hold by small magnets. A CAD draw-ing of the tool is shown in figure 2.
Figure 2: CAD model of the adjustment tool.
26 IOS Annual Report 2009

Optical Metrology
Development of RF Quadrant Photodetectors
Steffen Wälde, Martin Maurer, Hans-Reiner Schulte, Ulrich Johann, Claus Braxmaier,and Dennis Weise
We built a quadrant photodetector for LISA with a very flat frequency response and aconstant phase shift at 1064 nm. This detector has a DC-path for frequencies from DC to20 kHz and an AC-path for frequencies between 2 and 20MHz. The sensitivity of the AC-path is between 814 nW and 1.3 µW, the sensitivity of the DC-path is between 13.5 µW and1.6mW. A quadrant photodiode is used for the technique of differential wavefront sensing.The two paths are for each of the four quadrants present. For differential wavefront sensingthe phase of all quadrants has to be identical so the electronic design and the PCB layoutof every channel has to be as equal as possible.
Introduction
The LISA mission as a space-based gravitationalwave detector aims to detect gravitational wavesin a frequency band from 0.1mHz to 1Hz. Threesatellites arranged in a nearly equilateral trianglewith an edge length of about 5 million km will fly inan earth-trailing orbit arround the sun. The distancebetween the satellites will be measured with an in-terferometer setup. During the mission the distancebetween the satellites varies with about 50000 kmwhich causes a Doppler shift of the laser frequencyin a range of 2 to 19MHz.In this context we developed a RF low noise quad-rant photo detector which is suited for high preci-sion phase measurements in a sub-Hz LISA mea-surement band. It uses an Indium Gallium Arsenidequadrant photodiode with a total diameter of 1mm.The detector as a position sensitive device can alsobe used for the technique of differential wavefrontsensing. With respect to the mission requirementsthe detector has a constant frequency response anda linear phase response for frequencies between 2and 20MHz. It has also a path for frequencies be-tween DC and 20 kHz for each quadrant.The follwoing sections show the electrical setup andthe current measurements.
Detector Design
In the interferometer setup the two laser beamshave different frequencies !1 and !2. The beamscan be described with the equations 1 and 2. Thesuperposition of the beams arises from equation 3.For this reason we developed two circuits which candetect AC and DC signals.
E1 = E1 � e [j(k1z1�!1t+'1)] (1)
E2 = E2 � e [j(k2z2�!2t+'2)] (2)
jEgesj2 = jE1 + E2j2 = E 21 + E 2
2| {z }DC signal
+ (3)
+ 2E1E2cos [(k1z1 � k2z2) � ∆!t + ∆']| {z }AC signal
The AC-path which is the main measuring chan-nel filters the AC signal in a range of 2 to 20MHz.The filter of this path consists of the capacitanceof the photodiode, an inductance and a second ca-pacitance. The main task of the filter is formingthe frequecy response. The signal level is adaptedto the AD converters of our FPGA board.The DC-path detects the DC signal and frequen-cies up to 20 kHz of the AC signal of equation 3.We can use this path with our old interferometersetup which has a beat frequency ∆! of 10 kHz
IOS Annual Report 2009 27

and to monitor optical intensity.For optimal performance at 1064 nm indium gal-
lium arsenide (InGaAs) quadrant photodiodes areused. InGaAs Diodes have a responsivity of 0.7 A
Wat 1064 nm. The used quadrant diodes have an op-tical sensitive area with an active diameter of onemillimeter since the laser beam of our interferom-eter setup has a diameter of 1.5mm. For a stablebias generation a high precision 5V voltage referece(AD586) is used.For best RF shielding a 4-layer PCB-layout is used.The AC-path on the top layer is shielded from theother layers with a ground-plane between the toplayer and the other layers. The third layer is used forthe power supply and the connection of the PT100temperature sensor. Ground connections are real-ized with vias to the ground-plane so that the wayto ground is as short as possible.The fourth layer(bottom layer) is used for the DC-path and the biasgeneration. Figure 1 shows a qadrant photodetectormounted on a part of its housing. In our layout onlySMD (Surface Mounted Device) parts are used.
Figure 1: Photo of a quadrant photodetector
Results
In this chapter we present the test of the detector.First we measured the electronic performance with-out the photodiode. With a BNC connector and a20 pF capacitor soldered on the PCB we simulatedthe photodiode. Over the BNC connector a test sig-nal for the electronic measurements was introduced.After the electronic measurements the photodiodewas soldered in for optical measurements.For testing the electronic assembly, we used a net-work analyzer to measure the phase and the fre-quency response of every quadrant. For AC mea-surements a HP8753A network analyzer is used.
Figure 2: The measured linearity of the AC-path
The phase response of one AC-path is shown inFigure 2. The plot shows the phase shift from DCto 50MHz. In a range of 2 to 20MHz the phaseresponse is linear.The noise measurements of the DC-path were madewith our phasemeter. With the phasemeter we sam-pled with 20Hz while a laser beam with a beat-frequency of 10 kHz was pointing on the photodi-ode. While this measurement the whole beat setupand the detector were in a vacuum chamber at4.6 � 10�3 mBar. A plot of the result is shown inFigure 3.
Figure 3: Noise measurement of the DC-path. In theFigure the PSD of the phase difference of quadrantA and quadrant B is shown.
Outlook
Up to now we produced four quadrant photodetec-tors. For the next time we plan noise measurementsof the AC-path with the new phasemeter and thesame setup, but with a 10MHz beat signal insteadof 10 kHz. Furthermore we want to measure thecrosstalk between the AC und DC channels and thesignal-to-noise ratio (SNR).
28 IOS Annual Report 2009

Optical Metrology
Development of an Ultraprecise Digital RF Phasemeter
Markus Wussler, Franziska Kittelmann, Martin Gohlke, Hans-Reiner Schulte, Ulrich Johann,Claus Braxmaier, and Dennis Weise
The future LISA Mission requires an ultraprecise phasemeter for acquisition of interferom-eter beat signals with µrad precision whose differential phase contains information aboutthe distance fluctuations between two satellites. This article presents the concept of thenew phasemeter. First we show the principal idea and the first design of the PLL (PhaseLock Loop). Finally, we present the current status, show some performance measurementsand give an outlook of the next planned steps.
Introduction
LISA is an ESA/NASA mission with the scientificgoal, to measure gravitational waves in a very lowfrequency band from 30 µHz to 1Hz. Therefore itis necessary to measure a variation of the distancebetween two satellites in the range of picometers.There are three satellites grouped in a equilateraltriangle with a relative arm length of 5million km.The constellation follows the earth in a distanceabout 50million km. To reach the picometer ac-curacy, a heterodyn interferometer setup is used.The output of the interferometer is a sinusoidalsignal. The phase of this signal contains the in-formation about the displacement of the satellite. A phasemeter was developed over the last yearsand is currently under investigation. With our pro-totyp of a phasemeter, based on a FPGA (FieldProgrammable Gate Array) the phase of two signalscan be measured and thus the changes of distancecan be calculated.
Requirements
The phasemeter’s goal is to determine the phase ofsignals in a frequency band from 2 to 20 MHz withµrad accuracy. To realize this a high precision phaselocked loop phasemeter implemented in a FPGA
is needed (see Figure 1). In the current setup aStratix II Developementboard is used as FPGA. Ithas two AD Converter inputs with a sampling rateof 100 MHz. Every 100 ms the phase and frequencywill be read out via RS232. This lead to a data re-duction up to 107. On the computer a self writtenC-program will save the incoming data stream forpost processing analysis.
Figure 1: Logical design of the PLL. PD phase detector,Cont controller, LUT look up table
Layout and Function
The main items of the phasemeter are two paral-lel working PLLs. For future studies the number ofPLLs will be extended. The analog signal will bedigitalized by 12 bit ADCs with a sample rate of100MHz. The digitalized signal is the input for thefirst stage of the PLL, the phasedetector (PD). It
IOS Annual Report 2009 29
multiplies the incoming signal (f1) with a signal (f2)from a NCO (Numerical Controlled Oscillator). Theresulting sinusoidal signal contains the sum (f1+f2)and the difference (f1� f2) of both signals. The fol-lowing low pass filter is separating the DC (diff) andthe AC-Part (sum). The DC-Part is used as the in-put signal for the controller and contains informa-tion about the difference of the phase. The con-troller is connected to a phase register. The phaseregister works like a counter and is referencing thecontroller to the Look-Up-Table (LUT). The LUT,the controller and the phaseregister constitute thenumerical controlled oscillator. The error signal andthe NCO frequency signal from the controller out-put contains the phase and frequency informationof the input signal from our measurement signal.Both information will be decimated by a filter andsend to the RS232 Interface.
Implementation
The phasemeter firmware is written in VHDL (VeryHigh Speed Integrated Circuit Hardware Descrip-tion Language). It is separated into logical functionblocks stored in a self generated library. Thus it ispossible to duplicate and combine the single blocksvery easily. Every block just have to be instancedin the main program and the compiler will gener-ate the signal path in the register transfer level. Allvariables and components are defined in a globalvariable level. The developement of this enviromen-tal structures was one of the main challenge of thelast year activities, but now it makes it comfortableto accomplish any kind of changes. The datablockaccumulates the measurement signals from the dif-ferent PLLs and send them to the RS232 interface.The computer uses a self developed C-program tostore the data stream in a text file which will beused for post processing analysis.
Current Performance
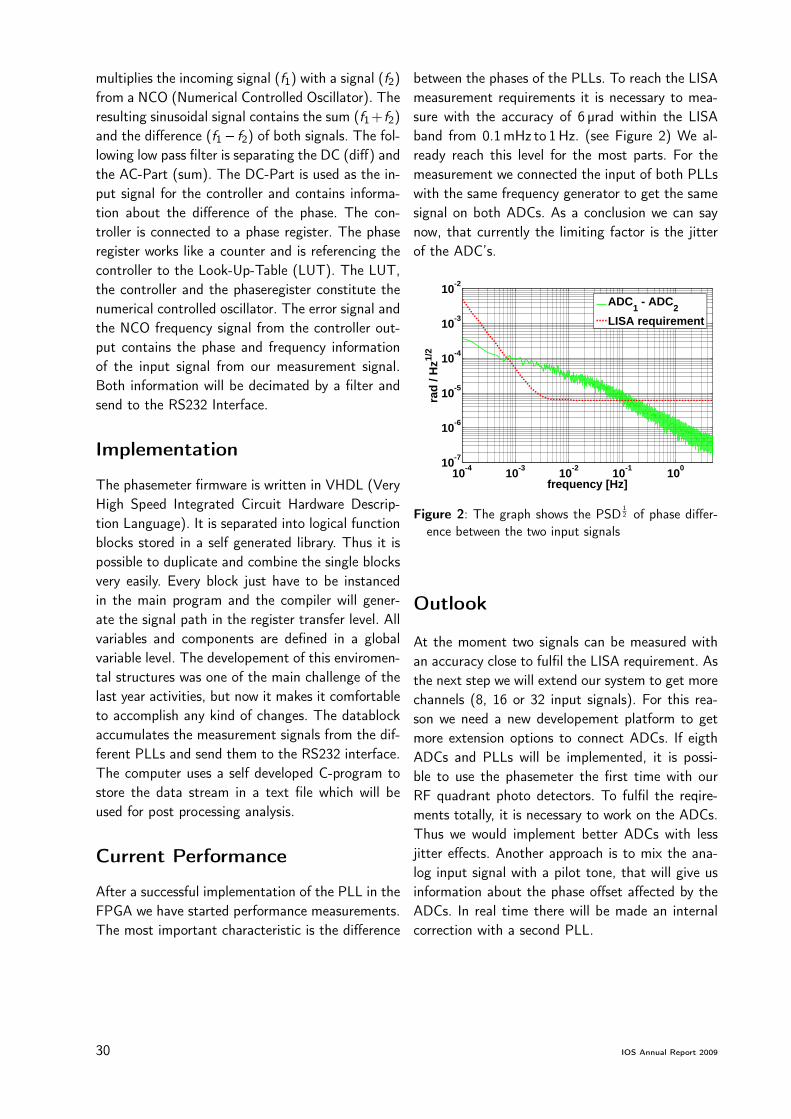
After a successful implementation of the PLL in theFPGA we have started performance measurements.The most important characteristic is the difference
between the phases of the PLLs. To reach the LISAmeasurement requirements it is necessary to mea-sure with the accuracy of 6 µrad within the LISAband from 0.1 mHz to 1 Hz. (see Figure 2) We al-ready reach this level for the most parts. For themeasurement we connected the input of both PLLswith the same frequency generator to get the samesignal on both ADCs. As a conclusion we can saynow, that currently the limiting factor is the jitterof the ADC’s.
10-4 10-3 10-2 10-1 10010-7
10-6
10-5
10-4
10-3
10-2
rad
/ Hz1/
2
frequency [Hz]
ADC1 - ADC2LISA requirement
Figure 2: The graph shows the PSD12 of phase differ-
ence between the two input signals
Outlook
At the moment two signals can be measured withan accuracy close to fulfil the LISA requirement. Asthe next step we will extend our system to get morechannels (8, 16 or 32 input signals). For this rea-son we need a new developement platform to getmore extension options to connect ADCs. If eigthADCs and PLLs will be implemented, it is possi-ble to use the phasemeter the first time with ourRF quadrant photo detectors. To fulfil the reqire-ments totally, it is necessary to work on the ADCs.Thus we would implement better ADCs with lessjitter effects. Another approach is to mix the ana-log input signal with a pilot tone, that will give usinformation about the phase offset affected by theADCs. In real time there will be made an internalcorrection with a second PLL.
30 IOS Annual Report 2009

Optical Metrology
Laser Frequency Stabilization to Optical Resonators
Felix Rey, Martin Gohlke, Hans-Reiner Schulte, Ulrich Johann, Dennis Weise,and Claus Braxmaier
High-precision interferometry – as it is used for the LISA-Mission – requires highly stablelaser frequencies. Common lasers emit light over a short spectral range (small line width)and for most applications the light can be approached as monochromatic. But in orderto cope with the high requirements of the LISA-Mission, the laser line width – and alsolaser frequency drifts over long time scales – have to be further reduced. Therefore, thelaser frequency has to be stabilized using a feedback control system. As reference eitheran atomic or molecular transition or an optical resonators can be used. The Laboratoryof Enabling Technologies already possesses a system locked to a transition of iodine, toachieve long-term stability. But on short time scales, frequency stabilizations to opticalhigh-finesse resonators provide best results. Therefore two laser stabilization setups basedon optical resonator are going to be realized. In the following, the initial work for thesesetups is outlined.
λ/4 λ/2 λ/2
EOM
Modulation
Signal
Resonator
PBS
Intensity
Detector
Mephisto
Laser @
1064nm
λ/4 λ/2BS
Stabilized
Laser Beam
Phase-shifted
Modulation Signal
Piezo+ ∫
X
Loop-Amplifier
Isolator
Pol.Pol.
Pol.
RF Detector
Figure 1: Pound-Drever-Hall setup for laser frequency stabilization using an optical high-finesse resonator (EOM -electro optic modulator, BS - beamsplitter, PBS - polarized beamsplitter, RF - radio frequency, Pol. - polarizer)
In our setup we use the most common tech-nique for laser frequency stabilization based on op-tical resonators, the Pound-Drever-Hall method. Aschematic of our whole setup is shown in figure 1.The isolator protects the laser from back reflexionsand the beam splitter (BS) reflects part of the lightfor further purposes. In order to achieve flexibility,
the stabilization setup is connected via an opticalfiber.
After fiber output, the phase of the light is mod-ulated by an electro-optic-modulator (EOM). Thepolarizing beamsplitter (PBS) separates a part ofthe incoming beam to measure the intensity on thephotodetector. Later this signal can be used for an
IOS Annual Report 2009 31

additionally intensity stabilization. The transmittedpart of the light is sent to the resonator. In order tominimize environmental influences, the resonator isprotected in a high vacuum chamber. The pair oftwo lenses matches the Gaussian beam to the eigen-mode of the resonator. After passing twice the �=4-waveplate, the polarization of the beam reflected bythe resonator is rotated by 90� and is deflected tothe RF single-element photodetector, which is anoffshoot of the RF quadrant photodetector. Thetilted components in front of the detectors and thePBS are ND-filters, which attenuate reflexions. Theelectric signal of the RF signal for frequency stabi-lization is amplified and mixed with a sine signal atthe EOM modulation frequency whose phase rel-ative to the EOM driving signal can be adjusted.After low-pass filtering, the resulting signal is usedas error signal for a feedback control systems. Infigure 2 its mathematical prediction is illustrated.With altering phase-shift between the modulationsignals of the mixer and the EOM, the slope aroundthe operation point varies. For best sensitivity, theslope should be maximal.
-20 -15 -10 -5 0 5 10 15 20-0.4
-0.3
-0.2
-0.1
0
0.1
0.2
0.3
0.4
f = f - fresonant
in MHz
erro
r sign
al
Figure 2: Calculated error signal using Pound-Drever-Hall technique.
The error signal is input to a P-I control elec-tronics which actuates the laser frequency via apiezo which performs pressure on the laser-crystaland alters the emitting frequency. A disadvantageof the fast piezo actuation is the small range of fre-quency variatioin. Therefore the setup can be ex-tended with another Loop-Amplifier, which takesthe piezo-signal and regulates the temperature ofthe laser crystal. This slow actuation copes withlarge frequency drifts.
Resonator Mounting
The mounting of the resonator has to protectthe resonators from soiling, minimizes vibrationsand guarantees a benign temperature environment.Moreover it has to mount the resonator without de-forming it. In figure 3 an explosion drawing of themounting is shown.
Figure 3: Explosion drawing of the setup for resonatormounting.
Between the aluminum groundplate and thebottom-housing, macor sockets function as ther-mal washer. Macor is a glass ceramic with ultralow thermal conductance. The bottom- and top-housing and the bars under the resonator are madeout of copper in order to guarantee a uniform tem-perature around the resonator. The resonator lieson the middle two viton rings, which are pinned onthe copper bars. Viton is a vacuum suitable fluo-roelastomer. The exterior rings are supported by thebottom-housing. The bars are hollow and filled withsilica sand. Together with the double viton support-ing, this minimizes vibrations of the resonator. Thetop-housing has two holes, one for the transmittingand one for the reflected beam.
The whole resonator mounting is build in a vac-uum chamber and wrapped in MLI-foil to get addi-tional protection against external influences. In thelast months of 2009 nearly all components for bothfrequency stabilization setups were procured. In thefirst quarter of 2010, a working setup of one laserfrequency stabilization is intended.
32 IOS Annual Report 2009

Optical Metrology
Validation of In-Field Pointing Concepts for LISA
Andreas Keller, Daniel Küsters, Martin Gohlke, Ulrich Johann, Claus Braxmaier,and Dennis Weise
For ’In-Field Pointing’ mechanism (IFPM) – an alternative solution for steering the line ofsight on LISA mission – a piezo linear motor is characterised. It is designated to actuate asmall mirror located in the pupil plane of the telescope which defines some requirementson travel range and position accuracy. Measurements of pin motion are performed with theinternal linear encoder and a sub-nanometer heterodyn interferometer. After an introductionto the topic the actuator is presented. In the following the test setup, first results and asummary is given.
Introduction
’In-Field Pointing’ is an alternative payload con-cept for LISA mission which is used for steering thelines of sight of the two telescopes to compensatefor constellation breathing. This done directly by asmall, actuated mirror located in an intermediatepupil plane of the telescope [1].
A possible candidate for actuator is a NexlineN-111 of PI which may deliver the requirementsfor travel range and position accuracy. This deviceis characterised in cooperation with TNO in Delfton the aspect of operation for this purpose.
In the next sections the actuator is described,followed by a short description of the measurementsetup and first results.
Nexline actuator
The Nexline actuator is a piezo linear motor whichmoves a pin with several stacks of piezos [2]. Apiezo stack consists of a shear piezo, which is usedto shift the pin, and a clamp piezo which controlsthe mechanical contact of shear piezo with the pin.The pin can be moved in two different modes. In theprecise positioning mode only the shear piezos areactuated. When commanded position exceed thetravel range of the shear piezos the piezos have to
hand-over which is also called step mode.The actuator is commanded with a controller re-
sponsible for voltage management and closed loopoperation (when equipped with a linear encoder forposition response). Both devices are shown in fig-ure 1. The actuator has a resolution of 5 nm inclosed loop operation.
Figure 1: Nexline actuator and controller
Setup
The movement of the actuator are characterised bytwo different ways, the internal linear encoder anda high precision heterodyne interferometer with anoise floor in the subnanometer range. With the in-terferometer the angle of the mirrors can also bemeasured.
IOS Annual Report 2009 33

The typically used measurement procedure isas follows: The velocity and end position is com-manded to the controller which autonomous ap-proaches the position (in closed-loop operation). Itchooses automatically the mode and makes steps ifnecessary.
During the movement the actual position mea-sured by linear encoder or interferometer is con-stantly recorded.
Results
The following section presents first results obtainedby both linear encoder and interferometer.
Hand-over of piezos
Every 3.3 µm the shear piezos have to perform astep which leads to short displacement of the pin inthe order of 1�2 µm (see figure 2). These displace-ments are independent on velocity and go back tooriginal position due to the closed loop operation.
5900 5920 5940 5960 5980 60002.5
3
3.5
4
4.5
5
5.5
6
Time [ms]
Tran
slat
ion
[µm
] 0.1 µm/s
20 µm/s
Figure 2: Hand-over process with two different com-manded velocities (0.1 µm/s green and 20 µm/s bluecurve).
Vibrations on setup
The interferometer is able to measure tilt ofa fixed mirror mounted on the Nexline sup-port. Two peaks are visible in figure 3 whichcoincide with start and end of hand-over pro-cess. This is presumably due to lift and reclampof piezo stacks releasing tensions on the pinwhich causes vibrations on the entire mount.
0.0750.018 0.045-2000
-1000
0
1000
2000
Tran
slat
ion
(nm
)
0.0750.018 0.045
-3
-1
1
3
tilt (
µrad
)
Vibrations in reference angle
Time (s)
Figure 3: About 30 step events shown. Upper part:translation of pin mirror, lower part: vibrations in an-gle of fixed reference mirror. The vibrations coincidewith start and end of step process.
Nonlinearities on trajectory
The controller is optimised to obtain a constant ve-locity of pin movement. But it turned out that thevelocity can be different than the commanded. Thishappens on a short period of time midways of twosteps. The origin of this nonlinearity is unknown.
Summary
During the tests, several serious performance limita-tions are determined. With regard to In-Field Point-ing there exist two possibilities, searching for an-other actuator complying better with requirementsor elaborate a workaround for the limitations.
The next steps will be to investigate for an al-ternative actuator and to characterize other partsof the IFPM, for example the mirror surfaces. Inthe process it is planned to move the mirror later-ally relative to the interferometer and measure thesurfaces unevenness in the picometer range.
Bibliography
[1] Astrium GmbH and TNO Delft. Antrag aufZuwendung: Validation of In-Field PointingConcepts for LISA, 2008.
[2] PI. PZ161E User Manual, E - 755 Digital Con-troller for Nexline Linear Drives.
34 IOS Annual Report 2009
Optical Metrology
Investigations towards µN High Efficiency Multistage PlasmaThrusters
Andreas Keller, Marcel Berger, Davar Feili, Dennis Weise, Ulrich Johann, and Claus Braxmaier
Future space missions in earth observation and science are based on high accuracy metrologypayloads, mostly in combination with drag free attitude control of the spacecraft. Goalis to ensure an appropriate noise-free environment for the sensitive measurements of forexample Earth’s gravity field and its gradient, gravitational waves or Earth’s magnet field.For that purpose thrusters with µN thrust and minimum noise are required. Different kindsof thrusters are currently on development (RITs, FEEPs, GITs) with great difficulties inlifetime and noise behavior. In this report we present the initial work with respect to afeasibility study of HEMP (High Efficiency Multistage Plasma) thrusters down-scaled tothe µN-region. An introduction to the principle is given and first test results of a prototypeare presented.
Introduction
In the last decades electric propulsion was used inmany satellite missions flying in space. The firstideas lies 100 years behind.
The major advantage of electric propulsion incomparison to chemical thrusters is the high ef-ficiency in using propellant. Another point is thelower disturbance of the spacecraft’s instrumentsdue to lower thrust noise and mechanical vibrations.Their main field of application is attitude and orbitcontrol (such as north-south station keeping) andas main engine on interplanetary spacecraft.
Upcoming ideas and plans for constellation mis-sions increased the need for precision positioningand so the necessity for low noise as well as lowthrust propulsion. However there exist until todayno long-life low thrust device with high efficiency. Sothere is the idea to investigate the HEMP thrusters[1] for their scalability to the low thrust area.
HEMP Thruster
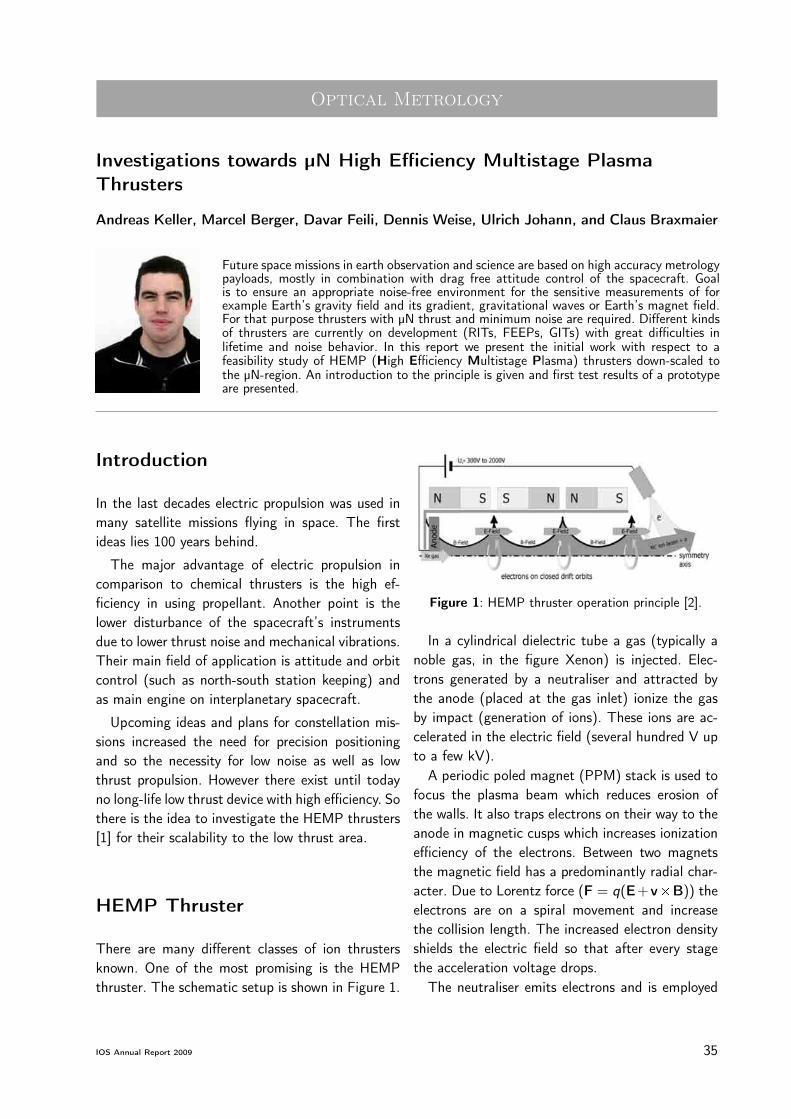
There are many different classes of ion thrustersknown. One of the most promising is the HEMPthruster. The schematic setup is shown in Figure 1.
Figure 1: HEMP thruster operation principle [2].
In a cylindrical dielectric tube a gas (typically anoble gas, in the figure Xenon) is injected. Elec-trons generated by a neutraliser and attracted bythe anode (placed at the gas inlet) ionize the gasby impact (generation of ions). These ions are ac-celerated in the electric field (several hundred V upto a few kV).
A periodic poled magnet (PPM) stack is used tofocus the plasma beam which reduces erosion ofthe walls. It also traps electrons on their way to theanode in magnetic cusps which increases ionizationefficiency of the electrons. Between two magnetsthe magnetic field has a predominantly radial char-acter. Due to Lorentz force (F = q(E+v�B)) theelectrons are on a spiral movement and increasethe collision length. The increased electron densityshields the electric field so that after every stagethe acceleration voltage drops.
The neutraliser emits electrons and is employed
IOS Annual Report 2009 35
for discharge ignition and beam neutralisation (toprevent charging of spacecraft). The advantagesover other thrusters like GIT’s (Grid Ion Thruster)and FEEP’s (Field Emission Electric Propulsion)are:
• simple design
• high reliability
• high efficiency (conversion of 80 % of electricpower in kinetic ion beam power [3])
• low sputter erosion of the tube walls or grids
Therefore this class is an interesting design for fur-ther investigations, as the above features are ex-tremely relevant for space applications.
The Project
We designed and manufactured a breadboard modelto study the properties of these thrusters in the lowthrust area. A CAD drawing cross section is shownin figure 2. The main focus is laid on flexibility sothat different geometries can be easily tested. Thestatic magnetic field created by permanent magnetsis simulated to optimise cusp fields.
Figure 2: CAD drawing cross section of HEMP thruster.
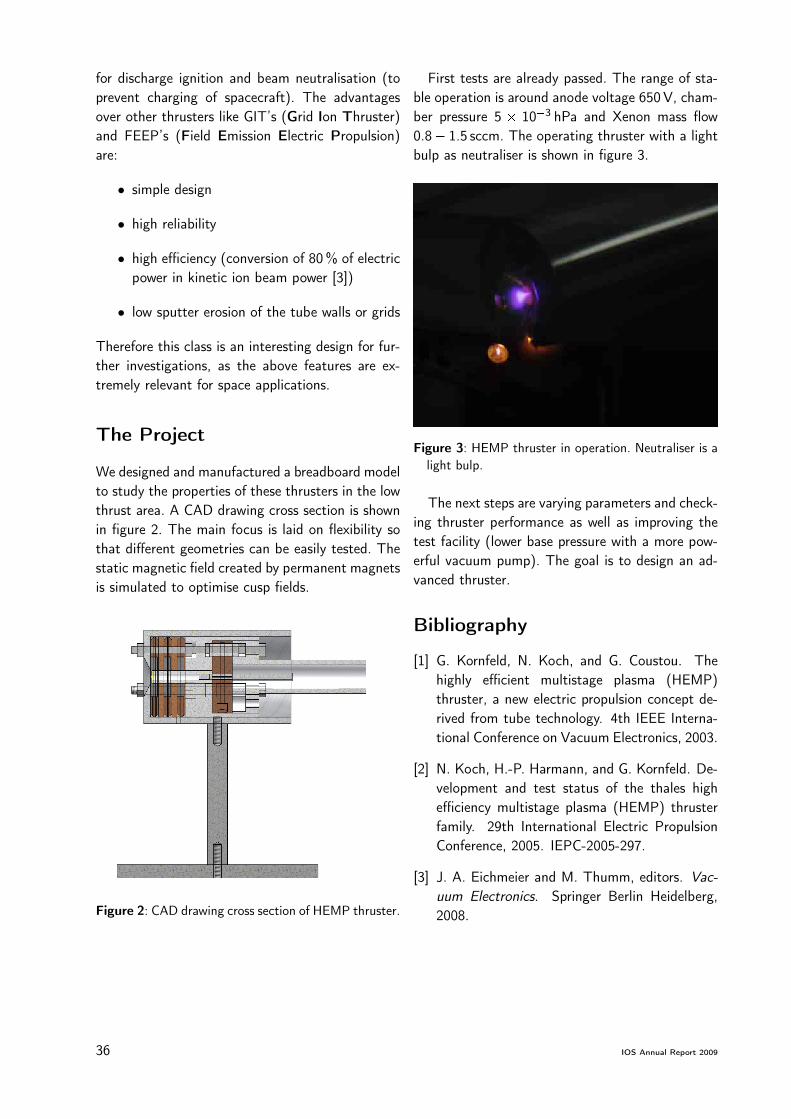
First tests are already passed. The range of sta-ble operation is around anode voltage 650 V, cham-ber pressure 5 � 10�3 hPa and Xenon mass flow0.8� 1.5 sccm. The operating thruster with a lightbulp as neutraliser is shown in figure 3.
Figure 3: HEMP thruster in operation. Neutraliser is alight bulp.
The next steps are varying parameters and check-ing thruster performance as well as improving thetest facility (lower base pressure with a more pow-erful vacuum pump). The goal is to design an ad-vanced thruster.
Bibliography
[1] G. Kornfeld, N. Koch, and G. Coustou. Thehighly efficient multistage plasma (HEMP)thruster, a new electric propulsion concept de-rived from tube technology. 4th IEEE Interna-tional Conference on Vacuum Electronics, 2003.
[2] N. Koch, H.-P. Harmann, and G. Kornfeld. De-velopment and test status of the thales highefficiency multistage plasma (HEMP) thrusterfamily. 29th International Electric PropulsionConference, 2005. IEPC-2005-297.
[3] J. A. Eichmeier and M. Thumm, editors. Vac-uum Electronics. Springer Berlin Heidelberg,2008.
36 IOS Annual Report 2009

Optical Metrology
High Precision Optical Metrology
Thilo Schuldt, Klaus Ergenzinger, Ulrich Johann, and Claus Braxmaier
The ESA project ‘High Precision Optical Metrology (HPOM-2)’ is a breadboard-level tech-nology demonstrator for future formation-flying missions where distances between twospacecraft with separations up to a few hundreds of meters have to be measured with highaccuracy. Examples of relevant space missions are the aperture-synthesis space-telescopeDarwin and the sun coronagraph mission PROBA-3. In these applications, the require-ments in distance metrology can only be met using optical methods, i. e. laser interferome-try. HPOM-2 represents a dual wavelength interferometer (DWI) with a distance resolutionbetter 10�m/
pHz and an operational measurement range of 0m to 250m. Astrium GmbH
– Satellites is in charge of the development of the DWI laser assembly based on the resultsof the HPOM-1 program. An optical setup using two phase-locked Nd:YAG NPRO-typelasers was set up, where the frequency generation part utilizes fiber-optic components suchas AOMs, polarizers and detectors. A static distance measurement over 25 h was carriedout using a fiber-optic optical head dummy, showing a 12�m rms noise level well withinthe specifications.
An artist view of the planned formation fly-ing mission PROBA-3 is shown in figure 1.Two spacecraft, flown in a distance of approx-imately 150m, form a coronagraph where onespacecraft carries the occulter casting a shadowover the second spacecraft carrying an opti-cal bench with associated electronics and de-tection hardware. The distance measurement
Figure 1: Artists view of the PROBA-3 mission. Twospacecraft in a distance of � 150m form a corona-graph where one spacecraft carries the occulter andthe other the optical bench, electronics and detectors(figure: ESA).
between the spacecraft is carried out using a dual-wavelength interferometer with a required distanceresolution below 10�m/
pHz, an operational mea-
surement range of 0m to 250m, an unambiguouslongitudinal measurement range of �25mm anda longitudinal drift measurement capability up to250mm/s.
Experimental Setup
The DWI setup uses two phase-locked Nd:YAGlasers at a wavelength of 1064 nm. One of the laserscan optionally be frequency stabilized to a hyper-fine transition in molecular iodine using modulationtransfer spectroscopy at 532 nm (second harmonic).The frequency offset between the two lasers is set to3GHz which corresponds to a synthetic wavelengthof 10 cm. The light of both lasers is fiber-coupledand a fiber-optic setup utilizing 3 acousto-opticmodulators (AOMs, used as frequency shifters andoperated at frequencies of 75MHz, 76.9MHz and79MHz) yields to two independent (relative) inter-ferometric measurements. Two InGaAs photodetec-tors detect the heterodyne signals at 1.9MHz and4MHz, respectively, which are input to a dual het-erodyne phasemeter developed by SIOS Messtech-nik (Ilmenau). The phase measurement is based on
IOS Annual Report 2009 37

two internally synchronized digital PLLs. The ob-tained distance data is read out using a standard PCby RS232 interface. A photograph of the laser setupincluding phase-lock detector and of the fiber-opticsetup for frequency generation is shown in figure 2.
Figure 2: Photograph of the lasers (top) and the fiber-optic setup for frequency generation (bottom).
Measurement Results
A long-term measurement with a pigtailed freebeam combiner as dummy optical head is shownin figure 3. Fiber polarizers are used in front of the
dummy optical head, the optical power at eachdetector is approximately 800�W. Although themeasurements were carried out under harsh condi-tions (several K difference in room temperature), noclear thermal sensitivity can be observed. The RMSvalue in distance is 12�m over the full 25 h mea-surement time – and therefore compliant with the32�m specification. In our measurements, it wasseen that the implementation of (fiber-)polarizersat the output of the frequency generation part is es-sential for minimizing the temperature sensitivity.
Figure 3: Long term static distance measurement of theDWI. The upper curve shows the measured distance(with included 1� and 3� lines), the lower curve theroom temperature.
This project is carried out under ESA con-tract 20864/07/NL/SFe. The DWI laser assem-bly is developed by Astrium GmbH – Satellites(Friedrichshafen) with SIOS Messtechnik GmbH(Ilmenau) responsible for the phasemeter update.The laser assembly will be integrated with an op-tical head developed by Astrium SAS (France) andtested at TNO (Netherlands).
38 IOS Annual Report 2009

Wavefront Filter
Measurements on Single Mode Waveguides in a Mid-Infrared TestInterferometer
Reinhold Flatscher, Stefan Ziegler, Dennis Weise, Ulrich Johann, and Claus Braxmaier
One of the key elements of the Darwin instrument is a single mode wavefront filter usedto cancel star light and to detect the weak light from Earth-like planets. We manufacturedshort single mode fibres acting as perfect wavefront filters. Extruded silver halide fibrescan be used over the full wavelength band of Darwin. In the lower subband optional fibresdrawn from special glass (GAST) can be employed as well. The performance of the produceddevices was characterised in a representative mid infrared interferometer. The fibres wereexposed to gamma radiation without degradation and survived a cryogenic test at 10 K.Silver halide fibres with multilayer AR-coating and special cladding mode absorption layerswere manufactured with high yield. They offer low insertion loss together with single modelight transportation.
Introduction
The objective of the Darwin Mission is to searchfor signs of extra-terrestrial life on foreign planets.Darwin is a space program of the European SpaceAgency - ESA. NASA plans a similar mission calledTPF (Terrestrial Planet Finder). The final mission,most likely a collaboration of ESA and NASA, shalldetect and in a second step chemically analyse theatmosphere of Earth-like targets. One of the mainmission goals is to identify bio markers like watervapour, ozone, and carbon dioxide as shown in Fig-ure 1 sketching the typical emission spectrum of ourEarth.
Figure 1: Spectral signature of our Earth. Courtesy ofESA.
Looking on a star/planet system the star light mustbe reasonably suppressed to make visible the weakradiation from a "warm" planet orbiting around thestar within the habitable zone. High quality nullinginterferometers are used to suppress the star lightby destructive interference.
Setup
The Darwin Mission relies on a nulling interferom-eter coupling together 4 free-flying telescopes. Op-erating in the mid infrared the nulling requirementscan be relaxed to 106. Using wavefront filters allowsto employ optical elements of standard precision.
The performance of the realised wavefront ormode filters is measured by using a compact andfully representative Mach-Zehnder interferometeras shown in Figure 2. A short piece of single modefibre is the optimum wide band wave front filter asit suppresses low and high order wave front errorsin contrast to pinholes that reduce high frequencyerrors alone.
The light is coupled into the thin core of a singlemode fibre. The core is surrounded by cladding withlower refraction index and this step-index structureensures the guided propagation of light throughthe core. Light of longer wavelengths extends muchinto the cladding and higher-order cladding modes
IOS Annual Report 2009 39

may be generated due to limited cladding extentand/or short fibre length. Cladding modes are sup-pressed by additional damping layers attached onthe cladding. Different fibre materials are used inthe interesting wavelength range. Special glassesmade of germanium, arsenic, selenium, and tel-lurium (GAST) are preferred in the lower band be-tween 6.5µm and 11µm as they can be drawn likesilica fibres. In the upper band between 10 and 20micron extruded polycrystalline silver halides are thebest choice. Silver halide is also a promising candi-date for the lower Darwin band.
Figure 2: Highly symmetric Mach Zehnder interferome-ter used for testing the mode suppression capability ofthe realised waveguides. Mx redirection mirror, ATTattenuator of reflective type, PTS piezo translationstage (OPD), Lx lens, TTP tip/tilt piezo stage, DETdetector, BSx wedged beam splitter
Performance and EnvironmentalTests
The following fibre performance parameter can beroutinely verified:
• mode distribution by matrix camera at twodifferent wavelengths
• attenuation of the fibre at the two differentwavelengths
• suppression of star light at both wavelengthsby using the interferometer
• prove of single mode capability
The following environmental tests were performed:
• cryogenic temperature test at 40 K (typicallyless than 10 K)
• vacuum test to verify the reliability of theused materials and coatings
• -radiation test with total dose of 50 krad
(done at ESA’s cobalt 60 facility)
• high-energy proton radiation test (done atPSI)
Results
Figure 3 illustrates typical results seen by the matrixcamera indicating a clear multimode (left), a start-ing single-mode situation (mid), and the desiredclean single mode (right). The fundamental modeof a single mode fibres manifests as a Gaussian-likeintensity distribution of the emitted beam. Non-perfect mode cleaning of very short fibres can bestill improved by an oversized pinhole at the fibre’soutput.
(a) multi modebehaviourbelow cut-offwavelength
(b) "good" singlemodebehaviourabove cut-offwavelength
(c) "excellent"single modebehaviourwith oversizedoutputpinhole
Figure 3: Typical mode distributions recorded at fibreoutput.
Fresnel losses at both fibre facets of 12.5% in Ag-BrCl and 17% in GAST glass are further reduced toa few percent by applying multilayer AR-coatings.
Figure 4 shows a photograph of a typical fibrecable batch. All fibres are AR-coated, they do havecladding mode absorption layers, the fibre ends arepolished and are fixed in ceramic or metal ferrulesas part of SMA connectors. The thin fibres are pro-tected by plastic tubes to avoid bending or breakingduring handling.
40 IOS Annual Report 2009

Figure 4: Fully assembled polycrystalline fibre samplesand details of fibre end.
A dip stick has been manufactured to performthe cryogenic temperature test. The stick with thefibre sample in its inner part is plunged in a storagevessel filled with liquid helium. Controlled floodingof the vacuum inside the stick with helium adjuststhe sample temperature. Figure 5 shows the fullydipped stick in thermal equilibrium.
Figure 5: Dip stick with fibre sample on 10 K level dur-ing live test.
Conclusion
In the 3 years activity we could improve the perfor-mance and quality of the manufactured fibres andthe production yield. Circular cores and good opti-cal contact between core and cladding are routinelyachieved now.
The fibre made of soft silver halide achieved goodresults. Silver halide fibres are extruded by press-ing the heated soft material through a die underhigh pressure. High facet quality and optimised ma-terial parameters finally yielded single mode be-haviour together with low damping. The material iswell suited for the entire Darwin wavelength band.The core/cladding dimension is 50=500 micron. Wemeasured mode suppressions of 15,000 and intrinsicfibre transmissions in the order of 0.7 to 4 dB=m.The typical length of a single mode waveguide is25 cm. 17 sample cables passed the performancetests and are compliant to the requirements.
GAST fibres are more difficult in manufacturingas the glass is brittle and non-laminar flow duringthe drawing prevents core forming. Excessive purifi-cation is required to obtain flat spectral transmis-sion here.
Outlook
Silver halide fibres are the best choice for Darwin’swavefront filters. Many fibres passed the stringentDarwin instrument requirements. The soft materialis cryogenically compatible and did not show degra-dations during the gamma radiation test. MultilayerAR-coatings have been developed and successfullytested. A proper cladding mode absorbing layer isavailable as well. A CCN is planned to implementsilver halide as a material for the shorter wave-lengths used in Darwin.
IOS Annual Report 2009 41

42 IOS Annual Report 2009

Optical Metrology
Development of a Tilt Actuated Mirror
Thilo Schuldt, Martin Gohlke, Wolfgang Kronast, Bernhard Müller, Antwi Nimo,Ulrich Mescheder, Ulrich Johann, Dennis Weise, and Claus Braxmaier
An electrostatically actuated micromirror with a 3� 3mm2 surface area and a thickness of100�m has been designed and realized where the tilt movement of the mirror is provided bya torsional load of the mirror suspension. For layout optimization, 3D FEM simulations werecarried out; measurements showed a torsion angle of �1.9mrad at a driving voltage of U =200V. A new design and fabrication concept for the micromechanical device was developed,taking care of high mechanical stability, very low-noise performance and minimized pistoneffect (i. e. the requirement that under rotation of the mirror no significant z-movementof the reflection surface occurs). This design of a tilt-actuated micromirror has potentialapplication for the space mission LISA where actuators with pm and nrad stability arerequired as part of the optical bench. This project is carried out in a cooperation withHTWG Konstanz and the University Furtwangen.
The planned space mission LISA (Laser Interfer-ometer Space Antenna) will measure gravitationalwaves in the frequency band 30�Hz to 1Hz. Itutilizes high-precision laser interferometry betweenspacecraft with a distance of about 5 million kilome-ters where a sensitivity of � 10 pm/
pHz in transla-
tion measurement and � 20 nrad/p
Hz in tilt mea-surement is needed. Two actuated mirrors are partof the optical path of the scientific interferomet-ric measurement, and therefore have to fulfill verystringent requirements with respect to translationand tilt. In case that the rotation point of the ac-tuated mirror does not coincide with the point ofincidence of the laser beam on its surface, a rota-tion of the mirror results in a parasitic translationmovement (so-called piston effect, cf. figure 1). Ourmirror design takes into account the LISA require-ments, but generally represents a high-precision ac-tuator for ground- and space based interferometryand even for commercial applications such as laserprojection.
Design and Simulation of theMirror
The basic concept of our mirror is shown in fig-ure 2. It is a hybrid device consisting of a silicon chipmanufactured from SOI (silicon on insulator) wafer
carrying the mirror and two fixed reference mirrorsand a pyrex glass chip with the counter electrodes inan etched cavity building the air gap between elec-trode mirror plate and counter electrode. Both chipsare adhesively bonded together. The mirror is sus-pended by two silicon beams, which are fixed at thesilicon substrate and deformed torsionally to pro-vide rotation of the mirror (these devices are calledtherefore torsional micro mirror). The mirror plateis electrically contacted with aluminum contacts onthe silicon substrate.
Figure 1: Schematic of the piston effect, here dz .
The active upper area of the mirror covers 3 �3mm2 surrounded by a stiffening frame of 100�mthickness and 100�m width, to give an additional
IOS Annual Report 2009 43

stabilization to the plate. The thickness of the mir-ror plate (100�m) and the additional stiffeningframe around the mirror surface ensure a stiffnesswhich guarantees the optical specifications and aflatness better than �/10 rms.
An unintended z-displacement of the mirror sur-face under rotation and therefore the resultingchange of optical path length are caused by twodifferent effects: (i) movement of the whole mirrorplate in the direction of the counter electrode underload caused by the electrostatic force due to finitestiffness of the beam based hinges; and (ii) move-ment of the mirror surface under rotation (piston-effect) in dependence of the position of the rotationaxis.
Figure 2: Schematic of the micromirror design. Imple-mented on the wafer are the tilt actuated mirror andtwo reference mirrors.
The first effect can be minimized by optimalchoice of the geometrical parameters of the suspen-sion beams, for example width, length and height ofthe beams. The torsional beams are chosen as smallas possible in width to combine little z-displacementof the micromirror by the electric field from thecounter electrode together with the possibility ofeasy rotation of the mirror at moderate voltages atthe counter electrode. The second effect is mini-mized by a specific design where the rotational axisof the micromirror exactly coincides with the mir-
ror surface. This is achieved by using a symmetricSOI-wafer with handle and device wafer having ex-actly the same thickness. The reflecting plane ofthe mirror is formed by the handle wafer’s surface.The suspending beams are realized from both, thehandle and the device wafer of SOI-wafer. Thus thetorsion axis of the beams coincides almost perfectlywith the reflecting plane, the only difference is re-sulting from the small SiO2-layer between handleand device layer which is in our case 2�m thick.
Functional Test
A first functional test of a prototype micromirrorwas carried out utilizing a Michelson type interfer-ometer. The fringe patterns of the interferomet-ric measurements are shown in figure 3 for differ-ent driving voltages. The measured rotations of themirror are in good agreement with the theoreticalvalues obtained by an FEM simulation using COM-SOL software.
Figure 3: Photographs of the micromirror with applieddriving voltages of 0 V, 100V, 150V and 200V.
Outlook
In a next step, the prototype mirrors will be charac-terized using the high-performance interferometerwhich offers pm and nrad sensitivity. The rotationalmovement of the mirror will be measured as well asa possible z-movement. Static long-term measure-ments will be carried out for noise characterization.
This project is part of the work within thecompetence center (ZAFH) Photonn financed bythe state Baden-Württemberg, the LandesstiftungBaden-Württemberg and the European Union un-der EFRE.
44 IOS Annual Report 2009
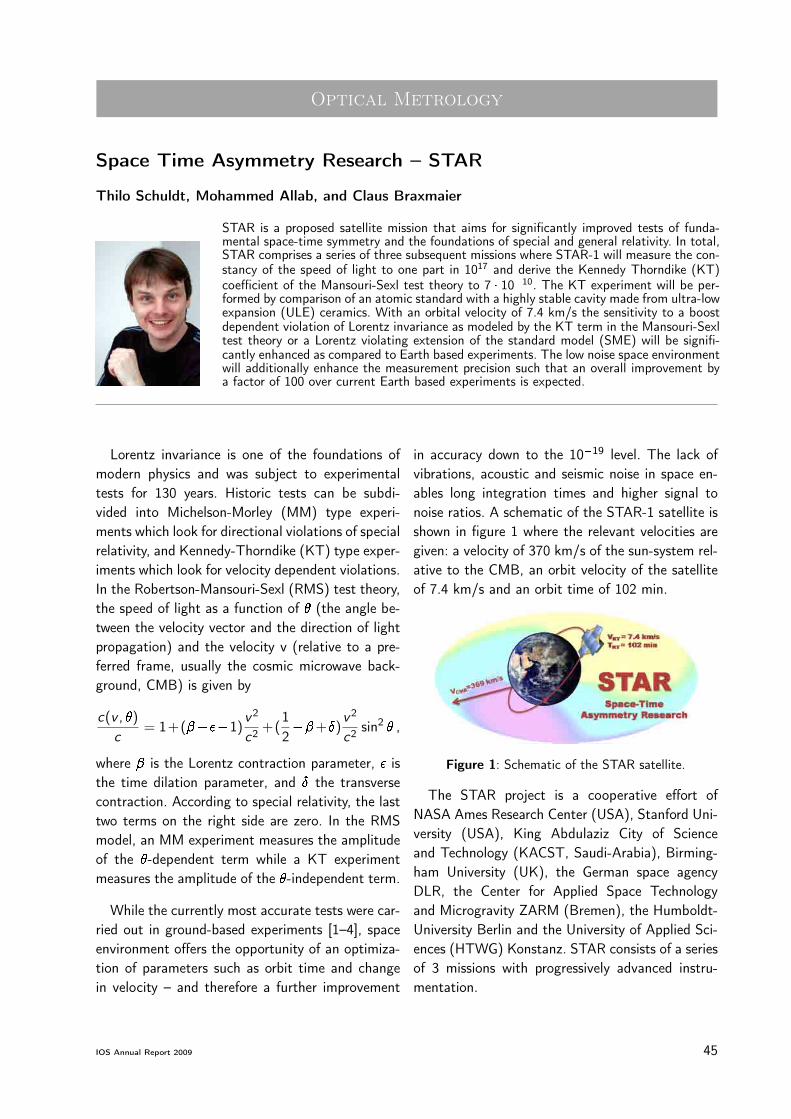
Optical Metrology
Space Time Asymmetry Research – STAR
Thilo Schuldt, Mohammed Allab, and Claus Braxmaier
STAR is a proposed satellite mission that aims for significantly improved tests of funda-mental space-time symmetry and the foundations of special and general relativity. In total,STAR comprises a series of three subsequent missions where STAR-1 will measure the con-stancy of the speed of light to one part in 1017 and derive the Kennedy Thorndike (KT)coefficient of the Mansouri-Sexl test theory to 7 � 10�10. The KT experiment will be per-formed by comparison of an atomic standard with a highly stable cavity made from ultra-lowexpansion (ULE) ceramics. With an orbital velocity of 7.4 km/s the sensitivity to a boostdependent violation of Lorentz invariance as modeled by the KT term in the Mansouri-Sexltest theory or a Lorentz violating extension of the standard model (SME) will be signifi-cantly enhanced as compared to Earth based experiments. The low noise space environmentwill additionally enhance the measurement precision such that an overall improvement bya factor of 100 over current Earth based experiments is expected.
Lorentz invariance is one of the foundations ofmodern physics and was subject to experimentaltests for 130 years. Historic tests can be subdi-vided into Michelson-Morley (MM) type experi-ments which look for directional violations of specialrelativity, and Kennedy-Thorndike (KT) type exper-iments which look for velocity dependent violations.In the Robertson-Mansouri-Sexl (RMS) test theory,the speed of light as a function of � (the angle be-tween the velocity vector and the direction of lightpropagation) and the velocity v (relative to a pre-ferred frame, usually the cosmic microwave back-ground, CMB) is given by
c(v , �)
c= 1+(����1)
v2
c2+(
1
2��+�)
v2
c2sin2 � ,
where � is the Lorentz contraction parameter, � isthe time dilation parameter, and � the transversecontraction. According to special relativity, the lasttwo terms on the right side are zero. In the RMSmodel, an MM experiment measures the amplitudeof the �-dependent term while a KT experimentmeasures the amplitude of the �-independent term.
While the currently most accurate tests were car-ried out in ground-based experiments [1–4], spaceenvironment offers the opportunity of an optimiza-tion of parameters such as orbit time and changein velocity – and therefore a further improvement
in accuracy down to the 10�19 level. The lack ofvibrations, acoustic and seismic noise in space en-ables long integration times and higher signal tonoise ratios. A schematic of the STAR-1 satellite isshown in figure 1 where the relevant velocities aregiven: a velocity of 370 km/s of the sun-system rel-ative to the CMB, an orbit velocity of the satelliteof 7.4 km/s and an orbit time of 102 min.
Figure 1: Schematic of the STAR satellite.
The STAR project is a cooperative effort ofNASA Ames Research Center (USA), Stanford Uni-versity (USA), King Abdulaziz City of Scienceand Technology (KACST, Saudi-Arabia), Birming-ham University (UK), the German space agencyDLR, the Center for Applied Space Technologyand Microgravity ZARM (Bremen), the Humboldt-University Berlin and the University of Applied Sci-ences (HTWG) Konstanz. STAR consists of a seriesof 3 missions with progressively advanced instru-mentation.
IOS Annual Report 2009 45

The STAR-1 mission is meant to be realized ‘assoon as possible’, ‘as simple as possible’ – andtherefore ‘as cheap as possible’. It will utilize state-of-the-art technology with proven performance atleast in laboratory experiments. The STAR-1 pay-load will include a cavity stabilized laser (lengthstandard), an atomic standard, an optical beat mea-surement unit, and a laser system. All subsystemswill be realized twice for redundancy. A comparisonof a length standard to an atomic standard will yieldto a Kennedy-Thorndike experiment while a com-parison of two length standards (orientated perpen-dicularly to each other) will yield to a Michelson-Morley experiment.
Figure 2: Laboratory setup of an Iodine standard.
The HTWG Konstanz and the Humboldt-University Berlin will realize an iodine standardbased on modulation transfer spectroscopy (MTS)using strong absorptions of molecular iodine near532 nm. The laser source is a Nd:YAG laser (non-planar ring oscillator design) at 1064 nm which isfrequency doubled using a periodically poled KTPcrystal. For achieving high mechanical stability ofthe optical setup, the baseplate is assumed to bemade from Zerodur, a glass ceramics with a verylow coefficient of thermal expansion of 2�10�8 K�1.The optical components will be fixed to the base-plate using adhesive bonding. The high mechan-ical stability ensures, that the optical alignmentwill survive vibrations during launch and also mini-mizes pointing variations of pump and probe beamrelative to each other which otherwise limit theachieved frequency stability in the long term re-gion. A photograph of a laboratory setup realizedat the Humboldt-University Berlin is shown in figure2. A frequency stability below 1 � 10�14 at integra-tion times of 100 s was demonstrated The assembly-
integration technology of adhesive bonding is inves-tigated in a current activity at HTWG Konstanz andEADS Astrium (Friedrichshafen), cf. the article byThorsten Meisner.
The cavity laser stabilization, which is developedby Stanford University, will be based on a mono-lithic crossed cavity with 2 cavities perpendicular toeach other, as shown in figure 3. The cavity spacerwill be made of a material with very low coefficientof thermal expansion such as ULE or fused silica.For frequency stabilization, the method of Pound-Drever-Hall will be utilized.
Figure 3: Left: photograph of a crossed cavity made offused silica; Right: CAD schematic of an optical setupfor laser frequency stabilization to an optical cavity.
Bibliography
[1] C. Braxmaier, H. Muller, O. Pradl, J. Mlynek,and A. Peters. Test of relativity using acryogenic optical resonator. Phys. Rev. Lett.,88:010401, 2002.
[2] S. Herrmann, A. Senger, K. Mohle, M. Nagel,E. V. Kovalchuk, and A. Peters. Rotating opti-cal cavity experiment testing Lorentz invarianceat the 10�17 level. Phys. Rev. D, 80:105011,2009.
[3] C. Eisele, A. Y. Nevsky, and S. Schiller. Labora-tory test of the isotropy of light propagation atthe 10�17 level. Phys. Rev. Lett., 103:090401,2009.
[4] M. E. Tobar, P. Wolf, S. Bize, G. Santarelli,and V. Flambaum. Testing Local Lorentz andPosition Invariance and Variation of Fundamen-tal Constants by searching the Derivative ofthe Comparison Frequency Between a Cryo-genic Sapphire Oscillator and Hydrogen Maser.Phys. Rev. D, 81:022003, 2010.
46 IOS Annual Report 2009

Optical Metrology
High Resolution Optical Profilometry
Ruven Spannagel, Marcell Liebhart, Walter Baumgartner, Thilo Schuldt, and Claus Braxmaier
In this report we present the current status of our high-precision profilometer. As a basis forthe measurement setup a heterodyne interferometer is used and enables a non-tactile andhigh-precision surface property measurement. To detect the surface topology, the scanningof a surface is necessary. Therefore, we actuate the measurement beam. With our newdesign of the beam actuation system, we are able to achieve translation measurementswith 900 pm/
pHz-sensitivity below 200mHz.
As the actuation of the laser beam should haveno or minimum influence on the result, it is nec-essary that the length of the optical beam paththrough the full range theoretically remains con-stant (∆Z=0). For this purpose, we actuate a dove-prism for each translation axis by using a high preci-sion nano xy-piezo stage. The schematic of the sy-metric interferometer and the two dove-prisms areshown in figure 1.
Figure 1: Schematic of the heterodyne interferometersetup and the two dove-prisms for beam actuation
The measurement facility which actuates thebeam is shown in figure 2. The lightweight alu-minum construction has a favorable vibration be-
havior to minimize the vibrations. The material forthe mechanical components have a similar coeffi-cient of thermal expansion as the optical compo-nents to reduce additional stresses due to tempera-ture fluctuations. The piezo and the two prisms aremounted with clamps which are adjustable in threedegrees of freedom. Therefore we are able to alignthe beam very precise.
Figure 2: Construction of the beam actuation system
The measured surface of a high-reflective mir-ror with a flatness of �/10 is shown in figure 3.We scanned a square of 400�m with 10 000 singlemeasurements.
IOS Annual Report 2009 47

Figure 3: 3D profile of a 400�m x 400�m surface
Figure 4: Power spectral density of a 40h noise mea-surement
The power spectral density (PSD) shows the sen-sitivity of our profilometer (cf. figure 4). The blueline corresponds to old DUT (device under test) ac-tuating system and the red one to the new designedbeam actuating system. With the beam actuationwe could achieve a noise level of 900 pm=
pHz for
frequencies above 100mHz. The lines also shows,that we could increase the sensitivity of our pro-filometer at a frequency of 0.2Hz from 2 nm up to900 pm.
Bibliography
[1] Walter Baumgartner and Marcel Liebhart.Konzeption, Design und Realisierung einerMessstrahlaktuation für die höchstauflösendeoptische Profilometrie. Master Projekt HTWGKonstanz, 2009.
[2] Ruven Spannagel. Integration und Test der Ak-torik für ein Laserinterferometer zur hochau-flösenden optischen Profilometrie. BachelorThesis HTWG Konstanz, 2009.
[3] T. Schuldt, M. Gohlke, R. Spannagel, S. Res-sel, D. Weise, U. Johann, and C. Brax-maier. Sub-Nanometer Heterodyne Interferom-etry and Its Application in Dilatometry and In-dustrial Metrology. International Journal of Op-tomechatronics, 3(3):187–200, 2009.
48 IOS Annual Report 2009

Optical Metrology
3D-Digitization Using Fringe Projection and HDR Methods
Stefan Jacob and Claus Braxmaier
Scanning of shiny or reflective metal surfaces using structured light methods is particularchallenging. As a shiny object in general can not be lit from single exposures with fixedshutter speed, a procedure which combines different series of exposures with differentexposure times to series with high dynamics is obviously a solution with the restriction ofa non moving scene. Exposing an object with different duration periods (exposure times)data can be obtained from very shiny or bright areas of an object by choosing very shortexposure times for highly reflective parts of the object which minimizes irradiation effectson that parts. The non - bright area of the object is illuminated, however, no longer optimalin general. The combination of multiple exposure times so that all possible areas of theobject to be scanned at least have in minimum one optimal lighting in one of the acquisitionseries images should therefore result in an improvement in the data situation. Since currentCCD cameras also tend to show a strong noise in the captured images the combination ofseveral images should also counteract this.
Assuming a linear camera response curve a HDR(high dynamic range) image is calculated for eachstrip from the available image frames in each case inform of a 32bit floating point image. The individualpixels are normalized on the shutter time and thegains that were used for each recording, and thena weighted average is calculated. The weighting isrealized via a "sawtooth function" which, startingfrom zero, in the interval between a lower and up-per threshold value increases linearly and then fallsback to zero.
gHDR =
PNi=0
w(gi ,x ,y )� shuttermax � gainmax
shutteri � gainiPNi=0 w(gi ,x ,y )
,
8 x = [1..imagewidth]y = [1..imageheight]
The parameterization of the lower and upperthreshold thus permits a direct influence on theconfidence level of the camera response curve,that means the range between upper and lowerthreshold defines the area of the camera re-sponse curve, which can be assumed to belinear and therefore used for data retrieval.
Figure 1: Weighting function used for HDR calculation.
For the calculation of gray code images a similarprocedure is used, but here the whole data rangeprovided by the input images is used, that meansfor the "darkest" record (longest shutter time), thelower threshold is automatically set to 0, and forthe "brightest" record (shortest shutter time) val-ues above the upper threshold value are weightedwith 1. This means that in the resulting graycodefewer "holes" are created, which would occur if onewould weight pixels outside the region (lower/upperthreshold) with zero as done in the calculation ofthe stripe images.
The process resulting from the combination ofseveral shots with a data range of 8bit per pixel,leads to resulting data with larger areas. To cre-ate the conditions for the mapping of high dynamic
IOS Annual Report 2009 49
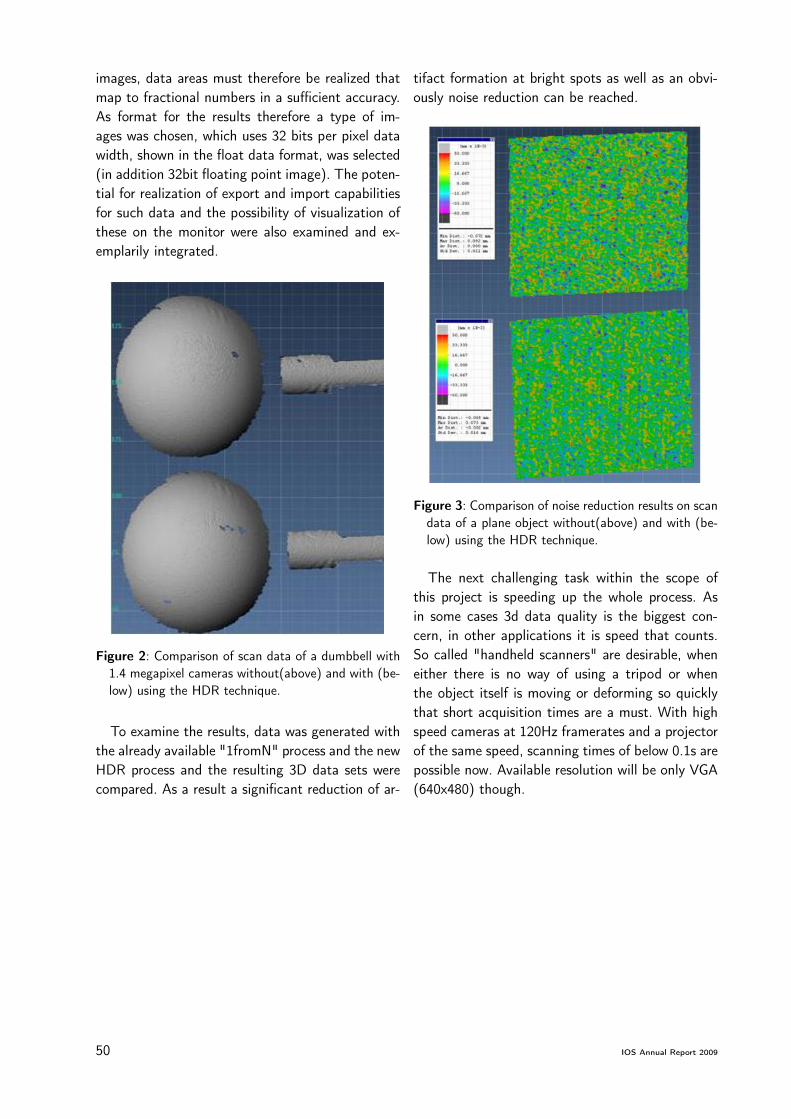
images, data areas must therefore be realized thatmap to fractional numbers in a sufficient accuracy.As format for the results therefore a type of im-ages was chosen, which uses 32 bits per pixel datawidth, shown in the float data format, was selected(in addition 32bit floating point image). The poten-tial for realization of export and import capabilitiesfor such data and the possibility of visualization ofthese on the monitor were also examined and ex-emplarily integrated.
Figure 2: Comparison of scan data of a dumbbell with1.4 megapixel cameras without(above) and with (be-low) using the HDR technique.
To examine the results, data was generated withthe already available "1fromN" process and the newHDR process and the resulting 3D data sets werecompared. As a result a significant reduction of ar-
tifact formation at bright spots as well as an obvi-ously noise reduction can be reached.
Figure 3: Comparison of noise reduction results on scandata of a plane object without(above) and with (be-low) using the HDR technique.
The next challenging task within the scope ofthis project is speeding up the whole process. Asin some cases 3d data quality is the biggest con-cern, in other applications it is speed that counts.So called "handheld scanners" are desirable, wheneither there is no way of using a tripod or whenthe object itself is moving or deforming so quicklythat short acquisition times are a must. With highspeed cameras at 120Hz framerates and a projectorof the same speed, scanning times of below 0.1s arepossible now. Available resolution will be only VGA(640x480) though.
50 IOS Annual Report 2009

Optical Metrology
Preparation of the ‘Fertigungs-Messtechnik 2’ Laboratory
Mohammed Allab, Karl-Heinz Waller, Tobias Pitzner, Sebastian Voigt, and Claus Braxmaier
During the next winter term 2010/2011 a new laboratory is going to take place withinthe framework of the course "Production Measurement Technology 2". The main objectiveof this laboratory is that the students learn the principles of modern optical measurementtechniques using a commercial fringe projection system by Breuckmann GmbH. The stu-dents learn the basics of optical measurement systems and their prospects in hands-onexperiments. For that purpose a comparison between optical and tactile measurement sys-tems will be performed where students have to digitize a defined test specimen using theSmartScan 3D system by Breuckmann GmbH. After that they are going to measure theobtained scatter plot with the controlling software "Qualify" of Geomagic Company. Thetest specimen will be remeasured by the students using the 3D coordinate-measurementmachine (CMM) by Mitutoyo. The students are going to compare the measurement resultsand to analyze the deviations at home.
The laboratory uses a commercial 3D digitizationsystem by Breuckmann GmbH (Meersburg). Thissystem consists of a measurement head consistingof a projector and two cameras, an electronics unitand a host computer. A series of equidistant stripes(using Graycode and phaseshift light projection) isprojected on the test specimen and stereoscopicallyrecorded by the two cameras. A photograph of thesetup is shown in figure 1.
Figure 1: Photograph of the Breuckmann stripe projec-tion system with calibration plate.
The laboratory practice is executed as follows:
1. 3D digitization of a test specimen using in-dex mparker method. Therefore so-called in-dex marks are fixed to the test piece which
are used to recombine the obtained 3D scat-ter cloud data appropriately.
a. Installation of the test specimen and thedigitizing system.
b. Performance of a scanning process usingthe scanning software Optocat 2007.
c. Knowledge of the theoretical and tech-nical basics.
2. Evaluation process using the Software ‘Qual-ify’ by Geomagic
a. Getting familiar with the software.
b. Alignment and dimensioning of the ob-tained scatter cloud data.
c. Preparation of a test report.
3. Tactile measurement of the test specimen us-ing the CMM by Mitutoyo.
a. Handling of the CMM.
b. Data evaluation.
4. Analysis of data and report
a. Comparison of the obtained data sets(optical scan and CMM measurement).
b. Preparation of a laboratory report.
IOS Annual Report 2009 51

c. Evaluation of the reasons for a possibledeviation and the principles of measure-ment.
For this laboratory, first two test specimens weredefined and procured. These specimens can bescanned using the optical 3D digitization system aswell as the tactile CMM. The inspection softwarewas acquired and implemented. For instructing thestudents carrying out this laboratory in their stud-ies, a new method was realized. In addition to thecommon laboratory notes, where the students cane.g. find the handling regulations of the applica-tions, also some introductory videos can be foundwhich explain the requested information in a visualand acoustic way to the students. Therefore, weexpect a better preparation of the students in thepreliminary stage of the practice part.
Figure 2: Test specimen with index marks.
The optical digitization system is now in workingcondition, the instruction videos are realized andthe colleagues are familiarized with the SmartScan3D system. Before the laboratory starts, followingissues have to be done:
1. Preparation of the test specimen:
• Varnish the test specimen (in order toavoid reflections during the scanningprocess)
• Create reference data sets using theCMM and SmartScan
2. Field experiment carried out by students
Figure 3: Test specimen and scatter cloud data.
52 IOS Annual Report 2009
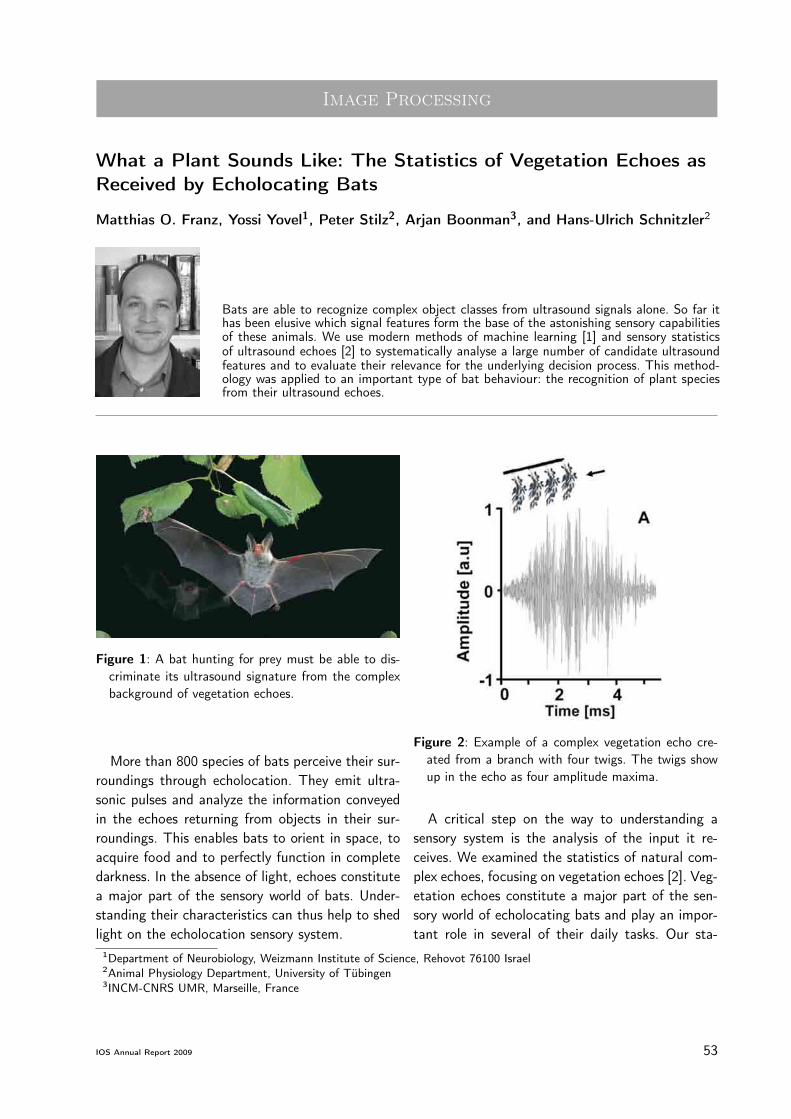
Image Processing
What a Plant Sounds Like: The Statistics of Vegetation Echoes asReceived by Echolocating Bats
Matthias O. Franz, Yossi Yovel1, Peter Stilz2, Arjan Boonman3, and Hans-Ulrich Schnitzler2
Bats are able to recognize complex object classes from ultrasound signals alone. So far ithas been elusive which signal features form the base of the astonishing sensory capabilitiesof these animals. We use modern methods of machine learning [1] and sensory statisticsof ultrasound echoes [2] to systematically analyse a large number of candidate ultrasoundfeatures and to evaluate their relevance for the underlying decision process. This method-ology was applied to an important type of bat behaviour: the recognition of plant speciesfrom their ultrasound echoes.
Figure 1: A bat hunting for prey must be able to dis-criminate its ultrasound signature from the complexbackground of vegetation echoes.
More than 800 species of bats perceive their sur-roundings through echolocation. They emit ultra-sonic pulses and analyze the information conveyedin the echoes returning from objects in their sur-roundings. This enables bats to orient in space, toacquire food and to perfectly function in completedarkness. In the absence of light, echoes constitutea major part of the sensory world of bats. Under-standing their characteristics can thus help to shedlight on the echolocation sensory system.
Figure 2: Example of a complex vegetation echo cre-ated from a branch with four twigs. The twigs showup in the echo as four amplitude maxima.
A critical step on the way to understanding asensory system is the analysis of the input it re-ceives. We examined the statistics of natural com-plex echoes, focusing on vegetation echoes [2]. Veg-etation echoes constitute a major part of the sen-sory world of echolocating bats and play an impor-tant role in several of their daily tasks. Our sta-
1Department of Neurobiology, Weizmann Institute of Science, Rehovot 76100 Israel2Animal Physiology Department, University of Tübingen3INCM-CNRS UMR, Marseille, France
IOS Annual Report 2009 53
tistical analysis was based on a large collection ofplant echoes acquired by a biomimetic sonar sys-tem. We explored the relation between the physicalworld (the structure of the plant) and the charac-teristics of its echo. Finally, we completed the storyby analyzing the effect of the sensory processingof both the echolocation and the auditory systemson the echoes and interpreted them in the light ofinformation maximization.
The echoes of all different plant species we ex-amined share a surprisingly robust pattern thatwas also reproduced by a simple Poisson modelof the spatial reflector arrangement. The fine dif-ferences observed between the echoes of differentplant species can be explained by the spatial charac-teristics of the plants. The bat’s emitted signal en-hances the most informative spatial frequency rangewhere the species-specific information is large. The
auditory system filtering affects the echoes in a sim-ilar way, thus enhancing the most informative spa-tial frequency range even more.
Bibliography
[1] Y. Yovel, M. O. Franz, P. Stilz, andH.-U. Schnitzler. Plant classifica-tion from bat-like echolocation signals.PLoS Comput. Biol., 4(3):e1000032.doi:10.1371/journal.pcbi.1000032, 2008.
[2] Y. Yovel, P. Stilz, M. O. Franz, A.Boonman,and H.-U. Schnitzler. What a plantsound like: the statistics of vegetationechoes as received by echolocating bats.PLoS Comput. Biol., 5(7):e1000429.doi:10.1371/journal.pcbi.1000429, 2009.
54 IOS Annual Report 2009

Image Processing
Steganalysis Using Stochastic Image Models
Le Pham Hai Dang, and Matthias O. Franz
The quantity and the variety of steganography methods complicate the detection of secretmessages in digital images. In order to handle all of these embedding methods, the de-tection of steganograms (images with embedded messages) should be independent of theembedding method. The main focus of our work is on creating a universal blind steganalyticalgorithm based on a previously developed predictive image model [1].
Two approaches form the semantic field of se-curity: cryptography and steganography. Althoughboth disciplines aim at information security, cryp-tography stands in the first place for the protec-tion of the contents of the message. One problemwith cryptography still holds: the presence of a se-cret message is obvious. In contrast, steganogra-phy is concerned with hiding the secret message.From this perspective, the process of steganogra-phy needs a cover (image, mp3, ...) wherein thesecret message is to be embedded (Fig. 2). In ourexample, both the cover and the secret message areimages (Fig. 1(a) & Fig. 1(b)).
(a) Cover (b) Message
Figure 1: The Monet Water Lilies (1906) [2] and satel-lite photo of the suspected uranium enrichment sitein Iran (Reuters)
The countertechnology to steganography iscalled steganalysis. This discipline is concernedwith the detection of steganography (Fig. 3). Ste-ganalysis without knowing the specific methodof steganographic manipulation is called uni-versal or blind Steganalysis. In our approachwe regard the detection problem of steganaly-sis as a binary classification problem. As classi-fier we use modern learning machines, the so-called Support Vector Machines (SVMs) [3].
Figure 2: Steganography: a secret message is embed-ded into a cover such that it cannot be noticed by anunsuspecting observer.
These machines need descriptive image fea-tures that capture the relevant characteristicsof the image and allow for an efficient dis-crimination between clean and stego images.
IOS Annual Report 2009 55

Figure 3: Steganalysis: detection of the presence of asecret message in the cover.
Image pixels, as substructure of images, arestrongly correlated with their neighbourhood pixelsand therefore can be largely predicted. In this study,neighbourhood relations are captured in an imagemodel that predicts the grayvalue of every pixelfrom its surrounding neighbours. The steganogra-phy embedding process destroys the strong corre-lation between image pixels. Thereby the value ofthe predicted image pixels changes so far that this
difference between clean and stego images can berecognized by measuring the statistical moments(mean, variance, etc.) of the pixel distribution.These moments form the relevant characteristics ofthe image that serve as input for the SVM classifier.
Acknowledgments. The author would like to thankAndrew P. Smith and Markus Meßmer.
Bibliography
[1] M.O. Franz and B. Schölkopf. Implicit wienerseries for higher-order image analysis. vol-ume 17, pages 465–472, Cambridge, MA, USA,2005. MIT Press.
[2] http://www.ibiblio.org/wm/paint/auth/monet/waterlilies/.
[3] Bernhard Schölkopf and Alexander J. Smola.Learning with Kernels. Support Vector Ma-chines, Regularization, Optimization, and Be-yond. The MIT Press, Cambridge, MA, USA,2002.
56 IOS Annual Report 2009

Image Processing
The Optical Radar - a Multidisciplinary Research Project
Jürgen Keppler and Matthias O. Franz
The goal of this project is to overcome the problem of inertia in optical telescopes byusing a rotating mirror optics instead of moving the entire telescope. The mirror rotatesat a constant rate. Whenever it reaches the desired rotation angle, the exposure of a newimage is triggered. By changing the timing of the trigger signal, arbitrary azimuthal viewingdirections can be chosen at a very high speed.
The first problem to be settled is that of motionblur (Fig. 1). We currently investigate various im-age restoration techniques with respect to their ca-pabilities for our purpose. Most of these techniquesprofit considerably from knowing the exact move-ment of the mirror. In our setup, rotation rate ismeasured by a set of Hall effect sensors. Whetherthese sensors are already sufficient for deblurringor whether additional image-based estimation tech-niques are necessary, is subject of a recently startedmaster thesis.
Figure 1: The rapidly rotating mirror optics leads tomotion blur in the recorded images.
Independent of the used deblurring technique,motion blur should be kept as small as possible.We therefore use a Peltier-cooled camera that al-lows for small exposure times while maintaining ahigh frame rate of 30 images per second.
The second problem we face is the design of theexperimental setup (Fig. 2) which has to be stableunder the dynamical stress created by the rapidlyrotating mirror. The mirror is mounted with brack-ets on slewing rings which are driven by an electricmotor. The optical axis of the camera system mustbe aligned exactly at the rotation axis. A mountwhich is adjustable in four degrees of freedom isnecessary for this. The mount consists of two or-thogonal linear stages and two goniometers. Thecalibration procedure for the mount is developedin another diploma thesis (see project descriptionS. Lang, ”Calibration of the Sensor axis”).
The third challenge lies in the mirror brackets.We aim at a rotation speed of 1800 rpm. The aris-ing rotation forces must be caught by the brackets,so that the mirror cannot fly away. The construc-tion of the brackets is subject of a student projectin mechanical engineering (see project descriptionA. Winter and M. Repp, ”A bracket for a rapidlyrotating mirror").
The fourth subproject, the control of the elec-tric drive and the evaluation of the sensors is donewith a standard PC. The control has to be real-time, because the exposure must be triggered atthe right moment. The electric drive already has anintegrated control which allows for an independentcontrol of the rotation rate.
IOS Annual Report 2009 57

Figure 2: Experimental setup.Figure 3: circuit design
Bibliography
[1] Azriel Rosenfeld and Avinash C. Kak. DigitalPicture Processing, volume 1. Academic Press,New York, 2 nd edition, 1982.
58 IOS Annual Report 2009

Image Processing
A Bracket for a Rapidly Rotating Mirror
Markus Repp, Alexander Winter, Jürgen Keppler, and Claus Braxmaier
The function of the Optical Radar is to monitor the surrounding area at a very highresolution and speed. Therefore a mirror is placed on the optical axis of a camera. Byrotating the mirror it is possible to observe all azimuthal directions. The challenge for thedevice and especially for the bracket construction is the high rotational speed of maximally1800 revolutions per minute. The rotational speed creates large forces and moments. Wetried to keep these forces small by using aluminum as the key material in the construction.
The result of rotational motion is a centrifugalforce. The centrifugal acceleration is defined as
a = !2 � R
With Newton’s second law
F = m � a
we obtain the formula for the centrifugal force as
Fc = !2 � R �m.
The relation between centrifugal force, radius androtation speed is graphically depicted in Fig. 1.
Figure 1: Centrifugal force depending on radius androtational speed
Because the system requires 1800 rpm, there areonly two possibilities to keep the centrifugal forcesmall. One possibility is the use of lightweight ma-terials, the other the skillful design of the brack-
ets. Both possibilities are based on the idea to saveweight.In case of the material we decided to use aluminumfor the brackets. There are several reasons for us-ing aluminum. In comparison to steel, it is muchmore lightweight and has almost the same mechan-ical strength. Furthermore it is easy to manufacturealuminum. Our first design of the brackets is shownin Fig. 2.
Figure 2: Left: Tensions from centrifugal force; right:Displacement
With the CAD software ProE we calculated thearising forces. Fig. 2 shows that our first construc-
IOS Annual Report 2009 59

tion had troubles at the bottom with some reallyhigh tensions. The centrifugal forces also createddisplacements of the brackets. We solved this prob-lem through connecting the two brackets with arod as shown in Fig. 3.
The next step in the construction was the addingof the mirror and the further enhancement of thebrackets. The mirror should be replaceable and theangle of the mirror adjustable. Therefore we placedthe mirror in a holder of aluminum.
Figure 3: Brackets with rod
The final design is shown in Fig. 4. Because the
mirror is attached with a tilt angle, some weight isoutside of the fulcrum. This causes additional cen-trifugal forces and torsion moments. The torsionmoments stress the connection between bracketand holder. To absorb this moment, we extendedthe diameter of the connection.
Figure 4: Final construction
60 IOS Annual Report 2009

Image Processing
Calibration of the Sensor Axis
Stefan Lang, Jürgen Keppler, and Matthias O. Franz
The Optical Radar (see project description by J. Keppler) consists of a rotating mirror andcamera optics. Both the rotation axis and the optical axis must be aligned in a calibrationprocess. In this project we develop an image-based method for determining the positionand orientation of the rotation axis. Also the principal point of the camera as part of theinner orientation is determined.
In the Optical Radar, objects seen at a given ele-vation angle should have a common radial distanceto the principal point in the camera image. Thissimplifies the subsequent processing of the cameraimages considerably. In order to achieve such a ge-ometry, a calibration procedure is needed to alignthe rotation axis with the optical axis of the cam-era. During operation, the opto-mechanical partsof the Optical Radar are liable to variations due totemperature changes and mechanical stress. As aconsequence, the calibration procedure has to berepeated from time to time, preferably in place andwith small effort.
Figure 1: A circle appears to be an ellipse if the rota-tion axis of the slewing rings and the optical axis ofthe camera not aligned.
The camera is mounted in the experimental setupsuch that it can be regulated in four degrees of free-dom. The mount is a combination of two precisionlinear stages and a Theta-Phi-Goniometer. In thefirst initialization of the setup, we can adjust theoptical axis of the camera manually, but with lowprecision. In the next step, a small visual marker(e.g. a board with a small hole) is mounted on theslewing rings such that it rotates with the mirror.
Figure 2: An object consisting of markers with knownposition can be used to find the inner orientationparameters of the camera (mainly focal length andprincipal point) from the laws of perspective projec-tion [1].
IOS Annual Report 2009 61

The rotating ring with the marker describes a curveon the camera image. If the rotation axis and theoptical axis of the camera are perfectly aligned, asensor image with a large exposure time shows aperfect circle, otherwise the image contains an el-lipse or part of an ellipse. This image is used tocalculate the ellipse parameters. Because we knowthe parameters of the experimental setup and theellipse, we can now calculate the adjustments thathave to be made at the goniometer and the linearstages. This step can be repeated until the desiredprecision is reached.
The principal point of the camera is determinedin another calibration procedure before it is installedin the experimental setup. Standard photogram-metric methods as described in [1] are used to com-pute the inner camera orientation parameters whichinclude the principal point. The procedure requiresat least two images of a calibration object, takenfrom two different positions. The calibration objectcontains simple markers which are known in sizeand distance to each other.
Bibliography
[1] Karl Kraus. Photogrammetrie, Band 1, Ge-ometrische Informationen aus Photographienund Laserscanneraufnahmen. Walter de GruyterVerlag, Berlin, 7 edition, 2004.
[2] Jürgen Bollmann. Lexikon der Kartografie undGeomatik. Spektrum Akademischer Verlag,Heidelberg, 2002.
[3] Walter Kreiling Jörg Albertz. Photogram-metrisches Taschenbuch. Herbert Wichmann,4 edition, 2002.
[4] Helmut Kager Karl Kraus, Josef Jansa. Pho-togrammetrie, Band 2, Verfeinerte Methodenund Anwendungen. Walter de Gruyter Verlag,Berlin, 1996.
[5] Thomas Luhmann. Nahbereichsphotogramme-trie, Grundlagen, Methoden und Anwendungen.Herbert Wichmann Verlag, Heidelberg, 2000.
62 IOS Annual Report 2009

Image Processing
Removal of Complex Lens Distortions
Stefan Florschütz and Matthias O. Franz
Image distortion is an intrinsic trait of all object lenses. Technically it is an aberration,which causes normally straight lines to appear warped or crooked. This error is created bythe locally varying magnification, resulting from the fact that the focal length is differentfor different image angles. For high-precision image processing it is therefore important toremove this lens distortion before continuing to work with the image.
The simplest and most common forms of distor-tion are radially symmetric distortions like barrel -and pincushion-distortion. Barrel distortion is char-acterized by a decreasing magnification towards theedges of the image, while pincushion distortion isrecognizable from an increase in magnification to-wards the edge.
Figure 1: Effects of radially symmetric distortions. Fromleft to right: Distortion-free image, barrel distortion,pincushion distortion [1]
In practice, it is often the case that different kindsof distortions are overlapping and thus creating acomplex distortion pattern. Such complex distor-tions are not as easily removable as the radiallysymmetric ones.
Basically one has to extract and compute thedistortion field, which contains informations aboutthe degree and direction of the distortion at everyposition in the image. This field can then be usedto remove the distortion from the image.
Figure 2: Left: Original image, right: distorted imageusing an exaggerated complex distortion field.
The method of acquisition of the aforementioneddistortion field is the subject of this diploma thesis.An image of a known pattern of markers (blobs) istaken. Because of the lens distortion, the markersin the image do not correspond to the original pat-tern, i.e. distances between markers can be shorteror longer than in the original, or connecting linesbetween markers are not parallel or orthogonal.
The markers in the image are detected usingan edge detection algorithm. It is essential to de-termine the centers of the markers as accuratelyas possible. This is achieved by use of the Zhou-Operator [2], which allows for sub-pixel positionalaccuracy.
Now that the relative distortion of the small num-ber of markers is known, this information can beused to interpolate the distortion field at every pixelin the image. This is achieved by means of a train-ing process using a Gaussian Process model [3].The distortion field of the markers acts as input forthe training process.
IOS Annual Report 2009 63

Figure 3: Removal of complex lens distortion. Left: orig-inal pattern (black), distorted pattern (red), recti-fication vectors for distorted markers(green). Right:sketch of trained distortion field. Note the rectifica-tion vectors across the whole image.
Bibliography
[1] http://www.dxo.com/en/photo/dxo_optics_pro/optics_geometry_corrections/distortion.
[2] Thomas Luhmann. Nahbereichsphotogramme-trie - Grundlagen, Methoden und Anwendun-gen. Wichmann, 2000.
[3] C. E. Rasmussen and C. K. I. Williams. Gaus-sian processes for machine learning. MIT Press,Cambridge, MA, 2006.
64 IOS Annual Report 2009
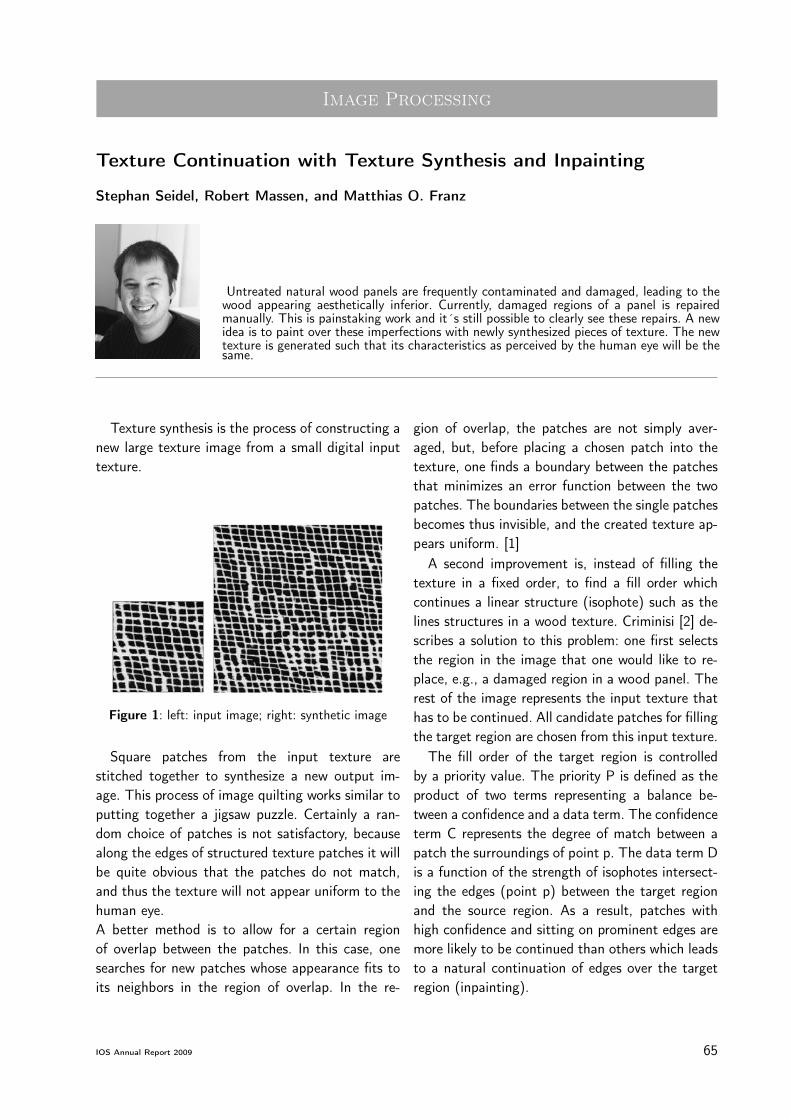
Image Processing
Texture Continuation with Texture Synthesis and Inpainting
Stephan Seidel, Robert Massen, and Matthias O. Franz
Untreated natural wood panels are frequently contaminated and damaged, leading to thewood appearing aesthetically inferior. Currently, damaged regions of a panel is repairedmanually. This is painstaking work and it´s still possible to clearly see these repairs. A newidea is to paint over these imperfections with newly synthesized pieces of texture. The newtexture is generated such that its characteristics as perceived by the human eye will be thesame.
Texture synthesis is the process of constructing anew large texture image from a small digital inputtexture.
Figure 1: left: input image; right: synthetic image
Square patches from the input texture arestitched together to synthesize a new output im-age. This process of image quilting works similar toputting together a jigsaw puzzle. Certainly a ran-dom choice of patches is not satisfactory, becausealong the edges of structured texture patches it willbe quite obvious that the patches do not match,and thus the texture will not appear uniform to thehuman eye.A better method is to allow for a certain regionof overlap between the patches. In this case, onesearches for new patches whose appearance fits toits neighbors in the region of overlap. In the re-
gion of overlap, the patches are not simply aver-aged, but, before placing a chosen patch into thetexture, one finds a boundary between the patchesthat minimizes an error function between the twopatches. The boundaries between the single patchesbecomes thus invisible, and the created texture ap-pears uniform. [1]
A second improvement is, instead of filling thetexture in a fixed order, to find a fill order whichcontinues a linear structure (isophote) such as thelines structures in a wood texture. Criminisi [2] de-scribes a solution to this problem: one first selectsthe region in the image that one would like to re-place, e.g., a damaged region in a wood panel. Therest of the image represents the input texture thathas to be continued. All candidate patches for fillingthe target region are chosen from this input texture.
The fill order of the target region is controlledby a priority value. The priority P is defined as theproduct of two terms representing a balance be-tween a confidence and a data term. The confidenceterm C represents the degree of match between apatch the surroundings of point p. The data term Dis a function of the strength of isophotes intersect-ing the edges (point p) between the target regionand the source region. As a result, patches withhigh confidence and sitting on prominent edges aremore likely to be continued than others which leadsto a natural continuation of edges over the targetregion (inpainting).
IOS Annual Report 2009 65

Figure 2: An example of removal. From left to right:original image, the damaged or unpleasing target re-gion marked in green, result of region filling.
In our project, we apply these techniques for in-painting to untreated natural wood panels. In thefinal system, the target regions are detected auto-matically by standard surface inspection algorithms.The damaged regions are removed by CNC milling
tools and filled in with putty. For visually satisfyingresults, the recording colour camera and the print-ing device have to be calibrated carefully. We cur-rently work in a simplified setting where the actualwooden surfaces are replaced by printouts of theirrecorded images.
Bibliography
[1] Alexei A. Efros and William T. Freeman. Im-age quilting for texture synthesis and transfer,2001.
[2] Criminisi Erez Toyama, A. Criminisi, P. Pérez,and K. Toyama. Object removal by exemplar-based inpainting. pages 721–728, 2003.
66 IOS Annual Report 2009

Image Processing
Digital Image Steganography
Olga Schönemann, Markus Meßmer, Le Pham Hai Dang, and Matthias O. Franz
Steganography is the art of hidden storage or transmission of information. In contrast tocryptographic systems, which turn the message into an obscure encoded output, stegano-graphic systems attempt to hide their existence by embedding them into an unobvious cover(images, mp3, etc.). Nowadays there are numerous steganography tools, like OutGuess [1],Steghide [2] or F5 [3]. Unfortunately, these applications have the disadvantage that theyonly support two or three image formats and only one or two algorithms, making a faircomparison more difficult. Therefore, the integration of additional algorithms is impossible.
In this project, we develop a steganog-raphy framework that avoids these disad-vantages. The steganography system can bedivided into three components (Fig. 1):
Figure 1: Steganography system
The system works in three steps. It first encryptsthe file, then it opens the image and loads the li-brary. In the last step the message is embedded inthe image. In addition to embedding, the programsupports the extraction of a message using varioustechniques, setting a target directory, the encryp-tion of a file and the transfer of parameters requiredby the libraries.The complete task of preprocessing is done by thesteganography system, i.e. the library developers
only need to worry about the embedding or the ex-traction.The current version includes three algorithms:
• LSB (Least Significant Bit)
A simple method which embeds into the bitplanes of an image. For example: It uses thelast bit of an 8 bit per pixel image (grayscale)and replaces it with one message-bit. [4]
• F5
F5 is an advanced method of JSTEG [3]. In-stead of embedding in each pixel, the algo-rithm replaces randomly-selected pixels anduses matrix coding to reduce the number ofpixels that have to be changed.
• Noise approach
This algorithm belongs to the adaptive tech-niques. Adaptive techniques respect the im-age contents during the embedding pro-cess.This means that the algorithm tries tosimulate natural noise by changing bits onlywhere the existing noise is high enough. [5]
By using the framework it is possible to integratemany more algorithms that can be used to embeddin various image formats.
IOS Annual Report 2009 67

Bibliography
[1] Jessica Fridrich, Miroslav Goljan, and DorinHogea. Attacking the outguess, 2002.
[2] Stefan Hetzl. Steghide.http://steghide.sourceforge.net/index.php,2003. (cited 2010/05/20).
[3] Andreas Westfeld. F5-a steganographic algo-
rithm. In Information Hiding, pages 289–302,2001.
[4] Sushil Jajodia Neil F. Johnson. Exploringsteganography:seeing the unseen. In ComputingPractices, pages 28–30, 1998.
[5] Eiji Kawaguchi and Richard O. Eason. Principleand applications of bpcs-steganography, 1998.
68 IOS Annual Report 2009

Computer Graphics
Real-Time Multi-Camera Matching for 3D Reconstruction
Klaus Denker and Georg Umlauf
For multi-camera-based 3d reconstruction there is the trade-off between the quality of thecomputed depth map and the speed of the computations. Whereas high quality matchingmethods take several seconds or minutes to compute a depth map for one set of images,real-time methods achieve only low quality results.Here we present a multi-camera matching method running in real-time for high resolutiondepth maps. It is based on a novel multi-level combination of normalized cross correlation,deformed matching windows based on the multi-level depth map information, and sub-pixel precise disparity maps. It is implemented completely on the GPU to process four 0.7megapixel images in 10.5 milliseconds to a full resolution 3d depth map tailored to 3d facerecognition.
Stereo matching is a techniques to compute fromtwo or more 2d camera images a depth map ofthe captured object. It is used in remote sensing,robotics, archeology, cultural heritage, reverse engi-neering, and 3d face recognition [1,2], because it isthe only passive method to compute depth informa-tion. This means only natural light is used for thedata acquisition without artificial interaction withthe object that might harm it.
However, there is the trade-off between the depthmap quality and the computation time. Where areal-time computation is not important the multi-view-matching methods focus on high quality re-sults. These methods need at least several secondsto compute a single depth map from one set of im-ages [3]. However, for robotics faster computationtimes are more important leading to GPU-basedreal-time matching methods [4].
Our target application is 3d face recognition,where the requirements are in between these fields.The reconstruction and recognition needs to bedone in less than half a second for customer com-fort, while the reconstruction quality must be reli-able for a dependable recognition.
Our multi-camera matching process consists ofseveral nested loops as described in [5] and shownin Fig. 1 (right). This process is based on a sys-tem of four USB Logitech® cameras QuickCam®
Pro 9000. These cameras run at a resolution of960 � 720 at 5 fps connected via two USB 2.0
Controllers. Here, the USB-bandwidth limits thecamera resolution. To get the best results we usea Y-constellation of the four cameras as shown inFig. 1 (left). A camera constellation with a pre-ferred direction could deteriorate the detection offeatures along this direction, e.g. horizontal stripesin the image cause problems in a horizontal cameraconstellation. Our method can be adapted to ar-bitrary camera constellations, independently of theused hardware system.
Multi level matching
Disparity map generation
Search for best match
best match
move matchingwindows
Multi camera matching
Stereo matching
score
for eachimage pair
disparity map
for each pixel
full resolutiondisparity map
doubleresolution
Figure 1: The matching process and the camera sys-tem.
Because our method mainly works on images andgenerates a depth map as an image, we use GLSLfragment shaders. For the complex shader opera-tions GPUs which support at least shader model4.0 are necessary.
IOS Annual Report 2009 69

The input data are multiple raw camera images.Each raw image is corrected by a shader imple-menting the lens correction. The resulting correctedimages are rendered into separate textures. Eachtexture is then transformed into a mip-map (CIM)used by all subsequent shaders. Each step in ourmulti-level matching requires four fragment shaderprograms. The first shader takes the CIM and ren-ders the weighted average color of the pixels of amatching window at the actual resolution level toseparate average textures (AT). The second shadertakes the CIM and the AT and renders the weightedauto-correlation for the same matching window toan auto-correlation texture (ACT). The third shadertakes the AT and ACT and performs all match-ing operations, i.e. it moves the deformed match-ing windows, computes the total score, and findsthe best sub-pixel score. The result is rendered asthe disparity map (DM), the best total score ofthe finest resolution and the quality measure tothe three color channels of a separate texture. Thefourth shader takes the DM, smooths the dispari-ties, and renders the result to a smoothed disparitymap.
Figure 2: Sample images from our camera system.
Example images of our system are shown inFig. 2. Fig. 3 shows the resulting texture holding thedisparity map (red channel), the best total score ofthe finest resolution level (green channel), and thequality measure (blue channel).
After transformation of the disparities to realdepth values, the data can be rendered as 3d model,see Fig. 3 (top right). Here, the low quality regionsare masked and ignored.
The whole calculation for our example imagesat a resolution of 960 � 720 pixels takes an aver-age GPU processing time of 7.5 ms on an NVidiaGeForce GTX 285 GPU. Depending on the scenethe average processing time can increase to 10.5
ms. This allows real-time frame rates of 95 fps. Ourcameras capture only five fps of unsynchronized pic-tures. So we are not able to record 3d videos usingthis camera system.
Figure 3: Results: All color channels (top left), recon-structed 3d model (top right), disparity map (bottomleft), quality measure (bottom right).
The quality of the resulting surface model is suffi-cient for our target application 3d face recognition.The processing times are more than sufficient forface recognition. Cameras with much higher reso-lution could allow for a better quality at still accept-able computation times. Additional methods likecross-checking or edge detection that can be im-plemented on the GPU could further improve ourresults. A camera system that can be synchronizedwould allow the recording of 3d video sequences.
Bibliography
[1] D. Murray and J. Little. Using real-time stereovision for mobile robot navigation. In Au-tonomous Robots, page 2000, 2000.
[2] D.T. Pham and L.C. Hieu. Reverse engineer-ing - hardware and software. In V. Raja andK.J. Fernandes, editors, Reverse Engineering -An Industrial Perspective, pages 33–30, 2008.
[3] Y. Furukawa and J. Ponce. Accurate, dense,and robust multi-view stereopsis. In CVPR,2007.
[4] R. Yang, G. Welch, and G. Bishop. Real-time consensus-based scene reconstruction us-ing commodity graphics hardware, 2002.
[5] K. Denker and G. Umlauf. An accurate real-time multi-camera matching on the GPU for 3dreconstruction. In Submitted to: ICCS 2010.
70 IOS Annual Report 2009
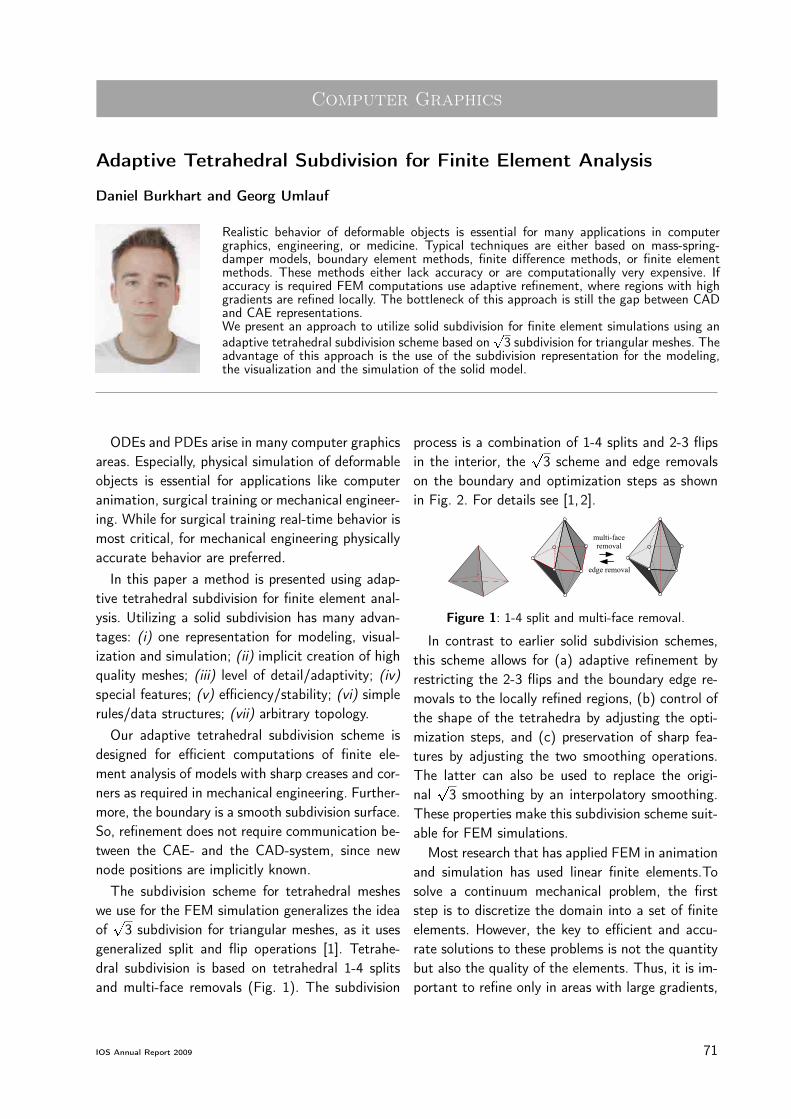
Computer Graphics
Adaptive Tetrahedral Subdivision for Finite Element Analysis
Daniel Burkhart and Georg Umlauf
Realistic behavior of deformable objects is essential for many applications in computergraphics, engineering, or medicine. Typical techniques are either based on mass-spring-damper models, boundary element methods, finite difference methods, or finite elementmethods. These methods either lack accuracy or are computationally very expensive. Ifaccuracy is required FEM computations use adaptive refinement, where regions with highgradients are refined locally. The bottleneck of this approach is still the gap between CADand CAE representations.We present an approach to utilize solid subdivision for finite element simulations using anadaptive tetrahedral subdivision scheme based on
p3 subdivision for triangular meshes. The
advantage of this approach is the use of the subdivision representation for the modeling,the visualization and the simulation of the solid model.
ODEs and PDEs arise in many computer graphicsareas. Especially, physical simulation of deformableobjects is essential for applications like computeranimation, surgical training or mechanical engineer-ing. While for surgical training real-time behavior ismost critical, for mechanical engineering physicallyaccurate behavior are preferred.
In this paper a method is presented using adap-tive tetrahedral subdivision for finite element anal-ysis. Utilizing a solid subdivision has many advan-tages: (i) one representation for modeling, visual-ization and simulation; (ii) implicit creation of highquality meshes; (iii) level of detail/adaptivity; (iv)special features; (v) efficiency/stability; (vi) simplerules/data structures; (vii) arbitrary topology.
Our adaptive tetrahedral subdivision scheme isdesigned for efficient computations of finite ele-ment analysis of models with sharp creases and cor-ners as required in mechanical engineering. Further-more, the boundary is a smooth subdivision surface.So, refinement does not require communication be-tween the CAE- and the CAD-system, since newnode positions are implicitly known.
The subdivision scheme for tetrahedral mesheswe use for the FEM simulation generalizes the ideaofp
3 subdivision for triangular meshes, as it usesgeneralized split and flip operations [1]. Tetrahe-dral subdivision is based on tetrahedral 1-4 splitsand multi-face removals (Fig. 1). The subdivision
process is a combination of 1-4 splits and 2-3 flipsin the interior, the
p3 scheme and edge removals
on the boundary and optimization steps as shownin Fig. 2. For details see [1, 2].
edge removal
multi-faceremoval
Figure 1: 1-4 split and multi-face removal.
In contrast to earlier solid subdivision schemes,this scheme allows for (a) adaptive refinement byrestricting the 2-3 flips and the boundary edge re-movals to the locally refined regions, (b) control ofthe shape of the tetrahedra by adjusting the opti-mization steps, and (c) preservation of sharp fea-tures by adjusting the two smoothing operations.The latter can also be used to replace the origi-nal
p3 smoothing by an interpolatory smoothing.
These properties make this subdivision scheme suit-able for FEM simulations.
Most research that has applied FEM in animationand simulation has used linear finite elements.Tosolve a continuum mechanical problem, the firststep is to discretize the domain into a set of finiteelements. However, the key to efficient and accu-rate solutions to these problems is not the quantitybut also the quality of the elements. Thus, it is im-portant to refine only in areas with large gradients,
IOS Annual Report 2009 71

Figure 2: The tetrahedral subdivision scheme (blue = interior, green = boundary).
tets
0
418
0.00 1.00
error
tets
0
1569
0.00 1.00
error
tets
0
2478
0.00 1.00
error
Figure 3: Two rounds of adaptive subdivision and FE simulation (top – bottom): tetrahedral base mesh (2, 799
tetrahedra), simulation result with visualization of the normalized approximation error (green=low – red=high)and the histogram of the error distribution.
to keep the total number of elements small. Thisrefinement requires adaptive meshing techniques,which must be combined with an appropriate er-ror estimator, while at the same time the qualityof the elements must be controlled. For this weuse the tetrahedral subdivision scheme with opti-mization steps that maximize the minimal dihedralangles.
Our results were computed on a 2GHz Intel Core2Duo with 4GB RAM using Getfem++ for the engi-neering part in Fig. 3 (left top) consisting of 2, 799
tetrahedra. To the top faces (yellow) of the tripod avertical load is applied, while the bottom of the legsof the tripod is fixed. Fig. 3 (left bottom) shows thedeformed model. For the visualization of the nor-malized approximation error of the tetrahedra thecolor hue of the HSV model is linearly interpolatedfrom 0� (low error) to 120� (high error). The sim-ulation took 491ms while the average normalizederror is 0.08. The histogram shows the error distri-bution for the tetrahedra.
For the next step the mesh regions with thelargest error are refined, show in red in Fig. 3 (mid-dle top). The adaptively refined mesh consists of4, 540 tetrahedra. Fig. 3 (middle bottom) showsthe deformation of this new tetrahedral mesh. Thesimulation took 596ms while the average normal-ized error is 0.03. Fig. 3 (right) shows a second
step of adaptive subdivision and simulation. Afterthe adaptive subdivision the mesh consists of 6, 080
tetrahedra. The simulation took 606ms with an av-erage normalized error of 0.01. Without adaptiverefinement the mesh consists of 23, 480 tetrahe-dra after one subdivision step. This yields a sim-ulation time of 7, 574ms with average normalizederror 0.008 for the globally refined mesh. Note thedecrease of the average normalized error and thehistograms getting narrower.
The major advantage of this approach is that onlyone representation is used for modeling, visualiza-tion and simulation of solid models, by means ofan adaptive tetrahedral subdivision tailored for FEapplications. For the future we plan to combine thissubdivision scheme with more complex FE models,e.g. non-linear deformations and subdivision refine-able functions for the FE simulation.
Bibliography
[1] D. Burkhart, B. Hamann, and G. Umlauf.Adaptive and freature-preserving subdivisionfor high-quality tetrahedral meshes. CGF,29(1):117–127, 2010.
[2] D. Burkhart, B. Hamann, and G. Umlauf. Adap-tive tetrahedral subdivision for finite elementanalysis. In: CGI, 2010.
72 IOS Annual Report 2009
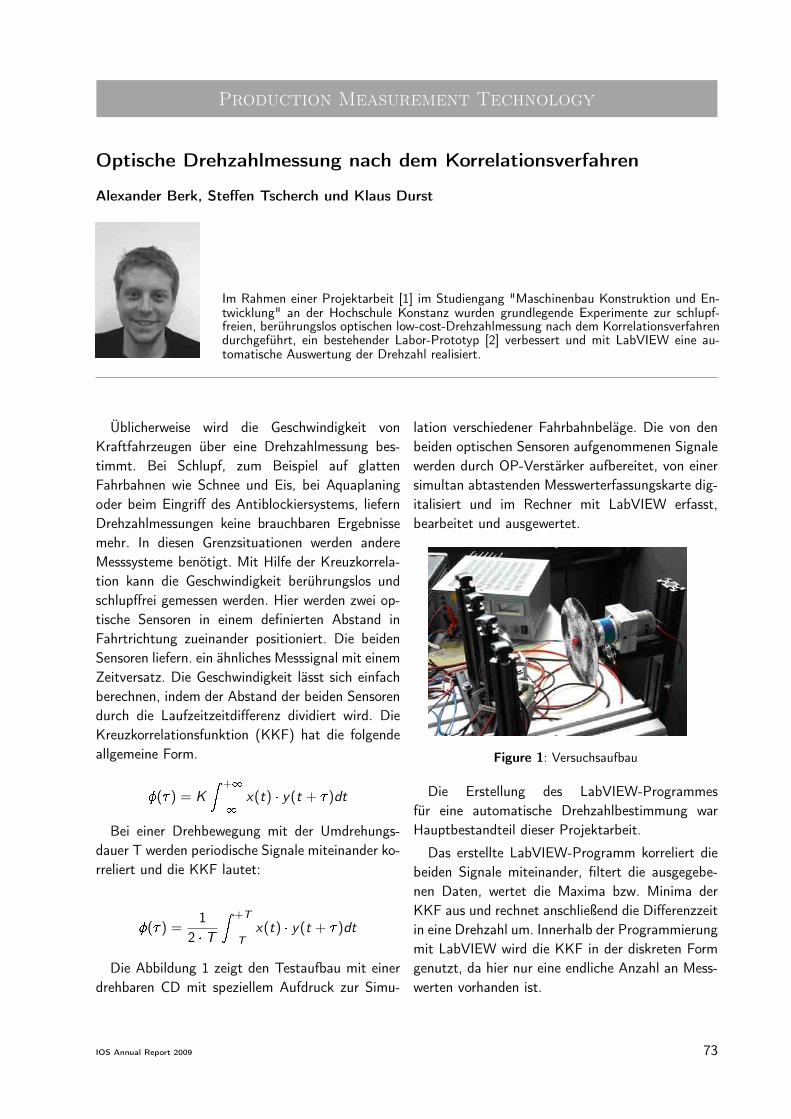
Production Measurement Technology
Optische Drehzahlmessung nach dem Korrelationsverfahren
Alexander Berk, Steffen Tscherch und Klaus Durst
Im Rahmen einer Projektarbeit [1] im Studiengang "Maschinenbau Konstruktion und En-twicklung" an der Hochschule Konstanz wurden grundlegende Experimente zur schlupf-freien, berührungslos optischen low-cost-Drehzahlmessung nach dem Korrelationsverfahrendurchgeführt, ein bestehender Labor-Prototyp [2] verbessert und mit LabVIEW eine au-tomatische Auswertung der Drehzahl realisiert.
Üblicherweise wird die Geschwindigkeit vonKraftfahrzeugen über eine Drehzahlmessung bes-timmt. Bei Schlupf, zum Beispiel auf glattenFahrbahnen wie Schnee und Eis, bei Aquaplaningoder beim Eingriff des Antiblockiersystems, liefernDrehzahlmessungen keine brauchbaren Ergebnissemehr. In diesen Grenzsituationen werden andereMesssysteme benötigt. Mit Hilfe der Kreuzkorrela-tion kann die Geschwindigkeit berührungslos undschlupffrei gemessen werden. Hier werden zwei op-tische Sensoren in einem definierten Abstand inFahrtrichtung zueinander positioniert. Die beidenSensoren liefern. ein ähnliches Messsignal mit einemZeitversatz. Die Geschwindigkeit lässt sich einfachberechnen, indem der Abstand der beiden Sensorendurch die Laufzeitzeitdifferenz dividiert wird. DieKreuzkorrelationsfunktion (KKF) hat die folgendeallgemeine Form.
�(� ) = K
Z +1
�1
x(t) � y(t + � )dt
Bei einer Drehbewegung mit der Umdrehungs-dauer T werden periodische Signale miteinander ko-rreliert und die KKF lautet:
�(� ) =1
2 � TZ +T
�Tx(t) � y(t + � )dt
Die Abbildung 1 zeigt den Testaufbau mit einerdrehbaren CD mit speziellem Aufdruck zur Simu-
lation verschiedener Fahrbahnbeläge. Die von denbeiden optischen Sensoren aufgenommenen Signalewerden durch OP-Verstärker aufbereitet, von einersimultan abtastenden Messwerterfassungskarte dig-italisiert und im Rechner mit LabVIEW erfasst,bearbeitet und ausgewertet.
Figure 1: Versuchsaufbau
Die Erstellung des LabVIEW-Programmesfür eine automatische Drehzahlbestimmung warHauptbestandteil dieser Projektarbeit.
Das erstellte LabVIEW-Programm korreliert diebeiden Signale miteinander, filtert die ausgegebe-nen Daten, wertet die Maxima bzw. Minima derKKF aus und rechnet anschließend die Differenzzeitin eine Drehzahl um. Innerhalb der Programmierungmit LabVIEW wird die KKF in der diskreten Formgenutzt, da hier nur eine endliche Anzahl an Mess-werten vorhanden ist.
IOS Annual Report 2009 73

Die Auswertung wurde in dieser Arbeit kon-tinuierlich zehnmal pro Sekunde durchgeführt. Ausder Abbildung 2 ist der LabVIEW-Auswertegraphmit den ermittelten Minima (hier durch grünePunkte visualisiert) erkennbar.
Figure 2: Messsignale der zwei optischen Sensoren(oben) und die gefilterte KKF mit ermittelten Minima(unten).
Mit diesem Graph und seiner Visualisierung derMaxima bzw. der Minima kann eine unmittelbareEinschätzung der Qualität der KKF-Ergebnisse und
der Drehzahlbestimmung vorgenommen werden.Die gestellte Aufgabe einer robusten rechn-
ergestützten automatischen Drehzahlbestimmungmit LabVIEW für die optische Drehzahlmessungnach dem KKF-Verfahren konnte in der vorliegen-den Arbeit gelöst werden und es wurde gezeigt, dasseine zuverlässige optische KKF-Drehzahlmessungim low-cost-Bereich möglich ist.
Bibliography
[1] A. Berk and S. Tscherch. Projektarbeit desStudiengangs Maschinenbau-Konstruktion undEntwicklung. Master’s thesis, HTWG Konstanz,2010.
[2] K. Durst, A. Resch, and D. Merk.Zwischenbericht: Schlupffreie optischeGeschwindigkeitsmessung nach dem Ko-rrelationsverfahren. Annual Report IOSKonstanz, 2008.
74 IOS Annual Report 2009

IOS Annual Report 2009 75


