1 Formation of Lanthanum Zirconate in Solid Oxide Electrolysis Cells Experimental Studies Pedro Almeida, Departamento de Engenharia Mecânica, Instituto Superior Técnico, Avenida Rovisco Pais, 1049-001 Lisboa Abstract Versa Power Systems solid oxide cells have been tested to study their degradation over long-term steam electrolysis. Previous studies conducted at the Colorado Fuel Cell Center on another VPS cell caused severe electrode delamination and X-Ray Diffraction (XRD) tests evidenced the formation of insulating phases of lanthanum zirconates. The main objective was then to search for the formation of these phases and what causes them to form. Cells were tested in electrolysis mode running on 50%H 2 / 50%H 2 O using a test stand previously developed by a senior design team of the Colorado School of Mines. Three cells were tested and but only one sustained long term electrolysis testing. The first two fractured due to excessive fuel flow and lack of heating in inlet tubes causing thermal cracking. The last one showed good initial performance with power densities around 0.32 W/cm 2 and with an ASR of 0.59 Ω.cm 2 running on 175sccmH 2 / 175sccmH 2 0. The cell ran in electrolysis mode for 290 hours showing steady degradation that eventually stabilized and even recovered in the last tens of hours. Scanning Electron Microscopy and XRD showed no significant microstructural changes and no presence of the insulating phase. New XRD tests on previously tested cell showed no presence of lanthanum zirconates. As conclusion, in the present study, no presence of lanthanum zirconate phases was found in either new or old cell. Yet, taking into account the previous study, one can assume that these might form locally under the places were platinum paste was present. Keywords SOFC, SOEC, electrolysis, degradation, lanthanum zirconate Introduction One of the many reported problems in the use of solid oxide cells (SOC) for electrolysis is the formation of insulating phases (for example, lanthanum zirconates) during long- term operation. These create ionic barriers, lower cell performance and can eventually cause cell failure due to delamination of the oxygen electrode from the electrolyte. This does not allow SOFC’s to be reversible, which could be of great use if we consider that one could produce hydrogen from the energy surplus of intermittent renewable sources and later use that same hydrogen during peak load hours.
Transcript
1
Formation of Lanthanum Zirconate in Solid Oxide Electrolysis Cells
Experimental Studies
Pedro Almeida, Departamento de Engenharia Mecânica, Instituto Superior Técnico,
Avenida Rovisco Pais, 1049-001 Lisboa
Abstract
Versa Power Systems solid oxide cells have been tested to study their degradation over long-term steam electrolysis. Previous studies conducted at the Colorado Fuel Cell Center on another VPS cell caused severe electrode delamination and X-Ray Diffraction (XRD) tests evidenced the formation of insulating phases of lanthanum zirconates. The main objective was then to search for the formation of these phases and what causes them to form. Cells were tested in electrolysis mode running on 50%H2 / 50%H2O using a test stand previously developed by a senior design team of the Colorado School of Mines. Three cells were tested and but only one sustained long term electrolysis testing. The first two fractured due to excessive fuel flow and lack of heating in inlet tubes causing thermal cracking. The last one showed good initial performance with power densities around 0.32 W/cm2 and with an ASR of 0.59 Ω.cm2 running on 175sccmH2 / 175sccmH20. The cell ran in electrolysis mode for 290 hours showing steady degradation that eventually stabilized and even recovered in the last tens of hours. Scanning Electron Microscopy and XRD showed no significant microstructural changes and no presence of the insulating phase. New XRD tests on previously tested cell showed no presence of lanthanum zirconates. As conclusion, in the present study, no presence of lanthanum zirconate phases was found in either new or old cell. Yet, taking into account the previous study, one can assume that these might form locally under the places were platinum paste was present.
One of the many reported problems in the use of solid oxide cells (SOC) for electrolysis is the formation of insulating phases (for example, lanthanum zirconates) during long-term operation. These create ionic barriers, lower cell performance and can eventually cause cell failure due to delamination of the oxygen electrode from the electrolyte. This does not allow SOFC’s to be reversible, which could be of great use if we consider that one could produce hydrogen from the energy surplus of intermittent renewable sources and later use that same hydrogen during peak load hours.
2
Brant, M.C. et. al. (2006), studied the electrical degradation of porous and dense Lanthanum Strontium Manganate (LSM) / Yttrium Stabilized Zirconia (YSZ) interface. For this, electrochemical cells formed by the interface between dense and porous LSM and YSZ were submitted to annealing temperatures varying from 1373 K to 1673 K for 200h and studied by Impedance Spectroscopy (IS) in order to investigate how the temperatures can modify the interface between LSM and YSZ and to which extent these affect the electrical behavior of the dense and porous LSM electrodes, before and after the creation of insulating phases. Up to 1473 K no substantial adverse changes were found. Over 1473 K, the resistance contributions increased largely, especially for the porous electrodes and one additional semi-circle was observed that was associated to the oxygen diffusion process at the new insulating phases formed. The porous electrodes degraded faster than the porous ones probably due to the morphological effects as for example grain growth at higher temperatures. Brisse, A. et. al. (2008) studied the performance of solid oxide cells when used to perform high temperature water electrolysis due to it being a promising technology that requires less electrical energy consumption than conventional low temperature water electrolysis. Current-potential measurements and Impedance Spectroscopy were performed to assess the performance of cells as function of temperature, humidity and current density. High electrical-to-hydrogen energy conversion efficiencies were obtained, i.e., cell voltages of 1.0 and 1.25 at -1A/cm-2 and 900ºC and 800ºC respectively. Results also showed that SOEC operation can be limited by the gas diffusion in the steam/hydrogen electrode, notably at moderate humidities below 70 vol% AH. No cell ageing, including electrode delamination, was detected during 160h of electrolysis mode operation. Chervin, C. et. al. (2004) investigated the chemical degradation of LSM/YSZ composite cathodes in the presence of current collector pastes. Anode-supported single cells were prepared with Platinum (Pt) or Silver (Ag) paste current collectors applied to the electrodes. Phase purity of the cathodes, before and after the sintering the current collectors, was analized with X-Ray Diffraction (XRD) and cell performance was evaluated through current-potential measurements. XRD results showed that Pt paste containing a bismuth flux reacted with the cathode at temperatures above 800 ºC, leading to the formation of a lanthanum zirconate phase (La2Zr2O7 - LZO). When using the Ag paste which did not contain a bismuth flux, no chemical degradation was observed. The presence of bismuth in the paste for the LSM-YSZ cathode, contributed to the lowering temperature required for the formation of LZO phase. Current-potential measurements showed also that cells prepared with the paste containing bismuth had lower initial performance. Hauch, A. et. al. studied the microstructure and degradation of the Ni/Yttria-Stabilized Zirconia of Solid Oxide Electrolysis Cells (SOEC). For this solid oxide cells produced at Risø DTU (National Laboratory for Sustainable Energy, Technical University of Denmark) were used for steam electrolysis by applying an external voltage. A previously reported passivation1 effect over the first few hundred was found to be caused by the sealing method used on the hydrogen electrode. Degradation of the cells during long-term galvanostatic (constant current) testing was analyzed by Impedance Spectroscopy and was found to be mainly caused by an increased polarization resistance of the hydrogen electrode. A cell degradation of 2% / 1000 h was obtained. Postmortem analysis of the cells tested in these conditions showed that the electrode microstructure could sustain at least 1300h of electrolysis testing, even though impurities were detected at the hydrogen 1 Passivation is used to describe a reversible or partially reversible loss in performance
3
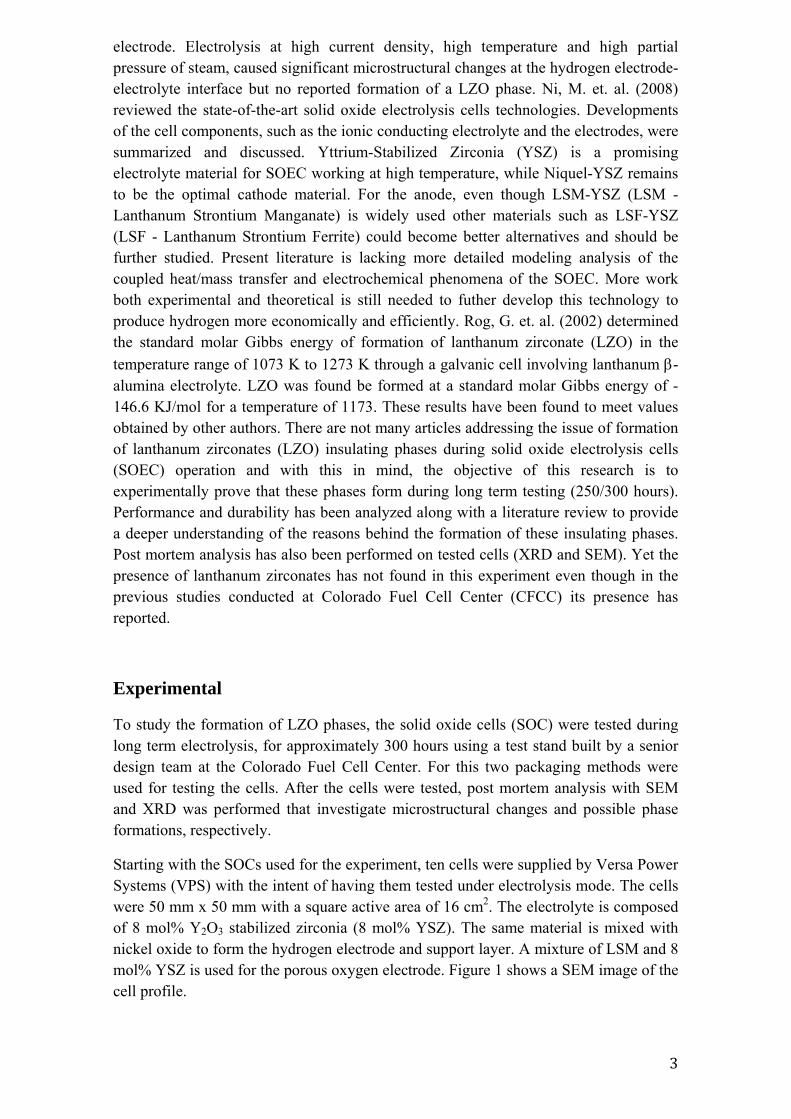
electrode. Electrolysis at high current density, high temperature and high partial pressure of steam, caused significant microstructural changes at the hydrogen electrode-electrolyte interface but no reported formation of a LZO phase. Ni, M. et. al. (2008) reviewed the state-of-the-art solid oxide electrolysis cells technologies. Developments of the cell components, such as the ionic conducting electrolyte and the electrodes, were summarized and discussed. Yttrium-Stabilized Zirconia (YSZ) is a promising electrolyte material for SOEC working at high temperature, while Niquel-YSZ remains to be the optimal cathode material. For the anode, even though LSM-YSZ (LSM - Lanthanum Strontium Manganate) is widely used other materials such as LSF-YSZ (LSF - Lanthanum Strontium Ferrite) could become better alternatives and should be further studied. Present literature is lacking more detailed modeling analysis of the coupled heat/mass transfer and electrochemical phenomena of the SOEC. More work both experimental and theoretical is still needed to futher develop this technology to produce hydrogen more economically and efficiently. Rog, G. et. al. (2002) determined the standard molar Gibbs energy of formation of lanthanum zirconate (LZO) in the
temperature range of 1073 K to 1273 K through a galvanic cell involving lanthanum -alumina electrolyte. LZO was found be formed at a standard molar Gibbs energy of -146.6 KJ/mol for a temperature of 1173. These results have been found to meet values obtained by other authors. There are not many articles addressing the issue of formation of lanthanum zirconates (LZO) insulating phases during solid oxide electrolysis cells (SOEC) operation and with this in mind, the objective of this research is to experimentally prove that these phases form during long term testing (250/300 hours). Performance and durability has been analyzed along with a literature review to provide a deeper understanding of the reasons behind the formation of these insulating phases. Post mortem analysis has also been performed on tested cells (XRD and SEM). Yet the presence of lanthanum zirconates has not found in this experiment even though in the previous studies conducted at Colorado Fuel Cell Center (CFCC) its presence has reported.
Experimental
To study the formation of LZO phases, the solid oxide cells (SOC) were tested during long term electrolysis, for approximately 300 hours using a test stand built by a senior design team at the Colorado Fuel Cell Center. For this two packaging methods were used for testing the cells. After the cells were tested, post mortem analysis with SEM and XRD was performed that investigate microstructural changes and possible phase formations, respectively.
Starting with the SOCs used for the experiment, ten cells were supplied by Versa Power Systems (VPS) with the intent of having them tested under electrolysis mode. The cells were 50 mm x 50 mm with a square active area of 16 cm2. The electrolyte is composed of 8 mol% Y2O3 stabilized zirconia (8 mol% YSZ). The same material is mixed with nickel oxide to form the hydrogen electrode and support layer. A mixture of LSM and 8 mol% YSZ is used for the porous oxygen electrode. Figure 1 shows a SEM image of the cell profile.
4
Figure 1 - SEM image of cell profile: a) O2 electrode2; b) electrolyte; c) H2 electrode; d) support layer3
The test stand used was built by senior design team B. Curkendall, R. Donley, C. Rickers, M. Schmidt and S. Waggy in 2006-2007 and even though it was built for SOFC testing, it was also prepared for SOEC testing.
Important to mention regarding the test stand is that two computers and two Labview programs were used. One was used to control the gas flows and the other one was connected to a Chroma DC electronic load controller which was connected to the voltage and current taps of the cell.
This Chroma DC electronic load controller was composed by a Chroma 6314 mainframe controller and by three individual 63103 load modules, each capable of delivering up to 60A, 80V and a maximum power of 300W.
Also important to mention is the bubbler unit which had to be rebuilt. The new bubbler unit was composed by an Omega SRFG-309/5-P heating pad which has 76mm width by 230mm of length coupled to an Omega CN7833 PID controller. The pressure transducer was an Omega PX181B-030G5V with a range between 0 and 30 psi with 1 to 5 V output.
Figure 2 - New bubbler unit and respective PID controller
For post-mortem analysis, a FEI Quanta 600 environmental Scaning Electron Microscope (SEM) was used for SEM imaging which allowed for SEM imaging and for
2 Full thickness of O2 electrode not represented in figure. 3 Full thickness of support layer not represented in figure.
5
energy dispersive spectra (EDS). For X-Ray Diffraction (XRD), a Philips X’Pert X-ray diffractometer with a copper tube was used.
Regarding the cell packaging, as mentioned, two setups were used: one using a mica seal with voltage/current taps going through the seals; and another one using a alumina/silica seal produced by ZIRCAR Refractory Composites, Inc. with the voltage/current taps going through the pipes. This can be seen in Figure 3 and Figure 4.
Figure 3 - Open furnace view of cell setup with voltage and current taps; and exploded view of the cell setup with mica gaskets
Figure 4 - Gas manifold with new voltage and currents taps; and exploded view of cell setup with Al/Si gaskets
After having the cell packaged and mounted on the furnace, it was compressed with a hydraulic jack and the furnace was set for 800 ºC at a heating rate of 2 ºC/min. At the same time, air and forming gas (mixture of 97 % argon and 3 % hydrogen) were applied at a rate of 250 sccm on the oxygen and hydrogen side, respectively. Forming gas was used for the reduction of the NiO under a hydrogen atmosphere. It was left overnight with these gas flows and, in the morning of the next day, the forming gas was turned off and the hydrogen was turned on at the same rate. The cell was left running at a 0,25 A/cm2 (4A) to help reduce the cell. In the end of that day an IV curve was taken and an EIS measurement is performed. The cell was again left overnight running on 250 sccm of H2 and air, with 0,25 A/cm2 applied. The next day the flow on the hydrogen side
6
was switched to 50% H2 / 50% H2O, usually with a total flow of 350 sccm, and another IV curve and EIS measurement were done. When finished, the cell is switched to electrolysis mode and an IV curve is run in electrolysis mode.
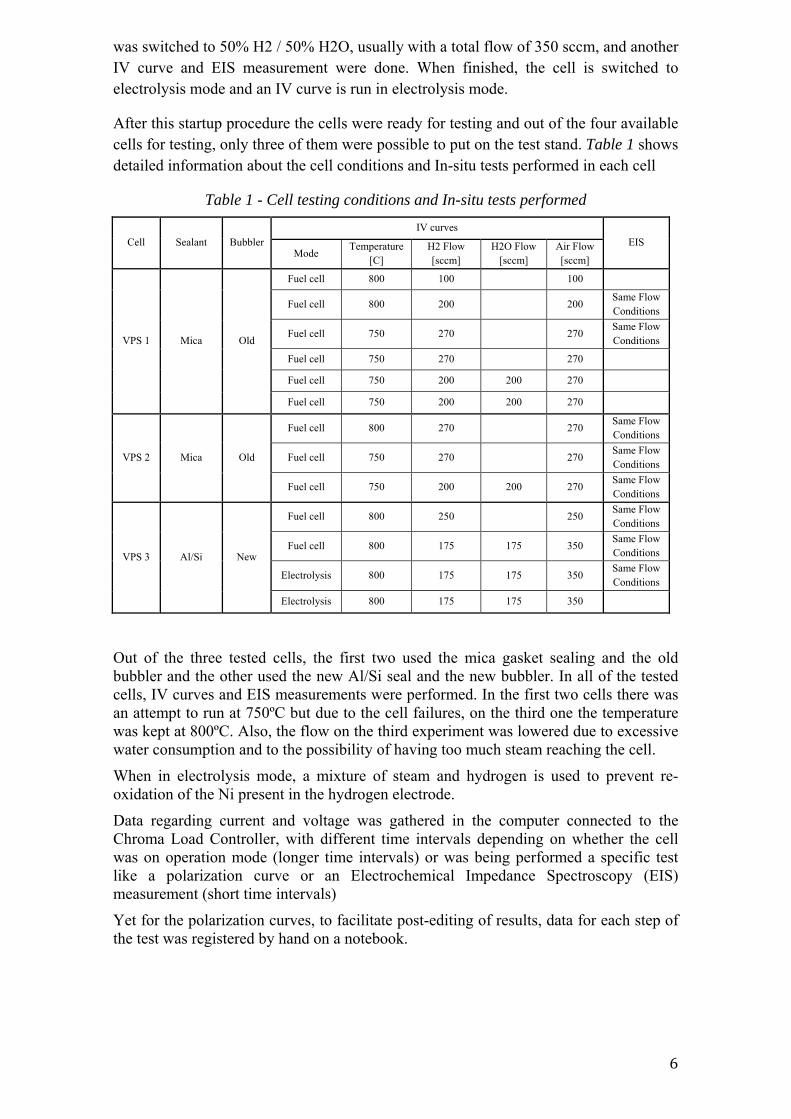
After this startup procedure the cells were ready for testing and out of the four available cells for testing, only three of them were possible to put on the test stand. Table 1 shows detailed information about the cell conditions and In-situ tests performed in each cell
Table 1 - Cell testing conditions and In-situ tests performed
Cell Sealant Bubbler
IV curves
EIS Mode
Temperature [C]
H2 Flow [sccm]
H2O Flow [sccm]
Air Flow [sccm]
VPS 1 Mica Old
Fuel cell 800 100 100
Fuel cell 800 200 200 Same Flow Conditions
Fuel cell 750 270 270 Same Flow Conditions
Fuel cell 750 270 270
Fuel cell 750 200 200 270
Fuel cell 750 200 200 270
VPS 2 Mica Old
Fuel cell 800 270 270 Same Flow Conditions
Fuel cell 750 270 270 Same Flow Conditions
Fuel cell 750 200 200 270 Same Flow Conditions
VPS 3 Al/Si New
Fuel cell 800 250 250 Same Flow Conditions
Fuel cell 800 175 175 350 Same Flow Conditions
Electrolysis 800 175 175 350 Same Flow Conditions
Electrolysis 800 175 175 350
Out of the three tested cells, the first two used the mica gasket sealing and the old bubbler and the other used the new Al/Si seal and the new bubbler. In all of the tested cells, IV curves and EIS measurements were performed. In the first two cells there was an attempt to run at 750ºC but due to the cell failures, on the third one the temperature was kept at 800ºC. Also, the flow on the third experiment was lowered due to excessive water consumption and to the possibility of having too much steam reaching the cell.
When in electrolysis mode, a mixture of steam and hydrogen is used to prevent re-oxidation of the Ni present in the hydrogen electrode.
Data regarding current and voltage was gathered in the computer connected to the Chroma Load Controller, with different time intervals depending on whether the cell was on operation mode (longer time intervals) or was being performed a specific test like a polarization curve or an Electrochemical Impedance Spectroscopy (EIS) measurement (short time intervals)
Yet for the polarization curves, to facilitate post-editing of results, data for each step of the test was registered by hand on a notebook.
7
Results and Discussion
VPS cell 1 & 2
Regarding VPS cells 1 and 2 both suffered from a premature failure so their results will not be presented in this article. When looking at the results from both cells, both of them exhibited good performance in the first polarization curves running on pure hydrogen. They presented good stable voltage and acceptable power densities and ASR’s. Only when switching to a mixture of 50% H2 / 50% H2O did the cells start showing signs of instability and eventually failure. Also important to mention is that both cracks (in VPS cell 1 and 2) were on the side of the fuel inlet pipe right where the gases are coming to the inside of the cell.
VPS cell 3
VPS cell 3 was the only cell tested successfully in electrolysis for 290 hours. Many things were changed and improved for the testing of this cell (bubbler, sealing). Also the new sealing material proved to be effective. During its use, good OCVs were obtained and they endured the whole testing cycle without breaking or being destroyed. It revealed good adherence to the surfaces of the cell, which helps in the sealing process of the cell. This can be seen by the sealing material residues on the cell borders in Figure 5, which also allows us to see that the cell was properly reduced and the current collectors were glued to the cell. Yet on the hydrogen side a silver colored film was formed between the current collectors and the cell. The reason for the creation of this film is to this moment unknown but it is possible that it might have been created during the time when the bubbler had problems. It allowed for air to go inside the fuel mixture and might have caused a flame close to the electrode.
Figure 5 - VPS cell 3 visual inspection: (a) O2 electrode; (b) H2 electrode – presence of silver colored film
Figure 6 shows the time evolution of voltage during the 337 hours. Cell voltage was 1.07V in the beginning of electrolysis testing and 1.17V just before finishing. During the whole testing period the cell showed a muted degradation (around. 9.3% / 300h) and seemed to have stabilized after 250 hours and even recovered from this degradation in the last hours of testing. This was an unexpected phenomena but it was also reported to happen in the journal article by Hauch. A. (Hauch A. E., 2008). According to this
(a)(b)
8
report, their tested SOEC usually suffer from an initial passivation4 effect in the first hundreds of hours, followed by an activation5 effect. They also report that this is due to the presence of silica in the sealing material, which fits with the sealing used in this cell. So it is thought that this stabilization and recovery might be associated to the type of sealant used.
In the Figure 6, it is also possible to see an obvious erratic behavior of cell voltage. This was mainly because of fuel flow stability problems. All the Swagelok connections were checked for leaks yet no leak was found. The reason for this erratic flow was not found but it was suspected that one of the mass flow controllers was not working properly. Also, the fact that the silver wires for voltage and current taps were going inside the piping might have helped this erratic behavior.
Figure 6 – VPS 3 voltage vs time: 0,1875 A/cm2 @ 175 sccm H2 + 175 sccm H2O; 800 ºC
During the testing period four IV curves were taken: two in fuel cell mode and two in electrolysis mode. Unfortunately, due to the air bottle running out without being noticed, it was not possible to take any IV curves in fuel cell mode after the 300 hours of testing. The first IV curve was done at 250 sccm H2 and showed satisfactory performance, giving a peak power of 0.325 W/cm2 at 0,65 V and a ASR of 0.76 Ωcm2. Afterwards, the fuel mixture was changed to 175 sccm H2 / 175 sccm H2O and the second IV was performed. OCV was lowered, as should be expected, but the ASR was also lowered to 0.59 Ωcm2. The maximum power obtained was 0.317 W/cm2, not reaching peak power, i.e., this value could be higher. Higher current densities were not tested due to instability of the flow. These two IV curves are shown in Figure 7.
4Passivationisareversibleorpartlyreversiblelossinperformancefromthecell.5 Activation is the recovery of cell performance.
After finishing the second IV curve the cell was switched to electrolysis mode and another IV curve was performed. OCV match was observed between the two IV curves (0.935 V), demonstrating continuity between fuel cell and electrolysis modes. This is shown in Figure 8. This first electrolysis curve showed an ASR of 0.83 Ωcm2 and fairly decent performance. The cell was left at 0.19 A/cm2 for a period of 290h. Afterwards another IV curve was done. Only taking into account the linear part of the curve, after long term electrolysis testing, the cell had an ASR around 0.89 Ωcm2, which shows that the cell did not undergo much degradation. Unfortunately this last IV cannot be fully compared to the previous one since the air tank was empty and no air was flowing through the cell. Attempts to run IV curves in fuel cell mode were done but obviously they were unsuccessful. The cell was consequently shut down and left to cool down running on forming gas.
Figure 8 - VPS 3 fuel cell / electrolysis initial and electrolysis final IV curves: 175 sccm H2 + 175 sccm H2O @ 800 ºC
Scanning Electron Microscopy (SEM)
Firstly, a cell to be used as reference had to established, to create a comparison point between virgin and tested cells. For this purpose, a previous VPS cell was used as a reference cell since it was put to the test stand, reduced and not tested. Figure 9 a)
10
allows us to see the four layers that form the cell, while (b) and (c), show the oxygen electrode and hydrogen electrode respectively.
Figure 9 - SEM reference cell: a) profile; b) oxygen electrode; c) hydrogen electrode
Previous to this work, another VPS cell was tested successfully at the Colorado Fuel Cell Center and traces of lanthanum zirconates were reported, this being the reason for this experimental study. This cell was run for 310h hours at 0.25 A/cm2. It revealed a much more severe degradation than VPS cell 3. Its voltage went from 1.24V at four hours of testing to 1.47 V after 310 hours. After disassembly, the O2 electrode delaminated from the electrolyte and was found to be well adhered to the silver current collectors. A visual inspection showed no irregularities in the H2 electrode.
SEM pictures of this cell were taken and are shown in Figure 10 and Figure 11. Looking at picture Figure 10 a) it is clear that no oxygen electrode is present. When looking at the surface, where this electrode should be, a completely different microstructure from that of the reference cell is found. Also, the microstructure of the delaminated electrode (Figure 11) is different from the reference cell.
What is curious about both of these surfaces is that both of them have two different microstructures in them: where there was platinum paste on top (area inside red square (c)); and where there was no platinum paste (b). Where there was platinum paste the surface is smoother, while in the other area a much rougher microstructure is present, showing what looked like crystalline spikes. Finally, the microstructure of the H2 electrode (Figure 10 (c)) had much bigger grains than the reference cell.
Figure 10 - SEM of old cell: a) profile; b) no oxygen electrode; c) hydrogen electrode
(a) (b) (c)
(a) (b) (c)
11
Figure 11 - SEM of the two zones present in the delaminated oxygen electrode
It is evident that the old VPS cell suffered a huge degradation. The hydrogen electrode had much larger grains, reducing the triple phase boundary (TPB) area available and consequently reducing its performance. Even more evident is the delaminated electrode that perfectly detached itself from the electrolyte. When analyzed it displayed different microstructural areas, as was said before. The reason for this is surely the presence or absence of platinum paste, but it still does not explain why one surface has a rough microstructure and the other one does not. This might have occurred due to preferential electron flow through the areas where there was platinum paste since it had better electrical connection with the current collectors.
As for VPS cell 3, as stated previously, it was run at a current of 0.1875 A/cm2 in electrolysis mode for a period of 290h, during which time no delamination occurred. Looking at Figure 12, the SEM pictures of the profile and electrode surfaces are very similar to the reference cell. Only the H2 electrode showed a slightly higher concentration of areas without grains but this could be observed-area dependant. The fact that the microstructure showed almost no changes when compared to the reference cell goes well with the data from the electrical tests performed in the cell.
Figure 12 - SEM of VPS cell 3: a) profile; b) oxygen electrode; c) hydrogen electrode
X-ray diffraction (XRD)
The X-Ray Diffraction results for LZO show that there are two 100% intensity peaks at 2*Theta6 angles of 28,86º and 47,65º, and one of 90% intensity at 56,55º. With this in mind, all XRD graphs have three lines have placed where the peaks for LZO should be present. The oxygen electrode or interface between this and the electrolyte were the targets of the XRD measurements.
6 Theta is the angle between the incident X-Ray beam and the plane of the analyzed sample, thus, 2*Theta is the angle between the X-Ray tube and the detector.
(b) (c) (b) (c) (c)
(a) (b) (c)
12
When XRD was done in the old cell in the summer of 2008, before these experiments, the presence of lanthanum zirconates in the cell was suspected. XRD, performed this time, showed no evidence of this compound neither on the cell nor on the delaminated electrode as can be seen in Figure 13 and Figure 14, respectively. No signs of this compound were found in VPS cell 3 either (Figure 15)
Figure 13 - XRD of old VPS cell
Figure 14 - XRD of old VPS cell delaminated electrode
Figure 15 - XRD of VPS cell 3
Conclusions
In summary, this was not a successful experiment in the sense that what was looked for was not found. The presence of lanthanum zirconates was reported in the previous report from the VPS cells, which leads to the possibility that these insulating phases formed locally and under the areas where there was platinum paste. This might explain why it was found in one XRD measurement and not on the other. As a future
13
experiment, small pieces of the areas that had platinum or not could be examined separately to confirm this.
But if seen from another point of view, it was successful since in three months a new packaging method was developed, one VPS cell was tested for 300h and could have operated longer if more time was available.
Acknowledgements
I would like to thank Ph.D. candidate Darrell Eldridge for all the time and patience he had with me and also for the instructional and interesting discussions we had. He taught me how to set up the cells, how to actually test them and also what I should expect from the cell testing. I am also very grateful to Dr. Sullivan for allowing me to do my thesis in the CFCC and for all the guidance and support given during my time there. In addition, I would like to thank my Portuguese advisor, Dr. Rui Neto, for all the help with the reformulation and improvement of the thesis done at IST.
I would also like to thank Ph.D. candidate Connor Moyer for supplying the cells used for my first tests and for the tests done when developing the new sealing system and everyone at the CFCC who helped me in one way or the other; Lastly, everyone from RES for all the hard work they put into making it a successful school and for providing the funding to do this investigation.
References
Brant et. al. (2006) M.C. Brant, T. Matencio, L. Dessemond, R.Z. Domingues, Electrical degradation of porous and dense LSM/YSZ interface, Solid State Ionics, 177, (2006) 915-921.
Brisse et. al. (2008) A. Brisse, J. Schefold, M. Zahid, High Temperature Water Electrolysis in Solid Oxide Cells, International Journal of Hydrogen Energy, 33, (2008) 5375-5382.
Chen & Jiang (2011) K. Chen, S.P. Jiang, Failure mechanism of (La,Sr)MnO3 oxygen electrodes of solid oxide electrolysis cells. Internation Journal of Hydrogen Energy , 36, 10541-10549.
Chervin et. al. (2004) C. Chervin, R.S. Glass, S.M. Kauzlarich, Chemical degradation of LSM/YSZ composite cathodes in the presence of current collector pastes, Solid State Ionics, 176, (2005) 17-23.
Chou & Stevenson (2006) Y.S. Chou, J.W. Stevenson, Compressive Mica Seals for Solid Oxide Fuel Cells, Journal of Materials Engineering and Performance, 15 (4), (2006) 414-421.
Eguchi et. al. (1996) K. Eguchi, T. Hatagishi, H. Arai, Power generation and steam electrolysis characteristics of an electrochemical cell with a zirconia- or ceria-based electrolyte. Solid State Ionics, 86-88, (1996) 1245-1249.
Etsell and Flengas (1970) T.H. Etsell, S.N. Flengas, Electrical properties of solid oxide electrolytes, Chemical Reviews. 70, 339 , 70 (3), (1970) 339–376.
Guan et. al. (2006) J. Guan, N. Minh, B. Ramamurthi, J. Ruud, J.K. Hong, P. Riley, D. Weng, High performance flexible reversible solid oxide fuel cell, Torrance, CA: GE Global Research Center, 2006.
14
Hauch et. al. (2008) A. Hauch, S.D. Ebbesen, S.H. Jensen, M. Mogensen, Solid Oxide Electrolysis Cells: Microstructure and Degradation of the Ni/Yttria-Stabilized Zirconia Electrode, Journal of The Electrochemical Society, 155 (11), (2008) 1184-1193.
Hauch (2007) A. Hauch, Solid oxide electrolysis cells - Performance and durability, Roskilde: Riso National Laboratory, Technical University of Denmark, 2007.
Hauch et. al. (2010) A. Hauch, M. Mogensen, A. Hagen, Ni/YSZ electrode degradation studied by impedance spectroscopy - Effect of p(H2O). Solid State Ionics , 192, (2010) 547-551.
Ishihara & Kanno (2010) T. Ishihara, T. Kanno, Steam electrolysis using LaGaO3 based perovskite electrolyte for recovery of unused heat energy. ISIJ International , 50, (2010) 1291-1295.
Jin & Lu (2011) T. Jin, K. Lu, Surface and interface behaviors of (La0.8SrO.2)MnO3 air electrode for solid oxide cells. Journal of Power Sciences , 196, (2011) 8331-8339.
Kim-Lohsoontorn et. al. (2010) P. Kim-Lohsoontorn, N. Laosiripojana, J. Bae, Performance of SOEC having bi-layered electrolyte during steam electrolysis and carbon dioxide electrolysis. Current Applied Physics , (2010) s223-s228.
Labrincha et. al. (1993) J. Labrincha, J. Frade, F. Marques, La2Zr2O7 formed at ceramic electrode/YSZ contacts. Journal of Material Science , 28, (1993) 3809-3815.
Laguna-Bercero et. al. (2009) M.A. Laguna-Bercero, S.J. Skinner, J.A. Kilner, Performance of solid oxide electrolysis cells based on scandia stabilised zirconia. Journal of Power Sources , 192, (2009) 126-131.
Laguna-Bercero (2012) M. Laguna-Bercero, Recent advances in high temperature electrolysis using solid oxide fuel cells: A review. Journal of Power Sources , 213, (2012) 4-16.
Liang et. al. (2009) M. Liang, B. Yu, M. Wen, J. Chen, J. Xu, Y. Zhai, Preparation of LSM-YSZ composite powder for anode of solid oxide electrolysis cell and its activation mechanism. Journal of Power Sources , 190, (2009) 341-345.
Mahapatra & Lu (2010) M. Mahapatra, K. Lu, Glass-based seals for solid oxide fuel and electrolyzer cells – A review. Materials Science and Engineering R , 67, (2010) 65-85.
Malzbender et. al. (2012) J. Malzbender, P. Batfalsky, R. Vaßen, V. Shemet, F. Tietz, Component interactions after long-term operation of an SOFC stack with LSM cathode. Journal of Power Sciences , 201, (2012) 196-203.
Mitterdorfer and Gauckler (1998), A. Mitterdorfer, L.J. Gauckler, LaZrO formation and oxygen reduction kinetics of the LSM/YSZ system, Solid State Ionics, 111, (1998) 185–218.
Ni et. al. (2008) M. Ni, M.H. Leung, D.C. Leung, Technological development of hydrogen production by solid oxide electrolyzer cell (SOEC), International Journal of Hydrogen Energy, 33, (2008) 2337-2354.
O'Brien et. al. (2009) J.E. O'Brien, M.G. McKellar, E.A. Harvego, C.M. Stoots, High temperature electrolysis for large-scale hydrogen and syngas production from nuclear energy - summary of system simulation and economic analysis. International Journal of Hydrogen Energy , 35, (2009) 4808-4819.
O'Hayre et. al. (2006) R. O'Hayre, S.W. Cha, W.Colella, F.B. Prinz, Fuel Cell Fundamentals, New Jersey: John Wiley & Sons, Inc., 2006.
Pure Project, http://www.pure.shetland.co.uk/html/pure_project1.html, 14/01/2009
15
Róg and Kozlowska-Róg (2002) G. Róg, A. Kozlowska-Róg, Determination of the standard molar Gibbs energy of formation of lanthanum zirconate by a galvanic cell involving lanthanum beta-alumina electrolyte, Journal of Chemical Thermodynamics, 34, (2002) 1311-1315.
Sohal et. al. (2012) M.S. Sohal, J.E. O'Brien, C.M. Stoots, Degradation Issues in Solid Oxide Cells during High Temperature Electrolysis. Journal of Fuel Cell Science and Technology , 9, (2012) 011017-(1 - 10).
Tejuca and Fierro (1993) L.G. Tejuca, J.L.G. Fierro, Properties and applications of perovskite-type oxides. New York: Dekker, 1993.
Toshiba Corporation, Power Systems Company. (2008). Hydrogen production by high temperature electrolysis with nuclear reactor. Progress in Nuclear Energy , 50, (2008) 422-426.
Virkar (2010) A.V. Virkar, Mechanism of oxygen electrode delamination in solid oxide electrolyzer cells. International Journal of Hydrogen Energy , 35, (2010) 9527-9543.
Yang & Irvine (2008) X. Yang, J. T. Irvine, (La0.75Sr0.25)0.95Mn0.5Cr0.5O3 as the cathode of solid oxide electrolysis cells for high temperature hydrogen production from steam. Journal of Materials Chemistry , 18, (2008) 2349-2354.
Yokokawa et. al. (1990) H.Yokokawa, N. Sakai, T. Kawada, M. Dokiya, Thermodynamic analysis on interface between perovskite electrode and YSZ electrolyte. Solid State Ionics , 40/41, (1990) 398-401.
Yoo et. al. (2009) J. Yoo, S.-K. Woo, J.H. Yu, S. Lee, G.W. Park, La0.8Sr0.2MnO3 and (Mn1.5Co1.5)O4 double layer coated by electrophoretic deposition on Crofer22 APU for SOEC interconnect applications. International Journal of Hydrogen Energy , 34, (2009) 1542-1547.
Zhang et. al. (2012) W. Zhang, B. Yu, J. Xu, Efficiency evaluation of high temperature steam electrolytic systems coupled with different nuclear reactors. International Journal of Hydrogen Energy , (2012) 1-9.
Zhu et. al. (2006) B. Zu, I. Albinsson, C. Andersson, K. Borsand, M. Nilsson, B.-E. Mellander, Electrolysis studies based on ceria-based composites. Electrochemistry Communications , 8, 495-498.