Forth Replacement Crossing Forth Road Bridge Feasibility of Multi-modal Corridor Report on Study August to October 2008 No part of this report may be copied or reproduced by any means without prior written permission from Jacobs Arup – Jacobs UK Limited and Ove Arup & Partners International Limited Consortium. If you have received this report in error, please destroy all copies in your possession or control and notify Jacobs Arup. This report has been prepared for the exclusive use of the commissioning party and unless otherwise agreed in writing by Jacobs Arup, no other party may use, make use of or rely on the contents of this report. No liability is accepted by Jacobs Arup for any use of this report, other than for the purposes for which it was originally prepared and provided. Opinions and information provided in the report are on the basis of Jacobs Arup using due skill, care and diligence in the preparation of the same and no warranty is provided as to their accuracy. It should be noted and it is expressly stated that no independent verification of any of the documents or information supplied to Jacobs Arup has been made.
Transcript
Forth Replacement Crossing Forth Road Bridge Feasibility of Multi-modal Corridor Report on Study August to October 2008
No part of this report may be copied or reproduced by any means without prior written permission from Jacobs Arup – Jacobs UK Limited and Ove Arup & Partners International Limited Consortium. If you have received this report in error, please destroy all copies in your possession or control and notify Jacobs Arup. This report has been prepared for the exclusive use of the commissioning party and unless otherwise agreed in writing by Jacobs Arup, no other party may use, make use of or rely on the contents of this report. No liability is accepted by Jacobs Arup for any use of this report, other than for the purposes for which it was originally prepared and provided. Opinions and information provided in the report are on the basis of Jacobs Arup using due skill, care and diligence in the preparation of the same and no warranty is provided as to their accuracy. It should be noted and it is expressly stated that no independent verification of any of the documents or information supplied to Jacobs Arup has been made.
Content s
Bibliography and Workstream Timeline 1
1 Introduction 2
1.1 Introduction 2
1.2 Scope of this report 2
1.3 Limitations 2
1.4 Functional Definitions 2
1.5 Analytical Studies 3
2 Description of the Existing Bridge 4
2.1 General Arrangement 4
2.2 Original Functionality 4
2.3 Main Bridge Deck System and Articulation 4
2.4 Towers 6
3 Loading 7
3.1 Design (1964) Dead Loading 7
3.2 Design (1964) Traffic and Pedestrian Loading 7
3.3 Design (1964) Environmental Loading 8
3.4 Traffic Loading for the Study 8
3.5 Footway/Cycleway Loading 9
3.6 Design Traffic and Footway Loading 9
3.7 Railway Live Loading 10
3.8 Dead Loading Associated with the Railway 10
4 Tram and Light Railway Issues 11
4.1 Definitions 11
4.2 Tram and Light Railway Functional Characteristics 12
4.3 Rail System 15
4.4 Derailment Containment 16
4.5 Emergency and Maintenance Walkways 16
4.6 Parapets and Barriers 16
5 Conceptual Options 17
5.1 Assumed Fundamental Constraints 17
5.2 Measures to Mitigate Load Changes 17
5.3 Functional Constraints 17
5.4 Particular Measures 18
5.5 Catalogue of Functional Options for the Main Bridge 19
5.6 Main Bridge – Changes in Dead Load 19
5.7 Approach Spans – Changes in Dead Load 20
5.8 Summary – Changes in Dead Load 20
6 Response of Bridge to Changes in Loading 21
6.1 Methodology 21
6.2 Analytical Study 21
6.3 Comparison of Various Loading Patterns 21
6.4 Transverse Behaviour 27
6.5 Approach Viaducts 28
7 The Rail Movement Joint 29
7.1 The issue 29
7.2 Evidence of Other Existing Bridges 29
7.3 Conclusion 30
8 Conclusions 31
8.1 Summary 31
8.2 Recommendations 31
8.3 Ongoing study 31
Appendix A - Drawings
Appendix B - References
FRB LRT Feasibility Feb 09 Issue 1
Bibliography and Workstream Timeline
As highlighted below, this is the fifth of a series of reports which cover the project development work carried out during 2008, following completion of the Forth Replacement Crossing Study during 2007.
Ref Report Title and Work Period Report synopsis
1. Forth Replacement Crossing Study Report 5: Final Report
Work pre-June 2007.
Report on work undertaken by Jacobs and Faber Maunsell to June 2007 to assess the options for a replacement crossing which recommended that a cable stayed bridge in ‘Corridor D’ – a crossing point immediately upstream of the Forth Road Bridge - be taken forward as the best overall performing option.
Work carried out by Jacobs Arup, January to May 2008.
Report to assess 9 mainline connecting road corridors: three in the Northern Study Area and six in the Southern Study Area. It recommended that two of the northern and two of the southern corridor options be taken forward for further assessment.
Work carried out by Jacobs Arup, May to August 2008.
Report on the assessment of the shortlisted corridor options and a supplementary assessment of a variant version of a connecting road corridor in the Southern Study Area. The report recommended that work continue to identify in detail the optimum road improvement within Corridor Option 1 North and Corridor Option 1 South.
4. Forth Replacement Crossing, Main Crossing (Bridge) Scheme Assessment Report, Development of Options:
Work carried out by Jacobs Arup, January to August 2008.
Report on the assessment of options for the outline design of the replacement crossing.
5. Forth Road Bridge – Feasibility of Multi-Modal Corridor:
Work carried out by Jacobs Arup, August to October 2008.
Report on the feasibility of utilising the existing Forth Road Bridge for non motorised and public transport/light road traffic, including for a potential future guided bus/tram/ light rail facility. The report concluded that this would be a feasible option.
6. Forth Road Bridge - Audit of Feasibility of Future Multi-Modal Use - Summary Report
Work carried out by Faber Maunsell to November 2008
Independent summary of review on the Jacobs-Arup assessment of the feasibility of utilising the existing Forth Road Bridge for non motorised and public transport/light road traffic, including for a potential future guided bus/tram/ light rail facility. The report concluded that the Forth Road Bridge could, in principle, be adapted for future LRT
7. Forth Replacement Crossing, Main Crossing (Bridge) Scheme Assessment Report, Development of D2M Alternatives:
Work carried out by Jacobs Arup, October to November 2008.
Report on the assessment of options for a narrower replacement crossing to carry a dual carriageway road with hard shoulders.
Work carried out by Jacobs Arup, July to November 2008
The final report on the project planning work carried out during 2008 which provides recommendations of the road connections and the incorporation of the Forth Road Bridge as an integral element of the proposals for use by pedestrians, cyclists, public transport and any future multi-modal facility.
FRB LRT Feasibility Feb 09 Issue 2
1 Introduction
1.1 Introduction
The existing Forth Road Bridge (FRB) forms a key link in Scotland’s transport network. The crossing currently carries some 66,000 vehicles per day which includes over 70 percent of travellers across the three Forth bridges (Kincardine, Forth Road Bridge and Forth Rail Bridge). In 2007, the Scottish Ministers announced that a Replacement Forth Crossing would be promoted by the Scottish Government. Previous work undertaken by Transport Scotland included consideration of alternative corridors and structures for the Replacement Forth Crossing and on 19 December 2007, the Scottish Ministers announced that the Replacement Forth Crossing would cross the Firth of Forth immediately upstream of the existing Forth Road Bridge and would be a cable-stayed bridge. The Jacobs-Arup commission is for the management and delivery of the Replacement Forth Crossing Project inclusive of all roads and other infrastructure associated with such a structure. Recent investigations of the cables of the existing bridge have indicated that the working life of the bridge, given the current level of traffic demand, may be longer than projected at the time of the commission. A 'twin bridge strategy' could, therefore, be advantageous.
A 'twin bridge strategy' envisages that the existing Forth Road Bridge has a useful ongoing potential and may, therefore, be included in the functional strategy for the construction of a new Forth Bridge. The existing bridge may potentially be considered to carry any of the following functions:
• A reduced volume of unrestricted road traffic
• Light road traffic, excluding heavy vehicles
• Pedestrian / cycle traffic.
• Light rail / tram traffic.
This report reviews the structural implications of this proposal.
The report has been prepared by Arup on behalf of the Jacobs Arup Joint Venture with support from Flint & Neill, and draws upon information that is within the public domain. In draft form, it was audited by Faber Maunsell. This process is recorded in the separate report “Forth Road Bridge - Audit of Feasibility of Future Multi-Modal Use – Summary Report”, by Faber Maunsell, issued as Revision 4, third issue on 27/11/2008. The two reports should therefore be read in conjunction with each other.
1.2 Scope of this report
The feasibility of possible structural options available to accommodate various reconfiguration strategies is considered. The discussion is generally limited to the physical arrangement of the deck system and consideration of the bridge articulation. The analysis of the main girders, suspension system, towers and foundations are excluded at present from the review - except by simple comparison with estimated actions for the current status quo. The premise of this report is, therefore, 'are any of the proposals likely to make the present state worse?'.
1.3 Limitations
1.3.1 On General Loading
It is known that the existing bridge has been calculated to have a reduced design capacity in the main cables. Intervention in the form of cable dehumidification is presently under way. This report has been prepared on the basis that the dehumidification halts the deterioration in the cable such that the global factors of safety remain acceptable. It is assumed, therefore, that the effects resulting from the general level of static loading on the bridge should not be increased, and in some areas (such as main cable tension) a decrease would be desirable.
1.3.2 On Permanent Applied Loading
As far as possible, it is preferable that the current geometric state of the bridge under permanent loading be maintained. Thus refurbishment schemes should, as far as possible, attempt to maintain equality with the current level of permanently applied dead and superimposed dead loading.
1.3.3 On Aerodynamic Loading
The bridge, as designed, features three vent areas in the deck surface. In order to maintain the present aerodynamic performance these vent areas should be maintained. The aerodynamic performance is also sensitive to detailed cross section changes; this will have to be kept in mind when considering any changes to parapets or barriers.
1.4 Functional Definitions
1.4.1 Unrestricted Vehicular Road Traffic (four or two lanes)
Previous studies (see Ref 3 in Appendix B) have been carried out based on the actual traffic moving across the bridge and a Bridge Specific Assessment Live Loading (BSALL) developed. This BSALL is based on four lanes of unrestricted road traffic on the bridge.
As part of this study, traffic load models have been derived to give an indication of the intensity of load if only 2 lanes of traffic (one in each direction) were permitted along the bridge.
Traffic models that are based on traffic flow without any restriction being placed on different vehicle types is referred to as 'all inclusive' in this report.
1.4.2 Restricted Vehicular Road Traffic (four or two lanes)
A number of strategic options may be considered in which, for instance, only high occupancy vehicles and/or buses were permitted to use the bridge. The intensity of loading associated with this type of restriction has been characterised as being associated with vehicles having only two axles. This is a reasonable characteristic to enforce as it may be tested by a simple visual inspection of vehicles.
Whilst some modern bus and coach types, may have twin back axles (i.e. 3 axle rigid configuration), the total loading per metre length of bridge associated with this type is not believed to be necessarily any larger than the loading associated with twin axle types.
Approximate traffic models have been derived to give an indication of the intensity for this type of load as applied to both 4 and 2 lane operation.
This data, which relates to 'restricted' or 'reduced' traffic flow, is also referred to as 'two axles' in this report.
FRB LRT Feasibility Feb 09 Issue 3
1.4.3 Pedestrian and Cycle Traffic
The existing bridge currently carries unrestricted pedestrian and cycle traffic. It is assumed that this situation will be maintained. There does not appear to be any corroborative data for the intensity of pedestrian and cycle traffic currently using the bridge. However, in recent assessment work it is understood that a total load of 0.3 kN/m has been allowed (regardless of loaded length) in combination with the BSALL vehicular loading. This represents around 1000 people distributed along the bridge at one time. This study assumes that the same assumptions may be applied in comparison between various options.
1.4.4 Light Rail/Tramway Traffic (twin or single tracks)
The distinction between light railways and tramways is a little obscure. The Office of Rail Regulation (ORR) recommends that a tramway system which is completely isolated from pedestrian and vehicle access is better treated as a railway for the purposes of planning and safe operation.
In this study, the two types of traffic are considered interchangeable in terms of loading on the bridge. However, one important requirement for a tramway is that the power delivery system must be isolated from the public. This is traditionally achieved using an Overhead Live Electrification (OLE) system and associated catenary support masts. An isolated light railway, on the other hand, may also utilise systems such as a third rail which does not require a catenary support structure. Thus in the report, a distinction is made where space for an OLE system is included in the functional arrangement.
1.5 Anal ytical Studies
In order to carry out this initial feasibility work, a preliminary two dimensional analytical model for studying the global behaviour of the bridge has been set up. This model has been based on some basic survey data on the existing bridge but mainly upon data given in the original ICE report published just after construction (See Reference 1 in Appendix B). It is known that some strengthening work and modifications have been made since opening the bridge. The major change is the addition of a new prestressed strut in the centre of each tower leg - which has little effect on bending stiffness. It may be assumed that these modifications do not materially affect the global static behaviour within the scope of the objectives of this study.
The behaviour of the model in respect of deflections, rotations and moments in the girders under the original BS 153 loading have been compared with the results given in the ICE report. Good agreement with these values was achieved for the vertical loading conditions considered. Further analyses will be necessary (using the current construction information) to be able to confirm the effects of twisting and lateral loading. However, it is not anticipated that this will alter the conclusions of this report.
FRB LRT Feasibility Feb 09 Issue 4
2 Description of the Existing Bridge
2.1 General Arrangement
The General Arrangement of the existing bridge is, in general, taken from the Jacobs / Faber Maunsell drawing (see Ref 7 in Appendix B). There are some minor variations between this drawing and the account given in the ICE report (see Ref 1 in Appendix B). Extracts from this drawing, supplemented by data from the ICE report, follows with the key dimensions assumed in this study.
Key dimensions in elevation:
Spans:
Main Span: 1006 m
Side span: 408 m
Towers:
Height of tower above base: 150.0 m (taken from ICE report p.339)
Cables:
Elevation on Tower Cable IP: 156.100 m
Elevation on Side Span Cable IP: 47.900 m
Elevation on Mid-Span Cable IP: 64.700 m
Height of cable in main span: 91.4 m (given as 90.5 in ICE report p.379)
Height of cable in side span: 108.2 m
Sag of Cable in main span: 91.4 m (given as 90.5 in ICE report p.379)
Sag of Cable in side span: 20.3 m (taken from ICE report p.379)
Hangers:
Length of centre hanger in main span: 2.44 m (taken from ICE report p.379)
Deck:
Elevation on centre line of truss at tower: 53.4 m (approx)
2.2 Original Functionality
The existing layout comprises two carriageways of 24'0" (7.3 m) and two footways / cycle tracks of 15'3" (4.65 m) width across the entire bridge.
On the main bridge, there is a 10'0" (3.05 m) median and the carriageway and footway are separated by 14'9" (4.5 m) to accommodate the towers and suspension cable system.
An air gap separates the footways from the carriageways. The carriageways are also separated by an air gap below the median, which is covered by an open grillage structure for safety.
On the approach viaducts the median remains at 10'0" (3.05 m) but the verge between the carriageway and footway is reduced from 14'9" (4.5 m), at the side span towers, to 5'0" (1.525 m) beyond. This transition is believed to take place within one span of the approach viaducts.
2.3 Main Bridge Deck System and Articulation
The deck system of the main bridge is separated into two distinct parts: the primary support and the deck systems.
2.3.1 Primary System
The primary support system consists of two parallel continuous warren type trusses with a nominal panel length of 60'0" (18.124 m - figures in brackets taken from reference 1). The truss is supported at the ends of each panel by cable hangers clamped to the main suspension cables. The truss is 27'6" (8.382 m) in depth on the centres of the top and bottom chords. The trusses, and their suspension system, are 78'0" (23.774 m) centre to centre in plan. Diagonal bracing in plan is provided to both top and bottom planes. Additional lateral bracing members are provided to the top plane coincident with the deck cross frame elements. The rectangular truss forms a box system designed to carry bending and shear in both vertical and horizontal planes as well as torsion about its longitudinal axis.
FRB LRT Feasibility Feb 09 Issue 5
2.3.2 Deck System
Cross girders, and their associated frames, are at nominal centres of approximately 30'0" (9.062 m). The cross girders span transversely onto the vertical posts of the truss. These frames, in turn, support the road way and footway panels, which span longitudinally between cross frames. The deck system is of the non participating type. i.e. It is designed to carry only its own weight and local loads applied to it - it does not participate in the global behaviour of the main truss. The road way panels span longitudinally between the cross frames with joints every second frame offset from the frame by approximately 5'0" (1.524 m). The footway panels, which also span longitudinally, are jointed at every frame with the joints lying above the frame.
The deck panels are stiffened plates (trough type stiffeners) in the main span and reinforced concrete slabs in the side spans. The footway panels are stiffened plates (flat type stiffeners) throughout. In all cases longitudinal steel stringers transfer the loads to the cross beams.
The road panels were originally surfaced with 1½ " (38 mm) of asphaltic type surfacing. The footway panels were protected by a thin rubber bitumen coating. It is assumed that the current surfacing components are similar and of the same weight.
The deck features three longitudinal air gaps The first separates the two carriageways along the median. The other two separate each footway from the carriageway. The ICE paper mentions that these slots are required for aerodynamic stability and it is assumed, therefore, that they should be maintained.
2.3.3 Articulation
The road decks are provided with local movement joints at approximately 60 feet intervals. The footways are jointed every 30 feet, approximately. In this way the local expansion/ contraction of the deck is effectively isolated from that of the main truss.
The main truss has movement joints at the side span piers (referred to as 'towers' in the ICE report) and at both sides of both main span towers. The joints at the main towers permit longitudinal movement along with rotation in elevation and plan. Those at the side span piers allow only rotation in both elevation and plan.
The vertical restraint to the truss at the main towers is provided by pendulum links which connect the lower chords of the main truss to brackets attached to the side faces of the towers. These links are designed to carry both tension and compression forces and thus cater for normal reactions, uplift and torsion.
Lateral restraint at the main towers is provided via a bearing connected to the last cross frame of the girders and, via diagonal bracings, to the cross frame at the tower. This bearing also permits longitudinal movement between the girders and the towers. At the side span piers, a similar centralised pin exists - but in this case longitudinal movement is restrained.
(a) Carriageway Movement Joints to the Main Towers
The main truss frames terminate either side of the main towers. The end cross frames of each of the side and main spans are at approximately 28'8" (8.74 m) centre to centre. A transom beam connects the two legs of the towers transversely. This beam supports a frame system in plan which provides lateral restraint to the main girders. A space of approximately 8.1 m longitudinally by 2.1 m deep is available below the existing carriageways to accommodate the 'Demag' joint system. This is illustrated in the following sketch extracted from Fig 2.25 of the ICE paper. It is believed that these joints are due for replacement following over 40 years of service.
FRB LRT Feasibility Feb 09 Issue 6
(b) Carriageway Movement Joint at the Side Piers
More conventional carriageway 'metal comb type' movement joints are provided at the end of the side spans to allow for the small movements at deck level that result from rotation of the girders.
2.4 Tow ers
The tower section at deck level is 2.895 m (9' 6") wide on the main box section, which is symmetrical about the cable plane, and 3.657 m (12' 0") overall on the stiffening rib. Thus, from the cable plane, the tower extends laterally 1.45 m on the outer side and 2.21 m on the inner (traffic face) side.
FRB LRT Feasibility Feb 09 Issue 7
3 Loading
3.1 Design (1964) Dead Loading
Current details of the bridge, and any subsequent modifications, are not available at this time. The loading applied in the original design is assumed to be reasonably indicative of the present condition. The following design dead loads are given in Table 2.5 (p.380) of the ICE report:
Item Main Span
(kN/m)
Side Span
(kN/m)
Cables, hangers and associated details 38.8 39.9
Trusses, laterals and cross girders 48.2 45.0
Road way deck steel 31.1 11.0
Road way deck concrete 0 76.9
Road way deck mastic 14.6 15.6
Cycle and footway deck steel 11.4 11.7
Cycle and footway deck rubber/bitumen 1.0 1.0
Parapets, barriers, grillages 4.8 4.8
Drainage gullies and downpipes 0.4 0.4
Electric power, telephone cables 1.0 1.0
Zinc spraying and painting 2.1 2.1
Total dead load 153.4 209.4
For the purposes of this study, the following breakdown of main span dead load is assumed:
Road way deck = 2.13 kN/m². }
Roadway surfacing = 1.00 kN/m² } Based on 2 x 7.3 m of roadway
Footway deck = 1.22 kN/m² } and 2 x 4.7 m of footway
Footway surfacing = 0.10 kN/m² }
It is assumed that the breakdown of load between parapets, barriers and grillages is as follows:
It is further assumed that the two footway cantilever brackets weigh approximately 1/3 rd of the footways @ 4.2 kN/m
3.2 Design (1964) Traffic and Pedestrian Loading
The bridge was designed to carry B.S.153 Part 3: 1954 loading comprising of HA UDL and KEL, footway load and 45 units of HB load. The cycle tracks were assumed to carry half that specified for
footway loading. HA UDL + KEL was applied in full to two lanes and 1/3 rd to the other two lanes. Thus, a total of 2 and 2/3 rd lanes were applied plus KEL's. In the HB plus HA combinations, one full carriageway of HA was replaced by the HB vehicle.
The application of the design HA + footway + cycleway loading is summarised (in terms of the lane load W) in the following figure taken from the ICE report:
FRB LRT Feasibility Feb 09 Issue 8
The distribution of W with length was approximately as follows:
Loaded Length
(m)
Lane Load W
(1 lane)
(kN/m)
Total Traffic Load
(4 lanes)
(kN/m)
Total Load
(4 lanes+Foot+Cycle)
(kN/m)
(x1.0) (x 2.66) (x 3.43)
100 16.5 43.9 56.6
200 13.1 34.9 45.0
300 10.7 28.5 36.7
408 9.2 24.5 31.6
1006 5.9 15.7 20.2
1414 5.9 15.7 20.2
1823 5.9 15.7 20.2
3.3 Design (1964) Environmental Loading
3.3.1 Temperature Range
According to the ICE report, the bridge was designed to accommodate the following range of temperature:
20 deg C + 16.7 / - 33.3 deg C (50 degree C range).
3.3.2 Wind Load
The design wind speed was 110 mile/hr (49.2 m/s) at deck level. (see p 377 of the ICE report for loads derived from this base wind speed). It is believed that this was for a 3 sec gust (to be confirmed).
3.4 Traffic Loading for the Study
3.4.1 Design Code Loading Regimes
(a) Original and current British Standard Loading
The original design was checked for B.S.153 Part 3: 1954 loading and included both HA and HB types. At the time of design, the HA UDL in lane 1 was between one half (short loaded lengths) and a third (long loaded lengths) of current BS design loading. The KEL was similar to current BS loading, at 120 kN. The following graph extracted from Reference 2 (See Appendix B) illustrates the variation in the UDL lane loading:
The definition of HB was similar to current definition. The bridge was designed for 45 units of type HB, i.e. a 1800 kN vehicle. The vehicle was assumed to occupy one lane without accompanying HA load in the same lane.
The application of loading is described in some detail in the ICE report, an extract from which is given above. In general it was assumed that 2.66 lanes (= 1.0 + 1.0 + 0.33 + 0.33) would apply.
In comparison, BD37 loading is assumed to be 2.87 lanes (= 1.0 + 0.67 + 0.6 + 0.6). Thus, both intensity and number of loaded lanes considered has increased.
(b) Current Eurocode Loading (UK NA)
The UK NA version of the Eurocode loading is 5.5 kN/m² between barriers regardless of loaded length, or width. Tandem axle loads of 600, 400 and 200 kN would be applied in three of the notional lanes.
(c) Reduced Eurocode Loading for 'Controlled' use
Eurocode LM1 loading includes an adjustment factor αq which may be used to define a controlled (reduced) loading regime. The reduction factor is αq1 = 0.8 in cases where lighter loading is anticipated, but not controlled. The factor is used to reduce the lane 1 loading of 9.0 kN/m² to 7.2 kN/m². Lane 1 will be 3.0 m nominal width. All other areas are loaded at 2.5 kN/m². This is the minimum reduced case recommended by the Eurocode unless traffic control (i.e. signing etc) is employed - so a further reduction is possible for this bridge under a controlled traffic regime.
(d) Application of Design Code Loading
The above current code intensities are useful for comparison purposes. However, given the nature of the state of the existing bridge and history of assessments based on actual traffic flow, it is not considered desirable to consider any of the above loading conditions in the comparative study. The study will, therefore, proceed on the basis of the Bridge Specific Assessment Live Loading (BSALL).
FRB LRT Feasibility Feb 09 Issue 9
3.4.2 BSALL Loading on Four Lanes
A significant amount of work has been carried out in recent years to estimate the actual road traffic loading on the bridge. This work, covered in detail elsewhere, is not reported further here. (See references 3 and 4 in Appendix B). For the purpose of this study, the following assumptions regarding application of this loading have been made:
i) Unless noted otherwise below, the loading is applied in accordance with BD37/01.
ii) The intensity of the nominal (unfactored) BSALL UDL is as follows:
Loaded Length
(m)
Nominal BSALL
UDL Lane Loading
(kN/m)
100 20.3
200 16.7
300 15.2
408 14.3
1006 12.8
1414 12.5
1823 12.4
Note: nominal loads are equivalent to loads having a 2400 year return period divided by approximately 1.2
iii) The lane reduction factors are as follows:
Lane 1: 1.00
Lane 2: 0.67
Lane 3: 0.33
Lane 4: 0.33
iv) The nominal KEL is 120 kN
v) Footway loading is assumed to be 0.3 kN/m for all loaded lengths
3.4.3 BSALL Loading for other patterns of Lanes
Previous BSALL's used in assessment of the Forth Road Bridge were derived in 1985, 2002 and 2005. The most recent publicly available BSALL was derived in 2006. This was based on three weeks of traffic data recorded in late August and early September of that year. This was deemed to be a 'neutral' period (i.e. no public holidays or especially adverse weather). It avoided lane closures, and previous BSALL's had been derived from data recorded at the same time of year (which allowed trends to be identified).
Further BSALL’s have been estimated using typical UK vehicular traffic data. They represent three possible traffic operating scenarios. All are considered to be safe-sided, and might be somewhat reduced if current Forth Bridge traffic data were to be obtained and analysed. :
a) 2 lanes of unrestricted traffic*
b) 4 lanes of traffic restricted to twin-axle vehicles **
c) 2 lanes of traffic restricted to twin-axle vehicles
* Scenarios for future usage may include this case, but it is not considered further in this report..
** The 4 lane case is to be considered for design, if BS5400 were to be the relevant specification document. BS 5400 (BD37/01) requires that two notional lanes be considered for carriageways having a width of 5.00 top 7.50 m. However, for the purpose of comparison in this study, item c is used.
The results of the study are reported in the section on design loading below. 3.5 Footw ay/Cycleway Loading
It is understood that recent assessments used 0.3 kN/m total loading; this figure has been adopted.
3.6 Design Traffic and Footway Loading
The nominal (unfactored) loads for use in this study to compare various options are summarised in the following table.
Nominal Design Loads 1, 2, 3 :
Loaded
Length
(m)
1964 design:
4 lanes
All inclusive
(kN/m)
BSALL:
4 lanes
All inclusive
(kN/m)
BSALL:
2 lanes 4
All inclusive
(kN/m)
BSALL:
4 lanes 4
Max two axles
(kN/m)
BSALL:
2 lanes 4, 5
Max two axles
(kN/m)
100 56.6 47.3 30 19 17 -15
200 45.0 38.8 28 19 17 - 12
400 31.6 33.3 27 19 16 - 12
1000 20.2 29.8 26 19 13 - 12
1400 20.2 29.1 25 19 13 - 12
1800 20.2 28.8 25 18 12
Notes:
1. Footpath load included in all cases.
2. In 1964 design, footpath load was approximately 29% of the traffic loading.
3. In BSALL loads footpath loading is assumed to be 0.3 kN/m regardless of loaded length.
4. 2 lane BSALL and 2 axle BSALL are more approximate than the 'all inclusive' values.
5. The range reflects the approximation. The higher figure has been used in this report.
FRB LRT Feasibility Feb 09 Issue 10
3.7 Railway Live Loading
3.7.1 General intensity of loading
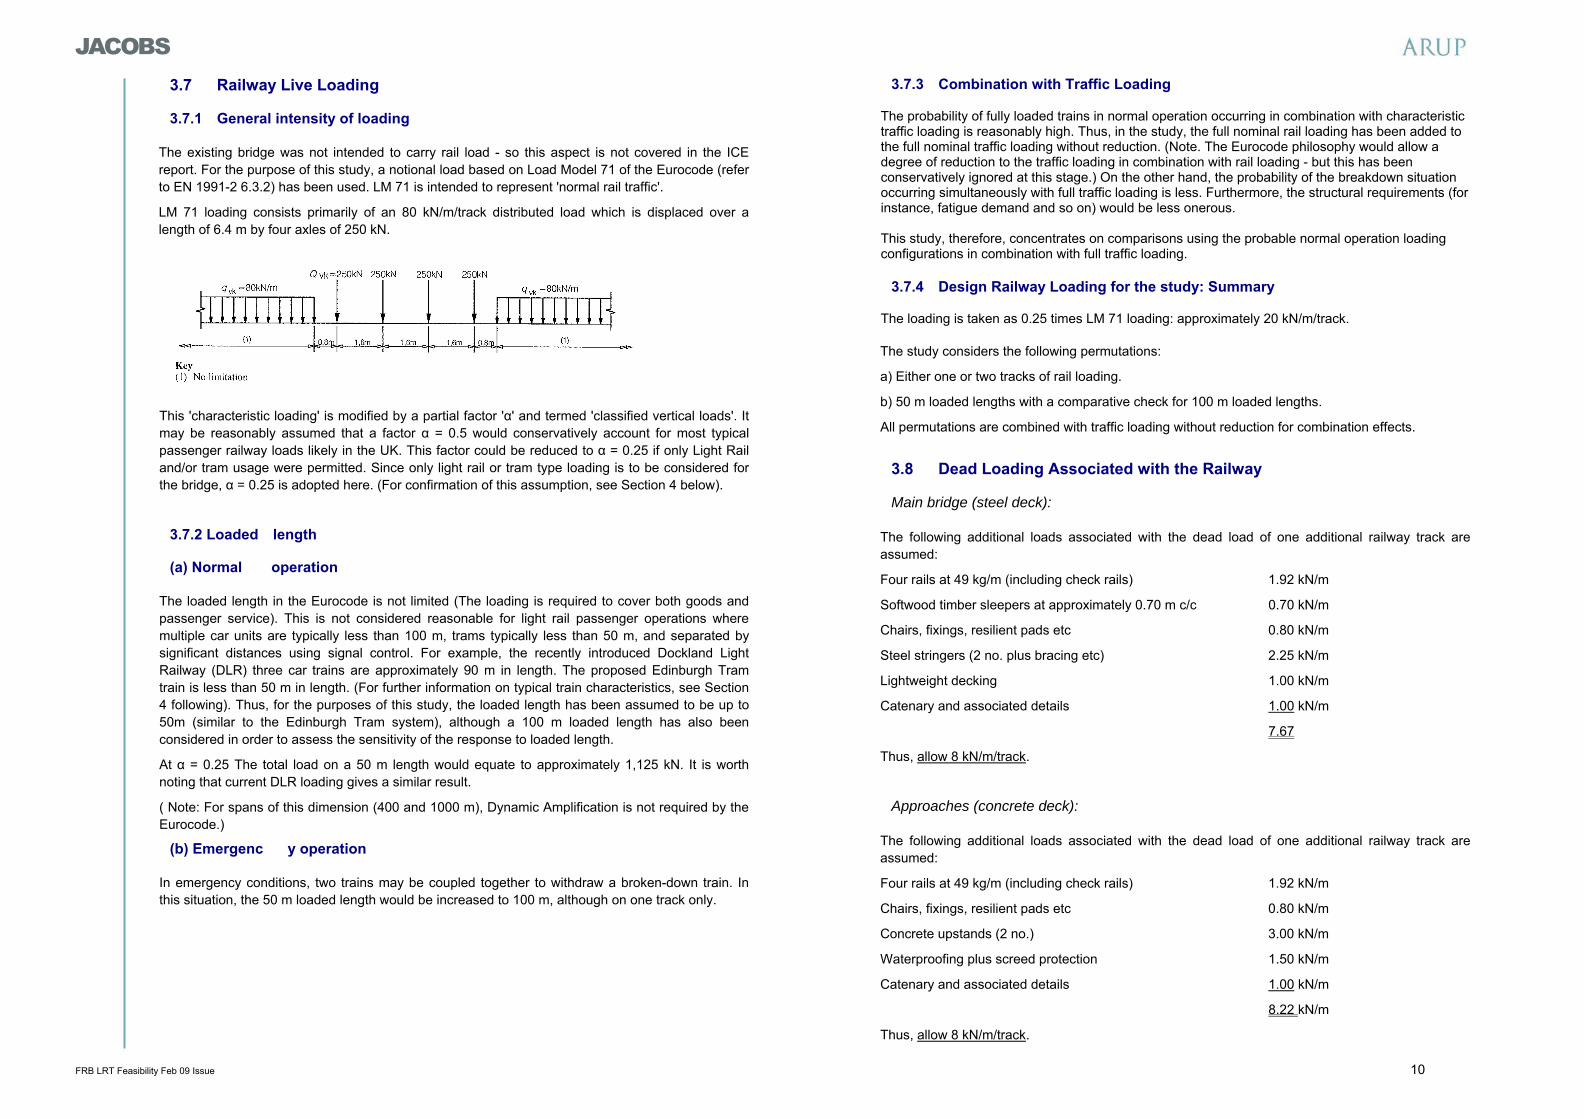
The existing bridge was not intended to carry rail load - so this aspect is not covered in the ICE report. For the purpose of this study, a notional load based on Load Model 71 of the Eurocode (refer to EN 1991-2 6.3.2) has been used. LM 71 is intended to represent 'normal rail traffic'.
LM 71 loading consists primarily of an 80 kN/m/track distributed load which is displaced over a length of 6.4 m by four axles of 250 kN.
This 'characteristic loading' is modified by a partial factor 'α' and termed 'classified vertical loads'. It may be reasonably assumed that a factor α = 0.5 would conservatively account for most typical passenger railway loads likely in the UK. This factor could be reduced to α = 0.25 if only Light Rail and/or tram usage were permitted. Since only light rail or tram type loading is to be considered for the bridge, α = 0.25 is adopted here. (For confirmation of this assumption, see Section 4 below).
3.7.2 Loaded length
(a) Normal operation
The loaded length in the Eurocode is not limited (The loading is required to cover both goods and passenger service). This is not considered reasonable for light rail passenger operations where multiple car units are typically less than 100 m, trams typically less than 50 m, and separated by significant distances using signal control. For example, the recently introduced Dockland Light Railway (DLR) three car trains are approximately 90 m in length. The proposed Edinburgh Tram train is less than 50 m in length. (For further information on typical train characteristics, see Section 4 following). Thus, for the purposes of this study, the loaded length has been assumed to be up to 50m (similar to the Edinburgh Tram system), although a 100 m loaded length has also been considered in order to assess the sensitivity of the response to loaded length.
At α = 0.25 The total load on a 50 m length would equate to approximately 1,125 kN. It is worth noting that current DLR loading gives a similar result.
( Note: For spans of this dimension (400 and 1000 m), Dynamic Amplification is not required by the Eurocode.)
(b) Emergenc y operation
In emergency conditions, two trains may be coupled together to withdraw a broken-down train. In this situation, the 50 m loaded length would be increased to 100 m, although on one track only.
3.7.3 Combination with Traffic Loading
The probability of fully loaded trains in normal operation occurring in combination with characteristic traffic loading is reasonably high. Thus, in the study, the full nominal rail loading has been added to the full nominal traffic loading without reduction. (Note. The Eurocode philosophy would allow a degree of reduction to the traffic loading in combination with rail loading - but this has been conservatively ignored at this stage.) On the other hand, the probability of the breakdown situation occurring simultaneously with full traffic loading is less. Furthermore, the structural requirements (for instance, fatigue demand and so on) would be less onerous. This study, therefore, concentrates on comparisons using the probable normal operation loading configurations in combination with full traffic loading.
3.7.4 Design Railway Loading for the study: Summary
The loading is taken as 0.25 times LM 71 loading: approximately 20 kN/m/track. The study considers the following permutations:
a) Either one or two tracks of rail loading.
b) 50 m loaded lengths with a comparative check for 100 m loaded lengths.
All permutations are combined with traffic loading without reduction for combination effects.
3.8 Dead Loading Associated with the Railway
Main bridge (steel deck):
The following additional loads associated with the dead load of one additional railway track are assumed:
Four rails at 49 kg/m (including check rails) 1.92 kN/m
Softwood timber sleepers at approximately 0.70 m c/c 0.70 kN/m
Chairs, fixings, resilient pads etc 0.80 kN/m
Steel stringers (2 no. plus bracing etc) 2.25 kN/m
Lightweight decking 1.00 kN/m
Catenary and associated details 1.00 kN/m
7.67
Thus, allow 8 kN/m/track.
Approaches (concrete deck):
The following additional loads associated with the dead load of one additional railway track are assumed:
Four rails at 49 kg/m (including check rails) 1.92 kN/m
Chairs, fixings, resilient pads etc 0.80 kN/m
Concrete upstands (2 no.) 3.00 kN/m
Waterproofing plus screed protection 1.50 kN/m
Catenary and associated details 1.00 kN/m
8.22 kN/m
Thus, allow 8 kN/m/track.
FRB LRT Feasibility Feb 09 Issue 11
4 Tram and Light Railway Issues
4.1 Definitions
In the context of this study, two categories of passenger train are defined: Light Railways and Tramways. Generally, tram systems operate in a mixed traffic environment (road / rail / pedestrian) and are required to operate safely at speeds for which driver braking is acceptable. Light Rail systems are generally segregated. Segregation permits higher operating speeds using signal control and automatic braking systems. Tram stock can operate at reasonably high speeds if segregated. For instance, the proposed Edinburgh tram vehicle is capable of 80 km/hr.
Another point of difference is the method of power delivery. Trams are required to operate in proximity to the general public. Their power delivery system must be isolated - generally via an OLE catenary system. Segregated light rail system may also adopt other systems such as third rail electrification (3RE)
The Office of Rail Regulation (ORR) publication Guidance On Tramways (RSP2) defines a 'tramway' as follows:
A system of transport used wholly or mainly for the carriage of passengers, employing parallel rails which provide support and guidance for vehicles carried on flanged wheels, and in respect of which:
(a) the rails are laid in a place to which public have access; and
(b) on any part of the system, the permitted speed of operation of the vehicles is limited to that which enables the driver of any such vehicle to stop it within the distance he can see to be clear ahead ('operation by line-of-sight').
Three 'Categories' are defined. The category required for the Forth Bridge situation is an 'Off-street Tramway' - one wholly segregated from the normal highway. The Guidance goes on to say that:
An entirely off-street tramway ..... may be more appropriately regarded as a railway, in respect of which the guidance contained in RSPG Part 2 Sections A to E is likely to be more relevant.
For this report the following definitions are used:
Tramway : Mixed use environment - driver control - low speed of operation
Light Railway: Segregated environment - signal control - higher speed of operation
FRB LRT Feasibility Feb 09 Issue 12
4.2 Tram and Light Railway Functional Characteristics
4.2.1 Typical system characteristics
Given the lack of code specification for light rail systems, a review of several important light rail / tram systems and their characteristics follows:
(a) Sy stems reviewed
DLR Docklands Light Railway
ET Edinburgh Tram (proposed)
NET Nottingham Express Transit
LUAS LUAS Light Rail Dublin (Section on Spencer Dock Bridge)
TW Tyne and Wear
In addition the following have been reviewed:
RSP2 ORR Guidance on Tramways (Urban Tramways)
RSPG2 ORR Rail Safety Principles and Guidance (Railways)
LU London Underground Maximum for Sub Surface Lines
NR Network Rail
(b) Data summary
(Refer to table on following page)
* The assumption of using DKE to determine clearances is based on straight sections of track. Swept Envelope should also be considered on curved sections
*1 to DKE (Developed Kinematic Envelope)
*2 assuming horizontal track without cant or throw allowance
*3 1.76 m if centre space (900 mm wide) used as a place of safety (430 + 900 +430)
*4 0.15 m from DKE to Structure Gauge
*5 1.13 m from DKE to back of 700 mm footway
*6 add 0.50 for central catenary mast
*7 includes allowance for central catenary mast?
*8 0.60 m with central traction pole
*9 increase by 0.50 m for central traction pole
*10 minimum clearance from DKE to fence line is 0.60 m
*11 where this cannot be achieved, it may be reduced to 0.1m minimum
1.76 m if centre space (900 mm wide) used as a place of safety (430 + 900 +430)
*12 minimum clearance from DKE to structure gauge is 0.25 m and to masts 0.675 m
*13 1.13 m from DKE to back of 700 mm footway
*14 at signal post and other isolated structures
*15 may require refuge areas beyond this for long (>40m) lineside structures
*16 minimum clearance from DKE to structure gauge is 0.83 m
#1 Excluding DAF (dynamic amplification factor)
L Length of multiple unit (No of units)
B / (DKE) Breadth of car / (Developed Kinetic Envelope)
Hc Height of car above rail
Hp Height of pantograph above car
G Track gauge inside of running edges
Smin Centre to centre car spacing, minimum
Cmin Minimum clearance between DKE's
Cmp Minimum clearance to mast post
Wmin Minimum corridor width for two tracks
Wminf Minimum corridor width with foot/maintenance access ways
4.2.2 Clearance Diagrams Applicable to Light Rail Systems from ORR RSPG2
FRB LRT Feasibility Feb 09 Issue 15
4.2.3 Catenary Support
By way of example, the Luas light rail system (Dublin) required poles of 325 mm diameter; height to fixing of 8m and a minimum lateral clearance to traction pole 750 mm to DKE.
4.2.4 Conclusions
(a) Lateral Geometrical Constraints
The following parameters are assumed:
B = 2.65 m (covers all LR systems listed above)
DKE = B + 2 x 0.10 m (on straight section) = 2.85 m minimum
Structure gauge = + 0.15 m from DKE
Minimum Separation = DKE + 0.38
Catenary mast diameter = + 0.35 m (assumed)
Clearance from DKE to mast = 0.675 m
Separation with centre mast = 2 x 0.675 + 0.35 = DKE + 1.70
Separation with centre safety space = 2 x 0.43 + 0.90 = DKE + 1.76
Emergency footway = 0.70 + 0.43 = DKE + 1.13
Thus, the total width required for the light rail would be:
Allow for central mast catenary: - 0.38 + 1.70 = 9.66 m
For single track system:
Absolute minimum: 0.15 + 2.85 + 0.15 = 3.15 m
Allow for refuge on one side: -0.15 + 1.13 = 4.13 m
Allow for side mast catenary: -0.15 + 0.675 + 0.35 + 0.15 = 4.175 m
(b) Loading
The proposed design load of LM71 with α= 0.25, described in the previous section, should cover all of the systems reviewed above.
4.3 Rail System
(a) Main bridge:
For the purpose of this study, conventional rails on timber sleepers sitting on steel stringer beams (similar to that used on the Tagus Bridge), has been assumed:
(b) Approach Viaducts:
For the purposes of this study, conventional concrete plinths along the line of the rails have been assumed. These are likely to present an upper bound to the additional loading demand for railway conversion work.
FRB LRT Feasibility Feb 09 Issue 16
4.4 Derailment Containment
A check-rail system is assumed to provide derailment containment for the present study.
4.5 Emergency and Maintenance Walkways
The sleepers will be decked over with a lightweight grating system which preserves the permeability of the deck yet permits reasonable safe access either in an emergency 'detraining' incident or for routine maintenance.
4.6 Parapets and Barriers
For the purposes of geometric functionality, it is assumed that the road speed is 80 kph. This allows N1 containment (according to the current standards) and a working width W1 of 600 mm or less. This study assumes 600 mm allowance. If high containment parapets are required this width may increase to 1000 mm. Whilst this change will not have a significant effect on the global static behaviour of the bridge, the available width of functional carriageway will, of course, be reduced.
It is worth noting that changes to the parapet system may change the aerodynamic characteristics of the bridge deck. This will have to be considered in subsequent studies.
It is assumed that pedestrians will not have access to the carriageway or railway except in emergency. Parapet height will be 1250 mm minimum (ORR documents).
The design of the parapets will have to incorporate points of entry to the rail corridor to permit entry and exit in an emergency and for routine maintenance.
FRB LRT Feasibility Feb 09 Issue 17
5 Conceptual Options
5.1 Assumed Fundamental Constraints
It is assumed that:
a) No significant structural modifications will be made to the main bridge girders, hangers, suspension cables or tower supports. Modification to the cross girders and deck system is acceptable as these do not form part of the primary bridge system.
b) The aerodynamic properties of the bridge deck shall remain essentially undisturbed. It is preferable that the air vents be maintained at a similar permeability to the present design. However, some encroachment may be permissible. It will be necessary to check that aerodynamic stability criteria are met. (Which could be done by subsequent wind tunnel testing).
c) The articulation of the bridge will be retained.
d) The design life of elements of the bridge, in particular the suspension cables, are currently under review. The exact details of this review are not precisely known to us. It is a prime assumption, therefore, that any modification should attempt to not significantly increase the static load effects beyond those which are currently applicable.
5.2 Measures to Mitigate Load Changes
5.2.1 Static Loads (Permanently Applied Loads and Live Load)
Load increases can be mitigated in several ways:
a) Controlling the traffic on the bridge.
b) Removal of existing structural components and replacing with lightweight elements.
c) Removing / replacing existing live load facilities with alternative facilities
5.2.2 Environmental Loads (Wind and Temperature Loads)
It is presumed that the wind climate will not have changed significantly.
The temperature effects will not have changed significantly from those for which the bridge was designed.
It is, therefore, assumed that the response of the bridge under environmental loads will be similar both before and after any modifications.
5.2.3 Deformatio ns
The most critical deformation is likely to be the rotation (in plan and elevation) of the movement joints at the main towers and abutments - particularly for railway usage.
It may be possible to alter the deck girders in the support regions to make them continuous for moment to reduce rotational displacements at the main joints. A system of piston type shock absorbers could be arranged to permit slow acting thermal movements but restrain short duration live load movements.
For the purpose of this study it is assumed that the articulation should remain as it currently is.
5.3 Functional Constraints
5.3.1 Foot and Cycle Use
There are no known constraints. The existing footways appear to be adequate for the expected pedestrian volumes.
5.3.2 Road Use
Elements of the bridge are known to be deteriorating at a greater rate than originally projected (i.e. when first constructed). Ultimately, for the structure to remain viable, the dehumidification will need to arrest this decline and leave it at an acceptable level. It is possible that in order to increase its useful life, the road traffic usage will have to be reduced - particularly heavy goods vehicle types.
Options which eliminate heavy goods vehicles from the crossing are likely to achieve an improvement in design capacity. In the absence of direct traffic control, say by toll booths, it is difficult to police a sophisticated sifting of the traffic flow. One simple measure, which can be policed, is to limit access only to vehicles which have two axles. This criteria is, therefore, employed in estimating the intensity of load applicable to any change in use relating to banning heavy goods vehicles.
The minimum desirable carriageway width, between barriers, for a single lane of traffic flow is 6.0 m. This width is sufficient to allow passage of vehicles in the event of a breakdown, or other blockage, of the running lane. Provision of a carriageway width less than this would represent a departure from current standards.
5.3.3 Rail Use
The particular issues associated with the design of rail systems on this bridge are as follows:
(a) Geometric:
a) Can one or two tracks be accommodated? A range of different configurations have been considered in the study.
b) Can maintenance / emergency walkways be provided? A maintenance / emergency access can be provided for the configurations considered, but clearly there are a number of ways in which this can be achieved.
c) Can OLE systems be accommodated? This will depend upon the type of power supply system required but some configurations have been illustrated.
(b) Design:
a) Rotation of the girders? Particular attention has been given to determining the level of rotations at the tower movement joints to confirm that they are within acceptable limits. Discontinuity of the deflection line occurs at the movement joints. Can rail joints be designed to accommodate these movements?
b) Fatigue demand from rail traffic? This is a consideration for rail structures. This has not been reviewed in this study, but it is not envisaged to be a critical issue. This will have to be confirmed by further studies.
c) Can the central, or outer, roadway vents be reduced or eliminated? The configurations considered in this report maintain the vents, albeit with some incursions, but the impact of covering them over, totally or partially, is worthy of consideration in further studies.
FRB LRT Feasibility Feb 09 Issue 18
5.4 Particular Measures
5.4.1 Possible reworking of the edge parapet detail
The current edge parapet detail occupies approximately 700 mm of width plus around 150 mm clear to the face of the tower. There is a small opportunity to gain space by modifying this detail to accommodate a modern vehicle parapet system. Approximately 200 mm can be added to each carriageway with this modification. The slight gain in width is unlikely to be justified by the cost of making this modification.
5.4.2 Possible use of the footways to carry railways
The present layout provides for two approximately 4.65 m wide combined footpath and cycle tracks located on lightweight structures outside of the main trusses and outside of the legs of the main towers.
(a) Design Capacity
The original design was made for 4 kN/m2 on the 1.85 m footway and 2 kN/m2 on the 2.75 cycle way, that is: 12.9 kN/m run for the loaded lengths which would apply to the footway or its support brackets. The LR loading will be 20 kN/m with a KEL of, 100 kN plus Dynamic Amplification Factor (DAF) of, say 20%. (based on DLR/Tramway type loading). The support brackets are at 9.1 m (30 ft) centres. The brackets would attract, say, around 130 kN load each. This gives around 370 kN per bracket - approximately 300 % increase in live load.
By inspection, therefore, the supporting structures of these footways cannot carry rail loading should it be considered a functional option. They would require significant strengthening.
(b) Alignment
The alignment of the footpaths is affected by the transition between main bridge and approach viaduct, as seen in the following aerial photograph:
The transition length appears to be inappropriate for light railway use. Extensive modifications would, therefore, be required to the viaduct structures.
(c) Conclusion
This option is not considered further. The layout is presented as drg 071 in Appendix A for reference purposes only.
5.4.3 Possibility to Remove the Outer Footway
It is possible to consider that the footways are entirely removed and relocated either along the current carriageway or diverted onto the Replacement Crossing. The advantages associated with this otherwise loss of benefit, are as follows:
- Reduce the overall loading on the bridge in its current configuration - both dead and live.
- Change the aerodynamic properties of the bridge, which may be favourable.
This option is not pursed further at this stage as it would require major modification to the existing structure.
5.4.4 Possible Single Track Railway Working
The study has considered both twin and single track arrangements.
The possibility of single track working should be considered at this stage, particularly - especially since it is the only configuration which permits the use of a minimum (according to current standards) 6.0 m wide single carriageway with only minimal modification to the existing bridge deck structure. Cross-overs could be provided outside of the abutments to the crossing, which are approximately 2.5 km apart - about 2 - 3 minutes at 50 - 80 kph. This option has, therefore, been reviewed (see below) and presented in drg 021 in Appendix A.
FRB LRT Feasibility Feb 09 Issue 19
5.5 Catalogue of Functional Options for the Main Bridge
The following options are presented (refer to the Appendix for the relevant drawings):
Option Carriageway
(m)
Footway / Cycleway
(m)
Rail track
(no.)
OLE Footway in rail corridor
Drg Ref
0* 2 x 7.30 2 x 4.65 0 n/a n/a FRC/C/052/FRB/001
1 n/a 2 x 4.65 2 yes yes FRC/C/052/FRB/011
2 2 x 6.00 2 x 4.65 1 yes yes FRC/C/052/FRB/021
3 2 x 5.18 2 x 4.65 2 no no FRC/C/052/FRB/031
4 2 x 4.81 2 x 4.65 2 yes no FRC/C/052/FRB/041
5 2 x 4.53 2 x 4.65 2 yes yes FRC/C/052/FRB/051
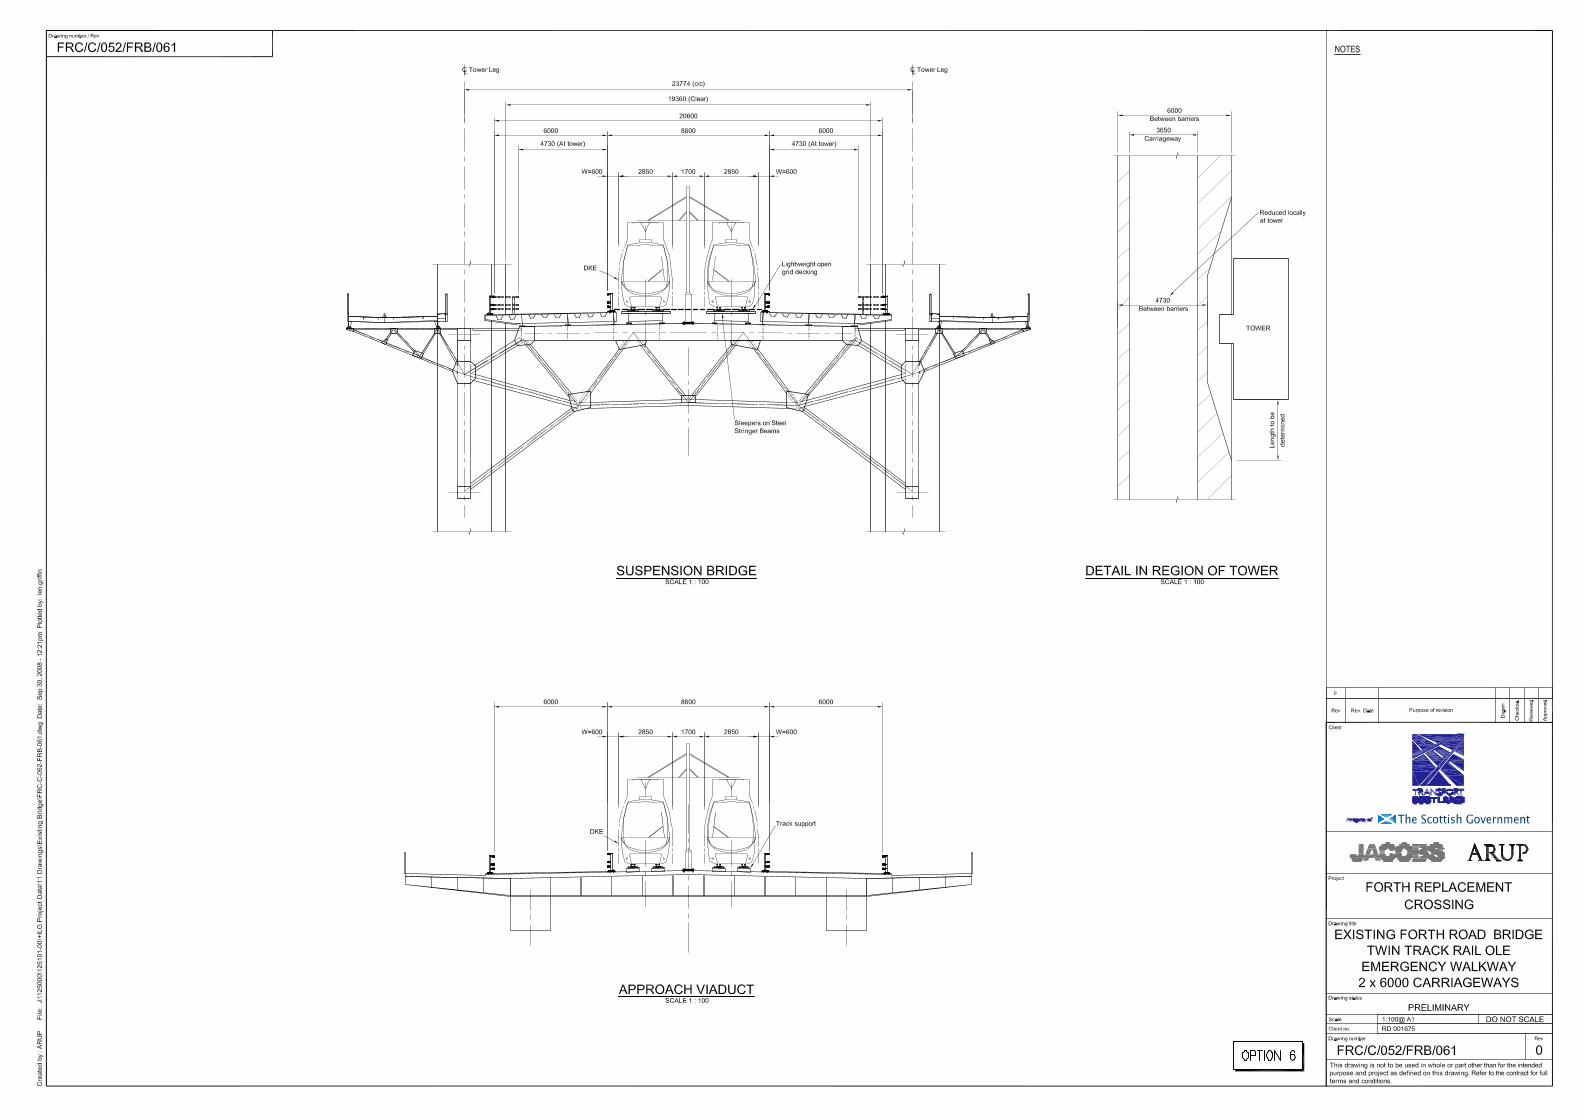
6** 2 x 6.00 2 x 4.65 2 yes yes FRC/C/052/FRB/061
* This option represents the 'do nothing' base case and is used for comparison with the proposed options listed. ** This option does not strictly conform to the restriction on closing off parts of the roadway vents; the 6.00 m carriageway is reduced to 4.73 m at the towers. 5.6 Main Bridge – Changes in Dead Load
(Refer to section 3 for a breakdown of the loading applied).
Remove Add 1 median -11.0 2 track slabs +13.4 2 road barriers -2.0 4 road barriers +4.0 5.6m of road surfacing -5.6 7.6m of waterproofing +4.3 1 verge -3.6 2.92m of road surfacing +2.9 1.46m of footway surfacing -1.5 -23.7kN/m +24.6 kN/m
Net Change
+0.9 kN/m (+0.6% increase in main span)
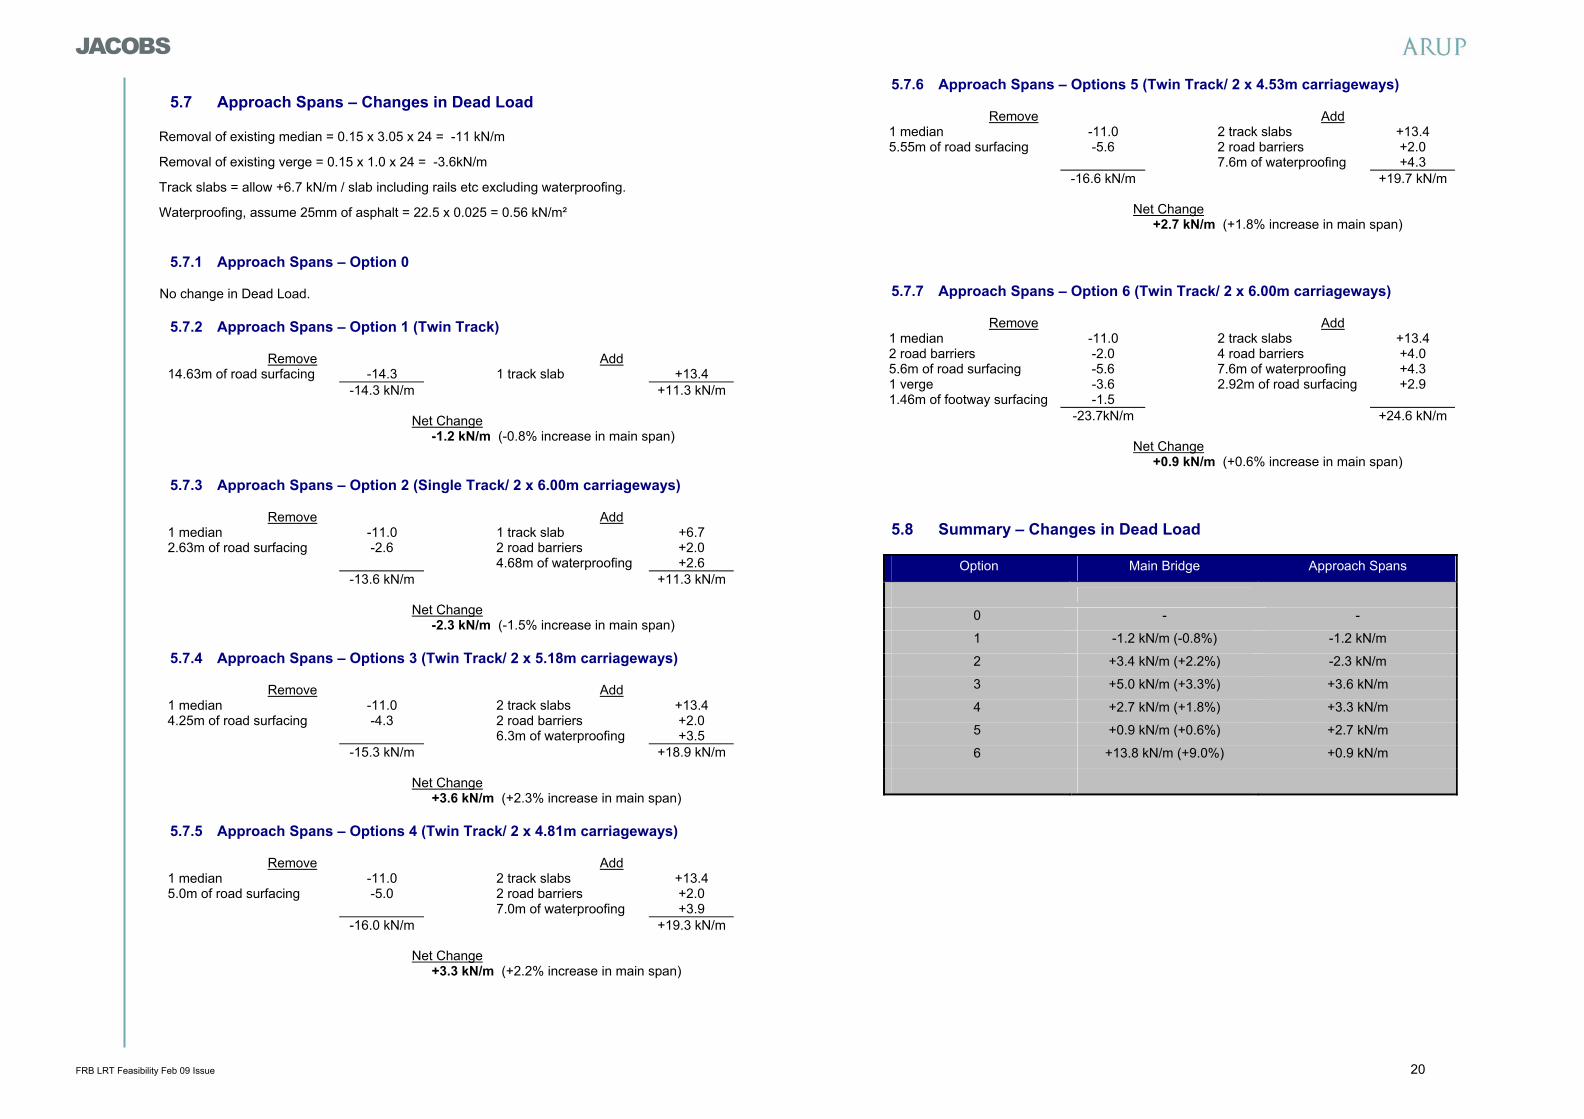
5.8 Summary – Changes in Dead Load
Option Main Bridge Approach Spans
0 - -
1 -1.2 kN/m (-0.8%) -1.2 kN/m
2 +3.4 kN/m (+2.2%) -2.3 kN/m
3 +5.0 kN/m (+3.3%) +3.6 kN/m
4 +2.7 kN/m (+1.8%) +3.3 kN/m
5 +0.9 kN/m (+0.6%) +2.7 kN/m
6 +13.8 kN/m (+9.0%) +0.9 kN/m
FRB LRT Feasibility Feb 09 Issue 21
6 Response of Bridge to Changes in Loading
6.1 Methodology
Details of the current bridge assessment are not available at this time. Thus, in order to make a comparison between the various options it is necessary to assume a base case against which to make comparisons.
The base case is taken as the results of actions on the structure due to 4 lanes of full BSALL traffic plus footway loading.
6.2 Anal ytical Study
An analytical model of the bridge has been set up to determine the response to the various load patterns of the alternatives. The model has been calibrated against the original design reported results (see ICE paper) and found to be reasonably in agreement.
At present, the study has been limited to the effects of changes in vertical load only. Lateral load effects have not changed significantly since construction. Live loads have assumed to be symmetrical - the effect of possible torsional components is discussed below.
6.2.1 Effect of Torsion
The original bridge was designed to carry traffic, footway and cycle loading in accordance with BS153. The analytical decomposition of this load to the main bridge girders is described in the ICE report and summarised in Fig 2.33 on p.376. (reproduced in 3.2 above).
From this diagram it can be seen that for case (i), the total distributed load per feet length of the bridge can be characterised by a vertical load of 3.43 W lb/ft accompanied by a torque of 22.7 W ft-lb/ft. W is the distributed lane load in lb/ft. The load amplification in the more heavily loaded girder is given by the ratio [(3.43/2) + (22.7/78)]/[(3.43/2) = 1.17 i.e. 17%. This represents a conservative upper bound estimate of moment amplification in the girder system as it ignores torsional resistance of the girder and the beneficial effect of the global suspension system. As both the rail loading and the live loading (BSALL reduced) are generally symmetrical load systems, when applied for maximum bending, the effect is likely to be of a small order. However, although likely to be insignificant, this effect should be included in ongoing studies.
6.2.2 Effect of Design Method
The design methodology at the time of construction (1964) was based on the working stress method. This implies an approximate equivalent load factor with respect to minimum yield in steel in the order of 1.60 - 1.70 (approximately confirmed by the allowable working stresses in the ICE report). This is similar to the load factor on live load in BS5400 = 1.1 x 1.5 = 1.65. However BS5400 uses characteristic yield. The minimum value can be assumed to be around 5% lower. Thus, the combined safety factor is 1.65 x 1.05 = 1.73. Clearly, this simple comparison does not hold good for all load cases and load effects - but may be useful in attempting to calibrate the study.
6.3 Comparison of Various Loading Patterns
6.3.1 Comparison with ICE report (ref 1)
The following results have been tabulated for comparison:
1) Original 1964 loading results as reported in the ICE paper.
2) Original 1964 loading results as derived from the current analysis model.
These results are useful for two reasons:
a) They help confirm the validity of the analysis model.
b) They give a useful indication of the original design intent.
6.3.2 Live Load Patterns Considered
For the purpose of this report, the study has been limited to cases in which either one or two rail tracks are provided with footway loading and with or without reduced highway applied to one lane in each direction. This selection is judged sufficient, within the present study, to justify whether or not a multi modal scheme for the bridge is feasible or not.
Option BSALL
All inclusive
BSALL
Restricted
Light Rail
(50 m or 100 m trains)
0 4 lanes n/a n/a
1 n/a n/a 2 tracks
2 n/a 2 lanes * 1 track
3, 4, 5, 6 n/a 2 lanes * 2 tracks
* Note: 4 lanes of loading may be applicable to single lane carriageways when applied as notional lanes in accordance with BS5400. This aspect should be reviewed in subsequent studies.
Results are presented for both 50 and 100 m loaded lengths for the train loading (as defined in 3.7.4 above).
6.3.3 Anal ytical Results Compared
The following analytical results have been extracted for comparison:
1) Bending moments in the main span stiffening truss at the 1/8th points
2) Maximum deflection of the trusses in main and side spans
3) Maximum vertical slope changes at the tower and side span joints
4) Maximum combined vertical slope change across the tower joints.
In addition, the effect of additional dead load and dead load plus live load, on the main suspension cable tension has been reported.
FRB LRT Feasibility Feb 09 Issue 22
(a) Comparison between ICE report and Current analysis
Maximum bending in mainspan stiffening truss (kNm)
Location BS153 BS5153
along 1964 1964
main IC E Current
span Report Analysis
1/8 span 133770 123111
1/4 span 121932 114107
1/2 span 117880 103490
Maximum truss deflection (m)
BS153 BS153
Location 1964 1964
ICE Current
Report Analysis
Main span 3.29 3.09 Side span 2.38 2.48
Maximum vertical change of slope and direction (radians) due to live load bending
BS153 BS153
Location 1964 1964
ICE Current
Report Analysis
Main span 0.019 0.019
at towers
Side span -0.020 -0.022
main tower
Side span 0.020 0.019
side tower
Maximum main cable tensions (kN)
BS153 BS153
Condition 1964 1964
ICE Current
Report Analysis
DL 121100 116300
DL+LL 135350 129450
FRB LRT Feasibility Feb 09 Issue 23
(b) Results for 50 m train loading cases
Maximum live load bending in mainspan stiffening truss (kNm)
Main span 0.029 0.019 0.024 0.030 = 3 = 3 = 3 at towers (+3%)
FRB LRT Feasibility Feb 09 Issue 27
6.3.4 Review and Conclusions
(a) Bending in the girder
The single track schemes show decreased live load girder moments for 50 m and 100 m trains. For the twin track schemes with traffic 50 m long trains show only nominal increased moments, but 100 m trains show noticeable increased moments - the significance of which requires review in ongoing studies. Based on bending in the girder, single track options appear to be viable whilst twin track options may also be considered if the train length is limited to 50 m as proposed. (b) Deflection
All schemes show a reduction in deflection relative to the BSALL base design. Based on deflections, all options could be studied further. (c) Rotations
All options show rotations that are similar or less than the BSALL results. Based on rotations, all options could be studied further. (d) Cable tension
All schemes, excluding Option 6, show a decrease in cable tension under combined dead load plus live load. In the case of Option 6, the increase is only 2% and 1%, respectively, for the 100 m and 50 m length train conditions. Based on the cables tension, all options could be studied further. 6.4 Transverse Behaviour
It is understood (ICE Report - ref 1) that the bridge was designed to carry 45 units of HB loading in combination with HA loading. The HB vehicle weights 1800 kN and a single HB axle load carries 450 kN. This is significantly higher than the axle loads associated with a light rail or tram system.
In order to make a qualitative comparison between the various options, the bending moment effects on a typical transverse frame have been determined for the original HB loading. These are plotted in the figure 'Case 0' following. Given that it is believed that the plate thicknesses do not vary along the length, it is reasonable to assume that the capacity of the top transverse beam will not be less than the peak value as shown.
Three other cases, Options 2, 3 and 1 are compared for reference. In all cases, four lanes of restricted BSALL traffic loading have been modelled to reflect the possibility of a local break down (for instance). The rail loads have also been increased using a Dynamic Amplification Factor of 1.20.
It can be seen that there is a reasonable certainty that the transverse beams (assuming that they still have a similar level of integrity as originally intended) are capable of carrying the LRT loads proposed.
Combination 1: Reference Design: DL + HB45 units + HA (to BS153- 1964)
The spans of the approach viaducts vary between 34 and 54 m in length. Details of the construction are sketchy. However, we can compare for each option the change in dead load due to the reconfiguration combined with the live load as an indicator of the likely effect.
The smallest loaded length of the adjusted BSALL available at present is for 100 m. This should give a fair comparison of the maximum sagging and minimum hogging demands on the girders compared to the base loading case (4 lanes of BSALL all inclusive + footpath). The comparison considers two lanes of the reduced BSALL UDL plus footpath loading in association with one or two tracks of railway UDL. The KEL's have been excluded for simplicity.
Option BSALL
All inclusive
BSALL
Restricted
Light Rail Change in Dead Load
(kN/m)
Live Load
(kN/m)
Relative Total
(kN/m)
0 4 lanes n/a n/a 0.0 47.3
47.3
(base)
1 n/a n/a 2 track -1.2 40.0
38.8
(82%)
2 n/a 2 lanes 1 track -2.3 37.7
35.4
(75%)
3 n/a 2 lanes 2 tracks +3.6 57.7 61.3
(130%)
4 n/a 2 lanes 2 tracks +3.3 57.7 61.0
(129%)
5 n/a 2 lanes 2 tracks +2.7 57.7 60.4
(128%)
6 n/a 2 lanes 2 tracks +0.9 57.7
58.6
(123%)
The % ratio in the last column is a fair indication of the relative load effects before and after based on the current assessment loading. Note: It does not factor in the initial dead load which is not known at present. If we assume, for instance that the original dead load is in the order of 300 kN/m (250 kg/sq.m of steel work, 0.25 concrete deck plus, say, 50 kN/m for the superimposed load) then the total increase for option 3 is (300 + 61.3) / (300 + 47.3) = 4% Thus: for the worst case, the total increase in load is less than 5%. This simple comparison indicates that, at worst, some minor strengthening and modification of the viaduct structures for live load effects may be required for the twin track options with highway loading, but this would need to be confirmed against a more detailed assessment when the details of the as-built construction are established. Single track options, or those without traffic should not require strengthening.
FRB LRT Feasibility Feb 09 Issue 29
7 The Rail Movement Joint
7.1 The issue
The largest movement joint on the Forth Road Bridge (footway to main span) is described in the ICE report as providing for 6 ft (1830 mm of longitudinal movement). It is understood that this includes allowance for plan rotation as well as vertical rotation and axial movement components.
With the original design loading, the joint at the main towers was required to accept, in addition, around 0.044 rads (0.022 main + 0.022 side) in elevation and 0.033 rads (0.028 main + 0.005 side) in plan.
Additional study work has indicated that the rotations may be in a similar order for Light Rail operations.
Whilst the rotations are tolerable for road traffic, they require a special joint for railway use. There is around 8 m of space available to account for this change in slope.
7.2 Evidence of Other Existing Bridges
A useful summary table is contained in the East Corridor HCT report (ref 5 in the appendix), to which is here appended the predicted Forth Bridge values:
Movement I-90 Bridge Tagus Bridge Sky Train Bridge Forth Bridge
Longitudinal
displacement 1250 mm 3050 mm 670 mm 2130 mm *
Horizontal
rotation +/- 0.019 rads not known not known +/-0.033 rads**
*Estimated. A figure of 6 ft (1830 mm) is quoted in the ICE report and is assumed to be the total range of movement at the main span side at the outer edge of the footway. An allowance for side span movement (mainly thermal plus deck rotation) has been added to this figure. It is understood that the ICE figure includes allowance for plan rotation as well as vertical rotation and axial movement components. The rail joints, which are located close to the centre of the bridge, are not as sensitive to the axial effect resulting from plan rotations.
** Based on ICE report
*** Lower figure for single track; higher figure for twin track rail loading
This comparison indicates that the order of magnitude of axial movement and rotation required can be achieved with a rail joint system. At the Tagus Bridge, approximately 8.5 m between joints on the main bridge and approach span was available. A similar space is available at the Forth bridge - so a solution seems entirely possible.
The Forth Joint and Tagus Joint are compared in the following diagrams:
Forth Joint: approximately 8.7 m space available
Tagus Joint: approximately 8.5 m space provided
FRB LRT Feasibility Feb 09 Issue 30
7.3 Conclusio n
Sufficient space is available to accommodate the joint. Existing precedent, particularly that of the Tagus bridge, would indicate that the technical issues associated with a rail movement joint can all be addressed. The joint would require development and testing in the normal way - but is entirely feasible.
FRB LRT Feasibility Feb 09 Issue 31
8 Conclusions
8.1 Summar y
The comparison has been made comparing the actions under BSALL and rail loading.
1. For the purpose of this report, the study has been limited to cases in which either one or two rail tracks are provided with footway loading, and with or without reduced highway applied to one lane in each direction. This selection is judged sufficient, within the present study, to justify whether or not a multi modal scheme for the bridge is feasible or not.
2. Whilst all of the proposed options are geometrically viable, only two of the options (2 and 6) can be classified as complying fully with the ideal of a single carriageway width of 6.0 m minimum. These are the single track option of DRG 021 and the twin track option of DRG 061. The latter option does, however, infringe on the outer air vent spaces and requires a reduction in width locally at the main towers.
3. Under dead plus live load combinations, the cable tension for all the options is less when compared to the BSALL base case, except for Option 6 which shows a nominal increase of 2%.
4. The bridge girders are sensitive to the short loaded lengths associated with train loading. The single track options are generally acceptable, but the twin track options with traffic indicate larger increases in girder moments. However, twin track options appear viable with shorter train lengths operating in conjunction with the reduced traffic configuration.
5. For the options studied, only the twin track options show any increase in load for the approach viaducts and even in these cases less than 5% increase is projected. It is likely therefore, that at worst only minor strengthening work will be required to the approach viaduct for the options presented.
6. Modification will have to be made to the movement joints, in particular those located at the main towers. Evidence exists (Tagus Bridge) that indicates a solution will be feasible in the space available. The joint would require development and testing in the normal way - but is entirely feasible.
8.2 Recommendations
1. All of the Options 1 to 6 presented have a positive potential and should be studied further.
2. The performance of the bridge is sensitive to the intensity of railway/ tram loading that is to be accommodated. Early consideration should, therefore, be given to specifying the type and characteristics of the light rail / tram vehicles that are anticipated to be employed on the bridge. It is tentatively recommended that an upper load intensity of 20 kN/m length, be considered. This is broadly consistent with many of the current light rail specifications in the UK. Lighter loads may be applicable for tram type loading.
3. The performance of the bridge is sensitive to the length of railway/ tram loading that is to be accommodated. Early consideration should, therefore, be given to specifying the type and characteristics of the light rail / tram vehicles that are anticipated to be employed on the bridge. It is tentatively recommended that a 50 m length, similar to that proposed for the Edinburgh Tram system, and others in the UK, be considered.
4. The present study is limited to a comparison of the effects of actions on the bridge under proposed changes of loading relative to the effects of actions under the current BSALL loading. An early understanding of the actual capacities of the bridge elements is therefore necessary.
5. A review of the requirement for 6.0 m width carriageway should be made accepting a possibility of narrow carriageways. This may unlock the other alternative options presented.
6. Additional studies should also investigate the possibility of using unrestricted traffic or twin lanes in a breakdown condition in combination with the various rail scenarios.
. 8.3 Ongoing study
The following topics should be considered for review in subsequent studies:
1. Obtain as built / modified bridge details.
2. Review assessment reports for current state of bridge and the assessment loading when available to indentify the critical members based on actual rather than relative capacity.
3. Draw up a project specific design statement to cover rail and road loading and ongoing assessment methodology.
4. Further study of the rail joints to be carried out. In particular, accommodation in the space available.