40
Technical Report UMTRI-2012-35 December, 2012 Forward Collision Warning Modality and Content: A Summary of Human Factors Experiments Heejin Jeong and Paul Green

Technical Report UMTRI-2012-35 December, 2012
Forward Collision Warning
Modality and Content: A Summary of
Human Factors Experiments
Heejin Jeong and Paul Green

ii
iii
Technical Report Documentation Page 1. Report No.
UMTRI-2012-35 2. Government Accession No.
3. Recipient’s Catalog No.
4. Title and Subtitle
Forward Collision Warning Modality and Content: A Summary of Human Factors Studies
5. Report Date
December 2012
6. Performing Organization Code
account 347271 7. Author(s)
Heejin Jeong and Paul Green 8. Performing Organization Report No.
project grant N013007 9. Performing Organization Name and Address
The University of Michigan Transportation Research Institute (UMTRI) 2901 Baxter Rd, Ann Arbor, Michigan 48109-2150 USA
10. Work Unit no. (TRAIS)
11. Contract or Grant No.
DRDA
12. Sponsoring Agency Name and Address
Nissan Technical Center North America Nissan Motor Co., Ltd. 39001 Sunrise Drive Farmington Hills, Michigan 48333-920 USA
13. Type of Report and Period Covered
April, 2011 – December 2012 14. Sponsoring Agency Code
15. Supplementary Notes
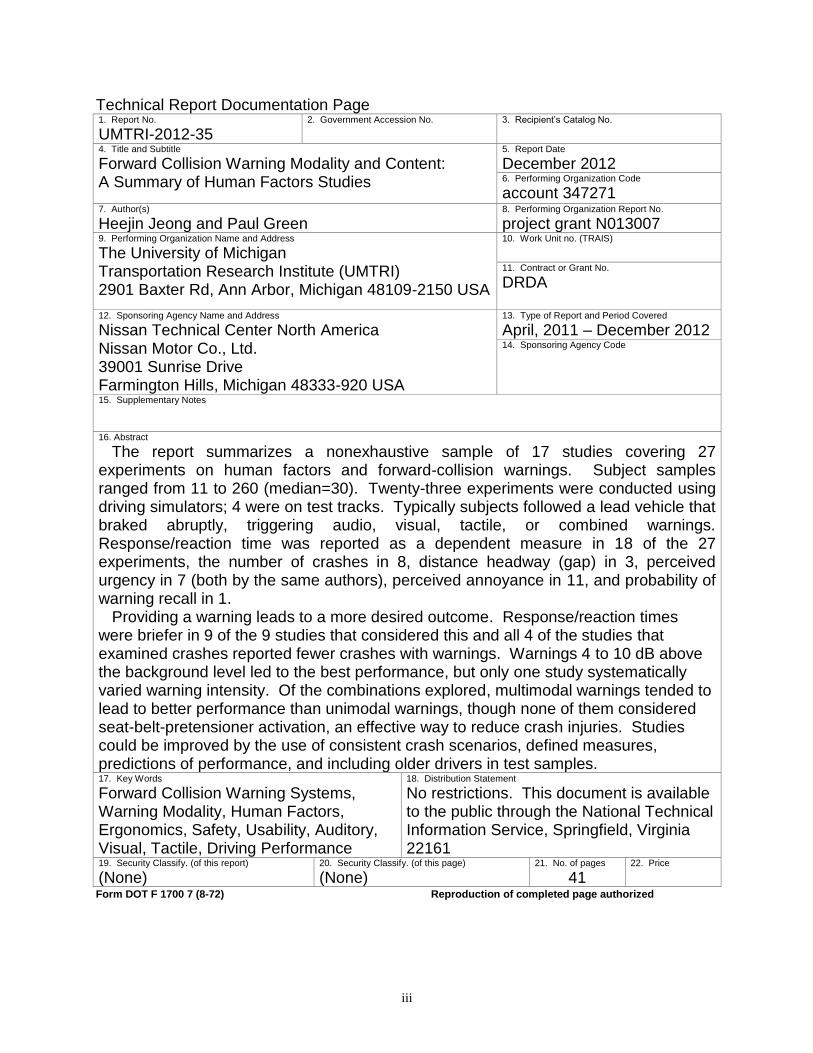
16. Abstract
The report summarizes a nonexhaustive sample of 17 studies covering 27 experiments on human factors and forward-collision warnings. Subject samples ranged from 11 to 260 (median=30). Twenty-three experiments were conducted using driving simulators; 4 were on test tracks. Typically subjects followed a lead vehicle that braked abruptly, triggering audio, visual, tactile, or combined warnings. Response/reaction time was reported as a dependent measure in 18 of the 27 experiments, the number of crashes in 8, distance headway (gap) in 3, perceived urgency in 7 (both by the same authors), perceived annoyance in 11, and probability of warning recall in 1. Providing a warning leads to a more desired outcome. Response/reaction times were briefer in 9 of the 9 studies that considered this and all 4 of the studies that examined crashes reported fewer crashes with warnings. Warnings 4 to 10 dB above the background level led to the best performance, but only one study systematically varied warning intensity. Of the combinations explored, multimodal warnings tended to lead to better performance than unimodal warnings, though none of them considered seat-belt-pretensioner activation, an effective way to reduce crash injuries. Studies could be improved by the use of consistent crash scenarios, defined measures, predictions of performance, and including older drivers in test samples. 17. Key Words
Forward Collision Warning Systems, Warning Modality, Human Factors, Ergonomics, Safety, Usability, Auditory, Visual, Tactile, Driving Performance
18. Distribution Statement
No restrictions. This document is available to the public through the National Technical Information Service, Springfield, Virginia 22161
19. Security Classify. (of this report)
(None) 20. Security Classify. (of this page)
(None) 21. No. of pages
41 22. Price
Form DOT F 1700 7 (8-72) Reproduction of completed page authorized

iv
v
Forward Collision Warning Modality and Content: A Summary of Human Factors Experiments
UMTRI Technical Report 2012-35, December 2012
Heejin Jeong and Paul Green University of Michigan
Transportation Research Institute Ann Arbor, Michigan, USA
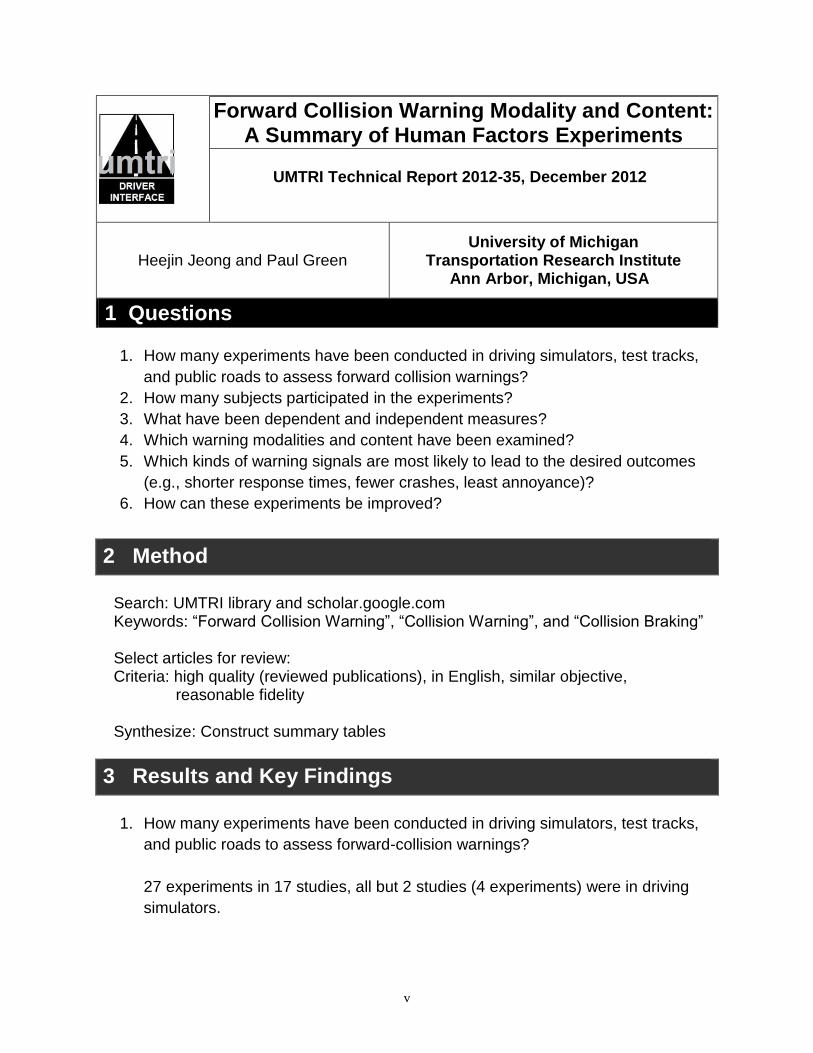
1 1 Questions
1. How many experiments have been conducted in driving simulators, test tracks,
and public roads to assess forward collision warnings?
2. How many subjects participated in the experiments?
3. What have been dependent and independent measures?
4. Which warning modalities and content have been examined?
5. Which kinds of warning signals are most likely to lead to the desired outcomes
(e.g., shorter response times, fewer crashes, least annoyance)?
6. How can these experiments be improved?
2 Method
Search: UMTRI library and scholar.google.com Keywords: “Forward Collision Warning”, “Collision Warning”, and “Collision Braking” Select articles for review: Criteria: high quality (reviewed publications), in English, similar objective, reasonable fidelity Synthesize: Construct summary tables
3 Results and Key Findings
1. How many experiments have been conducted in driving simulators, test tracks,
and public roads to assess forward-collision warnings?
27 experiments in 17 studies, all but 2 studies (4 experiments) were in driving
simulators.
vi
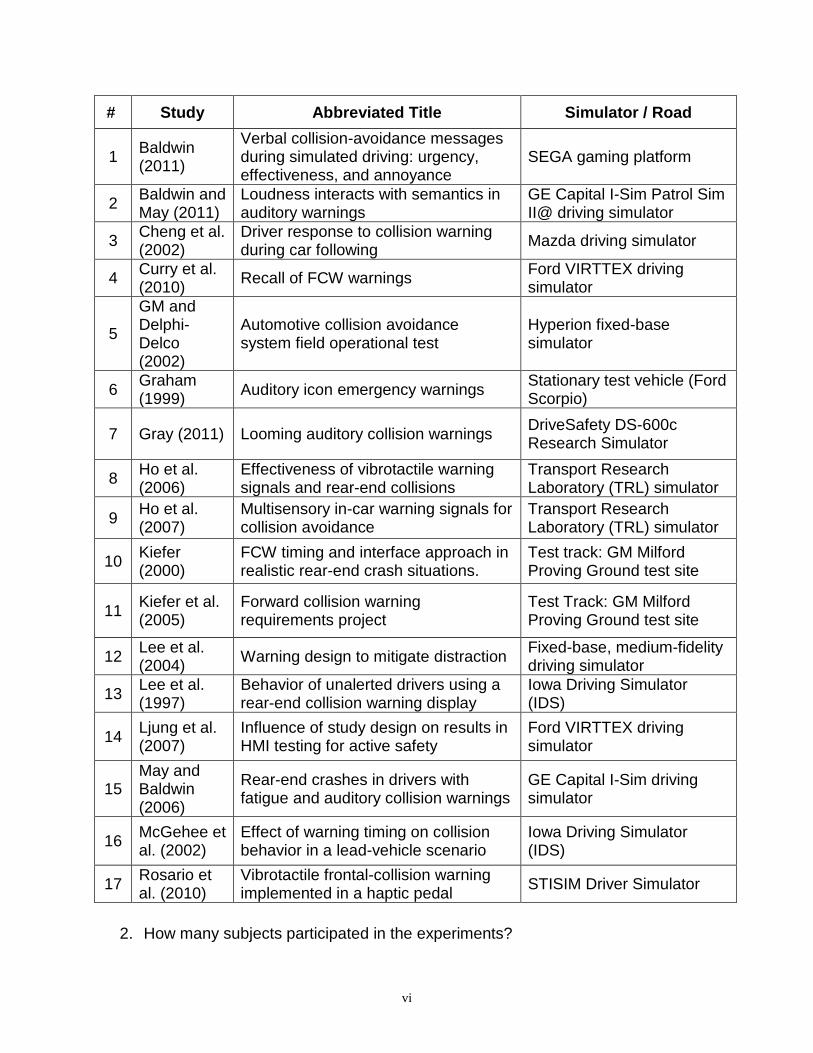
# Study Abbreviated Title Simulator / Road
1 Baldwin (2011)
Verbal collision-avoidance messages during simulated driving: urgency, effectiveness, and annoyance
SEGA gaming platform
2 Baldwin and May (2011)
Loudness interacts with semantics in auditory warnings
GE Capital I-Sim Patrol Sim II@ driving simulator
3 Cheng et al. (2002)
Driver response to collision warning during car following
Mazda driving simulator
4 Curry et al. (2010)
Recall of FCW warnings Ford VIRTTEX driving simulator
5
GM and Delphi-Delco (2002)
Automotive collision avoidance system field operational test
Hyperion fixed-base simulator
6 Graham (1999)
Auditory icon emergency warnings Stationary test vehicle (Ford Scorpio)
7 Gray (2011) Looming auditory collision warnings DriveSafety DS-600c Research Simulator
8 Ho et al. (2006)
Effectiveness of vibrotactile warning signals and rear-end collisions
Transport Research Laboratory (TRL) simulator
9 Ho et al. (2007)
Multisensory in-car warning signals for collision avoidance
Transport Research Laboratory (TRL) simulator
10 Kiefer (2000)
FCW timing and interface approach in realistic rear-end crash situations.
Test track: GM Milford Proving Ground test site
11 Kiefer et al. (2005)
Forward collision warning requirements project
Test Track: GM Milford Proving Ground test site
12 Lee et al. (2004)
Warning design to mitigate distraction Fixed-base, medium-fidelity driving simulator
13 Lee et al. (1997)
Behavior of unalerted drivers using a rear-end collision warning display
Iowa Driving Simulator (IDS)
14 Ljung et al. (2007)
Influence of study design on results in HMI testing for active safety
Ford VIRTTEX driving simulator
15 May and Baldwin (2006)
Rear-end crashes in drivers with fatigue and auditory collision warnings
GE Capital I-Sim driving simulator
16 McGehee et al. (2002)
Effect of warning timing on collision behavior in a lead-vehicle scenario
Iowa Driving Simulator (IDS)
17 Rosario et al. (2010)
Vibrotactile frontal-collision warning implemented in a haptic pedal
STISIM Driver Simulator
2. How many subjects participated in the experiments?

vii
11 to 260, with 5 experiments reporting less than 20 subjects; median = 30
3. What have been dependent and independent measures?
Dependent Measure Definitions Listed in the Studies
response/reaction time A measure of “The participant’s task that was to press a brake pedal to avoid a collision” (Gray, 2011, p. 64).
The time after the onset of a frontal critical event until the participant initiated a braking response by depressing the brake pedal (Ho et al., 2006, p. 991).
“Time to brake” was defined as the length of time between the illumination of the lead vehicle’s brake light and the initiation of braking input (Lee et al., 1997, p. 4).
number of crashes A “crash” was defined as the subject’s vehicle striking the rear or side of the lead vehicle (Lee et al., 1997, p. 4).
distance headway (actually gap)
Distance to the lead vehicle from the onset of a frontal critical event to the first acceleration after the completion of the first braking response (Ho et al., 2006, p. 991).
perceived urgency Baldwin and May (2011, p. 39) created a five-point Likert-type rating scale (very urgent, somewhat urgent, neutral, somewhat insignificant, very insignificant) regarding the perceived urgency of participants after completing the experiment.
level of annoyance GM and Delphi-Delco (2002, p. 27) evaluated the display in terms of how annoying or distracting it is as the subject drives.
recall probability The memory of the FCW alert. “The 100% recollection accuracy in the baseline group should not be interpreted to indicate that as long as no warning given, no false memories arise” (Curry et al., 2010, p. 33).
However, most often, dependent measures were not defined. Independent measures are described in the table on the next page.
viii
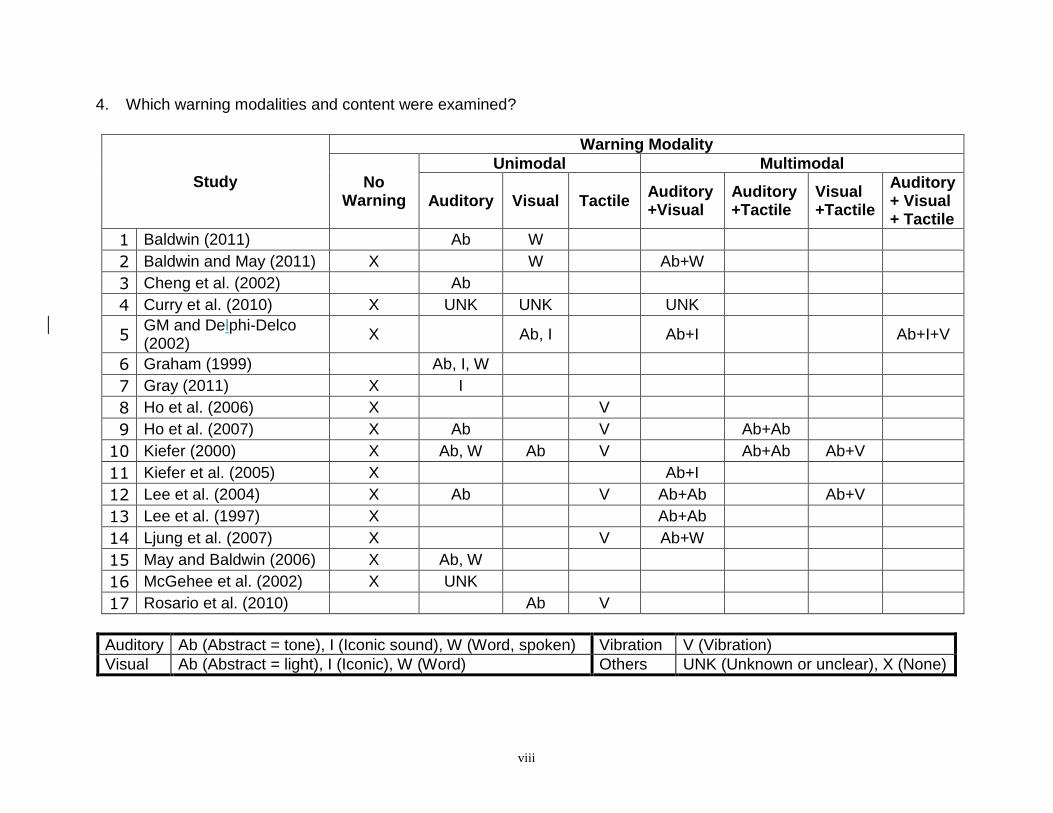
4. Which warning modalities and content were examined?
Study
Warning Modality
No Warning
Unimodal Multimodal
Auditory Visual Tactile Auditory +Visual
Auditory +Tactile
Visual +Tactile
Auditory + Visual + Tactile
1 Baldwin (2011) Ab W
2 Baldwin and May (2011) X W Ab+W
3 Cheng et al. (2002) Ab
4 Curry et al. (2010) X UNK UNK UNK
5 GM and Delphi-Delco (2002)
X Ab, I Ab+I Ab+I+V
6 Graham (1999) Ab, I, W
7 Gray (2011) X I
8 Ho et al. (2006) X V
9 Ho et al. (2007) X Ab V Ab+Ab
10 Kiefer (2000) X Ab, W Ab V Ab+Ab Ab+V
11 Kiefer et al. (2005) X Ab+I
12 Lee et al. (2004) X Ab V Ab+Ab Ab+V
13 Lee et al. (1997) X Ab+Ab
14 Ljung et al. (2007) X V Ab+W
15 May and Baldwin (2006) X Ab, W
16 McGehee et al. (2002) X UNK
17 Rosario et al. (2010) Ab V
Auditory Ab (Abstract = tone), I (Iconic sound), W (Word, spoken) Vibration V (Vibration)
Visual Ab (Abstract = light), I (Iconic), W (Word) Others UNK (Unknown or unclear), X (None)

ix
5. Which kinds of warning signals are most likely to lead to the desired
outcomes (e.g., shorter response times, fewer crashes, least annoyance)?
Dependent measure/statistic
Does providing a warning lead to a more desired outcome than no warning?
Which characteristics for auditory warnings lead to the desired outcome most often?
Do multimodal warnings lead a desired outcome more than unimodal warnings?
response/reaction time
9/9 studies found shorter response times
+ 4 dB mixed by more often yes
number of crashes 4/4 studies found fewer crashes
spoken warnings at 85dB led to fewer crashes than 70 dB
not examined
distance headway (gap)
2/2 found that providing warnings increased gap
not examined not examined
perceived urgency not examined + 10 dB not examined
level of annoyance
1/1 study found providing warnings reduced annoyance
increasing intensity increased annoyance
not examined
recall probability 1/1 found providing warnings greater recall probability
unknown Multimodal warnings were more likely to be recalled
6. How can studies on this topic be improved?
Problem Solution
Inconsistent crash scenarios. Use the NHTSA typology as a framework.
Inconsistent, undefined measures. Comply with SAE Recommended Practice J2944.
No predictions for driver responses to warnings.
Develop models for response time, etc. before the experiment is conducted.
Only 5 of the 27 experiments included subjects over age 65.
Every experiment should include older drivers in the test sample.
x
TABLE OF CONTENTS
INTRODUCTION ............................................................................................................. 1 Background .......................................................................................................................... 1 Research Issues ................................................................................................................... 1
METHOD ......................................................................................................................... 3
RESULTS ....................................................................................................................... 5 How many experiments have been conducted in driving simulators, test tracks, and public roads to assess forward-collision warnings? ......................................................... 5 How many subjects participated in the experiments? ...................................................... 5 Which dependent and independent measures were examined? ...................................... 5 Which warning modalities and content were examined? .................................................. 6 Which combination of warning characteristics leads to the desired outcomes (e.g., shorter response times, fewer crashes, least annoyance)? ............................................14
CONCLUSIONS ............................................................................................................ 23
REFERENCES .............................................................................................................. 27

xi

1
INTRODUCTION Background In the most recent crash statistics at the time this report was written, 59.3% of all fatal passenger-car crashes in the United States and 53.8% of the injury crashes had their initial impact point in the front (U.S. Department of Transportation, 2012). This suggests a huge opportunity for the development of forward-collision warning systems. Over the last decade, there has been a significant effort to deploy warning systems in passenger vehicles for all types of potentially hazardous situations—forward collision, lane departure, blind-spot detection, and many others. There is good evidence to show that they can be effective (e.g., Sugimoto and Sauer, 2005; Nodine et al., 2011; Insurance Institute for Highway Safety, 2012), and that there is interest from the industry in providing them. There have been several efforts in the past to review the human factors literature pertaining to all warning systems (e.g., Smith and Zhang, 2004; Campbell et al., 2007), with the goal of providing recommendations for design (Lerner et al., 2011). This review concerns forward-collision warnings only and attempts to summarize the literature in a more compact manner than in the past. Given the resource limitations available to this project, this review is not exhaustive.
Research Issues Six issues were addressed.
1. How many experiments have been conducted in driving simulators, test tracks,
and public roads to assess forward-collision warnings?
2. How many subjects participated in the experiments?
3. What have been dependent and independent measures?
4. Which warning modalities and content have been examined?
5. Which kinds of warning signals are most likely to lead to the desired outcomes
(e.g., shorter response times, fewer crashes, least annoyance)?
6. How can these experiments be improved?

2

3
METHOD Relevant documents were found by searching the UMTRI Library database (http://mirlyn.lib.umich.edu/?inst=umtri) and Google Scholar (http://scholar.google.com) using the keywords “forward collision warning,” “collision warning,” and “collision braking” in 3 separate searches. The references within the documents were also used to identify additional documents. 1. The documented experiments had to have been performed on a test track, road, or
simulator. 2. The papers had to be published in English. 3. The papers had to be substantially reliable, so only articles published through official
journals, technical research institutes, and academic societies were considered for review. Unofficial project reports and masters theses were not included for review.
4. Only papers that dealt with driving performance from a human factors perspective were considered for review. The articles from the other perspectives, including system algorithm, electronics, and mechanics, were excluded.
The reviewed literature was categorized by using the following method. Step 1 – Create the information database. An Excel table was created listing the authors, title, year, subject information, simulator used, tasks, warning tested, and key findings of each document. That table represented 32 documents. Step 2 – Identify the warning modality. From the table constructed in Step 1, the papers were classified into three types based on the warning modalities, including auditory, visual, and tactile. Papers that could not be sorted into one of these three warning-modality groups were excluded. The table represented 23 documents. Step 3 – Examine papers that contained driving performance data. This reduced the sample to 17 documents: 11 journal articles, 4 proceedings, and 2 technical reports. Driving-performance measures examined were response/reaction time, number of crashes, distance headway, perceived urgency, level of annoyance, and recall probability.

4
Step 4 – Produce additional summary tables.
1. A summary of the number of subjects (1 x< 30, 30 x < 60, x ≥ 60) versus the
experimental method (road or simulator). – Table 2
2. A summary by warning modality (8 combinations of auditory, visual, and tactile
modalities (including no warning)). – Tables 4 and 5
3. A summary of driving performance dependent measures and statistics, with definitions (response/reaction time, number of crashes, distance headway (gap), perceived urgency, level of annoyance, warning recall probability). – Tables 3, 6,7,8,9,10, and 11
Note: All tables are in the Results section that follows.
5
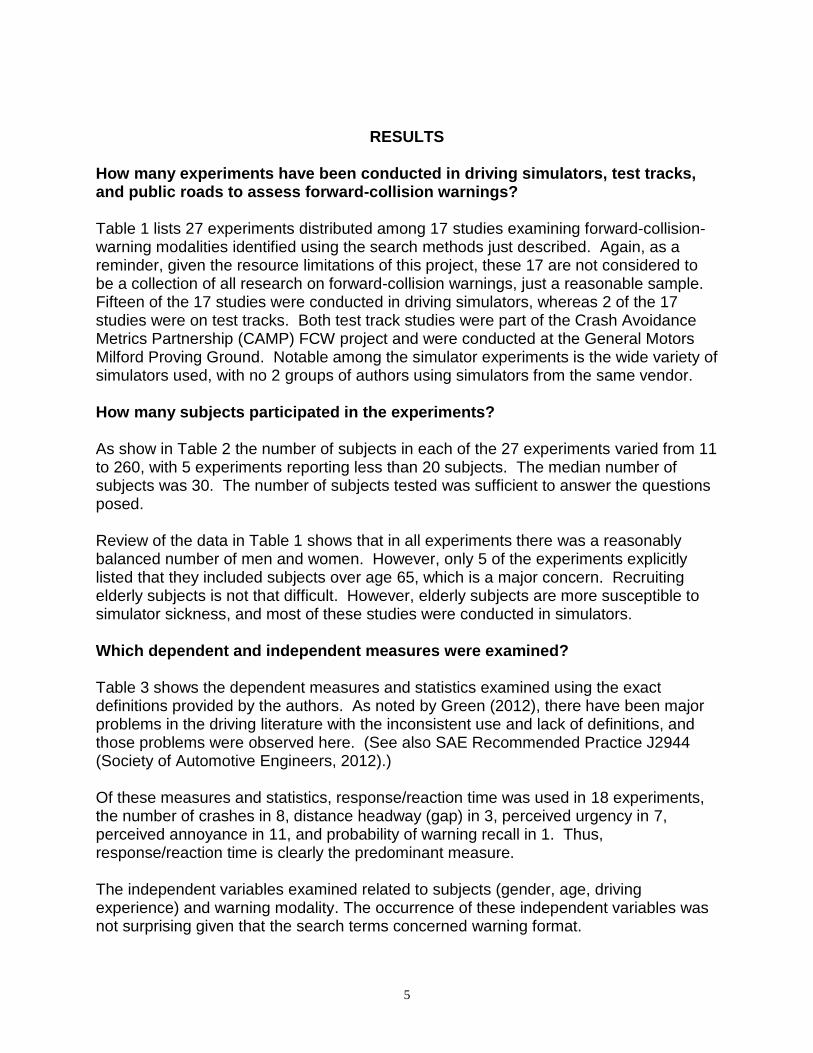
RESULTS How many experiments have been conducted in driving simulators, test tracks, and public roads to assess forward-collision warnings? Table 1 lists 27 experiments distributed among 17 studies examining forward-collision-warning modalities identified using the search methods just described. Again, as a reminder, given the resource limitations of this project, these 17 are not considered to be a collection of all research on forward-collision warnings, just a reasonable sample. Fifteen of the 17 studies were conducted in driving simulators, whereas 2 of the 17 studies were on test tracks. Both test track studies were part of the Crash Avoidance Metrics Partnership (CAMP) FCW project and were conducted at the General Motors Milford Proving Ground. Notable among the simulator experiments is the wide variety of simulators used, with no 2 groups of authors using simulators from the same vendor. How many subjects participated in the experiments? As show in Table 2 the number of subjects in each of the 27 experiments varied from 11 to 260, with 5 experiments reporting less than 20 subjects. The median number of subjects was 30. The number of subjects tested was sufficient to answer the questions posed. Review of the data in Table 1 shows that in all experiments there was a reasonably balanced number of men and women. However, only 5 of the experiments explicitly listed that they included subjects over age 65, which is a major concern. Recruiting elderly subjects is not that difficult. However, elderly subjects are more susceptible to simulator sickness, and most of these studies were conducted in simulators. Which dependent and independent measures were examined? Table 3 shows the dependent measures and statistics examined using the exact definitions provided by the authors. As noted by Green (2012), there have been major problems in the driving literature with the inconsistent use and lack of definitions, and those problems were observed here. (See also SAE Recommended Practice J2944 (Society of Automotive Engineers, 2012).) Of these measures and statistics, response/reaction time was used in 18 experiments, the number of crashes in 8, distance headway (gap) in 3, perceived urgency in 7, perceived annoyance in 11, and probability of warning recall in 1. Thus, response/reaction time is clearly the predominant measure. The independent variables examined related to subjects (gender, age, driving experience) and warning modality. The occurrence of these independent variables was not surprising given that the search terms concerned warning format.

6
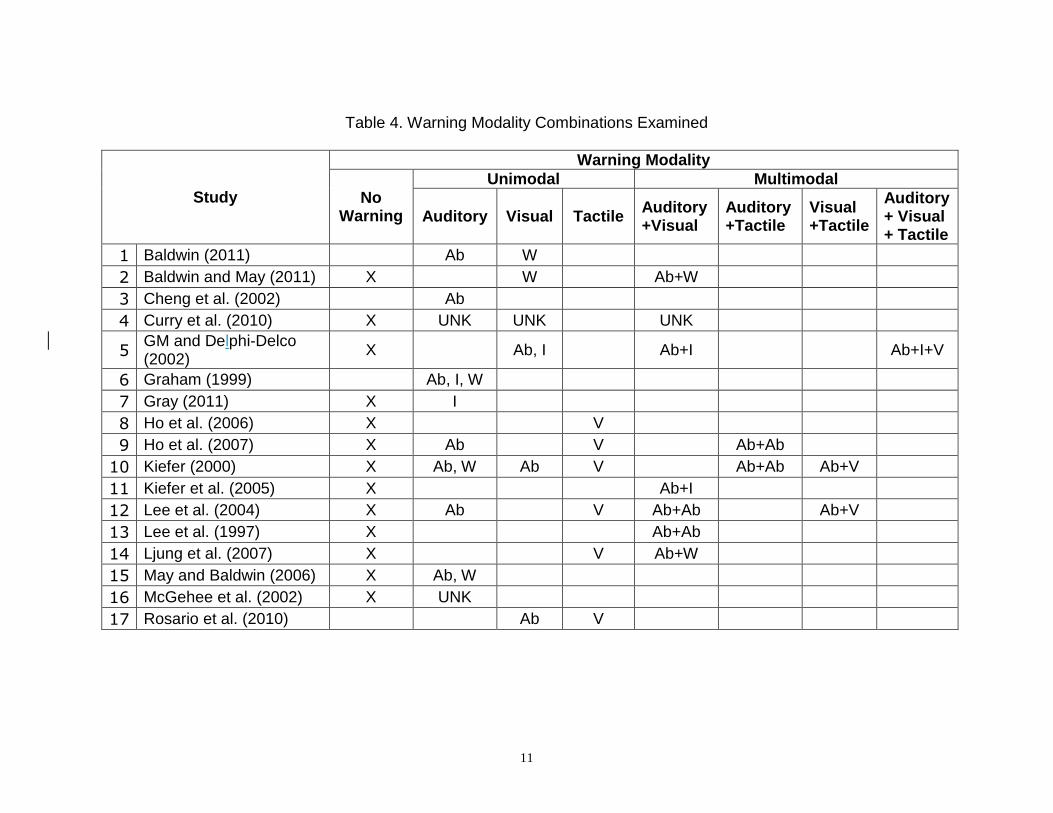
Which warning modalities and content were examined? Table 4 lists the warning modalities used in each study. Note that 6 experiments included cross-modal comparisons of unimodal stimuli. None of them included cross-modal matching is essential to ensure that the conditions being compared were indeed comparable. Thus, the answer to the question of whether a light or a tone would be better for some warning depends on the intensity of the stimuli, the luminance, luminance contrast, chromatic contrast of the light, the signal-to-noise ratio, and sound level of the tone.

7
Table 1. Studies Examined Concerning Forward Warning Systems
# Author (Year)
Title Simulator / Road Subjects
(number, gender, age)
1 Baldwin (2011)
Verbal collision avoidance messages during simulated driving: perceived urgency, alerting effectiveness and annoyance
SEGA gaming platform Exp1 (14, M4/F10, 18-32), Exp2 (14, M5/F9, 18-32)
2 Baldwin and May (2011)
Loudness interacts with semantics in auditory warnings to impact rear-end collisions
General Electric Capital I-Sim Patrol Sim II@ driving simulator
Exp1-Exp5 (30, M13/F17, 18-26)
3 Cheng et al. (2002)
Analysis of driver response to collision warning during car following
Driving simulator (Mazda) 36, M18/F18, 23-47
4 Curry et al. (2010)
Immediate recall of driver warnings in forward collision warning scenarios
Ford Motor Company VIRTTEX driving simulator
120, M60/F60, 25-65
5
GM and Delphi-Delco (2002)
Automotive collision avoidance system field operational test
fixed-base Hyperion simulator installed at Delphi Delco Electronics in Kokomo.
Exp1 (80, M64/F16, 21-64), Exp2: (12, Not mentioned, 24-60)
6 Graham (1999)
Use of auditory icon emergency warnings: evaluation within a vehicle collision avoidance application
stationary test vehicle (Ford Scorpio)
24, M6 (-35), M6 (35+), F6 (-35), F6 (35+)
7 Gray (2011)
Looming auditory collision warnings for driving
DS-600c Advanced Research Simulator by DriveSafety
20, M8/F12, 18-42
8 Ho et al. (2006)
Assessing the effectiveness of “intuitive” vibrotactile warning signals in preventing front-to-rear-end collisions in a driving simulator
advanced TRL driving simulator comprised a Honda Civic family hatchback car with a five-speed manual gearbox.
11, M6/F5, 20-39
9 Ho et al. (2007)
Multisensory in-car warning signals for collision avoidance
Transport Research Laboratory (TRL) driving simulator
15, M15, 17-41 (The original number was 18 but the data of 3 were excluded.)

8
10 Kiefer (2000)
Developing a forward collision warning system timing and interface approach by placing drivers in realistic rear-end crash situations.
test track: General Motors Milford Proving Ground test site
36, M18/F18, 20-30/40-51/60-71
11 Kiefer et al. (2005)
Forward collision warning requirements project
test track: General Motors Milford Proving Ground test site
Ext1 (260, M132/F128, 20-30/40-50/60-70), Exp2 (51, M24/F27, 20-30/40-50/60-70), Exp3 (48, M24/F24, 20-30/60-70)
12 Lee et al. (2004)
Collision warning design to mitigate driver distraction
fixed-based, medium-fidelity driving simulator
Exp1 (40, M20/F20, 25-55), Exp2 (20, M11/F9, 25-55)
13 Lee et al. (1997)
Collision avoidance behavior of unalerted drivers using a front-to-rear-end collision warning display on the Iowa Driving Simulator
Iowa Driving Simulator (IDS)
64, M32/F32, 18-32/32-65
14 Ljung et al. (2007)
The influence of study design on result in HMI testing for active safety
Ford's VIRtual Test Track EXperiment (VIRTTEX) driving simulator
Exp1 (38, M19/F19, 25-45/50+), Exp2 (48, M24/F24, 25-45/50+)
15 May and Baldwin (2006)
Prevention of rear-end crashes in drivers with task-induced fatigue through the use of auditory collision avoidance warnings
General Electric Capital I-Sim driving simulator
45, 19(M5/F14, 18-35) +23(M11/F12, 60-82), (3 participants among 48 were excluded as outliers) - potential math error by author
16 McGehee et al. (2002)
Effect of warning timing on collision avoidance behavior in a stationary lead vehicle scenario
Iowa Driving Simulator (IDS)
30, Not mentioned, 18-24
17 Rosario et al. (2010)
Efficacy and feeling of a vibrotactile frontal collision warning implemented in a haptic pedal
STISIM Driver Simulator 30, M15/F15, 20-40

9
Table 2. Number of Subjects by Experimental Method
Number of Subjects
Method 1 ≤ x < 30 [13 Experiments] 30 ≤ x < 60 [10 Experiments] x ≥ 60 [4 Experiments]
simulator [Total 23]
[1] Baldwin (2011) I, II {14 for each} [3] Cheng et al. (2002) {36} [4] Curry et al. (2010) {120}
[2] Baldwin and May (2011) I, II, III, IV, V {30 for each}
[12] Lee et al. (2004) I {40} [5] GM and Delphi-Delco (2002) I {80}
[5] GM and Delphi-Delco (2002) II {12}
[14] Ljung et al. (2007) I {38}, II {48}
[13] Lee et al. (1997) {64}
[6] Graham (1999) {24} [15] May and Baldwin (2006) {45}
[7] Gray (2011) {20} [16] McGehee et al. (2002) {30}
[8] Ho et al. (2006) {11} [17] Rosario et al. (2010) {30}
[9] Ho et al. (2007) {15}
[12] Lee et al. (2004) II {20}
road [Total 4]
[10] Kiefer (2000) {36} [11] Kiefer, et al. (2005) I {260}
[11] Kiefer et al. (2005) II {51}, III {48}
I, II, III, IV, V refers to the experiment number in each paper. The number in { } indicates the number of subjects in each experiment or paper.

10
Table 3: Definitions of Driving Performance Measures
Performance Measure
Definitions Listed in the Studies
response/reaction time A measure of “The participant’s task that was to press a brake pedal to avoid a collision” (Gray, 2011, p. 64).
The time after the onset of a frontal critical event until the participant initiated a braking response by depressing the brake pedal (Ho et al., 2006, p. 991).
“Time to brake” was defined as the length of time between the illumination of the lead vehicle’s brake light and the initiation of braking input (Lee et al., 1997, p. 4).
number of crashes A “crash” was defined as the subject’s vehicle striking the rear or side of the lead vehicle (Lee et al., 1997, p. 4).
distance headway (actually gap)
Distance to the lead vehicle from the onset of a frontal critical event to the first acceleration after the completion of the first braking response (Ho et al., 2006, p. 991).
perceived urgency Baldwin and May (2011, p. 39) created a five-point Likert-type rating scale (very urgent, somewhat urgent, neutral, somewhat insignificant, very insignificant) regarding the perceived urgency of participants after completing the experiment.
level of annoyance GM and Delphi-Delco (2002, p. 27) evaluated the display in terms of how annoying or distracting it is as the subject drives.
recall probability The memory of the FCW alert. “The 100% recollection accuracy in the baseline group should not be interpreted to indicate that as long as no warning given, no false memories arise” (Curry et al., 2010, p. 33).
11
Table 4. Warning Modality Combinations Examined
Study
Warning Modality
No Warning
Unimodal Multimodal
Auditory Visual Tactile Auditory +Visual
Auditory +Tactile
Visual +Tactile
Auditory + Visual + Tactile
1 Baldwin (2011) Ab W
2 Baldwin and May (2011) X W Ab+W
3 Cheng et al. (2002) Ab
4 Curry et al. (2010) X UNK UNK UNK
5 GM and Delphi-Delco (2002)
X Ab, I Ab+I Ab+I+V
6 Graham (1999) Ab, I, W
7 Gray (2011) X I
8 Ho et al. (2006) X V
9 Ho et al. (2007) X Ab V Ab+Ab
10 Kiefer (2000) X Ab, W Ab V Ab+Ab Ab+V
11 Kiefer et al. (2005) X Ab+I
12 Lee et al. (2004) X Ab V Ab+Ab Ab+V
13 Lee et al. (1997) X Ab+Ab
14 Ljung et al. (2007) X V Ab+W
15 May and Baldwin (2006) X Ab, W
16 McGehee et al. (2002) X UNK
17 Rosario et al. (2010) Ab V
12
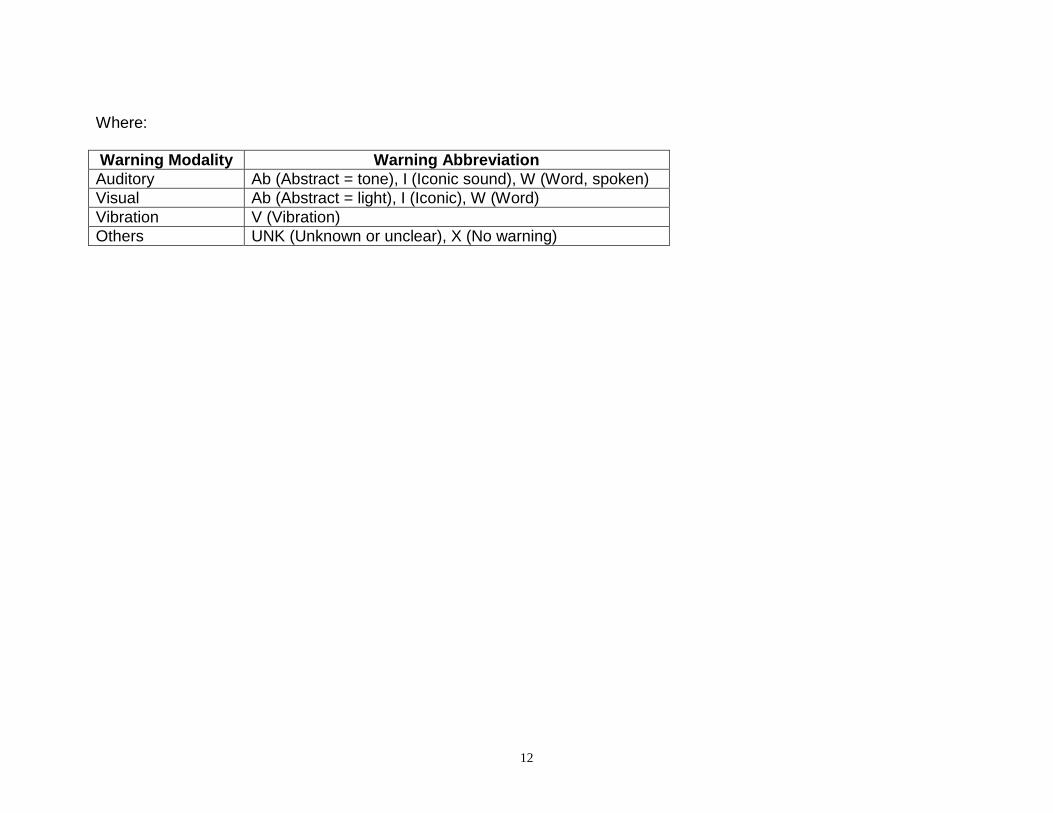
Where:
Warning Modality Warning Abbreviation
Auditory Ab (Abstract = tone), I (Iconic sound), W (Word, spoken)
Visual Ab (Abstract = light), I (Iconic), W (Word)
Vibration V (Vibration)
Others UNK (Unknown or unclear), X (No warning)
13
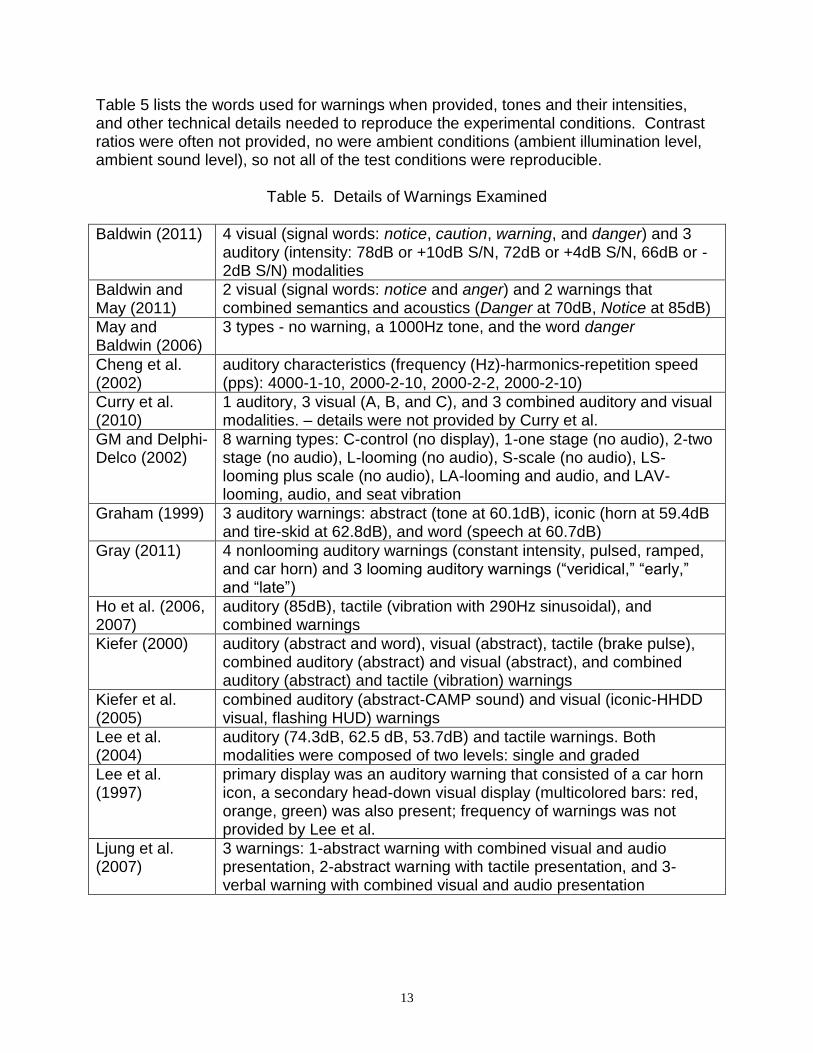
Table 5 lists the words used for warnings when provided, tones and their intensities, and other technical details needed to reproduce the experimental conditions. Contrast ratios were often not provided, no were ambient conditions (ambient illumination level, ambient sound level), so not all of the test conditions were reproducible.
Table 5. Details of Warnings Examined
Baldwin (2011) 4 visual (signal words: notice, caution, warning, and danger) and 3 auditory (intensity: 78dB or +10dB S/N, 72dB or +4dB S/N, 66dB or -2dB S/N) modalities
Baldwin and May (2011)
2 visual (signal words: notice and anger) and 2 warnings that combined semantics and acoustics (Danger at 70dB, Notice at 85dB)
May and Baldwin (2006)
3 types - no warning, a 1000Hz tone, and the word danger
Cheng et al. (2002)
auditory characteristics (frequency (Hz)-harmonics-repetition speed (pps): 4000-1-10, 2000-2-10, 2000-2-2, 2000-2-10)
Curry et al. (2010)
1 auditory, 3 visual (A, B, and C), and 3 combined auditory and visual modalities. – details were not provided by Curry et al.
GM and Delphi-Delco (2002)
8 warning types: C-control (no display), 1-one stage (no audio), 2-two stage (no audio), L-looming (no audio), S-scale (no audio), LS-looming plus scale (no audio), LA-looming and audio, and LAV-looming, audio, and seat vibration
Graham (1999) 3 auditory warnings: abstract (tone at 60.1dB), iconic (horn at 59.4dB and tire-skid at 62.8dB), and word (speech at 60.7dB)
Gray (2011) 4 nonlooming auditory warnings (constant intensity, pulsed, ramped, and car horn) and 3 looming auditory warnings (“veridical,” “early,” and “late”)
Ho et al. (2006, 2007)
auditory (85dB), tactile (vibration with 290Hz sinusoidal), and combined warnings
Kiefer (2000) auditory (abstract and word), visual (abstract), tactile (brake pulse), combined auditory (abstract) and visual (abstract), and combined auditory (abstract) and tactile (vibration) warnings
Kiefer et al. (2005)
combined auditory (abstract-CAMP sound) and visual (iconic-HHDD visual, flashing HUD) warnings
Lee et al. (2004)
auditory (74.3dB, 62.5 dB, 53.7dB) and tactile warnings. Both modalities were composed of two levels: single and graded
Lee et al. (1997)
primary display was an auditory warning that consisted of a car horn icon, a secondary head-down visual display (multicolored bars: red, orange, green) was also present; frequency of warnings was not provided by Lee et al.
Ljung et al. (2007)
3 warnings: 1-abstract warning with combined visual and audio presentation, 2-abstract warning with tactile presentation, and 3-verbal warning with combined visual and audio presentation

14
McGehee et al. (2002)
auditory warnings, which were no warning and 2 warning (early and late) conditions - frequency of auditory warning was not provided by McGehee et al.
Rosario et al. (2010)
vibrotactile signals with 0.50, 1.05, and 1.60Nm at 2.5, 5, and 10Hz against a baseline visual FCW
Which combination of warning characteristics leads to the desired outcomes (e.g., shorter response times, fewer crashes, least annoyance)? Due to the lack of consistent test methods and warnings presented in the studies reviewed, developing conclusions across studies is a challenge. Nonetheless, the data seemed to consistently address 3 questions. 1. Does providing a warning lead to a more desired outcome than no warning? 2. Which characteristics for auditory warnings lead to the desired outcome most often? 3. Do multimodal warnings lead a desired outcome more than unimodal warnings? The question the authors wanted to address is which modality for a warning leads to the best performance. Unfortunately, the data in these documents do not address that question directly. Response/Reaction Time Does providing a warning lead to a briefer response time than no warning at all? Table 6 shows the best performance in terms of response/reaction time. Nine studies examined the warning/no warning comparison, and all of them found that providing a warning reduced response/reaction time. Five studies (Baldwin, 2011; Cheng et al. 2002; Graham, 1999; Gray, 2011; McGehee et al. 2002) examined only auditory warnings. As an example, Graham (1999) determined that an auditory icon warning (horn) produced briefer reaction times than a tone, tire-skid sound, or speech, all off which were presented at apparently greater intensities, though the intensity differences are often less than 1 dB. (Furthermore, they are reported to the nearest 0.1 dB, and level of precision that is difficult to achieve reliably.) Which characteristics for auditory warnings lead to the briefest response times? Gray (2011) examined veridical looming and found that car-horn warnings lead to a significantly shorter brake response time, but the number of braking responses under false-alarm conditions was significantly greater for the car horn. Thus, looming auditory warnings produce the best combination of response speed and accuracy. Baldwin (2011) found that sound levels of +4 dB, led to the best performance, even better than +10 dB and -2dB. Participants responded significantly faster in the +4dB S/N conditions

15
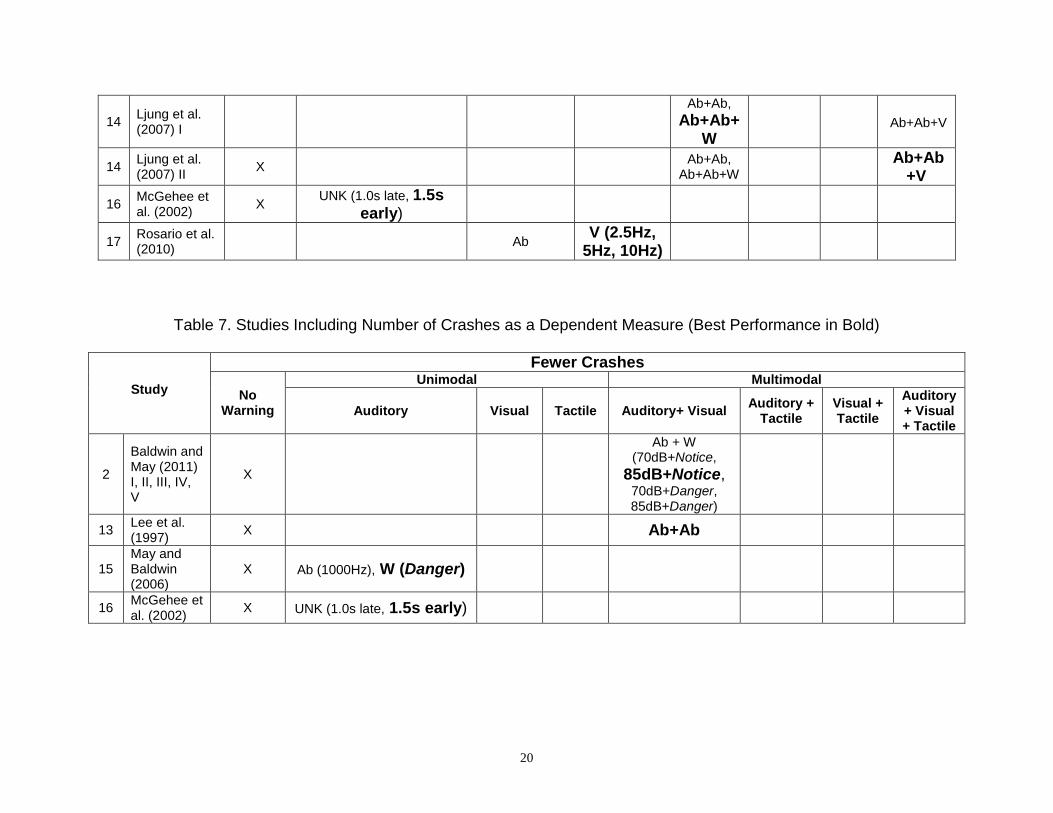
(mean = 2708 ms, SD = 1166 ms) and the +10dB S/N conditions (mean = 2778 ms, SD = 1136 ms) relative to the -2 dB S/N conditions (mean = 4633 ms, SD = 1186 ms). Cheng, et al. (2002) found that 2000 Hz tones led to shorter response times than 4000 Hz. Do multimodal warnings lead to briefer response times than unimodal warnings? If the driver is alerted by a multimodal warning, then they could be warned when the first modality is processed. However, some argue that for multimodal warnings, the driver does not respond until all modalities for the warning are processed, which usually takes longer than processing 1 modality. However, if for some reason a pathway is blocked (for example, a loud sound interfering with a warning) or interfered with (for example, a driver is distracted so they do not see a warning), there are other ways the driver can receive the warning, so they will respond more quickly than if a unimodal warning is presented. The literature offers a mixed response, sometimes favoring multimodal and sometimes unimodal warnings (GM and Delphi-Delco, 2002; Kiefer, 2000; Kiefer et al., 2005; Lee et al.,1997; Ljung et al., 2007). Part of the reason reaching a conclusion is difficult is that the comparison is indirect. Ljung et al. (2007) I found that verbal warnings with a combined visual and auditory presentation produced the shortest RT (1.9s) and that the others have equally 2.5s. Ljung et al. (2007) II determined that an abstract warning (combined visual and auditory) with a tactile warning produced the shortest RT (1.5s) and that the baseline produced the slowest reaction speed (2.5s). To provide some perspective, these authors were not trying to answer the unimodal versus multimodal question directly, but to determine which of a specific set of candidate warnings led to the shortest response time. Number of Crashes Use of this statistic is not common in driving-simulator experiments. To obtain significant differences in the number of crashes between conditions requires a large number of crashes and an even larger number of crash-provocative events, which in turn requires a large driving-simulator experiment. However, the consequence is that a large experiment considers only a small number of differences, and is not very cost effective. Does providing a warning lead to fewer crashes than no warning at all? As shown in Table 7, this was true for all 4 of the studies examined. Two studies examined only the auditory modality (May and Baldwin, 2006; McGehee et al., 2002). May and Baldwin (2006) found 29% of the drivers were involved in a crash in their simulation. Of these, 62% occurred when no warning was provided, 23% were for a nonverbal warning, and 15% were when the warning word danger was spoken. Also, McGehee et al. (2002) found that early-warning condition showed significantly fewer crashes than both the baseline condition and the late warning condition.

16
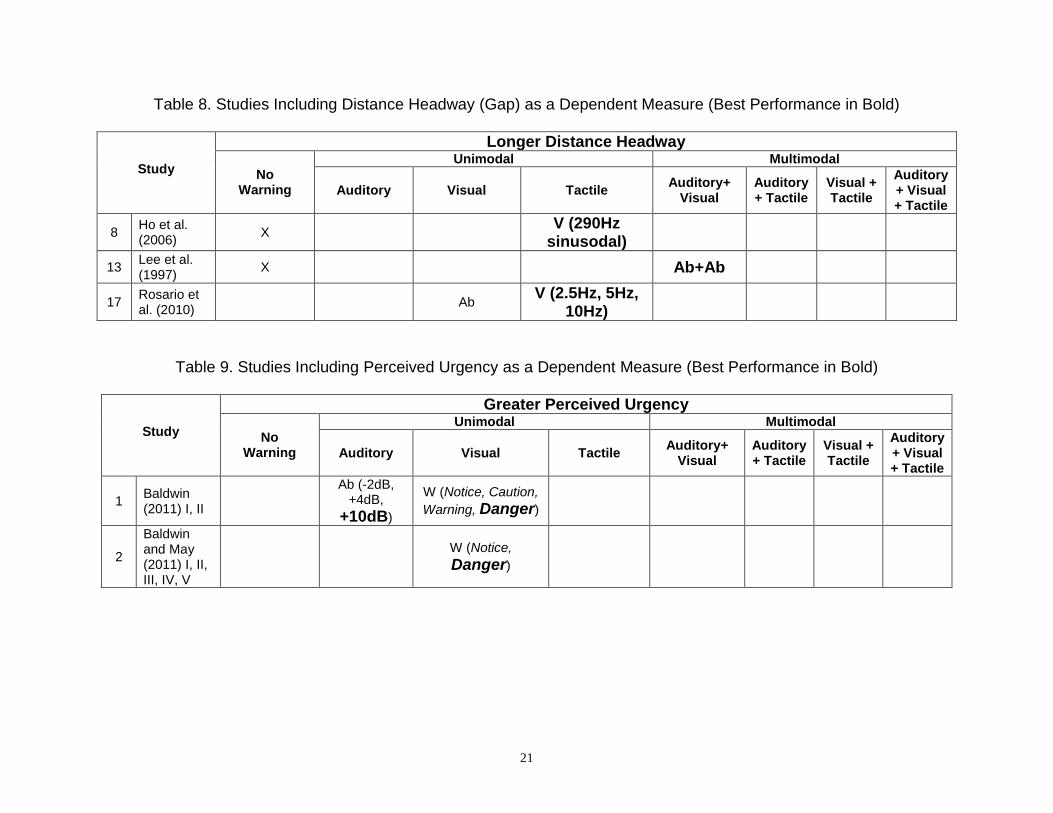
Studies that used a combined auditory and visual modality include Baldwin and May (2011) and Lee et al. (1997). Baldwin and May (2011) stated that the lowest crash rate was found with the moderate-urgency alarm condition, when notice was presented at 85 dB. Lee et al. (1997) found that in the short headway condition, drivers with the collision-warning display experienced crashes during only 4 out of 16 drives, whereas drivers in the baseline condition experienced crashes during 11 out of 16 drives. Which characteristics for auditory warnings lead to the fewest crashes? The data from Baldwin and May (2011) indicates that spoken warnings at 85 dB lead to fewer crashes than those at 70 dB, but the Baldwin and May did not systematically examine the role of sound intensity. Do multimodal warnings lead to fewer crashes than unimodal warnings? None of the studies reviewed examined this question using the number of crashes as the dependent measure. Distance Headway (Gap) Does providing a warning lead to a greater gap than no warning at all? As shown in Table 8, 2 of the 3 studies using gap as the dependent measure addressed this question, and both found that providing warnings altered the gap. Ho et al. (2006) noted that there were larger safety margins when the vibrotactile warning signal was present than when it was not. Lee et al. (1997) determined that a combination of audio and visual signals created longer headways, both at accelerator release and brake initiation, as compared with the baseline. In a related study, Rosario et al. (2010) examined headway reduction (HWR), which they defined as the difference between the headway at the instant of FCW activation and the minimum headway reached while braking. They found that HWR of a visual modality was always larger than that of a vibration modality, regardless of the percentiles of braking response parameter, i.e., whether the percentile was 10, 50, or 90%. Which characteristics for auditory warnings lead to greatest gaps? Using gap as the dependent measure, none of the studies reviewed examined this question. Do multimodal warnings lead to a greater gap than unimodal warnings? No studies in this sample addressed this question.
17
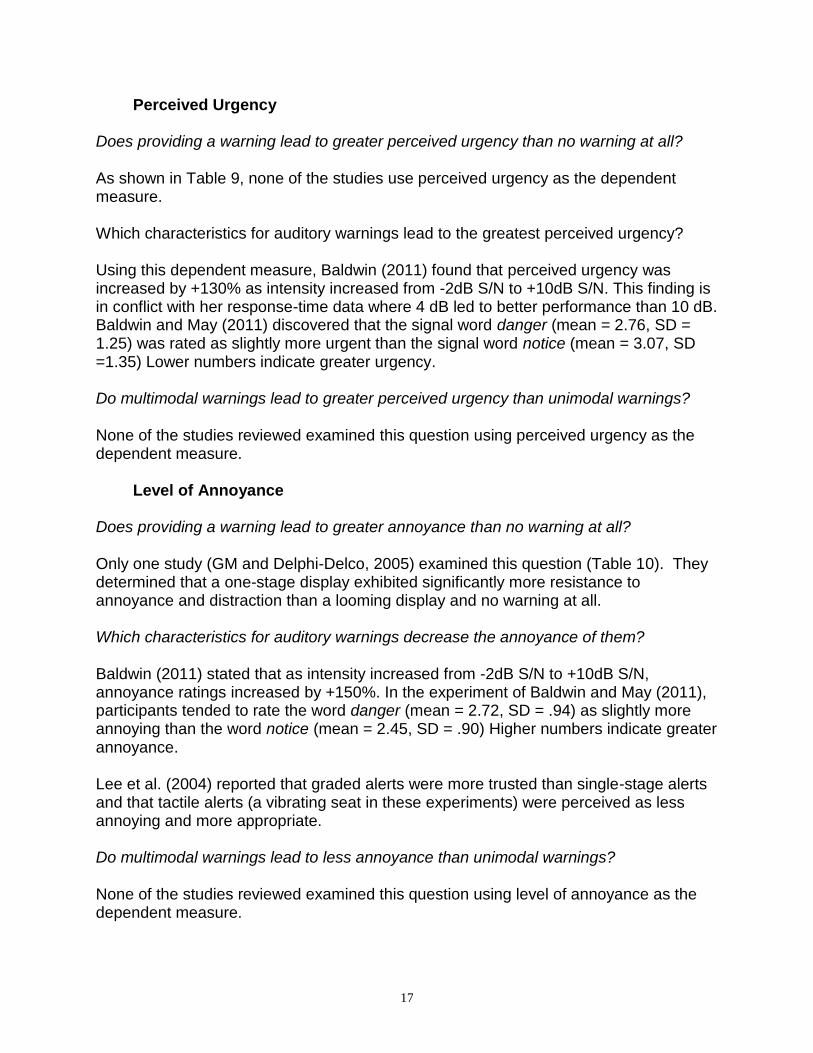
Perceived Urgency Does providing a warning lead to greater perceived urgency than no warning at all? As shown in Table 9, none of the studies use perceived urgency as the dependent measure. Which characteristics for auditory warnings lead to the greatest perceived urgency? Using this dependent measure, Baldwin (2011) found that perceived urgency was increased by +130% as intensity increased from -2dB S/N to +10dB S/N. This finding is in conflict with her response-time data where 4 dB led to better performance than 10 dB. Baldwin and May (2011) discovered that the signal word danger (mean = 2.76, SD = 1.25) was rated as slightly more urgent than the signal word notice (mean = 3.07, SD =1.35) Lower numbers indicate greater urgency. Do multimodal warnings lead to greater perceived urgency than unimodal warnings? None of the studies reviewed examined this question using perceived urgency as the dependent measure. Level of Annoyance Does providing a warning lead to greater annoyance than no warning at all? Only one study (GM and Delphi-Delco, 2005) examined this question (Table 10). They determined that a one-stage display exhibited significantly more resistance to annoyance and distraction than a looming display and no warning at all. Which characteristics for auditory warnings decrease the annoyance of them? Baldwin (2011) stated that as intensity increased from -2dB S/N to +10dB S/N, annoyance ratings increased by +150%. In the experiment of Baldwin and May (2011), participants tended to rate the word danger (mean = 2.72, SD = .94) as slightly more annoying than the word notice (mean = 2.45, SD = .90) Higher numbers indicate greater annoyance. Lee et al. (2004) reported that graded alerts were more trusted than single-stage alerts and that tactile alerts (a vibrating seat in these experiments) were perceived as less annoying and more appropriate. Do multimodal warnings lead to less annoyance than unimodal warnings? None of the studies reviewed examined this question using level of annoyance as the dependent measure.

18
Recall Probability Only 1 study examined recall probability as a performance statistic (Table 11). Curry et al. (2010) determined that 26% of participants did not remember receiving a warning at all. Only 58% of the participants could accurately recall its modality in all its details. Nearly 90% of the participants who received the combined audio and video warning recalled at least one of the modalities correctly, suggesting an advantage of multimodal over unimodal warnings.

19
Table 6. Studies Including Response/Reaction Time as a Dependent Measure (Best Performance in Bold)
Study
Shorter Response/Reaction Time
No Warning
Unimodal Multimodal
Auditory Visual Tactile Auditory+
Visual Auditory + Tactile
Visual +
Tactile
Auditory + Visual +
Tactile
1 Baldwin (2011) I, II
Ab (-2dB, +4dB, +10dB)
3 Cheng et al. (2002)
Ab (fq-harmonics-repetition speed: 4000-1-
10,2000-2-10,2000-2-
2,2000-2-10)
5 GM and Delphi-Delco (2002) I, II
X
Ab (1stage, 2stage),
I (looming, looming+scale,
scale)
Ab+I Ab+I+V
6 Graham (1999)
Ab (tone 60.1dB), I (horn 59.4dB, tire-skid
62.8dB), W (speech 60.7dB)
7 Gray (2011) X
I (nonlooming: constant intensity, pulsed, ramped,
car horn, looming:
veridical, early, late)
8 Ho et al. (2006)
X V (290Hz
sinusodal)
9 Ho et al. (2007)
X Ab (85dB) V (290Hz sinusodal)
Ab+V
10 Kiefer (2000) X Ab, W Ab V (Brake
pulse) Ab+Ab Ab+V
11 Kiefer et al. (2005) I, II, III
X Ab+I
13 Lee et al. (1997)
X Ab+Ab
20
14 Ljung et al. (2007) I
Ab+Ab, Ab+Ab+
W Ab+Ab+V
14 Ljung et al. (2007) II
X Ab+Ab,
Ab+Ab+W
Ab+Ab+V
16 McGehee et al. (2002)
X UNK (1.0s late, 1.5s
early)
17 Rosario et al. (2010)
Ab V (2.5Hz,
5Hz, 10Hz)
Table 7. Studies Including Number of Crashes as a Dependent Measure (Best Performance in Bold)
Study
Fewer Crashes
No Warning
Unimodal Multimodal
Auditory Visual Tactile Auditory+ Visual Auditory +
Tactile Visual + Tactile
Auditory + Visual + Tactile
2
Baldwin and May (2011) I, II, III, IV, V
X
Ab + W (70dB+Notice,
85dB+Notice, 70dB+Danger, 85dB+Danger)
13 Lee et al. (1997)
X Ab+Ab
15 May and Baldwin (2006)
X Ab (1000Hz), W (Danger)
16 McGehee et al. (2002)
X UNK (1.0s late, 1.5s early)
21
Table 8. Studies Including Distance Headway (Gap) as a Dependent Measure (Best Performance in Bold)
Study
Longer Distance Headway
No Warning
Unimodal Multimodal
Auditory Visual Tactile Auditory+
Visual Auditory + Tactile
Visual + Tactile
Auditory + Visual + Tactile
8 Ho et al. (2006)
X V (290Hz
sinusodal)
13 Lee et al. (1997)
X Ab+Ab
17 Rosario et al. (2010)
Ab V (2.5Hz, 5Hz,
10Hz)
Table 9. Studies Including Perceived Urgency as a Dependent Measure (Best Performance in Bold)
Study
Greater Perceived Urgency
No Warning
Unimodal Multimodal
Auditory Visual Tactile Auditory+
Visual Auditory + Tactile
Visual + Tactile
Auditory + Visual + Tactile
1 Baldwin (2011) I, II
Ab (-2dB, +4dB,
+10dB)
W (Notice, Caution,
Warning, Danger)
2
Baldwin and May (2011) I, II, III, IV, V
W (Notice,
Danger)

22
Table 10. Studies Including Level of Annoyance as a Dependent Measure (Best Performance in Bold)
Study
Lower Level of Annoyance
No Warning
Unimodal Multimodal
Only Auditory
Only Visual
Only Tactile
Auditory+ Visual
Auditory + Tactile
Visual + Tactile
Auditory + Visual + Tactile
1 Baldwin (2011) I, II
Ab (-2dB, +4dB,
+10dB)
2
Baldwin and May (2011) I, II, III, IV, V
W (Notice,
Danger)
5
GM and Delphi-Delco (2002) I, II
X
Ab (1stage, 2stage),
I (looming, looming+scale,
scale)
12 Lee et al. (2004) I, II
Single, Graded Single,
Graded
Table 11. Studies Including Recall Probability as a Dependent Measure (Best Performance in Bold)
Study
Greater Recall Probability
No Warning
Unimodal Multimodal
Only Auditory
Only Visual
Only Tactile
Auditory+ Visual
Auditory + Tactile
Visual + Tactile
Auditory + Visual + Tactile
4 Curry et al. (2010)
X UNK UNK UNK
23
CONCLUSIONS
Finding consistent patterns across the experiment review is difficult because the 27 experiments varied in their design, the subjects tested, and the warnings evaluated.
1. How many experiments have been conducted in driving simulators, test tracks, and
public roads to assess forward collision warnings?
There were 27 experiments distributed among 17 documents examining forward-collision warnings, 15 of which involved simulators and 2 of which were conducted on test tracks.
2. How many subjects participated in the experiments?
The number of subjects varied from 11 to 260, with 5 experiments reporting fewer than 20 subjects. The median number of subjects was 30. 3. Which dependent and independent measures were examined?
Response/reaction time was the predominant dependent measure. Response/reaction time was used in 18 experiments, the number of crashes in 8, distance headway (gap) in 3, perceived urgency in 7 (both by the same authors), perceived annoyance in 11, and probability of warning recall in 1.
4. Which warning modalities and content were examined? Visual, auditory, and tactile warnings of all types were examined including abstract warnings (lights, tones, and vibration), icons (visual icons show objects ahead, tire screeching), and verbal warnings (danger, either shown visually or said). Interestingly, seat-belt-pretensioner activation, a powerful cue, which is often used when a crash is imminent, was not explored. 5. Which combination of warning characteristics most often leads to the desired
outcomes (e.g., shorter response times, fewer crashes, least annoyance)?
a. Does providing a warning lead to a more desired outcome than no warning? For all of the studies examined, providing a warning led to a more desired outcome. Shorter response/reaction times were reported for all 9 response/reaction time
studies that examined this question. The 4 studies that examined crashes found there were fewer crashes when warnings were provided. Similarly, warnings led to longer gaps (2 studies) and lower annoyance (1 study).
b. Which characteristics for auditory warnings lead to the desired outcome most often?

24
Warnings 4-10 dB above the background level led to the best performance, but only a limited number of intensity options were explored as most of the studies compared particular warnings that did not vary in any systematic way.
c. Do multimodal warnings lead to a desired outcome more than unimodal warnings?
Of the combinations explored, multimodal warnings tended to lead to better performance than unimodal warnings. Unfortunately, none of the studies examined seat-belt-pretensioner activation. However, should a crash occur, securing the driver is one of the best actions to minimize crash injury.
6. How can this literature review be improved?
1. Use consistent crash scenarios.
As this field is still developing, there are no standard assessment protocols, so each research team devises their own. As a consequence, comparing the outcomes of studies is difficult. The NHTSA crash typology (Najm et al., 2007) provides a framework for developing studies that can be more directly compared.
2. Use consistent, well-defined measures.
As is apparent from the table presented earlier, only a few of the performance measures and statistics have been named consistently or defined, a problem reported elsewhere for a wide range of studies (Green, 2012). Here, for example, response/reaction time was referred to as “braking response time,” but in other cases “time to brake.” Use of the forthcoming SAE Recommended Practice J2944 (Society of Automotive Engineers, 2012), which provides for standard definitions for driving performance measures and statistics should resolve this problem.
3. Develop models and predictions for driver response to warnings.
None of the studies examined made any quantitative predictions relating to response time or any other outcome measure. This is particularly important for characteristics such as warning intensity, and for visual warnings and warning location. As a consequence, every time a new warning or variation of a warning is proposed, an additional experiment is required to assess it. Other fields of engineering are based on modeling and prediction, and human factors engineering should employ the same approach. One would never design a bridge by building a set of alternatives and testing them to see which was least likely to fall down.
4. Include older subjects in the test samples.
Only 5 of the 27 experiments included subjects over age 65, even though they are a large segment of the driving population, could benefit from warnings, and are relatively easy to recruit.

25
These criticisms as a whole should not be interpreted to mean that the existing literature is poor. However, the research could be better and developments now in progress will provide the opportunity for that to occur.

26

27
REFERENCES Baldwin, C (2011). Verbal collision avoidance messages during simulated driving: perceived urgency, alerting effectiveness and annoyance, Ergonomics, 54(4), 328-337. Baldwin, C. and May, J. (2011). Loudness interacts with semantics in auditory warnings to impact rear-end collisions, Transportation Research Part F, 14, 36-42. Campbell, J.L., Richard, C.M., Brown, J.L., McCallum, M. (2007). Crash Warning System Interfaces: Human Factors Insights and Lessons Learned (technical report DOT HS 810 697), Washington, D.C.: U.S. Department of Transportation, National Highway Traffic Safety Administration. Cheng, B., Hashimoto, M., and Suetomi, T. (2002). Analysis of driver response to collision warning during car following, JSAE Review, 23, 232-237. Curry, R., Blommer, M., Greenberg, J., and Tijerina, L (2009). Immediate recall of driver warnings in forward collision warning scenarios, Transportation Research Record number 2138, 28-33. General Motors Corporation and Delphi-Delco Electronic Systems (2002). Automotive Collision Avoidance Field Operational Test Warning Cue Implementation Summary Report (technical report DOT HS 809 462), Washington, D.C.: U.S. Department of Transportation, National Highway Traffic Safety Administration. Graham, R. (2010). Use of auditory icons as emergency warnings: evaluation within a vehicle collision avoidance application, Ergonomics, 42(9), 1233-1248. Gray, R. (2011). Looming auditory collision warnings for driving, Human Factors, 53, 63-74. Green, P. (2012). Using standards to improve the replicability and applicability of driver interface research, Proceedings of the 4th International Conference on Automotive User Interfaces and Interactive Vehicular Applications. Ho, C., Reed, N., and Spence, C. (2006). Assessing the effectiveness of “intuitive” vibrotactile warning signals in preventing front-to-rear collisions in a driving simulator, Accident Analysis and Prevention, 38, 988-996. Ho, C., Reed, N., and Spence, C. (2007). Multisensory in-car warning signals for collision avoidance, Human Factors, 49, 1107-1114. Insurance Institute for Highway Safety (2012). They’re working, Insurance Institute for Highway Safety Status Report, 47(5), 1-7.

28
Kiefer, R. (2000). Developing a forward collision warning system timing and interface approach by placing drivers in realistic rear-end crash situations, Proceedings of the Human Factors and Ergonomics Society Annual Meeting, 3-308 - 3-311. Kiefer, R., Cassar, M., Flannagan, C., Jerome, C., and Palmer, M (2005). Forward Collision Warning Requirements Project Task 2 and 3a Final Report (technical report DOT HS 809 902), Washington, D.C.: U.S. Department of Transportation, National Highway Traffic Safety Administration. Lee, J., Hoffman, J., and Hayes, E. (2004). Collision warning design to mitigate driver distraction, Proceedings of the SIGCHI Conference on Human Factors in Computing Systems, 65-72. Lee, J., McGehee, D., Dingus, T., and Wilson, T. (1997). Collision avoidance behavior of unalerted drivers using a front-to-rear-end collision warning display on the Iowa Driving Simulator, Transportation Research Record number 1573, 1-7. Lerner, N., Jenness, J., Robinson, E., Brown, T., Baldwin, C., and Llaneras, R. (2011). Crash Warning Interface Metrics: Final Report (technical report DOT HS 811 470a), Washington, D.C.: U.S. Department of Transportation, National Highway Traffic Safety Administration. Ljung, M., Blommer, M., Curry, R., Artz, B., Greenberg, J., Kochhar, D., Tijierina, L., Fagerstrom, M., and Jakobsson, L (2007). The influence of study design on results in HMI testing for active safety, Proceedings of the 20th International Technical Conference on the Enhanced Safety of Vehicle (ESV). May, J. and Baldwin, C. (2006). Prevention of rear-end crashes in drivers with task-induced fatigue through the use of auditory collision avoidance warnings, Proceedings of the Human Factors and Ergonomics Society 50th Annual Meeting, 2409-2413. McGehee, D., Brown, T., Lee, J., and Wilson, T. (2002). Effect of warning timing on collision avoidance behavior in a stationary lead vehicle scenario, Transportation Research Record Number 1803, 1-6. Najm, W.G., Smith, J.S.D., and Yanagisawa, M. (2007). Pre-Crash Scenario Typology for Crash Avoidance Research (DOT HS 810 767), Washington, D.C.: U.S. Department of Transportation, National Highway Traffic Safety Administration. Nodine, E, Lam, A., Stevens, S., Razo, M., and Najm, W. (2011). Integrated Vehicle-Based Safety Systems (IVBSS) Light Vehicle Field Operational Test Independent Evaluation (technical report HS-811 516), Boston, MA: Volpe National Transportation Systems Center, US Department of Transportation.

29
Rosario, H., Louredo, M., Diaz, I., Soler, A., Gil, J., Solaz, J., and Jornet, J. (2010). Efficacy and feeling of a vibrotactile frontal collision warning implemented in a haptic pedal, Transportation Research Part F, 13, 90-91. Smith, M. and Zhang, H. (2004). SAfety VEhicles using adaptive Interface Technology (Task 9): A Literature Review of Safety Warning Countermeasures (technical report), Kokomo, IN: Delphi. Society of Automotive Engineers (2012, December). Operational Definitions of Driving Performance Measures and Statistics (draft Recommended Practice J2944, Warrendale, PA: Society of Automotive Engineers. Sugimoto, Y. and Sauer, C. (2005). Effectiveness estimation method for advanced driver assistance system and its application to collision mitigation brake system (paper 05-0148), International Technical Conference on the Enhanced Safety Vehicles Conference. U.S. Department of Transportation (2012). Traffic Safety Facts 2010 (technical report DOT HS 811 659), Washington, DC: U.S. Department of Transportation, National Highway Traffic Safety Administration.


