21
0

0

1
FORWARD-LOOKING INFORMATION In the interest of providing investors with information regarding Inter Pipeline, including management’s current expectations, estimates and projections about the future, certain statements and graphs throughout this presentation contain forward-looking statements or information (collectively referred to as "forward-looking statements") within the meaning of applicable securities legislation. When used in this presentation, the words "may", "would", "should", "could", "will", "intend", "plan", "anticipate", "believe", "estimate", "expect", "continue", "project", "forecast", "target" and similar expressions, as they relate to Inter Pipeline or its management are intended to identify forward-looking statements. Forward-looking statements contained in this presentation relate to, among other things, statements regarding business strategy, plans and other expectations, beliefs, goals, objectives, information and statements about possible future events. Specific forward-looking statements that may be contained in this presentation include statements regarding the ability of Inter Pipeline to maintain its current level of dividends; changes in legislation relating to Inter Pipeline and its structure, including income tax considerations and the treatment of security holders under tax laws; and the composition of the management and Board of Directors of Inter Pipeline; in addition, this presentation may contain forward-looking statements attributed to third-party industry sources. Readers are cautioned not to place undue reliance on such forward-looking statements. Such statements reflect the current views of Inter Pipeline with respect to future events and are subject to certain risks, uncertainties and assumptions that could cause the results of Inter Pipeline to differ materially from those expressed in the forward-looking statements. Factors that could cause actual results to vary from forward-looking information or may affect the operations, performance, development and results of Inter Pipeline's businesses include, among other things: risks and assumptions associated with operations, such as Inter Pipeline's ability to successfully implement its strategic initiatives and achieve expected benefits, including the further development of its oil sands pipeline systems; assumptions concerning operational reliability; the availability and price of labour and construction materials; the status, credit risk and continued existence of customers having contracts with Inter Pipeline and their respective affiliates; availability of energy commodities; volatility of and assumptions regarding prices of energy commodities; competitive factors, pricing pressures and supply and demand in the natural gas and oil transportation, ethane transportation and natural gas liquids (NGL) extraction and storage industries; assumptions based upon Inter Pipeline's current financial and operational guidance; fluctuations in currency and interest rates; inflation; the ability to access sufficient capital from internal and external sources; risks and uncertainties associated with the ability to maintain Inter Pipeline's current level of cash dividends; risks inherent in Inter Pipeline's Canadian and foreign operations; risks of war, hostilities, civil insurrection, instability and political and economic conditions in or affecting countries in which Inter Pipeline and its affiliates operate; severe weather conditions; terrorist threats; risks associated with technology; Inter Pipeline's ability to generate sufficient cash flow from operations to meet its current and future obligations; Inter Pipeline's ability to access external sources of debt and equity capital; general economic and business conditions; the potential delays of and costs of overruns on construction projects, including, but not limited to Inter Pipeline's current oil sands projects and future expansions of Inter Pipeline's oil sands pipeline systems; risks associated with the failure to finalize formal agreements with counterparties in circumstances where letters of intent or similar agreements have been executed and announced by Inter Pipeline; Inter Pipeline's ability to make capital investments and the amounts of capital investments; changes in laws and regulations, including environmental, regulatory and taxation laws, and the interpretation of such changes to laws and regulations; the risks associated with existing and potential future lawsuits and regulatory actions against Inter Pipeline and its affiliates; increases in maintenance, operating or financing costs; availability of adequate levels of insurance; difficulty in obtaining necessary regulatory approvals and maintenance of support of such approvals; the inability to meet or continue to meet listing requirements of the TSX; and such other risks and uncertainties described from time to time in Inter Pipeline's reports and filings with the Canadian securities regulatory authorities. The impact of any one assumption, risk, uncertainty or other factor on a particular forward-looking statement is not determinable with certainty, as these are interdependent and Inter Pipeline's future course of action depends on management's assessment of all information available at the relevant time. See "Risk Factors" in the Management's Discussion and Analysis of Inter Pipeline's operating results for the years ended December 31, 2015 and 2014 and other reports and filings available at www.sedar.com. Although the forward-looking statements contained in this presentation are based upon what management believes to be reasonable assumptions, there can be no assurance that actual results will be consistent with these forward-looking statements. The forward-looking statements contained, or incorporated by reference, herein are expressly qualified in their entirety by this cautionary statement. The forward-looking statements included, or incorporated by reference, in this presentation are made as of the date hereof and Inter Pipeline undertakes no obligation to publicly update such forward-looking statements to reflect new information, subsequent events or otherwise, except as required by applicable securities laws. You are further cautioned that the preparation of financial statements in accordance with GAAP requires management to make certain judgments and estimates that affect the reported amounts of assets, liabilities, revenues and expenses. These estimates may change, having either a negative or positive effect on net earnings as further information becomes available and as the economic environment changes. GAAP and Non-GAAP Measures – In addition to providing measures prepared in accordance with GAAP this presentation may contain references to non-GAAP measures as identified herein. These measures do not have any standardized meaning prescribed by GAAP and therefore may not be comparable to similar measures presented by other entities. Investors are cautioned that non-GAAP and additional GAAP financial measures should not be construed as alternatives to other measures of financial performance calculated in accordance with GAAP. References to the term “EBITDA” used in this presentation may include EBITDA or adjusted EBITDA. The most closely related GAAP and non-GAAP measures are defined in Inter Pipelines’ most recent Management Discussion and Analysis available at www.interpipeline.com. Industry Data - Certain market, independent third party and industry data contained in this presentation is based upon information from government or other independent industry publications and reports or based on estimates derived from such publications and reports. Government and industry publications and reports generally indicate that they have obtained their information from sources believed to be reliable, but do not guarantee the accuracy or completeness of their information. This presentation also includes certain data, including information on export and refining capacity, supply and demand for certain commodity types and total remaining established oil sands reserves, and other operational results, derived from public filings made by independent third parties. While Inter Pipeline believes this data to be reliable, market and industry data is subject to variations and cannot be verified with complete certainty due to limits on the availability and reliability of raw data, the voluntary nature of the data gathering process and other limitations and uncertainties inherent in any statistical survey. Inter Pipeline has not independently verified any of the data from independent third party sources referred to in this presentation or ascertained the underlying assumptions relied upon by such sources.

2
INTER PIPELINE
• Operates world scale energy infrastructure assets
• Stable in an uncertain market with strong balance sheet and investment grade credit rating
• Sustainable dividend profile with upside growth potential
• Well positioned to capitalize on future growth opportunities
3
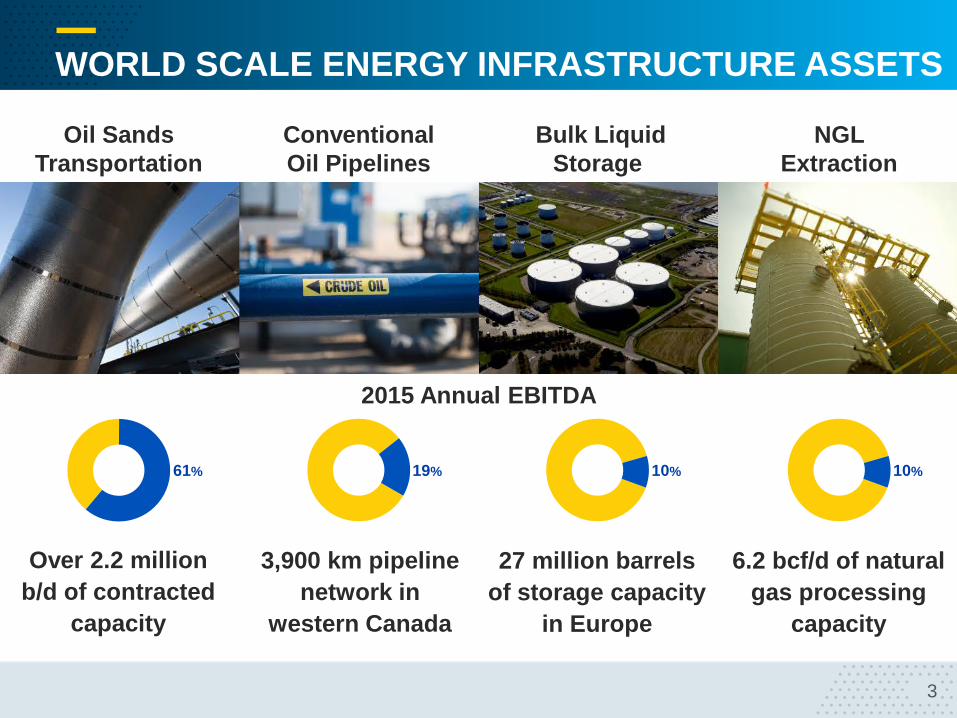
WORLD SCALE ENERGY INFRASTRUCTURE ASSETS
Over 2.2 million b/d of contracted
capacity
Bulk Liquid Storage
3,900 km pipeline network in
western Canada
27 million barrels of storage capacity
in Europe
Oil Sands Transportation
Conventional Oil Pipelines
NGL Extraction
6.2 bcf/d of natural gas processing
capacity
61% 19% 10% 10%
2015 Annual EBITDA

4
LOW RISK BUSINESS STRATEGY
DIVERSIFIED INFRASTRUCTURE ASSETS • Large-scale and
strategically located • Capital-efficient growth
opportunities
OPERATIONAL EXCELLENCE • Top EH&S performance
and reliability • Industry leading project
execution
STRONG FINANCIAL POSITION • Solid balance sheet • Excellent access to
capital markets • BBB+ credit rating
LIMITED COMMODITY PRICE EXPOSURE • 93% of EBITDA from
cost of service and fee based contracts
• Majority investment grade counterparties
DIVIDEND STABILITY
13 consecutive dividend increases
5–year dividend CAGR ~10%

5
DIVIDEND GROWTH
2016F based on actual dividends to April 2016 and $0.13/share per month thereafter
$/Share
10.0% CAGR 2011-2016F
6.9% CAGR 2006-2016F
$0.80$0.84 $0.84 $0.85
$0.91$0.97
$1.06
$1.18
$1.32
$1.49$1.56
2006 2007 2008 2009 2010 2011 2012 2013 2014 2015 2016F

6
DIVIDEND STABILITY
FFO is attributable to shareholders and before sustaining capital; corporate costs have been allocated based on IPL assumptions
$ Million
0
250
500
750
2010FFO
2010Dividend
2011FFO
2011Dividend
2012FFO
2012Dividend
2013FFO
2013Dividend
2014FFO
2014Dividend
2015FFO
2015Dividend
Oil Sands Transportation Conventional Oil Pipelines Bulk Liquid Storage NGL Extraction

7
OIL SANDS TRANSPORTATION
• Three major oil sands pipeline systems with combined ultimate capacity of 4.6 million b/d
• Corridor
• Cold Lake*
• Polaris
• Over 3,300 km of pipeline and 3.8 million barrels of storage
• Long term cost of service agreements
• Substantial available capacity for 3rd party growth projects
*85% ownership in Cold Lake pipeline system; see forward-looking information
AOSP IMPERIAL KEARL HUSKY SUNRISE
SUNCOR
AOC HANGINGSTONE
JACOS / NEXEN HANGINGSTONE
FCCL NARROWS LAKE
FCCL CHRISTINA LAKE
CNR KIRBY SOUTH
FCCL FOSTER CREEK OSUM ORION IMPERIAL COLD LAKE
CNR PRIMROSE / WOLF LAKE
BRUDERHEIM FACILITY

8
$0
$50
$100
$150
$200
$250
ATTRACTIVE “BOLT-ON” PROJECT MULTIPLES
• Over $430 million in announced bolt-on oil sands connections
• 8 connections with an average EBITDA multiple of ~3.0x
• Identified growth opportunities largely composed of bolt-on projects
EBITDA Multiple Range
< 2.0x 2 PROJECTS
2.1x – 4.0x 4 PROJECTS
4.1x – 6.0x 2 PROJECTS
Total Capital ($ Million)

9
COMPETITIVE ADVANTAGE
Less regulatory
risk
Less capital
risk
Less schedule
risk
Greater flexibility to
accommodate small & large scale projects

10
CONVENTIONAL OIL PIPELINES
• 3,900 km of oil pipelines servicing over 100 producers
• 100% fee based business, excluding midstream marketing
• Growing production from Viking formation
• $65 million Kerrobert storage project underway

11
CONVENTIONAL THROUGHPUT 000’s b/d
205
187 176 170 165 169
196 212
129113 110 108 107 98 101 100
3333 33 36 41 54
68 78
34
23 22 26 28 3537
34
0
25
50
75
100
125
150
175
200
225
2008 2009 2010 2011 2012 2013 2014 2015Bow River Mid-Saskatchewan Central Alberta

12
BULK LIQUID STORAGE
• 16 petroleum and petrochemical storage terminals
• Approximately 27 million barrels of storage capacity
• Fee based revenue structure
• Average utilization rate of 94%*
• Successful integration of Vopak Sweden acquisition
*Year ended December 31, 2015
Shannon
Immingham West
Tyne
Riverside
Immingham East
TLG North TLG South
Ensted
Asnaes
Gulfhavn
Malmo
Gavle
Sodertalje Gothenburg
Stigsnaes
IRELAND
ENGLAND GERMANY
SWEDEN
DENMARK Seal Sands

13
NGL EXTRACTION • Three large scale extraction
plants produced 101,700 b/d of NGL’s*
• Strategically located on the TransCanada Alberta system
• Largest ethane producer in Canada
• Investment grade customers:
*Year ended December 31, 2015; **50% working interest in the Empress V facility
Cochrane Extraction Plant 2.5 bcf/d Capacity
Empress II & V** Extraction Plants 3.7 bcf/d Capacity

14

15
0%
10%
20%
30%
40%
50%
60%
70%
2010 2011 2012 2013 2014 2015
Fixed Rate Recourse Debt
Floating Rate Recourse Debt
FINANCIAL DISCIPLINE
*Based on book values
Committed to maintaining our investment grade credit ratings of BBB (high) by DBRS and BBB+ by S&P
Total Recourse Debt* as at December 31, 2015
Consolidated Net Debt to Total Capitalization
Covenant: Max 65%
~33%
~67%
16
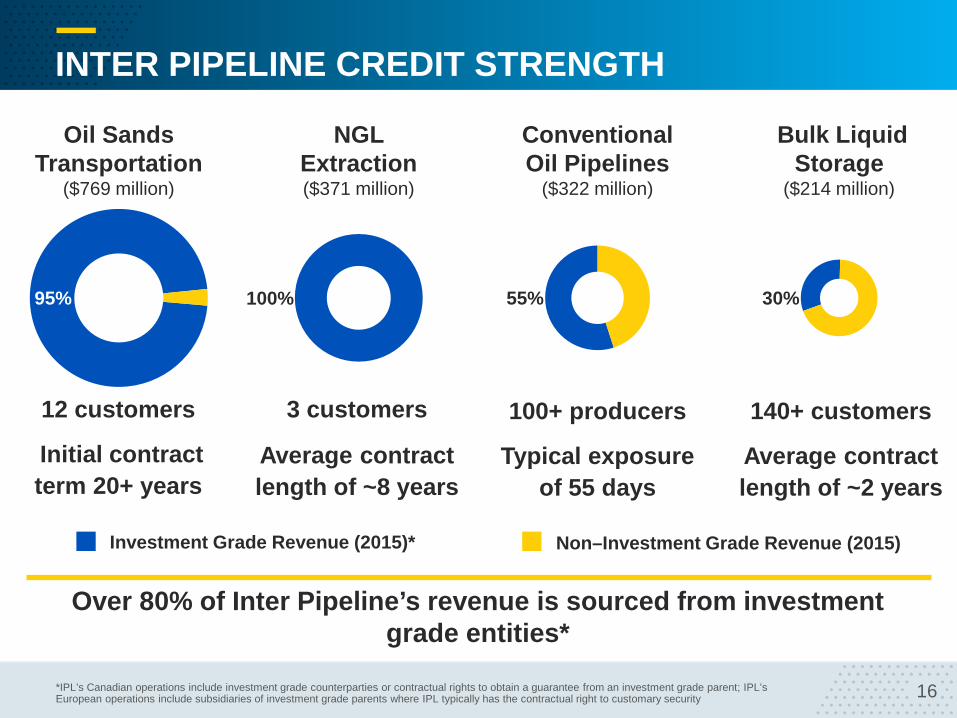
Bulk Liquid Storage
($214 million)
Oil Sands Transportation
($769 million)
Conventional Oil Pipelines
($322 million)
NGL Extraction ($371 million)
INTER PIPELINE CREDIT STRENGTH
95% 55% 30% 100%
Investment Grade Revenue (2015)* Non–Investment Grade Revenue (2015)
12 customers
Initial contract term 20+ years
100+ producers
Typical exposure of 55 days
140+ customers
Average contract length of ~2 years
3 customers
Average contract length of ~8 years
*IPL’s Canadian operations include investment grade counterparties or contractual rights to obtain a guarantee from an investment grade parent; IPL’s European operations include subsidiaries of investment grade parents where IPL typically has the contractual right to customary security
Over 80% of Inter Pipeline’s revenue is sourced from investment grade entities*

17
EBITDA BY BUSINESS SEGMENT $ Million
$0
$100
$200
$300
$400
$500
$600
$700
$800
$900
$1,000
2005 2006 2007 2008 2009 2010 2011 2012 2013 2014 2015Oil Sands Transportation Conventional Oil Pipelines Bulk Liquid Storage NGL Extraction
18
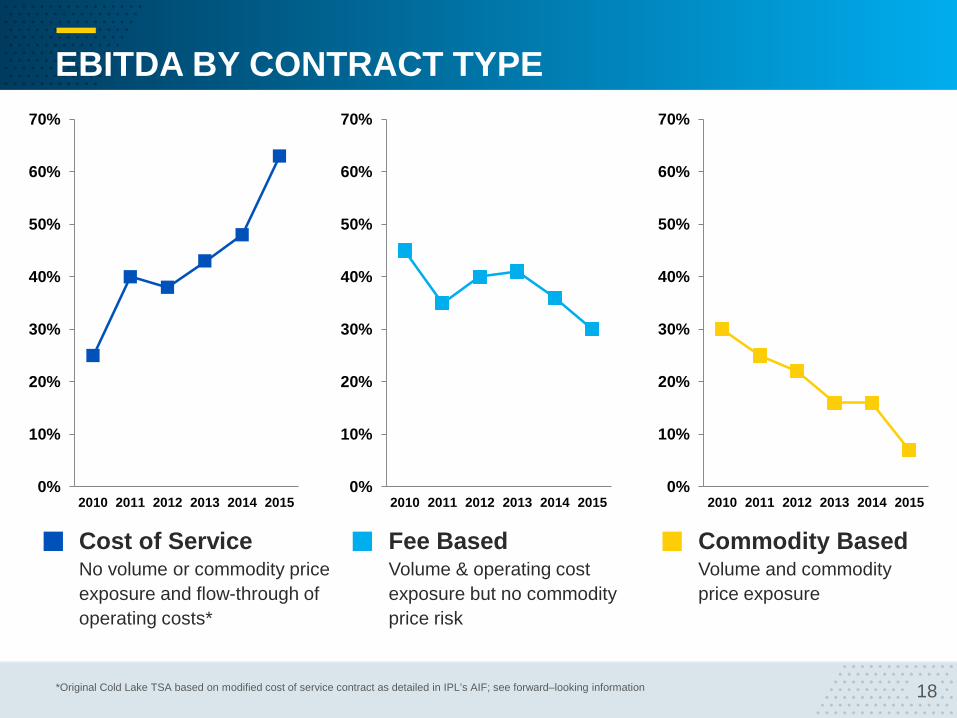
EBITDA BY CONTRACT TYPE
*Original Cold Lake TSA based on modified cost of service contract as detailed in IPL’s AIF; see forward–looking information
Cost of Service No volume or commodity price exposure and flow-through of operating costs*
Fee Based Volume & operating cost exposure but no commodity price risk
Commodity Based Volume and commodity price exposure
0%
10%
20%
30%
40%
50%
60%
70%
2010 2011 2012 2013 2014 20150%
10%
20%
30%
40%
50%
60%
70%
2010 2011 2012 2013 2014 20150%
10%
20%
30%
40%
50%
60%
70%
2010 2011 2012 2013 2014 2015

19
LOOKING FORWARD • Solid track record of increasing
shareholder value
• Continued focus on developing potential growth opportunities
• Cost of service contracts expected to continue to generate majority of future cash flow
• Fee-based and cost of service cash flow alone should support future dividends
• Well positioned to sustain dividends with upside growth potential

20 20
CONTACT INFORMATION
SUITE 3200, 215 – 2ND STREET SW CALGARY, ALBERTA T2P 1M4
PHONE: 1 866 716 7473 PHONE: (403) 290 6000 FAX: (403) 290 6090 WEB: INTERPIPELINE.COM


