31
Guide to forward-looking information Don’t fear the future: communicating with confidence* Corporate Reporting *connectedthinking pwc

Guide to forward-looking informationDon’t fear the future:communicating with confi dence*
Corporate Reporting
*connectedthinking pwc
Evolving good practices in corporate reporting should provide investors with far
greater transparency on a company’s internal performance targets and how management
assesses the company’s performance against those targets. This publication provides very useful guidance on how management can
provide the information valued by investors, in a practical way.
Lindsay TomlinsonVice-Chairman, Barclays Global Investors Europe
I have for many years urged companies to use the narrative aspects of their reporting in as an imaginative and informative way as possible so that they may provide their
investors with real insight into their business and the strategies that they as Management
have adopted. I welcome this publication as a powerful contribution to helping make
this a reality.
Tony GoodChair of Accounting Advocacy,
UK Society of Investment Professionals

This publication contains certain text and information extracted from third party documentation and so being out of context from the original third party documents; readers should bear this in mind when looking at this publication. The copyright in such third party text and information remains owned by the third parties concerned, and PricewaterhouseCoopers expresses its sincere appreciation to these companies for having allowed it to feature their information. For a more comprehensive view on each company’s communication, please read the entire document from which the extracts have been taken. Please note that the inclusion of a company in this publication does not imply any endorsement of that company by PricewaterhouseCoopers nor any verifi cation of the accuracy of the information contained in any of the examples.
This publication has been prepared for general guidance on matters of interest only, and does not constitute professional advice. You should not act upon the information contained in this publication without obtaining specifi c professional advice. No representation or warranty (express or implied) is given as to the accuracy or completeness of the information contained in this publication, and, to the extent permitted by law, PricewaterhouseCoopers LLP, its members, employees and agents accept no liability, and disclaim all responsibility, for the consequences of you or anyone else acting, or refraining to act, in reliance on the information contained in this publication or for any decision based on it.
© 2007 PricewaterhouseCoopers LLP. All rights reserved. ‘PricewaterhouseCoopers’ refers to PricewaterhouseCoopers LLP (a limited liability partnership in the United Kingdom) or, as the context requires, other member fi rms of PricewaterhouseCoopers International Limited, each of which is a separate and independent legal entity.
Introduction
The corporate reporting debate is gathering pace worldwide whether in the form of legal requirements, guidance or evolving good practices. Aspects of this debate are, understandably, causing concern amongst preparers of annual reports. Not least of these is the provision of a “forward-looking orientation” which, in our experience, many companies fi nd a real challenge. But what does this mean in practice? Will it require providing competitively-sensitive information? What about the reliability of such forward-looking information? Will companies face the threat of litigation? Will this mean making profi t forecasts?
Put simply, the reporting of forward-looking information is a critical component of effective communication to the market and this “how to” guide has been developed to provide practical guidance on how it can be achieved.
This guide is not just a theoretical paper – progressive companies worldwide are already adopting a forward-looking orientation in their corporate reporting.
To bring forward-looking reporting alive, we have included a collection
of examples from some of these companies that demonstrate aspects of what we believe is effective communication of the future that others can learn from.
So regardless of whether it is described as a management discussion and analysis, operating and fi nancial review, or something else, the issue remains “how well does your reporting articulate the direction of travel, in relation to the markets in which you operate, your chosen strategy and the performance that is delivered?”

As a strong supporter of broader corporate reporting, CIMA has an active interest
in ensuring that concerns of companies surrounding exposure to litigation do not result in boilerplate statements. This publication provides companies with a practical approach to reporting
appropriate forward-looking information.
Charles TilleyChief Executive, Chartered Institute of Management Accountants
1
Contents
Page
Why the future matters 2A change in mindset towards reporting
A view of the future 5Going beyond historical fi nancial reporting
Forward-looking information 6Putting the concerns into perspective
Facing up to the challenge 9Realising the benefi ts
Making it happen 10The seven pillars for effective communication of the future
Bringing the seven pillars alive 14Practical examples of reporting on the future

2
Why the future matters
Companies worldwide are increasingly being encouraged to place an emphasis on providing a more forward-looking orientation in their reporting whether through regulatory requirements, guidance or evolving good practice. This has raised a number of concerns amongst companies. Some fear that the publication of forward-looking information could compromise competitive advantage. Others think the quality of information provided could provoke legal and regulatory sanctions. Yet those companies who approach reporting with the right mindset – one of transparency, not merely a perceived response to increasing red tape, will have a real opportunity to leverage their reporting to increase investor understanding.
Increasing demands for a view of the future
A change in mindset towards reporting
An overview of some of the worldwide regulatory requirements and good practice guidance is shown in Exhibit 1 below:
GUIDANCE
Global
“MC should have an orientation to the future” – IASB discussion paper on Management Commentary (published October 2005)
“The purpose of the MD&A is to provide management’s… assessment of factors and trends which are anticipated to have a material effect on the company’s fi nancial condition and results of operations in the future” – International Organization of Securities Commissions (IOSCO) General Principles Regarding Disclosure of Management’s Discussion and Analysis of Financial Condition and Results of Operations (published February 2003)
Australia“…the Review should also address known trends and those factors relevant to forming a view as to likely future performance” - Group of 100’s Guide to review of operations and fi nancial condition (published 1998, updated 2003)
Canada“A forward-looking orientation is fundamental to useful MD&A reporting” - CICA guidance on MD&A disclosure ((published November 2002, updated May 2004)
United Kingdom“The OFR should have a forward-looking orientation, identifying those trends and factors relevant to the members’ assessment of the current and future performance of the business and the progress towards the achievement of long-term business objectives.” – Accounting Standards Board Reporting Statement: Operating and Financial Review (published January 2006)
United States“One of the principal objectives of MD&A is to provide information about the quality and potential variability of a company’s earnings and cash fl ow, so that readers can ascertain the likelihood that past performance is indicative of future performance.” – SEC Guidance Regarding Management’s Discussion and Analysis of Financial Condition and Results of Operations (published December 2003)
LEGISLATION
Germany
“The main factors which could infl uence changes in the value of the enterprise in the future should be disclosed and discussed” – German Accounting Standard 15, Management Reporting (adopted December 2004)
United Kingdom
“…the main trends and factors likely to affect the future development, performance and position of the company’s business” – Companies Act 2006 Section 471 (date of implementation tbc)
Exhibit 1: Examples of legislation & guidance on forward-looking information

3
Fear of the future
“Telling the future by looking at the past assumes that conditions remain constant. This is like driving a car by looking in the rear-view mirror.” Herb Brody
Many companies fear the increasing demand for forward-looking information will force them to disclose competitively-sensitive information, make profi t forecasts or expose themselves to the threat of litigation. However, companies need to understand what the demand for this forward-looking information really means.
The danger is that, without such an understanding, they will take fright at the call for ‘forward-looking’ statements, taking refuge instead in bland and highly-caveated
reviews that provide no benefi ts to investors, or to the companies themselves. Like any new initiatives, these demands will bring a number of risks for companies that fail to prepare adequately for them. But it should also bring real business benefi ts, notably: enhanced business understanding, governance and board effectiveness; improved relationships with key stakeholders; and heightened effi ciencies fl owing from the proper alignment of reporting and communications strategies.
Giving investors what they need
Transparent information on current and future corporate performance is the raw material of effective decision-making in the capital markets. This is demonstrated by the comments highlighted in this section, all drawn from research conducted by PricewaterhouseCoopers with buy- and sell-side analysts.
As things stand, existing fi nancial statements are not, of themselves, suffi cient to meet the needs of investors to assess the quality and sustainability of corporate performance. The current reporting status quo is unsatisfactory. Investors know this – and so do the regulators.
I couldn’t stress more the two things that I spend most of my time doing: trying to
understand what’s happening to the underlying business
and getting any help I can to understand how it will look in
fi ve to ten years’ time.

4
Giving investors what they need (continued)
… As much forward-looking information as possible. That’s
the most interesting thing.
…But really what we are trying to do is to get a view of the economic picture of the
company and how that is going to change into the future.
In its ‘Framework for the Preparation and Presentation of Financial Statements’ the International Accounting Standards Board (IASB) says:
“The objective of fi nancial statements is to provide information about the fi nancial position, performance and changes in fi nancial position of an entity that is useful to a wide range of users in making economic decisions.”
“Financial statements prepared for this purpose meet the common needs of most users. However, fi nancial statements do not provide all information that investors may need to make economic decisions since they largely portray the fi nancial effects of past events and do not necessarily provide non-fi nancial information.”
The rest of this guide will highlight:
The issues and challenges facing companies tasked with providing forward-looking information.
Offer some practical ideas on how companies might success-fully meet the needs of investors, whilst addressing regulations and good practice guidance, and
Provide examples, drawn from companies reporting worldwide, that demonstrate how some have genuinely embraced the spirit of providing a forward-looking orientation
5
A view of the future
Determining what is required
Going beyond historical fi nancial reporting
There are no hard and fast rules dictating what forward-looking information a company must provide. Companies must decide which information to include – and which to leave out – on the basis of their own unique business dynamics and those of the industry sectors in which they operate. Our companion ‘Preparers’ Guide’ goes into further detail on what should be considered in reaching this decision.
However, the provision of a forward-looking orientation will mean identifying and communicating whatever trends and factors are relevant to an investor’s assessment of current and future business performance. It also means communicating the progress that has been made towards achieving long-term business objectives.
Relevant factors will be those that have affected a company’s development, performance and position during the fi nancial year – as well as those likely to affect its future development, performance and position. These might include the development of new products and services, current and planned levels of investment expenditure, and clear explanations of how that expenditure is to be used to achieve business objectives.
In forming a view on what to report, companies should also consider whether robust, quantifi able fi nancial and non-fi nancial key performance indicators (KPIs) are available to support whatever assertions have been made and, to the extent necessary, whether they should be disclosed. Assuming that they are, good practice would also encourage the inclusion of information on future targets. As we explain later, however, this does not mean that profi t forecasts must be provided.
Despite a recognition that investors need more forward-looking information very few companies come close to providing the breadth of information required. Instead of providing a clear and balanced discussion of the trends and factors likely to impact future prospects, Companies have continued to take refuge behind historical information. From now on, given the increasing demand for a more forward-looking orientation in companies reporting, a different approach will be called for.

6
Forward-looking information Putting the concerns into perspective
Frequently-voiced concerns
Amongst the most commonly-heard concerns provoked by the increasing demand for a forward-looking orientation, the following stand out:
Does this mean having to provide potentially competitively-sensitive information?
What can be done to ensure the supportability of forward-looking information?
Does this mean that we have to publish profi t forecasts?
The following sections address each of these concerns.
The ever increasing demand for forward-looking information has raised a number of frequently-voiced concerns amongst companies (see below). The fact is that, by concentrating too closely on these perceived risks, real opportunities are being overlooked. The value, for companies, of providing a clear forward-looking picture lies in the potential it has to challenge internal perceptions and reporting, as well as the insights that it provides investors into the health and sustainability of the business and the way in which it helps put fi nancial performance into context.
In seeking to avoid these demands for a forward-looking orientation the danger is that companies may miss out on these benefi ts. By resorting to bland statements, these companies will do nothing to enhance investors’ understanding of their business, while exposing themselves to a potential loss of competitive advantage if competitors steal a march with their reporting.

7
Competitively-sensitive information
For any company, there will be certain information which – were it to be disclosed – would undermine its market position. However, this should not be seized upon as a convenient smokescreen for avoiding full and frank disclosure.
Companies need to approach the disclosure of forward-looking information with the right mindset. Instead of adopting a compliance-based approach and asking ‘What are we going to report?’, companies need to ask themselves: ‘What should we withhold?’. For example, pharmaceutical companies disclose details of their products – in terms of pipeline, stage of development, planned launch and potential
market size – without prejudicing their competitive position. Specifi c information on the underlying patent formulations is withheld. With this approach, they provide investors with information which is critical to understanding the sustainability of their performance, without compromising the interests of the company.
Arriving at a balancing point between disclosing and withholding forward-looking information needs to be a realistic process. In reality, competitors are already likely to be better informed than people realise, as the fl ow of people and information from one organisation to another has never been greater.
Supportability of forward-looking information
Clearly, forward-looking information cannot, by its nature, be 100% supportable. But companies that attempt to rely on this as a reason for opting out of providing a forward-looking orientation are missing the point. Forward-looking information is different from information found
in historical fi nancial statements. Because it is based on assumptions that might prove to be wrong (rather than being based on actual facts), there is no expectation that it should be 100% accurate.

8
What about profi t forecasts?
Concerns are often raised that communicating about future prospects means providing profi t forecasts with all the additional regulatory attention that such information can attract and the potential for short-term pressure to meet those forecasts rather than focus on value delivery.
However, with due consideration given to local regulations, forward-looking information can be provided without specifi c reference to profi ts, looking instead to the broader picture of the company shown by contextual information.
Non-fi nancial drivers of performance can be used as lead indicators of future fi nancial performance. Similarly, market trends and clearly presented strategic priorities will provide investors with valuable insights on which to base their investment decisions. And, of course, targets for these non-fi nancial drivers and market trends can also be important aspects of this information, communicating companies’ aspirations to the market – without straying into the realms of profi t forecasts.
Failure to do so can mean investors relying on historical fi nancial performance, thereby exacerbating ‘short-termism’.
Obviously though, the fact that information has been disclosed may raise an expectation of reliability in investors. Companies are therefore expected to scrutinise whatever evidence has been used to underpin this information and, where appropriate, to explain its source and the extent to which it is objectively supportable.
The overall intention is for investors to assess this information themselves before deciding whether or not to rely on it. For them to do so effectively, it is important that they should have a clear understanding of how certain (or uncertain) it is.
Supportability of forward-looking information(continued)

9
Facing up to the challenge Realising the benefi ts
Nothing to fear – much to gain
Businesses that are well run on the basis of comprehensive and accurate information about all aspects of their operations have nothing to fear from providing forward-looking information. Indeed, they have much to gain. Provided management can adopt the right mindset – one of transparency, communicating fi nancial and non-fi nancial information as a way of increasing genuine market understanding of the business and its sources of value – they have an opportunity to secure signifi cant competitive edge.
If they take advantage of this opportunity, they will be able to:
improve the quality of management by making sure the information that really matters is available, aired and acted upon at board level;
help stakeholders to differentiate good management from bad, judgement from luck;
simplify and clarify their corporate reporting, particularly where the presentation of non-fi nancial information is concerned; and
start to move beyond the ‘earnings game’, where a company is only considered to be as good as its latest fi gures.

10
Making it happen
The seven pillarsfor effective communication of the future

11
Explain the resources available to your company that help to attain your objectives and how they are managed.
Describe the principal risks and uncertainties that may affect your company’s long-term value or prospects.
Clarify the signifi cant relationships with stakeholders that are likely to infl uence the performance of your company and its value.
Provide quantifi ed data relating to trends and factors likely to affect your company’s future prospects.
Spell out any uncertainties underpinning forward-looking information.
Communicate targets relating to those key performance indicators (KPIs) used to manage your business.
Demonstrate the linkage of other content areas within your reporting to your longer-term objectives and the strategies to achieve those objectives.
2
1
3
4
5
6
7
12
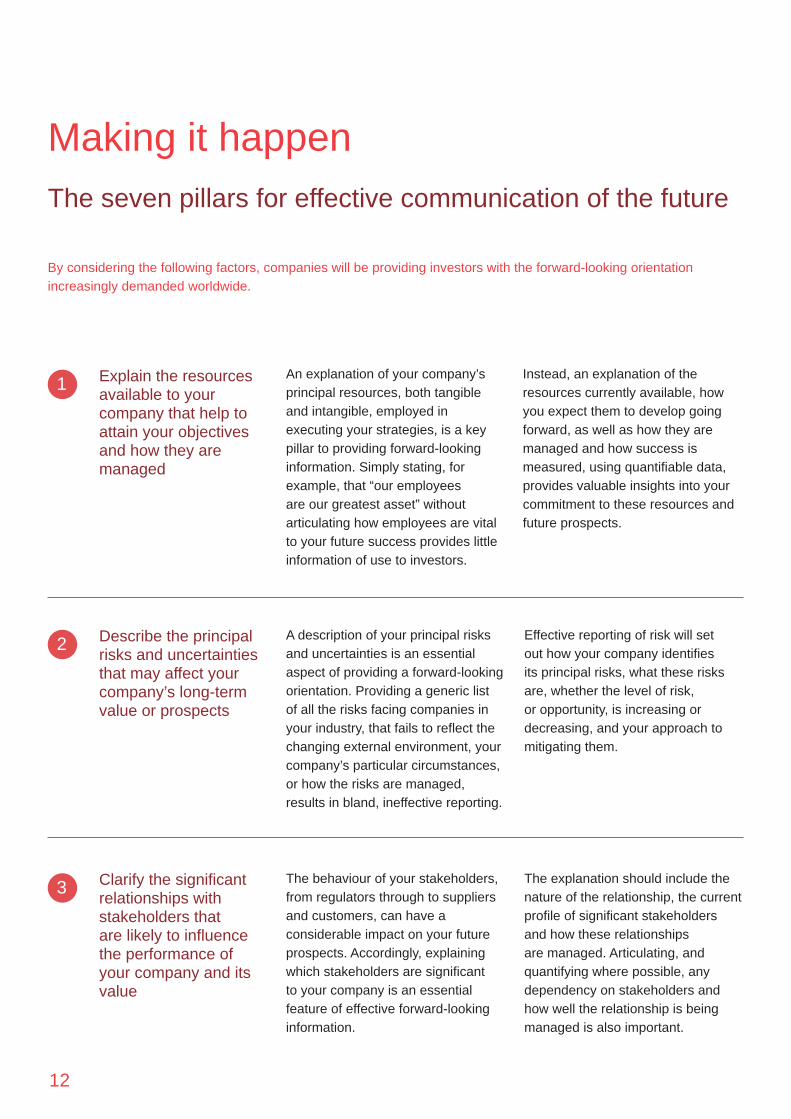
Making it happenThe seven pillars for effective communication of the future
By considering the following factors, companies will be providing investors with the forward-looking orientation increasingly demanded worldwide.
Explain the resources available to your company that help to attain your objectives and how they are managed
Describe the principal risks and uncertainties that may affect your company’s long-term value or prospects
A description of your principal risks and uncertainties is an essential aspect of providing a forward-looking orientation. Providing a generic list of all the risks facing companies in your industry, that fails to refl ect the changing external environment, your company’s particular circumstances, or how the risks are managed, results in bland, ineffective reporting.
Effective reporting of risk will set out how your company identifi es its principal risks, what these risks are, whether the level of risk, or opportunity, is increasing or decreasing, and your approach to mitigating them.
Clarify the signifi cant relationships with stakeholders that are likely to infl uence the performance of your company and its value
The behaviour of your stakeholders, from regulators through to suppliers and customers, can have a considerable impact on your future prospects. Accordingly, explaining which stakeholders are signifi cant to your company is an essential feature of effective forward-looking information.
The explanation should include the nature of the relationship, the current profi le of signifi cant stakeholders and how these relationships are managed. Articulating, and quantifying where possible, any dependency on stakeholders and how well the relationship is being managed is also important.
1
2
3
An explanation of your company’s principal resources, both tangible and intangible, employed in executing your strategies, is a key pillar to providing forward-looking information. Simply stating, for example, that “our employees are our greatest asset” without articulating how employees are vital to your future success provides little information of use to investors.
Instead, an explanation of the resources currently available, how you expect them to develop going forward, as well as how they are managed and how success is measured, using quantifi able data, provides valuable insights into your commitment to these resources and future prospects.

13
Provide quantifi ed data relating to trends and factors likely to affect your company’s future prospects
Analysing current and future development, performance and position of any company is impractical without the provision of relevant contextual information, including the quantifi cation of appropriate trends and factors impacting the business.
Whether these are, for example, demographics for an insurance company, buying habits for a consumer products company, or raw material costs for a manufacturing company, quantifying prospective trends provides investors with a better understanding of the environment your company operates in.
Communicate targets relating to those key performance indicators (KPIs) used to manage your business
A simple narrative description of the key resources, risks and relationships that are fundamental to the successful implementation of your strategies is not suffi cient. It is only by providing the KPIs used by you in managing your business that investors will be able to assess the potential for your strategy to succeed.
For each KPI, trend information should be provided, including information for at least the current and prior year, along with quantifi cation and/or commentary on future targets.
Spell out any uncertainties underpinning forward-looking information
Forward-looking information cannot, by its nature, be 100% supportable.
Where appropriate, you should explain the source of the information and any uncertainties, to allow
investors to assess for themselves the extent to which they wish to rely on the information. Further, you might consider providing a statement of caution.
Demonstrate the linkage of other content areas within your reporting to your longer-term objectives and the strategies to achieve those objectives
A key objective of reporting is to help investors assess the strategies adopted and their potential to succeed.
Accordingly, it is essential you demonstrate and communicate how the external environment, and management of resources, risks and relationships, underpins the achievement of your objectives and strategies. These elements are related and should not be presented in isolation.
4
5
6
7
14
Bringing the seven pillars alivePractical examples of reporting on the future
Real-life examples
The importance of alignment and linkage
Some companies are already incorporating the spirit of a forward-looking orientation into their annual reporting, publishing broad-based information that provides valuable insights into the sustainability of their business performance – succinctly, effectively and persuasively. In the following pages we set out examples from the reporting of some of these companies. While no single company has communicated their view of the future across all seven pillars,
these examples clearly demonstrate that each company has genuinely embraced the spirit of providing a forward-looking orientation by reporting one, or more, of the seven pillars of effective reporting on the factors affecting future business performance.
We urge you to look through the following good practice extracts to get a feel for what is already being achieved by progressive companies.
Although we have set out seven pillars, each of these pillars should not be considered in isolation. Each one represents a logical building block for effective communication of the future.
The challenge for companies is to communicate their view of the future across all pillars relevant to their business, thereby demonstrating a forward-looking orientation in a consistent and coherent way.

15
21
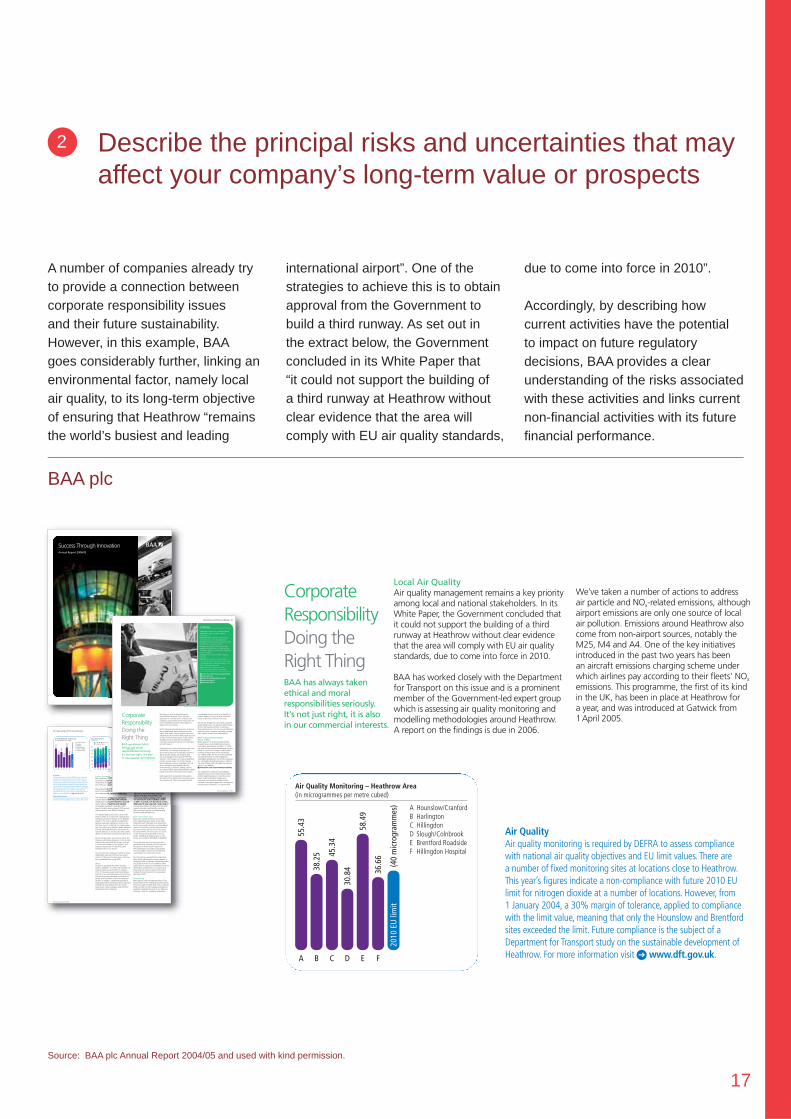
Describe the principal risks and uncertainties that may affect your company’s long-term value or prospects
A number of companies already try to provide a connection between corporate responsibility issues and their future sustainability. However, in this example, BAA goes considerably further, linking an environmental factor, namely local air quality, to its long-term objective of ensuring that Heathrow “remains the world’s busiest and leading
international airport”. One of the strategies to achieve this is to obtain approval from the Government to build a third runway. As set out in the extract below, the Government concluded in its White Paper that “it could not support the building of a third runway at Heathrow without clear evidence that the area will comply with EU air quality standards,
BAA plc
Source: BAA plc Annual Report 2004/05 and used with kind permission
due to come into force in 2010”.
Accordingly, by describing how current activities have the potential to impact on future regulatory decisions, BAA provides a clear understanding of the risks associated with these activities and links current non-fi nancial activities with its future fi nancial performance.
2
How to get the most out of the real-life examples
The accompanying illustration serves as a guide for “reading” the examples found in the following pages.
To the companies that allowed us to feature their work, PricewaterhouseCoopers expresses its sincere appreciation.
PricewaterhouseCoopers’ commentary on the extracts presented. The
comments indicate how each example demonstrates the characteristics of the
featured pillar
Images of the front cover and selected pages of the document from which the
extracts are taken. The extracts may also have been taken from pages not
shown as separate images
Extracts selected to illustrate the featured pillar
Company name and source of information shown

16
Explain the resources available to your company that help to attain your objectives and how they are managed
Many companies give general statements about “their important assets”, for example, customers and people, but without explanations of how those resources will help them attain their objectives. However, in this example, British Land clearly identifi es active development of the Group property portfolio as
key to enhancing property returns and thereby long-term growth in shareholder value.
British Land goes on to quantify its development prospects, including the potential impact on future rental income.
The British Land Company PLC
Development prospects, as shown below, are those sites and properties
where we have identified opportunities and are progressing with design,
planning applications and site preparation for development projects. For
example, at The Leadenhall Building a detailed planning consent has
been obtained for a new 47 storey tower to provide 55,800 sq m
(601,000 sq ft) of office accommodation; that is three times the floor
space of the existing building.
Development prospects
Sq ft Cost
Project Sector 000 £m1 Planning
201 Bishopsgate City office 836 279 Revised
submitted
The Leadenhall Building City office 601 270 Detailed
Ludgate West City office 123 47 Detailed
Regent’s Place West End 1,036 370 Osnaburgh
office/ submitted
Residential NEQ pending
Blythe Valley Park Business Park 751 115 Outline/Detailed
New Century Park Business Park/ 657 88 Outline
Distribution
Meadowhall Casino Leisure 409 124 Pending
Theale Residential 254 46 Submitted
Daventry (BLR) Distribution 335 5 Outline
Redditch (BLG) Distribution 227 4 Detailed
Total 5,229 1,348
We have planning permission for 58% of the development prospects for
commercial properties which, if they were built at a total cost to the Group
of £529 million and fully let, would add further rental income of some
£60 million per annum at current market rental values. This does not
include 201 Bishopsgate where we have an existing permission but are
in the process of seeking a revised planning consent for 77,630 sq m
(835,600 sq ft).
At current market rents, if all these development prospects were
completed and let, they would add a further £151 million per annum
to rental income.
1 estimated costs of construction excluding land and interest costs
Based on Group and 50% share of JVs (except areas which are at 100%)
Property development risk
Principal risk
Letting risk for speculative developments; construction cost and time
overruns; adverse changes in planning and/or planning policy which
may cause delay and affect profitability.
Principal control
These include limiting the amount of speculative development;
assessing letting potential and prospective profitability of developments
prior to commencement of construction; on-going assessment of
development expenditure by quantity surveyors with regular compari-
sons of costs against budget; and ensuring executives are kept up to
date with planning policies.
We held a number of briefing sessions with owners and occupiers
of neighbouring properties to ensure that they were fully informed
and understood the scheme, and that we could take into account any
concerns they may have. For example we met with two neighbouring
churches who raised concerns about construction noise and its impact
on church services. We reassured them that when services are taking
place the noisiest activities would be kept to a minimum.
Obtaining planning permissions for the Company’s development
programme is a complex and expensive process involving many
organisations and expert consultants.
The professional expertise needed, from architects, engineers,
ecologists, environmental consultants and other specialist consultants
means that securing planning permissions gets more expensive
every year.
Focusing on one particular planning application, the proposal for
the redevelopment of 122 Leadenhall Street in the City of London cost
some £5 million alone, demonstrating the technical expertise and
resource commitment which is required. The first stage in the process
A planning application checklist
Planning and land use
Transportation
Townscape and visual including
building heritage
Ecology
Archaeology
Daylight and sunlight
Wind
Socio-economics
Air quality
Noise and vibration
Ground conditions, hazardous
and contamination
Telecommunications
Sustainability
Demolition and construction
Water resources
Civil aviation
Our strategy was to work with English Heritage and the
Government’s advisors on architecture, the Commission for Architecture
and the Built Environment (CABE) at an early stage, and to secure
agreement to the application from the City Corporation.
44
The B
ritish L
and C
om
pany P
LC
Development Process– the Leadenhall Building
Obtaining planning permissions for the Company’s development
programme is a complex and expensive process involving many
organisations and expert consultants.
The professional expertise needed, from architects, engineers,
ecologists, environmental consultants and other specialist consultants
means that securing planning permissions gets more expensive
every year.
Focusing on one particular planning application, the proposal for
the redevelopment of 122 Leadenhall Street in the City of London cost
some £5 million alone, demonstrating the technical expertise and
resource commitment which is required. The first stage in the process
was the identification of the opportunity, which initially arose from
changes in planning policy.
Increasingly the technical assessment work needs to be done
as part of a formal, detailed Environmental Statement covering all
the relevant issues, which is submitted as part of the application.
Within each heading there can be a range of issues. So, for example,
Transportation might include road transport, public transport,
pedestrians, parking, servicing of the building, deliveries and refuse
collection. A great deal of effort goes into ensuring that the technical
assessment is comprehensive and accurate.
For a long time the City Corporation’s view was that tall buildings
were not acceptable in the City of London. This was supported by
English Heritage, the Government’s advisor on listed buildings and
conservation matters. However in the late 1990s a number of factors
came together to change that view. The election of Ken Livingstone
as the first Mayor of London in 2000 was important as he is a serious
enthusiast for well designed, tall buildings as part of his overall growth
strategy for London. The City of London’s Unitary Development Plan
Review and the London Plan changed the planning policy by promoting
the development of a cluster of tall buildings at the heart of the City of
London to rival Canary Wharf.
At Leadenhall Street the appointment of team members was key;
most importantly the selection of the Richard Rogers Partnership, which
had designed the Lloyds Building on the opposite side of Leadenhall
Street. The sketch (shown opposite) was part of the original Richard
Rogers Partnership submission, made as long ago as 2001. This
demonstrated a grasp of the key planning issue from the beginning;
the view of the building with the backdrop of the dome of St. Paul’s
Cathedral as seen from the west along Fleet Street; the outline of the
cathedral is shown in the circle. The basic shape of the proposed
Leadenhall Building, deferring to the dome’s dominance, has remained
much the same throughout the scheme’s design development.
Our strategy was to work with English Heritage and the
Government’s advisors on architecture, the Commission for Architecture
and the Built Environment (CABE) at an early stage, and to secure
agreement to the application from the City Corporation.
The Leadenhall Building viewed from the east.
Computer generated image courtesy of Cityscape.
We held a number of briefing sessions with owners and occupiers
of neighbouring properties to ensure that they were fully informed
and understood the scheme, and that we could take into account any
concerns they may have. For example we met with two neighbouring
churches who raised concerns about construction noise and its impact
on church services. We reassured them that when services are taking
place the noisiest activities would be kept to a minimum.
The application was submitted in February 2004, after over two
years of intensive design development and pre-application discussion.
The City Corporation’s Planning and Transportation Committee
resolved to grant planning permission in October 2004 and, following
lengthy negotiations on a legal agreement providing funding for
environmental improvements in the local area, transport improvements,
affordable housing and training for local people, planning permission
was finally granted in May 2005 for a building of 47 floors and
600,000 sq ft net and a construction commitment in the order of
£270 million. This increases the floor capacity, compared with the
current building, by more than three times.
A planning application checklist
Planning and land use
Transportation
Townscape and visual including
building heritage
Ecology
Archaeology
Daylight and sunlight
Wind
Socio-economics
Air quality
Noise and vibration
Ground conditions, hazardous
and contamination
Telecommunications
Sustainability
Demolition and construction
Water resources
Civil aviation
Illustration from the initial presentation by the Richard Rogers
Partnership in 2001.
The view from the west with the Leadenhall Building ‘attached’ to the
north side of Fleet Street. Computer generated image courtesy of Cityscape.
The existing 122 Leadenhall Street
Annual Report&Accounts2005
Source: The British Land Company PLC Annual Report & Accounts 2005 and used with kind permission.
Furthermore, this is a good example of a company explaining how it manages its resources – in this case the process of obtaining planning permission for its development prospects.
Development Process
Corporate Strategy
British Land seeks to achieve long-term growth in shareholder value by:
• enhancing property returnsthrough active management and development; and
Operating and Financial ReviewDevelopment programme
1
17
Describe the principal risks and uncertainties that may affect your company’s long-term value or prospects
A number of companies already try to provide a connection between corporate responsibility issues and their future sustainability. However, in this example, BAA goes considerably further, linking an environmental factor, namely local air quality, to its long-term objective of ensuring that Heathrow “remains the world’s busiest and leading
international airport”. One of the strategies to achieve this is to obtain approval from the Government to build a third runway. As set out in the extract below, the Government concluded in its White Paper that “it could not support the building of a third runway at Heathrow without clear evidence that the area will comply with EU air quality standards,
BAA plc
Corporate Responsibility Doing the Right ThingBAA has always taken ethical and moralresponsibilities seriously. It’s not just right, it is also in our commercial interests.
Local Air QualityAir quality management remains a key priorityamong local and national stakeholders. In itsWhite Paper, the Government concluded that it could not support the building of a thirdrunway at Heathrow without clear evidencethat the area will comply with EU air qualitystandards, due to come into force in 2010.
BAA has worked closely with the Departmentfor Transport on this issue and is a prominentmember of the Government-led expert groupwhich is assessing air quality monitoring andmodelling methodologies around Heathrow.A report on the findings is due in 2006.
Air Quality Monitoring – Heathrow Area (in microgrammes per metre cubed)
A Hounslow/CranfordB HarlingtonC HillingdonD Slough/ColnbrookE Brentford RoadsideF Hillingdon Hospital
A
55.4
3
B
38.2
5
C
45.3
4
D
30.8
4
E
58.4
9
F
36.6
6
(40
mic
rogr
amm
es)
2010
EU
lim
it
We’ve taken a number of actions to address air particle and NOx-related emissions, althoughairport emissions are only one source of localair pollution. Emissions around Heathrow alsocome from non-airport sources, notably theM25, M4 and A4. One of the key initiativesintroduced in the past two years has been an aircraft emissions charging scheme underwhich airlines pay according to their fleets’ NOx
emissions. This programme, the first of its kindin the UK, has been in place at Heathrow for a year, and was introduced at Gatwick from1April 2005.
Air QualityAir quality monitoring is required by DEFRA to assess compliancewith national air quality objectives and EU limit values. There are a number of fixed monitoring sites at locations close to Heathrow.This year’s figures indicate a non-compliance with future 2010 EUlimit for nitrogen dioxide at a number of locations. However, from1 January 2004, a 30% margin of tolerance, applied to compliancewith the limit value, meaning that only the Hounslow and Brentfordsites exceeded the limit. Future compliance is the subject of aDepartment for Transport study on the sustainable development ofHeathrow. For more information visit 1 www.dft.gov.uk.
30 Operating and Financial Review
BAA Annual Report 2004/05
Surface TransportBAA continues to work with partners andcustomers to offer improved choices formovements of people and goods to, from, and within our airports.
We’ve developed surface access strategies ateach of our airports to meet Government aimsof increasing public transport modal share.
The introduction of Heathrow Connect insummer 2005 should help public transportmodal share, as should investment in bus andcoach facilities at Heathrow and Stansted. For example, Earlybird, a free daily coachservice for early morning airport shift workers,was launched in June 2004 at Stansted.
The Gatwick Express rail service came underthreat in 2004 as a result of the Strategic RailAuthority’s proposed changes on the Brightonmainline. The service, which has topped theNational Passenger Satisfaction survey in thelast three years, is a vital link to central Londonand a key element in Gatwick’s public transportoffering. Although BAA does not operate theGatwick Express, we conducted a robust publicdefence of the service and will continue to do so.
During the year, plans were announced to linkGlasgow and Edinburgh airports to the Scottishnational rail network. BAA has been involved in the technical aspects of the projects, andsupports the principle of improving publictransport links to our airports.
Our focus for the coming year will be to reviewstakeholder responses to the surface accesssections of the airport master plans, which arebeing published from spring 2005.
WasteAll airports exceeded their 20% recycling target in 2004/05 – a further step towards ourlong-term goal to recycle 40% of waste by2010. In the previous year recycling initiativesfocused on our tenanted areas only, but duringthis year, they were extended to include thirdparties such as retailers, airlines and propertytenants. In addition, a significant quantity ofwaste began being sorted by waste contractorsat Heathrow and Gatwick from the mixedwaste (card, metal and paper) collected fromthe airports prior to disposal.
BAA strives for performance improvement inthe management of the large volumes of waterthat runs off an airport’s open spaces. All our UKairports have water quality strategies in place.
Our CommunitiesBAA is committed to gaining and maintainingthe trust of the communities around ourairports. This year we launched a newcommunity relations strategy which targets our resources on issues of greatest concern to them. As a result, over the past 12 months,BAA’s airports have supported a wide-range ofcommunity activities, including environmentalprojects, education partnerships, working with community groups and implementingvocational skills programmes.
BAA Communities TrustBAA’s own charity, the BAA Communities Trust, supports projects which are broughtforward by staff. Although these projects arelocal to our airports they have an internationalelement. They reflect our commitment to thelocal community and also to our links across the world. BAA is the main source of incomefor the charity, donating 0.15% of pre-taxprofits, excluding exceptional items, to thecharity, amounting to £955,500 for 2004/05.
During the year, the Trust launched a pilotpartnership with Voluntary Service Overseas to support its World Youth Programme.The partnership encourages young people from around BAA airports to link with theircounterparts from around the world.
Our UK airports supported the humanitarianrelief efforts following the tsunami disaster inDecember 2004, including a charitable donationof £50,000 from the Trust. In addition, BAAwaived airport charges for all specially charteredrelief flights operating from our airports andsited collection points in airport terminals tofacilitate further donations from passengersand airport staff.
VolunteeringBAA supports staff volunteering efforts. Theybring benefits to the individuals involved and tothe communities in which they work. In January2004, we held our first employee volunteeringawards to celebrate the work of our staff whovolunteer. Some 115 employees entered the
01 02 03 04 05
44
39
36
48
34
48
48 47 32
46
8 13 17
2020
00%
Recy
cle/
Com
post
Tar
get 4
0%10
60
50
40
30
20
10
0
f % Landfill f % Incineratef % Recycle/Compost
Waste Disposal Sources (000 tonnes)
Air Quality Monitoring – Heathrow Area (in microgrammes per metre cubed)
A Hounslow/CranfordB HarlingtonC HillingdonD Slough/ColnbrookE Brentford RoadsideF Hillingdon Hospital
A
55.4
3
B
38.2
5
C
45.3
4
D
30.8
4
E
58.4
9
F
36.6
6
(40
mic
rogr
amm
es)
2010
EU
lim
it
Air QualityAir quality monitoring is required by DEFRA to assess compliancewith national air quality objectives and EU limit values. There are a number of fixed monitoring sites at locations close to Heathrow.This year’s figures indicate a non-compliance with future 2010 EUlimit for nitrogen dioxide at a number of locations. However, from1 January 2004, a 30% margin of tolerance, applied to compliancewith the limit value, meaning that only the Hounslow and Brentfordsites exceeded the limit. Future compliance is the subject of aDepartment for Transport study on the sustainable development ofHeathrow. For more information visit 1 www.dft.gov.uk.
Waste Disposal SourcesTotal waste production increased by 4,195 tonnes to 58,090 tonnesin 2004/05.We met our target to recycle or compost 20% or more.
Success Through InnovationAnnual Report 2004/05
Operating and Financial Review 27
BAA Annual Report 2004/05
In the News
September: Airport noise consultations launch
September: ‘Make your Mark’ employee
survey launches
September: BAA named top of the transport
sector in the Dow Jones Sutainability Index
December: Receives RoSPA gold award for health
and safety for seventh year running
January: First employee volunteering awards
January: The Board of ACI, our European Trade
Association, approves a policy position supporting
emissions trading
February: ACCA commends BAA’s corporate
reporting
February: BAA Heathrow receives a highly-
commended award for biodiversity at the Livable
Cities Awards, which celebrates excellence in the
field of corporate responsibility
March: Joint fifth in the Business in the
Community Corporate Responsibility Index
1www.baa.com/corporateresponsibility1www.erm.com1www.forumforthefuture.org.uk1www.vso.org.uk1www.bitc.org.uk
We take our social and environmentalresponsibilities seriously. This is the rightapproach for a private sector company thatsupplies a critical public service. That’s why wehave embedded corporate responsibility sodeeply into our business.
BAA’s top-level corporate purpose is to pursuethe profitable and responsible growth of airtravel. That means running airports which aresafe and secure and which take proper accountof their environmental impacts. It also meansthat BAA strives to deal with its employees,customers and business partners honestly, fairlyand with respect.
Operating to this vision has become ever-moredemanding. For example, as people andgovernments become increasingly concernedabout climate change, we recognise that we must engage in the search for effectivesolutions. That requires us to take a leadershipposition on key issues. On climate change, we are helping to drive a campaign in the UKand in Europe to bring aviation into theforthcoming EU Emissions Trading Scheme.The scheme offers a genuinely effective, market-based mechanism to limit greenhouse gases.
BAA supports the proposition that aviationshould meet the external costs it imposes uponthe environment. That means balancing the
considerable economic and social benefits ofaviation against its environmental and socialimpacts: land take; pollution and noise.
We are also engaged in many wider corporateresponsibility issues. For example, Mike Clasper,BAA’s Chief Executive Officer, is chairing athree-year Business in the Community Taskforceexamining how companies can better managetheir impacts in their own market places.
What Corporate Responsibility Means to BAABAA’s approach to corporate responsibility is guided by our well-established policies onsustainable development and ethics. In 2003,we published a sustainable development policy,based on input from a range of stakeholders,including investors and community groups.On 7 March 2005, the Government publishedSecuring the Future, its new strategy forsustainable development. We will be reviewingour sustainable development policy in light ofthis new strategy, and will publish our revisedpolicy on our website.1www.baa.com/corporateresponsibility
Our approach to corporate responsibility issupported by a series of other policies whichprovide detailed guidance on specific issues:ethics; health and safety; bullying andharassment and environmentally sensitivematerials. Our policies apply to the managementand operation of BAA plc, its functions and
Corporate Responsibility Doing the Right ThingBAA has always taken ethical and moralresponsibilities seriously. It’s not just right, it is also in our commercial interests.
Source: BAA plc Annual Report 2004/05 and used with kind permission.
due to come into force in 2010”.
Accordingly, by describing how current activities have the potential to impact on future regulatory decisions, BAA provides a clear understanding of the risks associated with these activities and links current non-fi nancial activities with its future fi nancial performance.
2

18
BT Social and Environmental Report Summary and Highlights 2005 02
Highlights• Connected 5 million UK customers to broadband –
meeting our target a year earlyWe are on target to make broadband available toexchanges serving 99.6% of UK homes and businesses by summer 2005.
• Became the world’s biggest user of green energy We now source nearly all our UK electricity needs fromenvironmentally friendly sources, such as hydro, wind andcombined heat and power plants. Since 1996, we havereduced carbon dioxide emissions by 53%. Our green energycontract, signed in October 2004, equates to an additional325,000 tonnes of carbon dioxide emissions savings a year,equivalent to those produced by approximately 100,000 cars.
• Provided online and telephone donation facilities to the Disasters Emergency Committee (DEC) after the Asian tsunami disasterWe set up a temporary call centre at the BT Tower in London and provided DEC with facilities to process telephone and online donations quickly, securely and efficiently.
Performance snapshot
“The actions of leading companies such as BT areliving proof that significant cuts in greenhousegas emissions need not come at the cost ofeconomic growth.” Tony Blair, UK Prime Minister
• Reviewedandimprovedourkeyperformance indicators (KPIs)- Included a measure of our sickness absence rate for the
first timeThis helps identify health issues early so that we canreduce the number of people taking time off sick. Theimplementation of our company-wide mental healthprogramme in our customer contact centres has reduced stress by 24% and saved £500,000 in sick pay.
- Developed an Ethics Performance MeasureFor some time we have measured awareness of ourStatement of Business Practice, The Way We Work. The development of an Ethics Performance Measure takesus away from a purely perception-based measure towardsa performance-based one.
• Reduced the amount of waste sent to landfill by 8%
• Improved our safety record – Lost Time Injury rate was 23% better
• Invested £9.1 million in community projects andprovided £11.7 million support in kindWe are committed to give a minimum of 0.5% of our UK pre-tax profits to direct activities in support of societyand a further 0.5% via in-kind activities.
• Achieved certification for BT Ireland’s environmentalmanagement system to ISO 14001Our experience in Ireland is the model we will use as weextend certification to other countries where we operate.
• Followed up 100% of actions identified through oursupply chain risk assessment processAs part of our commitment to high standards in our supplychain we ask all new suppliers to complete a riskassessment questionnaire. Where we identify areas forimprovement we take appropriate action within three months.
Lowlights• Missed two key diversity targets
While we met our objective on the number of ethnicminority employees, the number of women in BT fell by 0.3% last year, and although the number of disabledemployees increased, we fell 0.3% short of our disabledemployees target.
• Undershot our customer satisfaction targetWe reduced customer dissatisfaction by the equivalent of23% per annum over three years against our target of 25%.
Please see our online report for further details. All our KPIs are shown on page 20.
We connected our five millionthcustomer to broadband –meeting our target a year early
Clarify the signifi cant relationships with stakeholders that are likely to infl uence the performance of your company and its value
Engagement with stakeholders is mentioned in many companies’ reports. However, in this example, BT goes into more detail, identifying its customers as a key stakeholder in the company’s business success, as well as providing a business case to explain why investors should consider corporate social responsibility and customers as
integral to the future success of the Group’s strategy.
In order to assess progress in managing customers, BT measures and communicates customer satisfaction as one of its 12 key performance indicators (KPIs). For each KPI, BT reports historical trend data, provides a target and
BT Group plc
Growth through transformation
Annual Review and summary financial statement 2005
Source: BT Group plc Annual Review and summary fi nancial statements 2005, BT Group plc Social and Environment Report 2005, www.btplc.com and used with kind permission.
discusses those instances where the target has not been met, thereby retaining balance in its reporting.
Further, BT describes the methods it uses to measure customer satisfaction and dissatisfaction, along with the initiatives for improving performance in this area in the future.
Relentless customer focusOur 20 million customers are a wonderfulasset and we have to continue to show how much we value every one of them.
A key target for us was driving downcustomer dissatisfaction – we’ve reduceddissatisfaction levels by 23% on acompound annual basis over the past threeyears. There is still more to be done and wemust continue this focus.
CSR for investorsThe key issue for investors is the business case for sustainabledevelopment and corporate socialresponsibility (CSR) and how social,environmental and ethical risks andopportunities are managed to preserveand grow shareholder value.
BT’s approachWe want to present investors with a forward-looking, quantitativebusiness case for CSR and sustainabledevelopment. Our business case setsout how good CSR performance iscritical to the delivery of BT’s strategy.
We measure our CSR performancethrough a series of key performanceindicators (KPIs) which have beendeveloped in consultation withstakeholders.
2. ReputationWhen people trust a company they in effect deliver a societal ‘licence to operate’. This is reflected in thecompany’s reputation which, in BT’s case, we know directly affectscustomer loyalty.
Through this relationship we haveunderstood how CSR is critical tooptimising customer satisfaction. For example, we estimate that BT’s CSR performance accounts for over 25 per cent of the image and reputation element of customersatisfaction. Further statistical analysis shows that a one per cent improvement in the public’sperception of our CSR activitiestranslates to a 0.1 per cent increase in our retail customer satisfactionfigures.
Chief Executive’s statement
y
Our business caseOur CSR work is integral to the BT strategy, and affects businessperformance in five key areas:
3
19
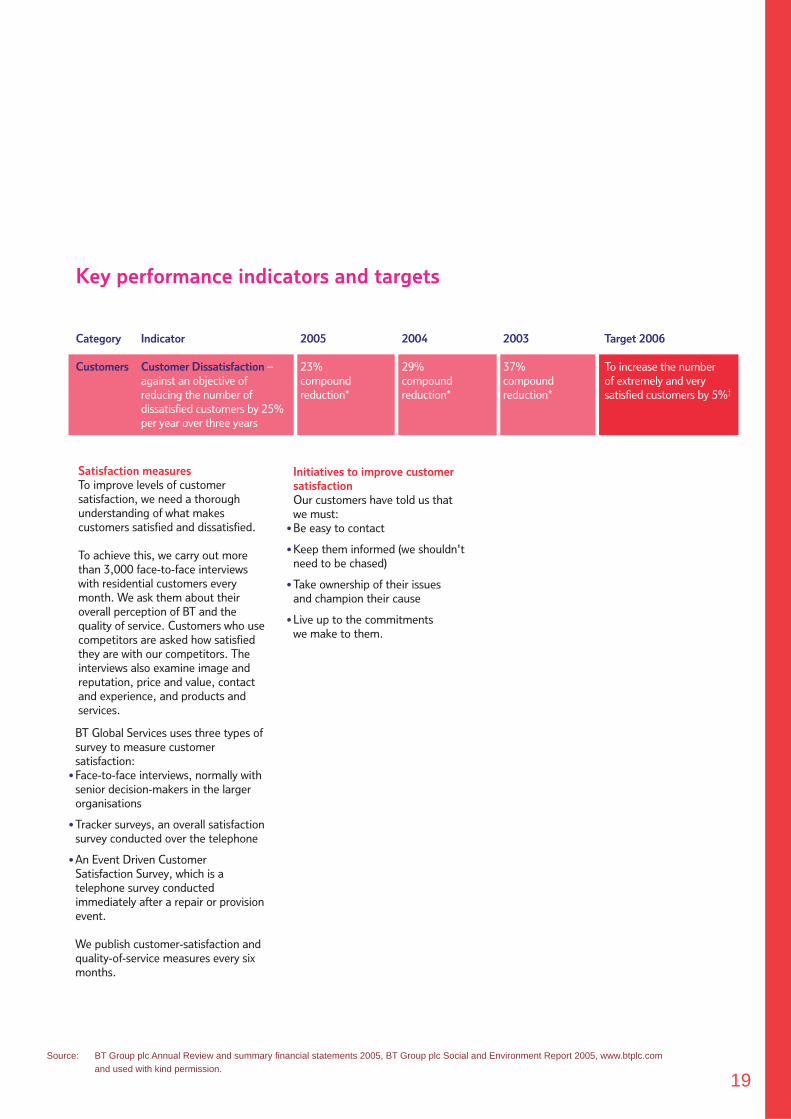
Key performance indicators and targets
Category Indicator 2005 2004 2003 Target 2006
Customers Customer Dissatisfaction – 23% 29% 37% To increase the number against an objective of compound compound compound of extremely and very reducing the number of reduction* reduction* reduction* satisfied customers by 5%†
dissatisfied customers by 25%per year over three years
Satisfaction measuresTo improve levels of customersatisfaction, we need a thoroughunderstanding of what makescustomers satisfied and dissatisfied.
To achieve this, we carry out morethan 3,000 face-to-face interviewswith residential customers everymonth. We ask them about theiroverall perception of BT and thequality of service. Customers who usecompetitors are asked how satisfiedthey are with our competitors. Theinterviews also examine image andreputation, price and value, contactand experience, and products andservices.
BT Global Services uses three types ofsurvey to measure customersatisfaction:
• Face-to-face interviews, normally withsenior decision-makers in the largerorganisations
• Tracker surveys, an overall satisfactionsurvey conducted over the telephone
• An Event Driven CustomerSatisfaction Survey, which is atelephone survey conductedimmediately after a repair or provisionevent.
We publish customer-satisfaction andquality-of-service measures every sixmonths.
Initiatives to improve customersatisfactionOur customers have told us that we must:
• Be easy to contact
• Keep them informed (we shouldn'tneed to be chased)
• Take ownership of their issues and champion their cause
• Live up to the commitments we make to them.
Source: BT Group plc Annual Review and summary fi nancial statements 2005, BT Group plc Social and Environment Report 2005, www.btplc.com and used with kind permission.

20
Provide quantifi ed data relating to trends and factors likely to affect your company’s future prospects
While a number of companies are starting to take positive steps in this direction, others already incorporate this information into their annual reports. In this extract from Emap’s 2005 Annual Report, investors are shown market data on both historical and future estimated advertising growth rates. This provides information relating to trends and factors underlying historic performance and likely to affect future performance.
Whilst Emap could have provided its own company metrics relating to growth prospects, it has chosen to use data from an accepted external industry benchmark. A number of companies provide similar external market information. However, Emap balances this data with alternative external views, which in this case are less optimistic about future growth rates.
emap plc
emap plc annual report & accounts 2005
In the UK, the current advertising growthforecasts from the Advertising Association(AA), set out in the table, indicate someimprovement in most of Emap’s markets.These forecasts are updated quarterly.
AA is recognised by the industry as a goodbenchmark of future growth rates. However,other forecasters have started to reduce theirexpectations for 2005/06, for exampleDeutsche Bank reduced their advertisinggrowth forecast from 4.9% to 2.2%,Lehman Brothers have also taken a view that is more pessimistic for the sector thanthese AA forecasts.
UK Advertising growth forecasts2002 2003 2004 2005 2006
Total advertising 1.6% 3.9% 5.4% 6.3% 5.6%
Consumer magazines 0.8% (0.2%) 4.5% 4.2% 4.4%Business/professional mags (9.4%) (3.6%) 3.2% 3.6% 2.9%Radio 1.1% 6.8% 3.4% 5.3% 5.2%TV 4.9% 3.4% 5.4% 6.7% 4.6%
Source: Advertising Association
market overviewand strategyCompetitive environmentMany of the specific markets in which Emap operates experience a high degreeof competitive intensity. Over the years Emaphas developed a creative, innovative andcompetitive culture which enables it to thrive in these markets.
In consumer magazines in the UK, Emap’skey competitors are IPC, now part of TimeWarner; Bauer; BBC Worldwide; and TheNational Magazine Company, part of theHearst Corporation. In radio, Emap competesprimarily with GCap, formed from therecently merged Capital Radio and GWR,and Chrysalis. In music television Emapcompetes with MTV, part of Viacom. In b2bkey competitors are Reed and UBM, and inFrance they are Lagardère and Prisma, partof the Bertelsmann group.
Macro-economic environmentIn the UK, the economic environment overthe last year has been relatively benign, butremains one of low growth. GDP growth isestimated to have been 3.1% in 2004, thehighest for four years, but is forecast to dropback slightly in 2005 and 2006.
In France GDP growth has lagged the UKand is expected to continue to do so, with a slight recovery forecast for 2006. In both of Emap’s core markets, therefore, 2005 isexpected to be a little tougher than 2004.
In the UK, the current advertising growthforecasts from the Advertising Association(AA), set out in the table, indicate someimprovement in most of Emap’s markets.These forecasts are updated quarterly.
AA is recognised by the industry as a goodbenchmark of future growth rates. However,other forecasters have started to reduce theirexpectations for 2005/06, for exampleDeutsche Bank reduced their advertisinggrowth forecast from 4.9% to 2.2%,Lehman Brothers have also taken a view that is more pessimistic for the sector thanthese AA forecasts.
In France, advertising growth has historically been weaker and is expected to be somewhat weaker than in the UK, as shown in the table on page 5.
43% of Emap’s revenues are derived fromadvertising. Consumer magazine advertising in the UK accounts for 12% of total revenues,and around half of this is endemic – for
operating & financial review
Emap is a broad-based media group located in the UK. It is listed on the London Stock Exchange and is part of the FTSE 100 Index. Its business covers consumer magazines, radio, music television, b2b magazines, exhibitions, events and information products. Its core business is based in the UK and France.
UK Advertising growth forecasts2002 2003 2004 2005 2006
Total advertising 1.6% 3.9% 5.4% 6.3% 5.6%
Consumer magazines 0.8% (0.2%) 4.5% 4.2% 4.4%Business/professional mags (9.4%) (3.6%) 3.2% 3.6% 2.9%Radio 1.1% 6.8% 3.4% 5.3% 5.2%TV 4.9% 3.4% 5.4% 6.7% 4.6%
Source: Advertising Association
emap plc annual report & accounts 2005 < 4 >
Emap’s revenue split
43% Advertising57% Other
Emap’s revenue mix
12% Advertising – consumer UK 10% Advertising – consumer France 2% Advertising – consumer
International5% Advertising – trade recruitment 5% Advertising – trade 8% Airtime – radio 1% Airtime – TV
4% Other8% Exhibitions4% Circulation – trade 2% Circulation – consumer
International18% Circulation – consumer France21% Circulation – consumer UK
2001 2002 2003 2004 2005E 2006E
+2.3%
+1.8%+2.2%
+3.1% +3.0% +3.0%
GDP growth (UK)
Source: Citigroup
2001 2002 2003 2004 2005E 2006E
+2.1%
+1.1%
+0.6%
+2.4%
+2.0%+2.3%
GDP growth (France)
Source: Citigroup
Source: emap plc annual report and accounts 2005 and used with kind permission.
This forward-looking orientation is useful to investors in assessing the market in which Emap is likely to be operating in the coming years and provides a context for them to assess the potential success of the company’s strategies and future performance.
Macro-economic environment
4

21
Annual Report 2005
Creating the world’sleading renewableingredients business
Success Through InnovationAnnual Report 2004/05
Spell out any uncertainties underpinning forward-looking information
Companies often include a statement within their reporting advising readers to treat forward-looking information with caution. Many incorporate “hold harmless” or “safe harbour” statements, often geared towards the US markets.
In the example below from BAA, the uncertainties relating to future forecast growth in passenger numbers are highlighted and clearly explained.
BAA plc, The British Land Company PLC, Tate & Lyle PLC
Operating and Financial Review
From March 2006 British Land is required to publish an Operating
and Financial Review in accordance with new regulations. Although
guidance on its preparation is not finalised, this OFR aims to anticipate
most of the new requirements.
In preparing this operating and financial review, we are required to
advise the reader that by their nature, all forward looking statements
made involve uncertainty since future events often cause outcomes
and results to differ from those anticipated.
Cautionary statementThis Annual Report and Accounts contains certain forward-lookingstatements with respect to the financial condition, results, operationsand businesses of Tate & Lyle PLC. These statements and forecastsinvolve risk and uncertainty because they relate to events anddepend upon circumstances that will occur in the future. There are anumber of factors that could cause actual results or developments todiffer materially from those expressed or implied by these forward-looking statements and forecasts. Nothing in this Annual Report andAccounts should be construed as a profit forecast.
Source: BAA plc Annual Report 2004/05; The British Land Company PLC Annual Report and Accounts 2005; Tate & Lyle PLC Annual Report 2005 and used with kind permission.
Furthermore, examples from British Land and Tate & Lyle demonstrate simple statements of caution.
Annual Report&Accounts2005
Drivers of Future PerformanceAs passenger numbers are set to continuegrowing for the foreseeable future and ourairports become increasingly busy, the Group is focusing ever more on improving the qualityof service delivered across the whole range of airport activity – from first impressions onarrival, through check-in and security and on to departure. The move to an airport-ledoperating model will ensure maximumaccountability as close to the customer as possible and a more effective and agileorganisation.
5

22
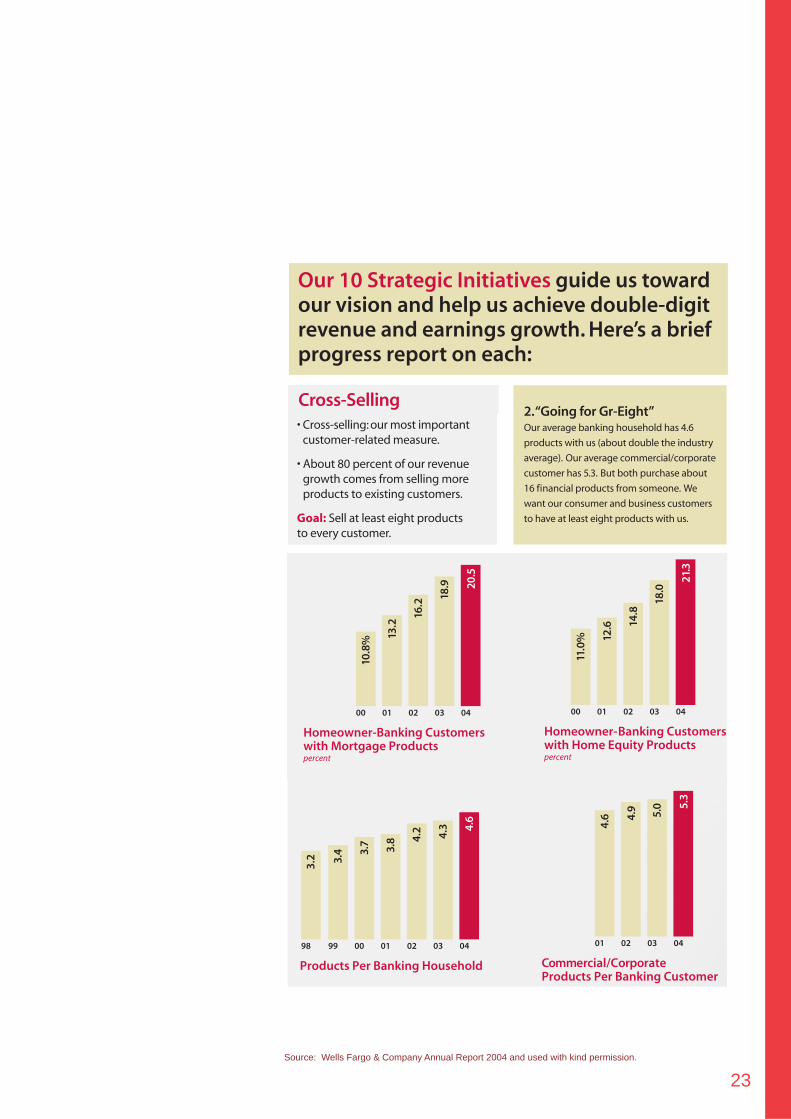
Companies often present performance indicators based on traditional fi nanical information alone. We, however, would encourage companies to present the KPIs and accompanying targets – both fi nancial and non-fi nancial – used by management to measure progress in delivering against their stated strategies and in managing their business.
In this example, Wells Fargo clearly explains why it chooses
to use different measures, giving frank descriptions where common measures such as total customers can be meaningless, and identifi es the key measures – fi nancial and non-fi nancial – that it believes matter most, and provides targets for each one.
Wells Fargo goes on to measure progress in achieving those targets, as shown here for cross-selling. Not only does it identify cross-selling
Wells Fargo & Company
Communicate targets relating to those key performance indicators (KPIs) used to manage your business
Which MeasuresReally Matter?We measure success differentlythan our competitors.We believethese measures matter most.They’re the most important long-term indicators of success inthe financial services industry.
- Revenue Growth
- Earnings Per Share
- Return On Equity
- Revenue vs. Expense Growth
- Assets Managed, Administered
- Managing Risk
- Retaining Team Members
- Team Member Engagement
- Retaining Customers
- Customer Service
- Customer Access Options
- Cross-Selling
- Product Solutions (Sales)Per Banker Per Day
- Market Share
- Total Stockholder Return
Letty CanteroWells Fargo BankCorona, CaliforniaTeam member since: 1994
Last year, we called for a new set of financial performance measures—to reflect more accurately how financial services companieslike ours create value for customers and stockholders.We believe this new set of measures is more suited to the faster growing,dynamic, diversified, knowledge-based financial services industry than to the stagnant, old banking segment.The more preciselythat service companies can measure the value they create, the more accurately the marketplace can measure the value of their stock. Our proposal prompted such significant interest and discussion that we’ve expanded on it in our report to you this year.
Which measures really matter?Wells Fargo & Company Annual Report 2004
Source: Wells Fargo & Company Annual Report 2004 and used with kind permission.
“as the most important customer-related measure”, it goes further by providing the rationale for the selection of this measure and its importance to current and future fi nancial performance, namely that “about 80 percent of our revenue growth comes from selling more products to existing customers”. The disclosure is made more readily understandable by good use of graphics.
Which MeasuresReally Matter?We measure success differentlythan our competitors.We believethese measures matter most.They’re the most important long-term indicators of success inthe financial services industry.
- Revenue Growth
- Earnings Per Share
- Return On Equity
- Revenue vs. Expense Growth
- Assets Managed, Administered
- Managing Risk
- Retaining Team Members
- Team Member Engagement
- Retaining Customers
- Customer Service
- Customer Access Options
- Cross-Selling
- Product Solutions (Sales)Per Banker Per Day
- Market Share
- Total Stockholder Return
any fancy new theories. We are simplysuggesting a new set of value-creationmeasures for financial services companiesso there is an apples-to-apples way tocompare companies’ performance acrossthe industry in the measures that reallymatter. That’s why we say financialservices companies measure the wrongthings, often based on the traditionalmeasures of the banking industry.For example:• Asset size and return on assets —
important to banks in the “old days”—do not reflect contributions from suchfee-based businesses as mortgage,insurance and money management. p
• Total customers can be a meaninglessmeasure — it gives you little or no insightinto breadth and depth of relationships.Think of the profit difference between ten customers who entrust you with 100 percent of their business versus100 who give you just ten percent of it.
6
23
2.“Going for Gr-Eight”Our average banking household has 4.6
products with us (about double the industry
average). Our average commercial/corporate
customer has 5.3. But both purchase about
16 financial products from someone. We
want our consumer and business customers
to have at least eight products with us.
Our 10 Strategic Initiatives guide us towardour vision and help us achieve double-digitrevenue and earnings growth. Here’s a briefprogress report on each:
10.8
% 13.2
16.2
18.9
20.5
00 01 02 03 04
Homeowner-Banking Customerswith Mortgage Products percent
11.0
% 12.6 14
.8
18.0
21.3
00 01 02 03 04
Homeowner-Banking Customerswith Home Equity Productspercent
3.7 3.8 4.
2 4.3 4.
6
9998
3.2 3.
4
00 01 02 03 04
Products Per Banking Household
4.6 4.
9 5.0 5.
3
01 02 03 04
Commercial/CorporateProducts Per Banking Customer
• Cross-selling: our most importantcustomer-related measure.
• About 80 percent of our revenuegrowth comes from selling moreproducts to existing customers.
Goal: Sell at least eight productsto every customer.
Cross-Selling
Source: Wells Fargo & Company Annual Report 2004 and used with kind permission.
24
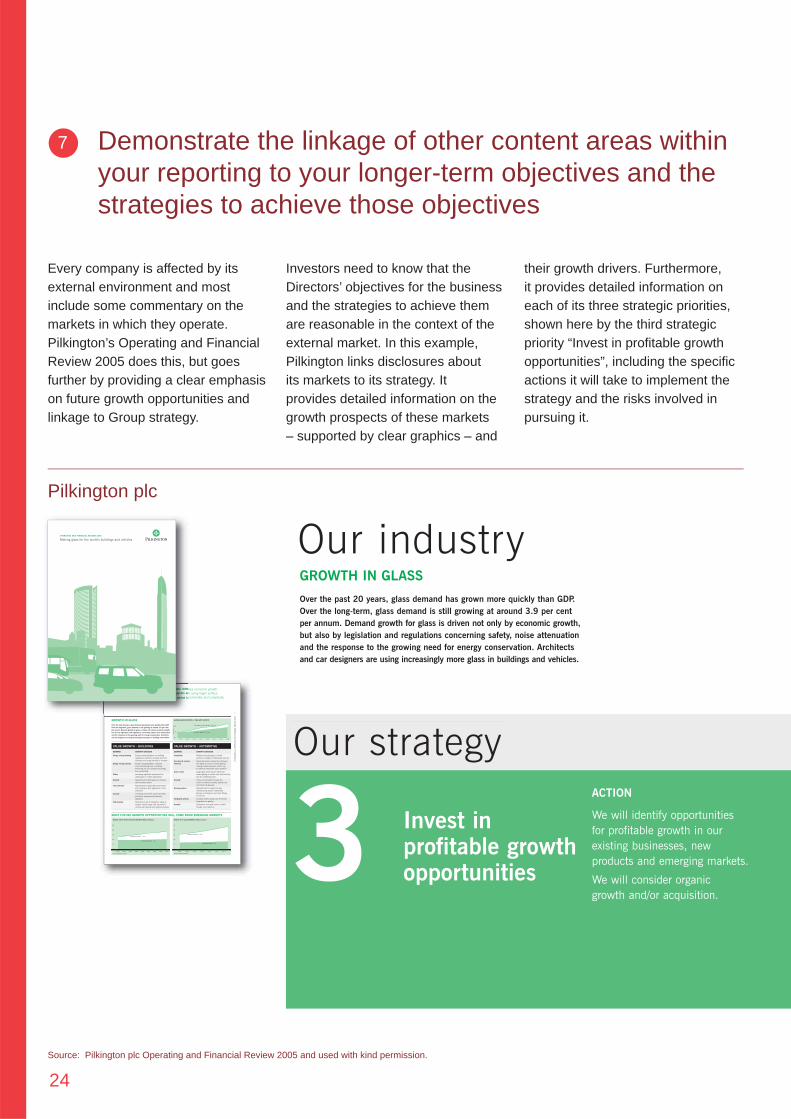
Our strategyACTION
We will identify opportunities for profitable growth in our existing businesses, new products and emerging markets.
We will consider organic growth and/or acquisition.
Every company is affected by its external environment and most include some commentary on the markets in which they operate. Pilkington’s Operating and Financial Review 2005 does this, but goes further by providing a clear emphasis on future growth opportunities and linkage to Group strategy.
Investors need to know that the Directors’ objectives for the business and the strategies to achieve them are reasonable in the context of the external market. In this example, Pilkington links disclosures about its markets to its strategy. It provides detailed information on the growth prospects of these markets – supported by clear graphics – and
Pilkington plc
Demonstrate the linkage of other content areas within your reporting to your longer-term objectives and the strategies to achieve those objectives
PIL
KIN
GTO
N p
lcO
PER
ATIN
G A
ND
FIN
AN
CIA
L R
EVIE
W 2
005
7
Glass is a growth industry. Global demand for glass outstrips economic growth
around the world. Today’s architects and car designers are using larger surface
areas of glass in their designs, increasingly with added functionality and complexity.
GROWTH IN GLASS
Over the past 20 years, glass demand has grown more quickly than GDP.
Over the long-term, glass demand is still growing at around 3.9 per cent
per annum. Demand growth for glass is driven not only by economic growth,
but also by legislation and regulations concerning safety, noise attenuation
and the response to the growing need for energy conservation. Architects
and car designers are using increasingly more glass in buildings and vehicles.
MOST FUTURE GROWTH OPPORTUNITIES WILL COME FROM EMERGING MARKETS
WORLD LIGHT VEHICLE SALES GROWTH (Million Vehicles)
2002 2003 2004 2005 2006 2007 2008 2009 2010
Source: Company estimates
100
80
60
40
20
0
Developing Markets +15m
Developed Markets +3m
WORLD FLAT GLASS MARKET (Million Tonnes)
2002 2004 2006 2008 2010 2012 2014
Source: Company estimates
50
40
30
20
10
0
Developing Markets +21m
Developed Markets +7m
GLOBAL GLASS GROWTH vs. REAL GDP GROWTH
1991 1993 1995 1997 1999 2001 2003 2005
150
100
50
Global glass demand growth: 3.9% p.a.
Inde
x (1
991 –
100
)
Real GDP growth: 2.6% p.a.
VALUE GROWTH – BUILDINGS
DEMAND GROWTH DRIVERS
Energy saving (heating) Energy saving legislation and buildingregulations; reduction of energy loss frombuildings and energy labelling of windows
Energy saving (cooling) Energy saving legislation, reduction of air-conditioning load in buildings.Preventing non air-conditioned buildingsfrom overheating
Safety Increasing legislative requirement for safety glass in certain applications
Security Requirement for transparency combined with security features
Fire protection Requirement for good light transmission and compliance with regulations on fireprotection
Acoustic Increasing noise levels caused by traffic,aircraft etc progressively backed bylegislation
Self-cleaning Reduction in use of detergents, safety atheights. Product range now extended tocombine self-cleaning with additional features
DEMAND GROWTH DRIVERS
Complexity Designers see glazing as a crucial element in designs to differentiate vehicles
Curvature & surface Styling demands increase the complexity tolerance and depth of curves in vehicle glazing,
making surface tolerances critical, e.g. for efficient windscreen wiper operation
Solar control Larger glass areas require tinted and coated glazing to reduce solar heat build-upand air-conditioning load
Security Crime and vandalism increase the need for enhanced security, provided bylaminated side glazings
Glazing systems Reduced time to market and leanmanufacturing require modularised glazing, including trim and other fittings, in one unit
Integrated systems Complex antenna arrays and electronicsintegrated into glazing
Acoustic Demand for increased vehicle comfortthrough noise reduction
VALUE GROWTH – AUTOMOTIVE
OPERATING AND FINANCIAL REVIEW 2005
Making glass for the world’s buildings and vehicles
Source: Pilkington plc Operating and Financial Review 2005 and used with kind permission.
their growth drivers. Furthermore, it provides detailed information on each of its three strategic priorities, shown here by the third strategic priority “Invest in profi table growth opportunities”, including the specifi c actions it will take to implement the strategy and the risks involved in pursuing it.
GROWTH IN GLASS
Over the past 20 years, glass demand has grown more quickly than GDP.
Over the long-term, glass demand is still growing at around 3.9 per cent
per annum. Demand growth for glass is driven not only by economic growth,
but also by legislation and regulations concerning safety, noise attenuation
and the response to the growing need for energy conservation. Architects
and car designers are using increasingly more glass in buildings and vehicles.
Our industry
7
3 Invest in profitable growthopportunities
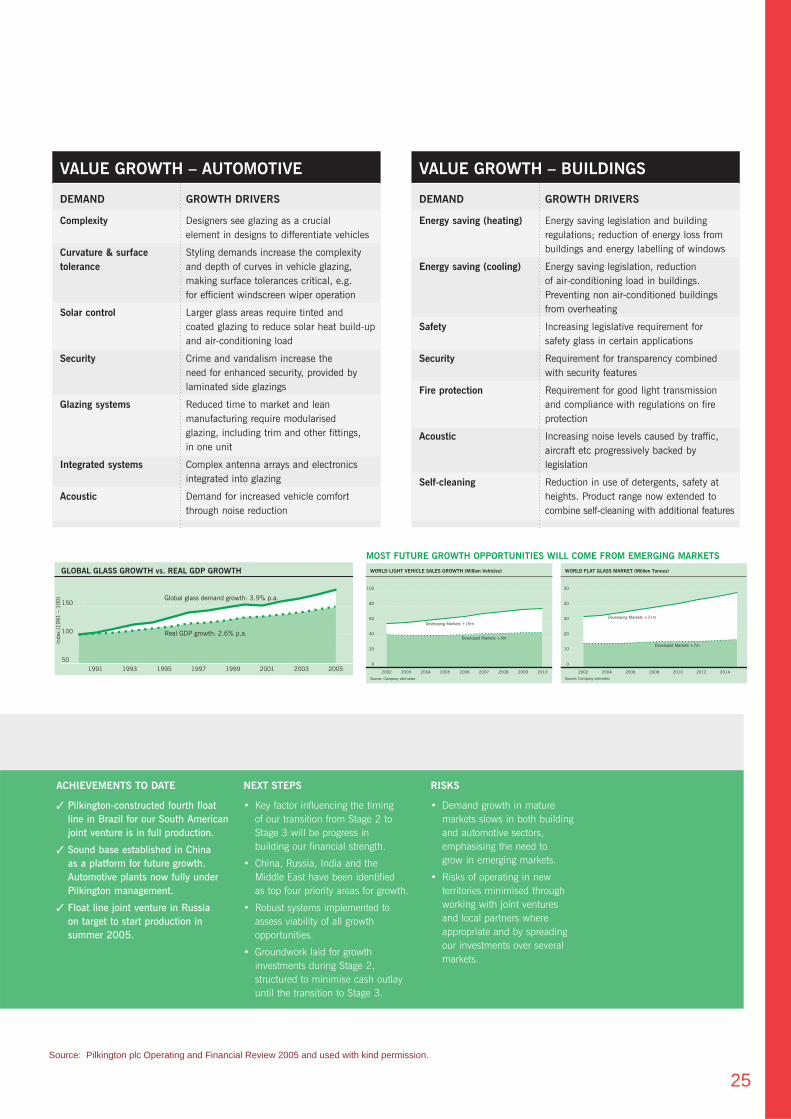
25
ACHIEVEMENTS TO DATE
✓ Pilkington-constructed fourth floatline in Brazil for our South Americanjoint venture is in full production.
✓ Sound base established in China as a platform for future growth.Automotive plants now fully underPilkington management.
✓ Float line joint venture in Russia on target to start production insummer 2005.
NEXT STEPS
• Key factor influencing the timing
of our transition from Stage 2 to
Stage 3 will be progress in
building our financial strength.
• China, Russia, India and the
Middle East have been identified
as top four priority areas for growth.
• Robust systems implemented to
assess viability of all growth
opportunities.
• Groundwork laid for growth
investments during Stage 2,
structured to minimise cash outlay
until the transition to Stage 3.
RISKS
• Demand growth in mature
markets slows in both building
and automotive sectors,
emphasising the need to
grow in emerging markets.
• Risks of operating in new
territories minimised through
working with joint ventures
and local partners where
appropriate and by spreading
our investments over several
markets.
GLOBAL GLASS GROWTH vs. REAL GDP GROWTH
1991 1993 1995 1997 1999 2001 2003 2005
150
100
50
Global glass demand growth: 3.9% p.a.
Inde
x (1
99
1 –
10
0)
Real GDP growth: 2.6% p.a.
MOST FUTURE GROWTH OPPORTUNITIES WILL COME FROM EMERGING MARKETS
WORLD LIGHT VEHICLE SALES GROWTH (Million Vehicles)
2002 2003 2004 2005 2006 2007 2008 2009 2010
Source: Company estimates
100
80
60
40
20
0
Developing Markets +15m
Developed Markets +3m
WORLD FLAT GLASS MARKET (Million Tonnes)
2002 2004 2006 2008 2010 2012 2014
Source: Company estimates
50
40
30
20
10
0
Developing Markets +21m
Developed Markets +7m
Source: Pilkington plc Operating and Financial Review 2005 and used with kind permission.
VALUE GROWTH – BUILDINGS
DEMAND GROWTH DRIVERS
Energy saving (heating) Energy saving legislation and buildingregulations; reduction of energy loss frombuildings and energy labelling of windows
Energy saving (cooling) Energy saving legislation, reduction of air-conditioning load in buildings.Preventing non air-conditioned buildingsfrom overheating
Safety Increasing legislative requirement for safety glass in certain applications
Security Requirement for transparency combined with security features
Fire protection Requirement for good light transmission and compliance with regulations on fireprotection
Acoustic Increasing noise levels caused by traffic,aircraft etc progressively backed bylegislation
Self-cleaning Reduction in use of detergents, safety atheights. Product range now extended tocombine self-cleaning with additional features
DEMAND GROWTH DRIVERS
Complexity Designers see glazing as a crucial element in designs to differentiate vehicles
Curvature & surface Styling demands increase the complexity tolerance and depth of curves in vehicle glazing,
making surface tolerances critical, e.g. for efficient windscreen wiper operation
Solar control Larger glass areas require tinted and coated glazing to reduce solar heat build-upand air-conditioning load
Security Crime and vandalism increase the need for enhanced security, provided bylaminated side glazings
Glazing systems Reduced time to market and leanmanufacturing require modularised glazing, including trim and other fittings, in one unit
Integrated systems Complex antenna arrays and electronicsintegrated into glazing
Acoustic Demand for increased vehicle comfortthrough noise reduction
VALUE GROWTH – AUTOMOTIVE

26
Other narrative reporting publications
Contact usFor more information on the implications of evolving corporate reporting practices, both internally and externally, and to obtain copies of other corporate reporting publications please contact the corporate reporting team at [email protected], or visit our website www.corporatereporting.com
Report LeadershipReport leadership is a multi-stakeholder group that aims to challenge established thinking on corporate reporting. The contributors to this initiative are the Chartered Institute of Management Accounts (CIMA), PricewaterhouseCoopers LLP, Radley Yeldar and Tomkins plc.

27
www.corporatereporting.com
pwc


