CHAPTER 1.2 Building the Microeconomic Foundations of Prosperity: Findings from the Business Competitiveness Index 1 MICHAEL E. PORTER, Harvard University Competitiveness has become a central preoccupation of both advanced and developing countries in an increasingly open and integrated world economy.Despite its acknowl- edged importance, the concept of competitiveness is often misunderstood. Here, we define competitiveness concretely, show its relationship to a nation’s standard of living,and outline a conceptual framework for understanding its causes. The Business Competitiveness Index (BCI), based on this conceptual framework, provides a data-rich approach to measuring and analyzing the fundamental competitive- ness of a large number of countries in a comparative con- text.This year’s BCI includes 101 countries, up from 80 last year. Our aim is to rank country competitiveness across countries, identify individual countries’ competitive strengths and weaknesses,reveal the trends in competitive- ness in the global economy,and extend our basic knowl- edge about the sources of competitiveness and the process of economic development. Most discussion of competitiveness and economic development is still focused on the macroeconomic, politi- cal, legal, and social circumstances that underpin a success- ful economy.It is well understood that sound fiscal and monetary policies, a trusted and efficient legal system, a stable set of democratic institutions, and progress on social conditions contribute greatly to a healthy economy. However,these broader conditions are necessary but not sufficient.They provide the opportunity to create wealth but do not themselves create wealth.Wealth is actually created at the microeconomic level of the economy,root- ed in the sophistication of actual companies as well as in the quality of the microeconomic business environment in which a nation’s firms compete. Unless these microeco- nomic capabilities improve, macroeconomic, political, legal, and social reforms will not bear full fruit. Beginning in 1998, we began an effort to examine statistically the microeconomic foundations of competi- tiveness and prosperity across a wide array of countries. This is a daunting task, given the need to measure and compare the complex array of national circumstances that support a high and sustainable level of productivity.The effort aims to move beyond the examination of broad, aggregate variables typical of most economic growth analyses, and provide a framework for countries and com- panies to understand their detailed competitive strengths and weaknesses. It also aims to be as rigorous as possible, verifying the importance of variables statistically and using statistical techniques to weight the contribution of indi- vidual variables. Finally, we know that improvement in competitiveness is not a simple linear process but one where nations at different levels of development face dif- ferent challenges and priorities.This effort aims to high- light these differences. 29 1.2: Building the Microeconomic Foundations of Prosperity
Transcript
CHAPTER 1.2
Building the MicroeconomicFoundations of Prosperity:Findings from the BusinessCompetitiveness Index1
MICHAEL E. PORTER, Harvard University
Competitiveness has become a central preoccupation ofboth advanced and developing countries in an increasinglyopen and integrated world economy. Despite its acknowl-edged importance, the concept of competitiveness is oftenmisunderstood. Here, we define competitiveness concretely,show its relationship to a nation’s standard of living, andoutline a conceptual framework for understanding itscauses.
The Business Competitiveness Index (BCI), based onthis conceptual framework, provides a data-rich approachto measuring and analyzing the fundamental competitive-ness of a large number of countries in a comparative con-text.This year’s BCI includes 101 countries, up from 80last year. Our aim is to rank country competitivenessacross countries, identify individual countries’ competitivestrengths and weaknesses, reveal the trends in competitive-ness in the global economy, and extend our basic knowl-edge about the sources of competitiveness and the processof economic development.
Most discussion of competitiveness and economicdevelopment is still focused on the macroeconomic, politi-cal, legal, and social circumstances that underpin a success-ful economy. It is well understood that sound fiscal andmonetary policies, a trusted and efficient legal system, astable set of democratic institutions, and progress on socialconditions contribute greatly to a healthy economy.However, these broader conditions are necessary but notsufficient.They provide the opportunity to create wealthbut do not themselves create wealth.Wealth is actuallycreated at the microeconomic level of the economy, root-ed in the sophistication of actual companies as well as inthe quality of the microeconomic business environment inwhich a nation’s firms compete. Unless these microeco-nomic capabilities improve, macroeconomic, political,legal, and social reforms will not bear full fruit.
Beginning in 1998, we began an effort to examinestatistically the microeconomic foundations of competi-tiveness and prosperity across a wide array of countries.This is a daunting task, given the need to measure andcompare the complex array of national circumstances thatsupport a high and sustainable level of productivity.Theeffort aims to move beyond the examination of broad,aggregate variables typical of most economic growthanalyses, and provide a framework for countries and com-panies to understand their detailed competitive strengthsand weaknesses. It also aims to be as rigorous as possible,verifying the importance of variables statistically and usingstatistical techniques to weight the contribution of indi-vidual variables. Finally, we know that improvement incompetitiveness is not a simple linear process but onewhere nations at different levels of development face dif-ferent challenges and priorities.This effort aims to high-light these differences.
29
1.2:
Bui
ldin
g th
e M
icro
econ
omic
Fou
ndat
ions
of
Pros
perit
y
The Business Competitiveness Index seeks to explorethe underpinnings of a nation’s prosperity measured by itslevel of GDP per capita.The focus of this index is onwhether current prosperity is sustainable, and on the spe-cific areas that must be addressed if GDP per capita is toachieve higher levels in the future.A separate GrowthCompetitiveness Index (GCI), discussed in the previouschapter of this Report, examines the sources of GDP percapita growth, which is more dependent on investmentrates and other macroeconomic policies.The sustainablelevel of current GDP per capita and its rate of growth willbe related in the long term, but each area requires its owndistinctive policy agenda.We have renamed the BCI thisyear to highlight its focus on firms and productivity.However, the conceptual framework and statisticalapproach follow that of the previous reports, and the find-ings are fully comparable with previous MicroeconomicCompetitiveness Index results.
The analysis here is pragmatic, making use of the bestavailable data and econometric methods even though bothare far from perfect.We also confront the challenge ofestablishing the direction of causality, given limited timeseries data. However, even if definitive tests of causality arenot yet possible, understanding the microeconomic corre-lates of prosperity remains crucial.There may be a naturaltendency for some microeconomic conditions to improveas GDP per capita increases, but the large observed differ-ences across countries, even countries at similar incomelevels, reveal that this improvement is far from automatic.
Despite the statistical challenges and the addition of21 mostly low income countries, mainly from Africa, tothe sample of countries, the statistical findings overall areremarkably stable and robust compared with the GlobalCompetitiveness Report 2002–2003 (GCR) and earlierReports.We expand this year’s analysis to include an analy-sis of natural resource endowments and their role in com-petitiveness, a crucial issue especially for developing coun-tries.The results again provide strong support for theimportance of microeconomic competitiveness for eco-nomic development and prosperity. Our findings also veri-fy the striking and regular pattern of microeconomicchanges that accompany economic development.
The Business Competitiveness Index proves toaccount for 83 percent of the variation across countries inthe level GDP per capita,2 remarkably high given theaddition of so many low income countries.These findingshighlight the pressing need to better incorporate micro-economic competitiveness agenda into efforts to stimulateeconomic growth. In advanced countries, which havelargely gotten their macro policies right, it is micro reformthat holds the key to reversing unemployment problems,to growing exports, and to translating economic growthinto a rising standard of living.
In developing countries, microeconomic failures nul-lify macroeconomic and social programs again and again.By accessing global capital markets, countries can engineerspurts of growth through macroeconomic stabilization andfinancial reforms that bring in floods of capital and createthe illusion of progress as construction cranes dot the sky-line.Without microeconomic reforms, however, growthwill be snuffed out as exports and jobs fail to materialize,wages stagnate, and the return on investments proves dis-appointing.This disappointment, and the austerity thatresults from such cycles, is at the heart of the backlashagainst globalization.
Successful economic development requires progresson multiple fronts simultaneously. Reform efforts need tobe tightly connected to the country’s current stage ofdevelopment.As an economy progresses, the constraints toits continued advancement shift.At strategic points in thedevelopment process, the whole basis of national competi-tiveness must be transformed. Many aspects of companystrategy must be shifted and new requirements in thenational business environment must be met. Our analysisprovides the conceptual framework and comparative datato define such national agendas and to measure progress.
Competitiveness and its causesMeasuring and ranking competitiveness requires a clearconceptual framework, drawing on the accumulatedknowledge about competitiveness and its sources.We sum-marize the framework here, drawing on previous years’chapters while extending it to incorporate recent learning.
What is competitiveness?Competitiveness remains a concept that is not well under-stood, despite widespread acceptance of its importance.The most intuitive definition of competitiveness is a coun-try’s share of world markets for its products.This makescompetitiveness a zero-sum game, because one country’sgain comes at the expense of others.This view of compet-itiveness is used to justify intervention to skew marketoutcomes in a nation’s favor (so-called industrial policy). Italso underpins policies intended to provide subsidies, holddown local wages, and devalue the nation’s currency, allaimed at expanding exports. In fact, it is still often saidthat lower wages or devaluation “make a nation morecompetitive.” Business leaders are drawn to the market-share view because these policies seem to address theirimmediate competitive concerns.
Unfortunately, the most intuitive view of competi-tiveness is deeply flawed, and acting on it works againstnational economic progress.The need for low wagesreveals a lack of competitiveness and holds down prosperi-ty. Subsidies drain national income and bias choices awayfrom the most productive use of the nation’s resources.
30
1.2:
Bui
ldin
g th
e M
icro
econ
omic
Fou
ndat
ions
of
Pros
perit
y
Devaluation results in a collective national pay cut by dis-counting the products and services sold in world marketswhile raising the cost of the goods and services purchasedabroad. Exports based on low wages or a cheap currency,then, do not support an attractive standard of living.
To understand competitiveness, the starting pointmust be the underlying sources of prosperity.A nation’sstandard of living is determined by the productivity of itseconomy, which is measured by the value of goods andservices produced per unit of the nation’s human, capital,and natural resources. Productivity depends both on thevalue of a nation’s products and services, measured by theprices they can command in open markets, and the effi-ciency with which they can be produced.
True competitiveness, then, is measured by productiv-ity. Productivity allows a nation to support high wages, astrong currency, and attractive returns to capital—and withthem a high standard of living. Productivity is the goal,not exports per se. Only if a nation expands exports ofproducts or services it can produce productively willnational productivity rise. Productivity is the goal, notwhether firms operating in the country are domestic orforeign owned.What matters most is not ownership, butthe nature and productivity of the companies’ activities ina particular country. Purely local industries also matter forcompetitiveness because their productivity has a majorinfluence on the cost of living and the cost of doing busi-ness, not to mention their level of wages.The productivityof the entire economy matters for the standard of living,not just the traded goods sector.
The world economy is not a zero-sum game. Manynations can improve their prosperity if they can improveproductivity.The central challenge in economic develop-ment, then, is how to create the conditions for rapid andsustained productivity growth.
Microeconomic foundations of productivityStable political, legal, and social institutions and soundmacroeconomic policies create the potential for improvingnational prosperity. But wealth is actually created at themicroeconomic level—in the ability of firms to createvaluable goods and services using efficient methods. Onlyin this way can a nation support high wages and theattractive returns to capital necessary to support sustainedinvestment (see Figure 1).
The microeconomic foundations of productivity reston two interrelated areas: (1) the sophistication with whichdomestic companies or foreign subsidiaries operating inthe country compete, and (2) the quality of the microeco-nomic business environment in which they operate.
The productivity of a country is ultimately set by theproductivity of its companies.An economy cannot becompetitive unless companies operating there are compet-itive, whether they are domestic firms or subsidiaries of
foreign companies. However, the sophistication and pro-ductivity of companies are inextricably intertwined withthe quality of the national business environment. Moreproductive company strategies require more highly skilledpeople, better information, more efficient governmentprocesses, improved infrastructure, better suppliers, moreadvanced research institutions, and more intense competi-tive pressure, among other things.
Companies in a nation must upgrade their ways ofcompeting if successful economic development is tooccur. Broadly, companies must shift from competing onendowments or comparative advantages (low-cost labor ornatural resources) to competing on competitive advantagesarising from superior or distinctive products and processes.Companies must move from tapping foreign distributionchannels to building their own channels.These and othertransitions in corporate strategies and operating practicesrequired for successful economic development are shownin Figure 2.
31
1.2:
Bui
ldin
g th
e M
icro
econ
omic
Fou
ndat
ions
of
Pros
perit
y
Macroeconomic, Political, Legal, and Social Context for Development
Sophistication of Company
Operations andStrategy
Quality of theMicroeconomic
Business Environment
Microeconomic Foundations of Development
Figure 1: Determinants of productivity and productivitygrowth
Low-Income Countries
• Competitive advantages beyondcheap inputs
• Production processsophistication
• Broad value chainpresence
• Reliance on profes-sional management
Middle-IncomeCountries
• Extent of regionalsales
• Control of internation-al distribution
• Extent of branding
• Company spendingon R&D
• Prevalence of foreigntechnology licensing
• Extent of staff training
High-Income Countries
• Capacity for innovation
• Breadth of interna-tional markets
• Extent of incentivecompensation
• Willingness to delegate authority
Figure 2: Company sophistication and economic development
What were strengths in competing at earlier stages ofdevelopment become weaknesses at more advanced levelsof development. Extensive technology licensing works forlower- and middle-income countries, but must give wayto indigenous technology development. Necessary changesare often resisted by the corporate sector because pastapproaches were profitable and because old habits aredeeply ingrained.
Moving to more sophisticated ways of competingdepends on parallel changes in the microeconomic busi-ness environment.The business environment can beunderstood in terms of four interrelated areas: the qualityof factor (input) conditions, the context for firm strategyand rivalry, the quality of local demand conditions, and thepresence of the related and supporting industries. Becauseof their graphical representation (see Figure 3), the fourareas have collectively become referred to as the diamond.
As the diamond framework reveals, almost everythingmatters for competitiveness.The schools matter, the roadsmatter, the financial markets matter, customer sophistica-tion matters, among many other aspects of a nation’s cir-cumstances, many of which are deeply rooted in a nation’sinstitutions, people, and culture.This makes improvingcompetitiveness a special challenge, because there is nosingle policy or grand step that can create competitiveness,only many improvements in individual areas that
inevitably take time to accomplish. Improving competi-tiveness is a marathon, not a sprint. How to sustainmomentum in competitiveness improvements over time isamong the greatest challenges facing countries.
There are distinct influences on competitiveness atmultiple geographic levels: national, state, and local.3 In manycountries, we observe striking differences in economicperformance among subnational regions. In countries suchas China, India, and the United States, the benefits ofdecentralization of economic policy and strong initiativein individual regions is evident.The crucial need for eco-nomic strategies for subnational units such as states orregions is among the most important new directions incompetitiveness thinking and practice.
National productivity can also be enhanced throughcoordinating policies among neighboring countries.Aconcerted effort to improve the business environment isneeded both within countries and across countries.
Government plays an inevitable role in economicdevelopment because it affects many aspects of the busi-ness environment. Government shapes factor conditions,for example, through its training and infrastructure poli-cies.The sophistication of home demand derives in partfrom regulatory standards, consumer protection laws, gov-ernment purchasing practices, and openness to imports.Similar policy influences are present in all four parts of the
32
1.2:
Bui
ldin
g th
e M
icro
econ
omic
Fou
ndat
ions
of
Pros
perit
y
Factor (Input) ConditionsPresence of high quality, specialized inputsavailable to firms
• Human resources• Capital resources• Physical infrastructure• Administrative infrastructure• Information infrastructure• Scientific and technological infrastructure• Natural resources
Related and Supporting Industries• Access to capable, locally based
suppliers and firms in relatedfields
• Presence of clusters instead of isolated industries
Demand Conditions• Sophisticated and demanding
local customer(s)
• Local customer needs that anticipate those elsewhere
• Unusual local demand in special-ized segments that can be servednationally and globally
Figure 3: The microeconomic business environment
Context for Firm Strategy and Rivalry• A local context and rules that
encourage investment and sustained upgrading (e.g.,Intellectual property protection)
• Open and vigorous competitionamong locally based rivals
diamond. Many government departments and agenciesimpinge on competitiveness, as do government entities atthe provincial, state, and city levels.The question is notwhether government has a role, but what that role shouldbe and how to coordinate policies across parts of govern-ment. Many countries have sought to limit the inappro-priate roles of government while ignoring its positiveroles. Government must set the right rules and incentivesand make the public investments needed for a productiveeconomy.
National endowments such as natural resources play adeclining role in competitiveness as the resource intensityof the economy falls and as technology substitutes forresources or opens up new resource locations.The realprices of most resources or resource-intensive goods havebeen falling over the decades. It is the productivity withwhich natural resources can be utilized, not the resourcesthemselves, that normally have the strongest influence onprosperity.Abundant natural resources also carry a risk. Incountries where natural resources are abundant or domi-nate economic activity, forces are set in motion that limitthe development of policies, skills, and attitudes enhancingcompetitiveness. Exploiting and redistributing resourcespoils can become the dominant orientation rather thanenhancing productivity.We explore the relationship
between natural resource endowments and competitive-ness in a later section.
Clusters and economic developmentAn improving business environment gives rise to the for-mation of clusters. Clusters are geographically proximategroups of interconnected companies, suppliers, serviceproviders, and associated institutions in a particular field,linked by commonalities and complementarities. Clusters,such as software in India or high-performance cars inGermany, are often concentrated in a particular regionwithin a larger nation, and sometimes in a single town.
Clusters affect competitiveness in three broad ways.First, they increase the productivity of constituent firms orindustries. Firms with a cluster have more efficient accessto specialized suppliers, employees, information, and train-ing than isolated firms.The presence of a full range ofinputs, machinery, skills, and knowledge promotes greaterefficiency and flexibility than vertical integration or rela-tionships with distant suppliers. In the Boston LifeSciences Cluster, for example, the local presence of sophis-ticated suppliers and research hospitals enables biotechcompanies to access capital and technology while operat-ing more efficiently than in most other locations aroundthe world.
33
1.2:
Bui
ldin
g th
e M
icro
econ
omic
Fou
ndat
ions
of
Pros
perit
y
Figure 4: The Boston Life Sciences Cluster
Source: Institute for Strategy and Competitiveness, Harvard Business School
Surgical Instruments andSupplies
Dental Instruments and Supplies Biological
Products
Health and Beauty Products Health Care Providers
Research Organizations
Biopharma-ceuticalProducts
Medical Equipment
Diagnostic Substances
Ophthalmic Goods
Containers
Educational InstitutionsHarvard University, MIT,
Tufts University, Boston University, University of Massachusetts
Cluster OrganizationsMassMedic, MBC,
NEHI, MTC
Specialized ServicesBanking, Accounting, Legal
Specialized Risk CapitalVC Firms, Angel Networks
Patent Owners and Lessors
Second, clusters increase the capacity for innovationand productivity growth. Opportunities for innovation canoften be perceived more easily within clusters, and theassets, skills, and capital are more available to pursue them.In the Boston Life Sciences Cluster, for example, the pres-ence of world-class research universities, teaching hospitals,competing biotech companies, and cluster institutions thatfacilitate interaction among them provide a fertile groundfor new ideas and foster the rapid dissemination of knowl-edge: Between 1996 and 2000, Boston generated thehighest number of life science patents of any economicarea in the United States.
Third, clusters stimulate and enable new business for-mation that supports innovation and expands the cluster.The local presence of experienced workers and access toall the needed inputs and specialized services, for example,reduces the barriers to entry. In Boston, the availability ofhighly experienced managers, researchers, and techniciansin the life science field; and access to specialized venturecapital providers, lawyers, and suppliers all reduce the costsand risks of starting a new life sciences company.Themany local options for employment in other cluster com-panies lower the perceived risk of failure.
National economies tend to specialize in particularclusters, which account for a disproportionate share oftheir output and exports.This specialization is even moreevident in subnational regions.The nature and depth ofclusters varies with the state of development of the econo-my. In developing countries, clusters are normally shallowor underdeveloped. Firms compete based on cheap laboror local natural resources, and they depend heavily onimported components, machinery, and technology.Specialized local infrastructure and institutions are absentor inefficient which limits local processing of products andlimits quality.As economies advance, clusters develop anddeepen to include suppliers of specialized inputs, compo-nents, machinery, and services; specialized infrastructure;and institutions providing specialized training, education,information, research, and technical support.
It is rare that there is only a single cluster in theworld in a given field; usually there is an array of clustersin different locations with different levels of sophisticationand specialization. In a given field, only a small number ofclusters tend to be true innovation centers, such as SiliconValley and Japan in semiconductors.These innovation cen-ters sometimes specialize in particular market segments—the Silicon Valley cluster is unusually strong in micro-processors. Other locations may be manufacturing centers.Still other clusters can be regional assembly and serviceclusters.
Firms based in the most advanced clusters often seedor enhance clusters in other locations as they dispersesome activities to reduce risk, access lower cost inputs, orbetter serve particular regional markets. Intel, for example,
has moved some assembly and testing and some wafer fabrication to a number of non-US locations that havebecome regional clusters.The challenge for an economy isto move from isolated firms to an array of clusters, andupgrade the sophistication of clusters to more advancedactivities.
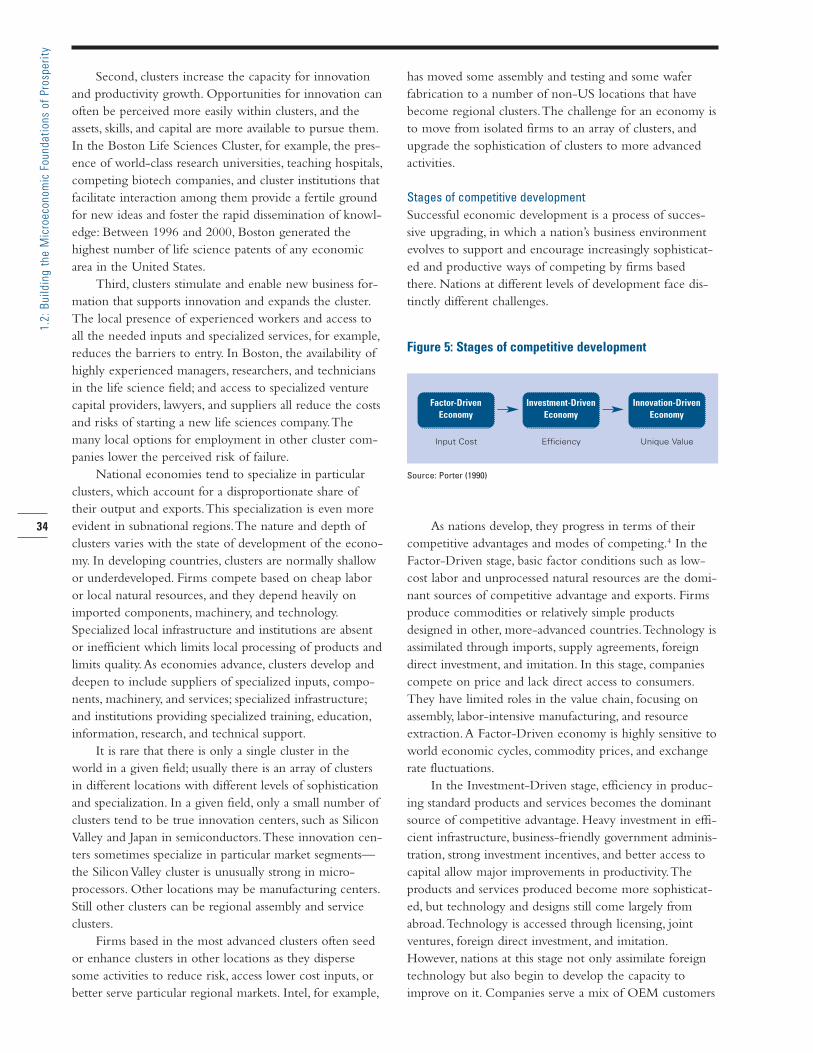
Stages of competitive developmentSuccessful economic development is a process of succes-sive upgrading, in which a nation’s business environmentevolves to support and encourage increasingly sophisticat-ed and productive ways of competing by firms basedthere. Nations at different levels of development face dis-tinctly different challenges.
As nations develop, they progress in terms of theircompetitive advantages and modes of competing.4 In theFactor-Driven stage, basic factor conditions such as low-cost labor and unprocessed natural resources are the domi-nant sources of competitive advantage and exports. Firmsproduce commodities or relatively simple productsdesigned in other, more-advanced countries.Technology isassimilated through imports, supply agreements, foreigndirect investment, and imitation. In this stage, companiescompete on price and lack direct access to consumers.They have limited roles in the value chain, focusing onassembly, labor-intensive manufacturing, and resourceextraction.A Factor-Driven economy is highly sensitive toworld economic cycles, commodity prices, and exchangerate fluctuations.
In the Investment-Driven stage, efficiency in produc-ing standard products and services becomes the dominantsource of competitive advantage. Heavy investment in effi-cient infrastructure, business-friendly government adminis-tration, strong investment incentives, and better access tocapital allow major improvements in productivity.Theproducts and services produced become more sophisticat-ed, but technology and designs still come largely fromabroad.Technology is accessed through licensing, jointventures, foreign direct investment, and imitation.However, nations at this stage not only assimilate foreigntechnology but also begin to develop the capacity toimprove on it. Companies serve a mix of OEM customers
34
1.2:
Bui
ldin
g th
e M
icro
econ
omic
Fou
ndat
ions
of
Pros
perit
y
Figure 5: Stages of competitive development
Source: Porter (1990)
Input Cost
Factor-Driven Economy
Efficiency
Investment-Driven Economy
Unique Value
Innovation-Driven Economy
and end users. Firms extend capabilities more widely inthe value chain.An Investment-Driven economy is con-centrated on manufacturing and on outsourced serviceexports. It is susceptible to financial crises and external,sector-specific demand shocks.
In the Innovation-Driven stage, the ability to produceinnovative products and services at the global technologyfrontier, using the most advanced methods, becomes thedominant source of competitive advantage.The nationalbusiness environment is characterized by strengths in allareas, together with the presence of deep clusters.Institutions and incentives supporting innovation are welldeveloped. Companies compete with unique strategiesthat are often global in scope.An Innovation-Driveneconomy has a high share of services in the economy andis resilient to external shocks. (See Chapter 2.3 for a moreextensive discussion on the sources of innovative capacityat the national level and comparisons across countries.)
Seeing economic development as a sequential processof building interdependent microeconomic capabilities,shifting company strategies, improving incentives, andincreasing rivalry exposes important pitfalls in economicpolicy.The influence of one part of the microeconomicbusiness environment depends on the state of others. Lackof improvement in any important area can lead to aplateau in productivity growth and stalled development.Worse still, it can undermine the whole economic reformprocess.When well-trained college graduates cannot findappropriate jobs because companies are still competingbased on cheap labor, for example, a backlash against busi-ness is created.
This analysis also begins to reveal why countries findthe transition to a new stage of development so difficult.Such inflection points require wholesale transformation ofmany interdependent aspects of competition.The centraland eastern European countries poised to join theEuropean Union (EU) face such challenges.With a legalframework and many EU policies designed for currentmembers of the EU, they must compete despite havingeconomies at a different level.The strong EU focus ontechnological innovation rather than applying establishedprocesses, for example, is out of sync with the challengesof integrating into tougher European markets.
Institutions and roles in economic developmentAlthough government is important to competitiveness,government alone is less and less able to build a competi-tive economy. Many other national and local institutionsalso have a role in competitiveness and economic develop-ment.The influence of universities and schools is growingas knowledge and technology become more and morecentral to competition. Universities and schools must not
only improve the educational and research capabilities, butbecome better connected to the private sector.
The private sector has also become a crucial actor inimproving competitiveness and in setting economic policy.The private sector is not only a consumer of the businessenvironment, but it also can and must play a role in shap-ing it. Individual firms, through steps such as establishingeducational programs, attracting suppliers, or defining stan-dards, not only benefit themselves but also improve theoverall environment for competing. Collective industrybodies, such as trade associations and chambers of com-merce, also have important roles to play in improvinginfrastructure, providing training, and developing exportmarkets that are often overlooked. Collective efforts toenhance the capabilities of individual companies, such asquality certification programs and manufacturing assistancecenters, are becoming more prominent. Engagement ofthe private sector in competitiveness is also important toprovide the continuity of attention necessary to sustainprogress through changes of government and to counter-act the relatively short attention span of political leaders.
Finally, a whole class of institutions, which we termInstitutions for Collaboration (IFCs), play an important rolein competitiveness, though they have been largely ignoredin economic development thinking.5 Neither governmentagencies, educational institutions, nor firms, these organi-zations—trade associations, entrepreneur networks, stan-dard setting agencies, quality centers, technology networks,and many others—are common.They are especially preva-lent in the most advanced economies, but also play crucialroles in developing countries. IFCs play an essential role inconnecting the parts of the diamond and fostering effi-cient collective activities in both advanced and developingcountries.
The relationship between macroeconomic and microeco-nomic policyOur analysis makes it clear why the traditional focus onmacroeconomic stabilization and market opening is insufficient. Macroeconomic policies fostering high ratesof capital investment, for example, will not translate intorising productivity unless the forms of investment areappropriate, the company skills and supporting industriesare present to make the investments efficient, and strongcompetitive pressures and adequate corporate governanceprovide the needed market discipline. Sound monetaryand fiscal policies and the removal of distortions inexchange rates and other prices will eliminate impedi-ments to productivity, but microeconomic foundationsmust be in place if productivity is actually to increase.
Appropriate levels of foreign debt depend on micro-economic circumstances.The prudence of foreign debtlevels depends on exactly where the foreign capital isinvested, together with the microeconomic fundamentals
35
1.2:
Bui
ldin
g th
e M
icro
econ
omic
Fou
ndat
ions
of
Pros
perit
y
surrounding its deployment and governance. Regulatingoverall debt levels is less important, in many ways, thanimproving the microeconomic foundations.
High rates of public investment in human capital willnot pay off unless a nation’s microeconomic circumstancescreate the demand for skills in companies. Privatizationwill not boost prosperity unless companies can improveefficiency and are pressured by local competition. Forsound policies at the macroeconomic level to translateinto an increasingly productive economy, then, parallelmicroeconomic improvements must take place.
The effects of trade agreements and other marketopening measures, a major focus in today’s internationaleconomic policymaking, also depends on microeconomicpolicies. Market opening is good, but its benefits in termsof prosperity depend on microeconomic progress. If thelocal business environment does not become more effi-cient and local companies do not improve their productiv-ity and sophistication, then market opening will boostimports, while growth in exports and the attraction of for-eign investment will be painfully slow. Improvement in themicroeconomic business environment begins before marketopening measures are complete.
A greater focus on microeconomic reforms will payanother essential dividend.While macro reforms almostinevitability inflict hardship in the short and medium runthrough raising interest rates and prices while cutting pub-lic expenditures, micro reforms can produce tangible andvisible benefits for citizens. Breaking up local cartels andmonopolies, for example, lowers the cost of food, housing,electricity, telephone service, and other costs of living.Regulatory reform can rapidly begin to ease inefficiencies,reduce pollution, improve product quality, and end unsafepractices. Bold steps to improve the quality of educationand training are particularly important because they offerthe hope of a better life for children. If citizens see busi-nesses reforming themselves and having to confront toughcompetitive challenges, they themselves will be more will-ing to live with personal sacrifices and less likely to sidewith antireform interest groups.The political will andpublic support to make real economic change is elevated.
Ranking competitiveness
Measures of competitivenessThe Business Competitiveness Index (BCI) is constructedfrom measures drawn primarily from the survey of 7,707senior business leaders in 101 countries, shown in Table 1.6
Compared to 2002 we have added 21 countries:Algeria,Angola, Cameroon, Chad, Egypt, Ethiopia, Gambia,Ghana, Kenya, Macedonia, Madagascar, Malawi, Mali,Malta, Mozambique, Pakistan, Senegal, Serbia,Tanzania,Uganda, and Zambia. Egypt has been restored to the rank-
ings after having been excluded last year due to theunavailability of Survey data.
Measuring competitiveness is challenging because ofthe sheer number and variety of influences that shapenational productivity. Only through a detailed survey cantextured measures of the competitive environment andcompany practices be assembled across many countries.The Survey questions aim to capture the state of circum-stances in a nation, but do so in way that is meaningful forSurvey respondents. For example, we get at the stock ofbasic human capital with a question on the quality ofpublic schools because this is something that respondentscan compare more readily across countries.The quality ofschools, a flow measure, will be highly correlated with thestock of basic skills.
Quantitative measures are utilized for patenting rates,Internet penetration, and cellular phone penetration. Forall of the other dimensions we measure, however, quantita-tive data are simply unavailable, especially for so manycountries.The Survey not only offers many unique meas-ures, but captures the informed judgments of thousands ofactual participants in the economies examined.The Surveyresponses are important in their own right, because theyreflect the attitudes of the decision makers that ultimatelydetermine economic activity.
In an effort to broaden the rankings, a large numberof low income countries participated in the Survey thisyear for the first time, many with relatively isolatedeconomies. In view of this, we undertook additionalefforts to examine the consistency of the survey data. Foreach Survey question we compared the standard deviationof answers within a country to the standard deviation ofanswers across all countries.This is a weak statistical testthat the vast majority of countries easily meet. However,in those countries with high within-country variance ofresponses for many Survey questions, it is hard to interpretthe country averages independently of the possible reasonsfor the variances.7 In addition to examining all responsesfor each country, we further analyzed within-countryconsensus in the subset of responses from executives fromforeign companies operating in the country.We expectthese respondents to have the best perspective on how thecountry compares to others.
For the 80 countries ranked last year, there were fewdata issues.8 We rank the 80 countries in last year’s sampleand compare their rankings to previous years in Table 1.
Of the new countries, 15 countries had overall surveydata with a high degree of within-country consensus orforeign company responses with a high degree of within-country consensus.9 The original 80 countries plus thisgroup constituted a 95-country sample that was used tocalculate the regression utilized to validate variables and tocompute the Index model.The final 6 countries, all low-income countries, had low within-country consensus,
BCI rankingCompany operations and strategy ranking
Quality of the national business environment ranking
2002 GDP per capita
(PPP-adjusted)*
2002 GDP per
capitarank
Table 1: The Business Competitiveness Index, constant country sample of 80 countries
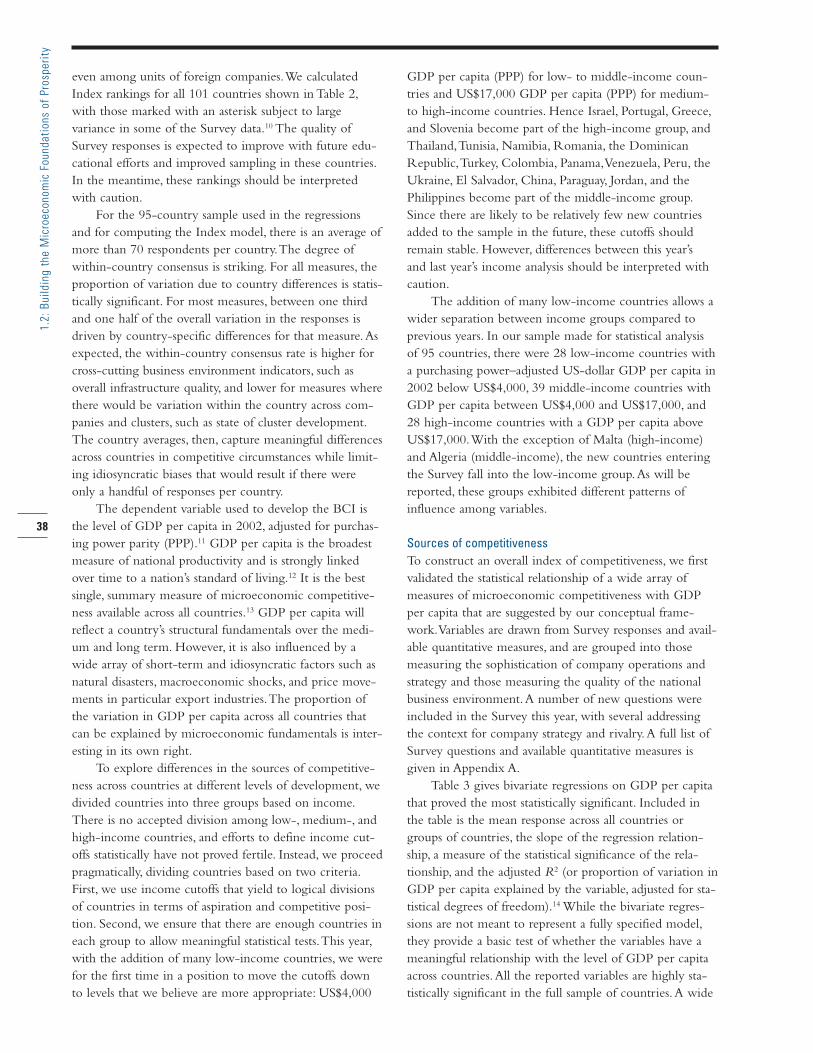
even among units of foreign companies.We calculatedIndex rankings for all 101 countries shown in Table 2,with those marked with an asterisk subject to large variance in some of the Survey data.10 The quality ofSurvey responses is expected to improve with future edu-cational efforts and improved sampling in these countries.In the meantime, these rankings should be interpretedwith caution.
For the 95-country sample used in the regressionsand for computing the Index model, there is an average ofmore than 70 respondents per country.The degree ofwithin-country consensus is striking. For all measures, theproportion of variation due to country differences is statis-tically significant. For most measures, between one thirdand one half of the overall variation in the responses isdriven by country-specific differences for that measure.Asexpected, the within-country consensus rate is higher forcross-cutting business environment indicators, such asoverall infrastructure quality, and lower for measures wherethere would be variation within the country across com-panies and clusters, such as state of cluster development.The country averages, then, capture meaningful differencesacross countries in competitive circumstances while limit-ing idiosyncratic biases that would result if there wereonly a handful of responses per country.
The dependent variable used to develop the BCI isthe level of GDP per capita in 2002, adjusted for purchas-ing power parity (PPP).11 GDP per capita is the broadestmeasure of national productivity and is strongly linkedover time to a nation’s standard of living.12 It is the bestsingle, summary measure of microeconomic competitive-ness available across all countries.13 GDP per capita willreflect a country’s structural fundamentals over the medi-um and long term. However, it is also influenced by awide array of short-term and idiosyncratic factors such asnatural disasters, macroeconomic shocks, and price move-ments in particular export industries.The proportion ofthe variation in GDP per capita across all countries thatcan be explained by microeconomic fundamentals is inter-esting in its own right.
To explore differences in the sources of competitive-ness across countries at different levels of development, wedivided countries into three groups based on income.There is no accepted division among low-, medium-, andhigh-income countries, and efforts to define income cut-offs statistically have not proved fertile. Instead, we proceedpragmatically, dividing countries based on two criteria.First, we use income cutoffs that yield to logical divisionsof countries in terms of aspiration and competitive posi-tion. Second, we ensure that there are enough countries ineach group to allow meaningful statistical tests.This year,with the addition of many low-income countries, we werefor the first time in a position to move the cutoffs downto levels that we believe are more appropriate: US$4,000
GDP per capita (PPP) for low- to middle-income coun-tries and US$17,000 GDP per capita (PPP) for medium-to high-income countries. Hence Israel, Portugal, Greece,and Slovenia become part of the high-income group, andThailand,Tunisia, Namibia, Romania, the DominicanRepublic,Turkey, Colombia, Panama,Venezuela, Peru, theUkraine, El Salvador, China, Paraguay, Jordan, and thePhilippines become part of the middle-income group.Since there are likely to be relatively few new countriesadded to the sample in the future, these cutoffs shouldremain stable. However, differences between this year’s and last year’s income analysis should be interpreted withcaution.
The addition of many low-income countries allows awider separation between income groups compared toprevious years. In our sample made for statistical analysisof 95 countries, there were 28 low-income countries witha purchasing power–adjusted US-dollar GDP per capita in2002 below US$4,000, 39 middle-income countries withGDP per capita between US$4,000 and US$17,000, and28 high-income countries with a GDP per capita aboveUS$17,000.With the exception of Malta (high-income)and Algeria (middle-income), the new countries enteringthe Survey fall into the low-income group.As will bereported, these groups exhibited different patterns ofinfluence among variables.
Sources of competitivenessTo construct an overall index of competitiveness, we firstvalidated the statistical relationship of a wide array ofmeasures of microeconomic competitiveness with GDPper capita that are suggested by our conceptual frame-work.Variables are drawn from Survey responses and avail-able quantitative measures, and are grouped into thosemeasuring the sophistication of company operations andstrategy and those measuring the quality of the nationalbusiness environment.A number of new questions wereincluded in the Survey this year, with several addressingthe context for company strategy and rivalry.A full list ofSurvey questions and available quantitative measures isgiven in Appendix A.
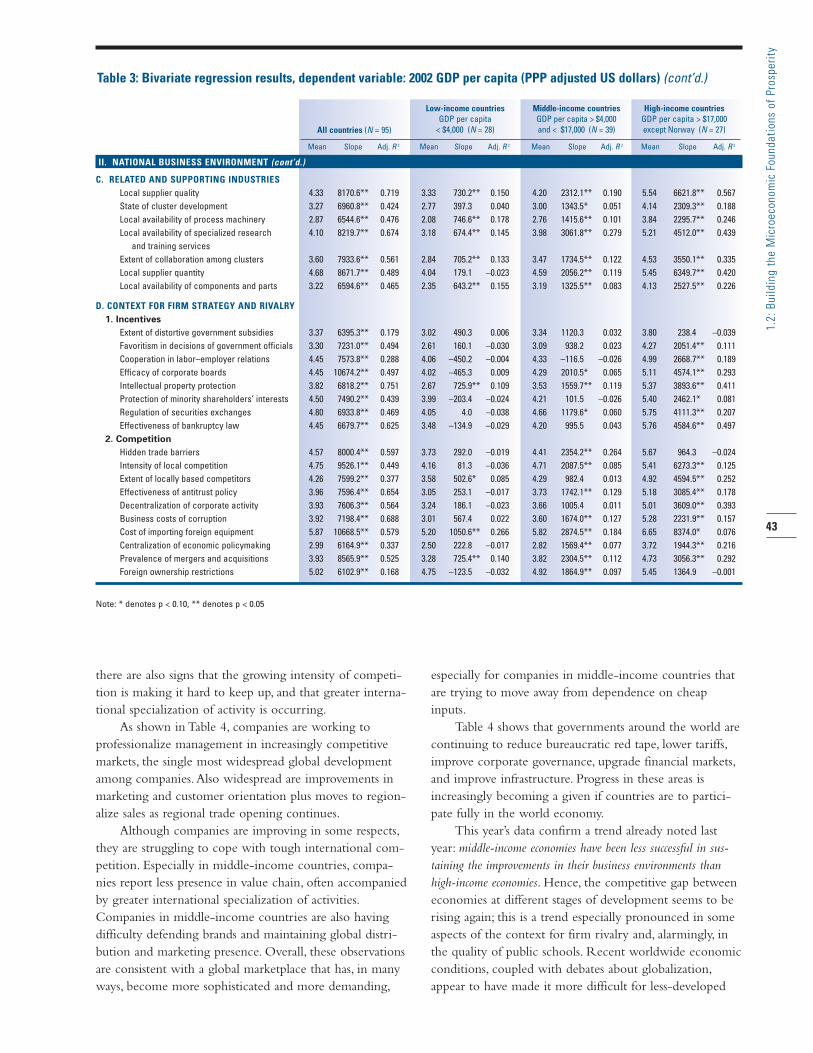
Table 3 gives bivariate regressions on GDP per capitathat proved the most statistically significant. Included inthe table is the mean response across all countries orgroups of countries, the slope of the regression relation-ship, a measure of the statistical significance of the rela-tionship, and the adjusted R2 (or proportion of variation inGDP per capita explained by the variable, adjusted for sta-tistical degrees of freedom).14 While the bivariate regres-sions are not meant to represent a fully specified model,they provide a basic test of whether the variables have ameaningful relationship with the level of GDP per capitaacross countries.All the reported variables are highly sta-tistically significant in the full sample of countries.A wide
* Survey data for these countries have high within-country variance. Until the reliability of Survey responses improves with future educational efforts andimproved sampling in these countries, their rankings should be interpreted with caution.
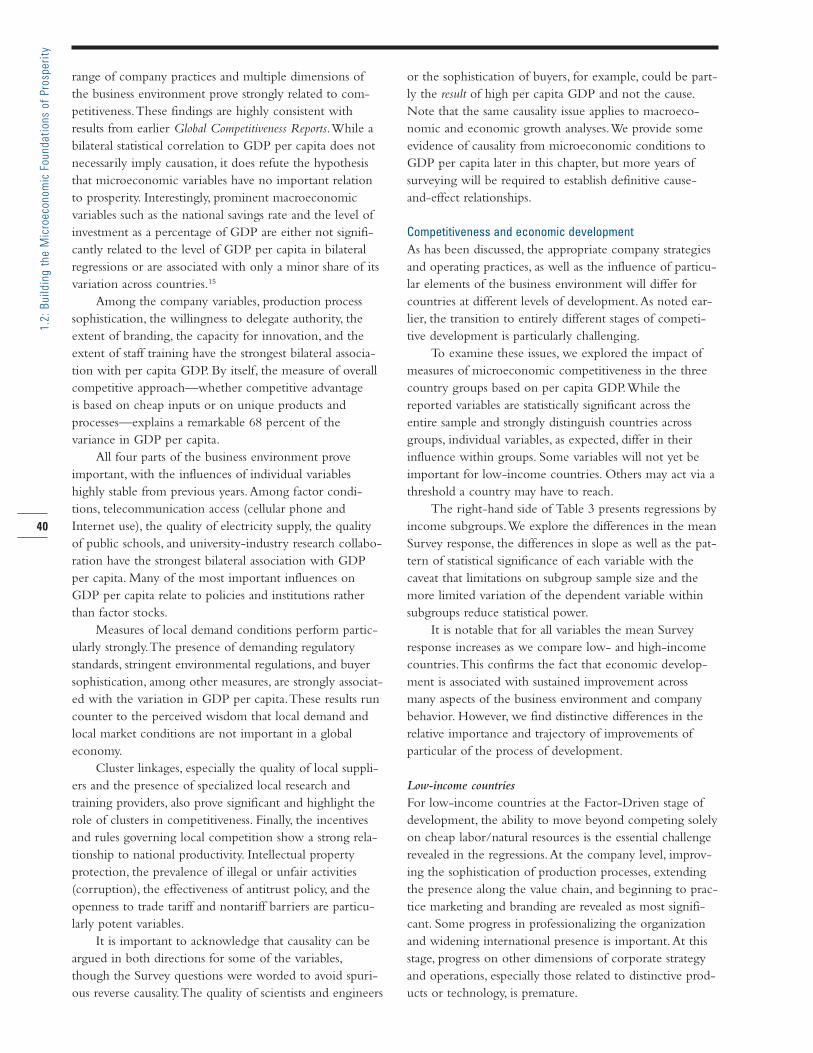
range of company practices and multiple dimensions ofthe business environment prove strongly related to com-petitiveness.These findings are highly consistent withresults from earlier Global Competitiveness Reports.While abilateral statistical correlation to GDP per capita does notnecessarily imply causation, it does refute the hypothesisthat microeconomic variables have no important relationto prosperity. Interestingly, prominent macroeconomicvariables such as the national savings rate and the level ofinvestment as a percentage of GDP are either not signifi-cantly related to the level of GDP per capita in bilateralregressions or are associated with only a minor share of itsvariation across countries.15
Among the company variables, production processsophistication, the willingness to delegate authority, theextent of branding, the capacity for innovation, and theextent of staff training have the strongest bilateral associa-tion with per capita GDP. By itself, the measure of overallcompetitive approach—whether competitive advantage is based on cheap inputs or on unique products andprocesses—explains a remarkable 68 percent of the variance in GDP per capita.
All four parts of the business environment proveimportant, with the influences of individual variableshighly stable from previous years.Among factor condi-tions, telecommunication access (cellular phone andInternet use), the quality of electricity supply, the qualityof public schools, and university-industry research collabo-ration have the strongest bilateral association with GDPper capita. Many of the most important influences onGDP per capita relate to policies and institutions ratherthan factor stocks.
Measures of local demand conditions perform partic-ularly strongly.The presence of demanding regulatorystandards, stringent environmental regulations, and buyersophistication, among other measures, are strongly associat-ed with the variation in GDP per capita.These results runcounter to the perceived wisdom that local demand andlocal market conditions are not important in a globaleconomy.
Cluster linkages, especially the quality of local suppli-ers and the presence of specialized local research andtraining providers, also prove significant and highlight therole of clusters in competitiveness. Finally, the incentivesand rules governing local competition show a strong rela-tionship to national productivity. Intellectual property protection, the prevalence of illegal or unfair activities(corruption), the effectiveness of antitrust policy, and theopenness to trade tariff and nontariff barriers are particu-larly potent variables.
It is important to acknowledge that causality can beargued in both directions for some of the variables,though the Survey questions were worded to avoid spuri-ous reverse causality.The quality of scientists and engineers
or the sophistication of buyers, for example, could be part-ly the result of high per capita GDP and not the cause.Note that the same causality issue applies to macroeco-nomic and economic growth analyses.We provide someevidence of causality from microeconomic conditions toGDP per capita later in this chapter, but more years ofsurveying will be required to establish definitive cause-and-effect relationships.
Competitiveness and economic developmentAs has been discussed, the appropriate company strategiesand operating practices, as well as the influence of particu-lar elements of the business environment will differ forcountries at different levels of development.As noted ear-lier, the transition to entirely different stages of competi-tive development is particularly challenging.
To examine these issues, we explored the impact ofmeasures of microeconomic competitiveness in the threecountry groups based on per capita GDP.While thereported variables are statistically significant across theentire sample and strongly distinguish countries acrossgroups, individual variables, as expected, differ in theirinfluence within groups. Some variables will not yet beimportant for low-income countries. Others may act via athreshold a country may have to reach.
The right-hand side of Table 3 presents regressions byincome subgroups.We explore the differences in the meanSurvey response, the differences in slope as well as the pat-tern of statistical significance of each variable with thecaveat that limitations on subgroup sample size and themore limited variation of the dependent variable withinsubgroups reduce statistical power.
It is notable that for all variables the mean Surveyresponse increases as we compare low- and high-incomecountries.This confirms the fact that economic develop-ment is associated with sustained improvement acrossmany aspects of the business environment and companybehavior. However, we find distinctive differences in therelative importance and trajectory of improvements ofparticular of the process of development.
Low-income countriesFor low-income countries at the Factor-Driven stage ofdevelopment, the ability to move beyond competing solelyon cheap labor/natural resources is the essential challengerevealed in the regressions.At the company level, improv-ing the sophistication of production processes, extendingthe presence along the value chain, and beginning to prac-tice marketing and branding are revealed as most signifi-cant. Some progress in professionalizing the organizationand widening international presence is important.At thisstage, progress on other dimensions of corporate strategyand operations, especially those related to distinctive prod-ucts or technology, is premature.
40
1.2:
Bui
ldin
g th
e M
icro
econ
omic
Fou
ndat
ions
of
Pros
perit
y
Low-income countries score low on most measuresof the business environment, but especially on infrastruc-ture, educational quality, cluster development, capitalaccess, and measures related to technology and innovation.Priorities for improving the business environment in low-income countries revealed in the regressions start withupgrading the quality of infrastructure (including electrici-ty, communications, and transportation networks) andschools.Also revealed as important are the creation offinancial markets (access to risk capital and loans), thestrengthening of emerging clusters (local supplier quality,local availability of machinery and components, and localavailability of process machinery), and the opening ofcompetitive processes (reduction of trade barriers andfavoritism in decisions by government officials).All thesesteps create a foundation of efficiency, transparency, andcompetitive pressure that supports Factor-Driven competi-tion. Other aspects of the business environment, such asexpanding the availability of scientists and engineers, andupdating regulatory standards are not yet priorities at thisstage of development.
Middle-income countriesMoving into middle income, the task is to move beyondFactor-Driven competition to the Investment-Drivenstage.The regressions suggest the following patterns:improving production process sophistication remains thesingle most important corporate priority. But companiesmust also begin to build brands (versus relying on com-modities or products designed by foreign OEMs), expandregional and international markets, create the capacity fortechnology absorption and innovation, and increase theprofessionalism of employees and management.Theirbiggest challenge remains the nature of their competitiveadvantages, often still based solely on low cost of produc-tion inputs.
To reach the middle-income level, countries musthave improved in basic factor conditions such as physicalinfrastructure and human resources. Continued progress insome of those areas remains important, with publicschools, electricity supply, telecommunication quality, andInternet usage particularly significant, as revealed in theregressions. Success as a middle-income county also raisesnew challenges in the business environment. Improvinguniversity-industry research collaboration and the qualityof research institutions becomes important.The quality ofthe judicial system becomes significant. Improving localdemand conditions, for example through more stringentenvironmental and consumer protection laws, is needed topressure improvements in producer quality.All aspects ofcluster development become significant, with wideningthe supplier base and improving the availability of special-ized research and training institutions registering thegreatest absolute impact in statistical terms. Finally, moving
to higher levels of competition and rivalry is needed inmany dimensions, including tariff and nontariff barrier lib-eralization, improving antitrust policy, and opening themarket for corporate control.
High-income countriesTo reach high-income status, improvement in quality andefficiency are no longer enough.The hurdle is to move tothe Innovation-Driven stage.The patterns of regressionssuggest the following priorities: companies must developthe ability to innovate at the world technology frontier,create unique product designs, become experts in market-ing, build international brands, and sell their products andservices globally. Reliance on foreign technology becomesa negative. In order to accomplish this transformation, aseries of organizational changes such as extensive stafftraining, use of greater incentive compensation, and theability to professionalize management and delegateauthority becomes necessary.
High-income countries have all achieved strengths inmany aspects of the business environment. Continuing toimprove infrastructure, simplicity and fairness of regula-tion, and schools remain important.The factors that distin-guish high-income countries are concentrated in areasconnected to innovation and the creation of distinctivestrategies: the quality of management education, availabili-ty of scientific talent, the quality of research institutions,the extent of research collaboration with universities,venture capital availability, the sophistication of demandconditions (eg, demanding regulatory standards and localbuyer sophistication), deep cluster development, decentral-ization of corporate activity away from large businessgroups, and sophisticated regulatory rules on bankruptcyand corporate governance.
Trends in competitiveness in the global economyWith several years of consistent Survey data, we can exam-ine the trends in the variables that offset competitivenessbetween the 1998 Survey and the 2003 Survey.16 Table 4identifies those variables where substantial changes incompany practices and the quality of the business environ-ment, defined as greater than 10 percent positive or nega-tive changes in the mean Survey responses between 1998and 2003, were registered in eight more countries, or 15percent of the sample of 52 countries for which we havesix years of data. Other measures of change (fixed absolutechanges or different percentage cutoffs) produce virtuallyidentical results.
Overall, there is clear upgrading in national businessenvironments.The bar is rising, and improvement here isneeded just to maintain position vis-à-vis other countries.In company operations and strategy, companies are pro-gressing along some dimensions in many countries but
41
1.2:
Bui
ldin
g th
e M
icro
econ
omic
Fou
ndat
ions
of
Pros
perit
y
42
1.2:
Bui
ldin
g th
e M
icro
econ
omic
Fou
ndat
ions
of
Pros
perit
y
Mean Slope Adj. R 2 Mean Slope Adj. R 2 Mean Slope Adj. R 2 Mean Slope Adj. R 2
I. COMPANY OPERATIONS & STRATEGY
Production process sophistication 3.86 7378.6** 0.825 2.68 1198.5** 0.398 3.60 3573.9** 0.370 5.40 4282.3** 0.472Nature of competitive advantage 3.55 7040.8** 0.678 2.82 504.3 0.026 3.06 1960.5** 0.081 4.99 2260.7** 0.254Extent of staff training 3.91 8120.4** 0.705 3.04 660.6* 0.075 3.68 1775.5** 0.116 5.11 4583.9** 0.503Extent of marketing 4.30 7559.3** 0.689 3.26 655.6** 0.179 4.17 2347.5** 0.211 5.54 5597.1** 0.533Willingness to delegate authority 3.70 8250.4** 0.731 2.83 739.4* 0.080 3.45 1928.0* 0.073 4.89 3485.4** 0.432Capacity for innovation 3.49 7617.3** 0.720 2.62 708.0* 0.087 3.17 2981.8** 0.275 4.82 2726.7** 0.293Company spending on research and 3.44 8196.3** 0.630 2.71 511.0 0.039 3.20 2625.6** 0.183 4.53 2877.8** 0.273
Table 3: Bivariate regression results, dependent variable: 2002 GDP per capita (PPP adjusted US dollars) (cont’d.)
Low-income countriesGDP per capita
< $4,000 (N = 28)
Middle-income countriesGDP per capita > $4,000 and < $17,000 (N = 39)
High-income countriesGDP per capita > $17,000except Norway (N = 27)
there are also signs that the growing intensity of competi-tion is making it hard to keep up, and that greater interna-tional specialization of activity is occurring.
As shown in Table 4, companies are working to professionalize management in increasingly competitivemarkets, the single most widespread global developmentamong companies.Also widespread are improvements inmarketing and customer orientation plus moves to region-alize sales as regional trade opening continues.
Although companies are improving in some respects,they are struggling to cope with tough international com-petition. Especially in middle-income countries, compa-nies report less presence in value chain, often accompaniedby greater international specialization of activities.Companies in middle-income countries are also havingdifficulty defending brands and maintaining global distri-bution and marketing presence. Overall, these observationsare consistent with a global marketplace that has, in manyways, become more sophisticated and more demanding,
especially for companies in middle-income countries thatare trying to move away from dependence on cheapinputs.
Table 4 shows that governments around the world arecontinuing to reduce bureaucratic red tape, lower tariffs,improve corporate governance, upgrade financial markets,and improve infrastructure. Progress in these areas isincreasingly becoming a given if countries are to partici-pate fully in the world economy.
This year’s data confirm a trend already noted lastyear: middle-income economies have been less successful in sus-taining the improvements in their business environments thanhigh-income economies. Hence, the competitive gap betweeneconomies at different stages of development seems to berising again; this is a trend especially pronounced in someaspects of the context for firm rivalry and, alarmingly, inthe quality of public schools. Recent worldwide economicconditions, coupled with debates about globalization,appear to have made it more difficult for less-developed
countries to sustain the investments and policies needed toimprove their competitiveness, a dangerous development.Also, the data reveal the disturbing trend in high-incomecountries to resort to distortive government subsidies toshelter their economies from global competition.
Ranking competitivenessTo derive an overall Business Competitiveness Index(BCI), we compute subindexes measuring the sophistica-tion of company operations and strategy and the quality ofthe national business environment. Because many of thedimensions of company sophistication and the quality ofthe business environment tend to move together, the sam-ple of countries is relatively small, and the number of rele-vant variables is high, the impact of individual variables isdifficult to distinguish statistically. Hence we use commonfactor analysis instead of multiple regressions to computethe subindexes.The first common factors defined as the
index accounts for 82.2 percent of the variation amongcompany sophistication measures and 69.8 percent of thevariation among national business environment measures.
The weighted average of the two subindexes isdefined as the BCI.The weights are determined from thecoefficients of a multiple regression of the subindexes onGDP per capita.This procedure results in a weight of 0.66(2002: 0.63) for national business environment and 0.34(2002: 0.37) for company operations and strategy, quitestable in comparison with last year’s weights.When weinclude an interaction term in the regression on GDP percapita of the two subindexes, it proves to be positive andsignificant.This means that the benefits of a better businessenvironment for prosperity are increasing with the sophis-tication of company operations and strategy, and viceversa. Countries that improve both the business environ-ment and company sophistication in tandem reap dispro-portionate benefits, while countries where there is animbalance bear disproportionate costs.
44
1.2:
Bui
ldin
g th
e M
icro
econ
omic
Fou
ndat
ions
of
Pros
perit
y
Table 4: Significant changes in competitive conditions in eight or more countries, 1998–2003
Sophistication of CompanyOperations and Strategy
Quality of the BusinessEnvironment
Improving international competitive conditionsNo. of countries
Total L M H
Reliance on professional management...................41 3 17 21Extent of marketing .....................................................23 2 7 14Degree of customer orientation................................23 2 11 10Extent of regional sales..............................................21 2 9 10Extent of staff training ................................................17 2 5 10Nature of competitive advantage.............................12 3 6 3Prevalence of foreign technology licensing.............8 2 4 2
Extent of bureaucratic red tape................................48 5 21 22Cost of importing foreign equipment........................37 5 17 15Efficacy of corporate boards.....................................33 4 14 15Financial market sophistication ................................32 4 15 13Overall infrastructure quality ....................................28 2 13 13Extent of locally based competitors.........................25 1 9 15Quality of scientific research institutions ...............24 4 13 7Railroad infrastructure development .......................22 2 13 7Favoritism in decisions of government officials ....21 1 7 13Quality of management schools ...............................21 1 9 11Air transport infrastructure quality ..........................18 2 12 4Port infrastructure quality..........................................17 2 7 8Local supplier quantity ...............................................17 2 10 5Reliability of police services......................................15 1 11 3Presence of demanding regulatory standards ......15 3 8 4Effectiveness of antitrust policy ...............................14 2 6 6Venture capital availability ........................................13 1 6 6Telephone/fax infrastructure quality........................12 1 10 1Quality of public schools............................................12 1 1 10Hidden trade barriers .................................................12 2 4 6Local equity market access.......................................11 2 4 5University/industry research collaboration ............10 2 4 4Efficiency of legal framework .....................................8 2 3 3Administrative burden for startups ............................8 1 3 4
Worsening international competitive conditionsNo. of countries
Total L M H
Value chain presence.................................................29 4 19 6Extent of branding .......................................................26 4 17 5Breadth of international markets..............................24 4 15 5Control of international distribution .........................16 2 7 7Capacity for innovation ..............................................12 1 8 3Production process sophistication ..........................12 1 9 2Nature of competitive advantage...............................9 1 7 1Prevalence of foreign technology licensing.............8 1 — 7
Extent of distortive government subsidies..............26 3 9 14Judicial independence ...............................................21 2 10 9Efficiency of legal framework ...................................21 2 13 6Venture capital availability ........................................20 2 12 6Administrative burden for startups ..........................18 2 10 6Intellectual property protection ................................16 2 8 6Quality of public schools............................................16 4 11 1Buyer sophistication ...................................................16 1 8 7Favoritism in decisions of government officials ....14 2 9 3Local equity market access.......................................14 1 5 8University/industry research collaboration ............11 2 3 6Reliability of police services........................................9 1 3 5Railroad infrastructure development .........................8 3 2 3Air transport infrastructure quality ............................8 3 1 4
Note: L, M, and H refer to low- , middle- , and high-income countries, respectively. Significant change is defined as 10 percent or more change in country average scoreover the 5-year period from the score of year 1998. There are 5 low- , 21 middle- , and 26 high-income countries in this sample.
Figure 6 plots BCI against 2002 GDP per capita foreach country in the sample of 95 countries used to devel-op the model.The regression line is shown, together withbands above and below the regression line that delineatethe 95 percent confidence forecast region.17 Only twocountries, Norway and India, fall outside the forecastregion. Differences in BCI account for a remarkable 83 percentof variation in GDP per capita across a widely disparate group ofcountries.
This year, we have modified the regression to allowfor a nonlinear relationship between the BCI and GDPper capita.The resulting polynomial regression indicates ahigher impact on GDP per capita of improvements inBCI for higher-income countries than for lower-incomecountries.This finding has a number of possible interpre-tations: first, improvements in microeconomic conditionsshould have positive spillovers; that is, an improvement inone part of the business environment has more impact ifother parts of the business environment are stronger.Thisis consistent with the positive interaction between compa-ny sophistication and the business environment previouslyreported. Second, lower-income countries may reap fewerbenefits for productivity from microeconomic improve-ments because of weaknesses in macroeconomic, political,legal, and social conditions.
We use the model along with data for each countryto calculate a BCI for each country.The overall BCI rank-ings for 2003 for the 80 countries that were also surveyedlast year are shown in Table 1, along with the rankings ofthe previous four years.Also included are separatesubindex rankings.The rankings for all 101 countries areshown in Table 2.
Please refer to the Country Profiles section of the Reportfor detailed descriptions of the competitive advantages and disad-vantages of each country.As noted earlier, competitiveness isnot a zero-sum game. Many countries can improve pro-ductivity and prosperity. BCI tracks both the absolute andrelative progress of countries in building a productiveeconomy.
Finland retakes the leading position, after dropping tosecond place behind the United States last year. Finlandremains one of the world’s most remarkable success casesover the last decade.The United States was pulled downby concerns about rising trade protection, tightening capi-tal availability, and weakening cluster vitality. Otheradvanced nations improving their rankings include France,Denmark, Sweden,Australia, and New Zealand. Francegained five ranks, mainly due to an improving businessenvironment, regaining its pre-2000 ranking. Hearteningfor France are improvements in local competition, gover-nance, and reductions in government distortions. Denmarkand New Zealand gained four ranks, mainly based onimprovements in the business environment.Australia con-tinued its upward trend, while Sweden reached the third
position based on company and business environmentimprovements.
Advanced countries slipping in the rankings includeAustria based on a deteriorating business environment.The United Kingdom also slipped several places afterstrong gains last year, but remains on a long-term positivetrend. Other advanced nations that are slipping areSwitzerland, Canada, and Japan. Japan, while still sliding,registered strong improvements in corporate governanceand cluster collaboration. Germany’s rank falls only oneplace, but the quality of its business environment droppedprecipitously. Labor-management relations are a growingconcern, along with creeping subsidies and a hollowing ofclusters.
Middle-income nations improving their competitive-ness rankings this year include Latvia, Jordan,Vietnam,Mexico, Colombia, Indonesia, Mauritius, Greece, andThailand. One new country, Malta, entered the middle-income group, ranked at 42. Egypt reentered the rankingat 58, showing a significant decline compared to its rank-ing in the 1998–2001 period. Latvia jumped by a remark-able 16 ranks, driven by strong perceived across-the-boardimprovements in the business environment and companysophistication.Whether this large jump is a temporaryevent reflecting positive near-term sentiment or sustain-able will become more evident in subsequent years.
Middle-income countries losing rank in competitive-ness include the Dominican Republic, Hungary, SriLanka,Trinidad and Tobago, Croatia, and China.TheDominican Republic (down 18 places) and Sri Lanka(down 9 places) fall back after strong jumps last year, sig-naling that last year’s rankings might have been anomalies.The Dominican Republic’s ranking was led down by con-cerns about the state of local companies. Hungary (down10) and Croatia (down 8) appear to be suffering fromincreasing competition from other transition countries.Finally,Trinidad and Tobago has experienced decliningcompetitiveness since its entry into the ranking in 2001.China, which showed a strong gain last year, has revertedback to its ranking of previous years.A surge in confi-dence about China’s prospects proves not to have beensustainable. China was pulled down by concerns about redtape, corruption, judicial independence, and trade barriers,among other factors, though Chinese companies werejudged to be making positive progress. Russia continues aslow downward trend, while Argentina’s position seems tohave stabilized.
Among low-income countries, rankings compared tolast year were quite stable. Peru slipped significantly (down5 places) continuing a negative trend. Ecuador moved up3 places. Of the low-income countries ranked for the firsttime, Ghana entered at 63, Kenya at 67, and Tanzania at68. Pakistan entered at 75 and Serbia at 79.Angola becamethe lowest-ranked country at 101.
45
1.2:
Bui
ldin
g th
e M
icro
econ
omic
Fou
ndat
ions
of
Pros
perit
y
46
1.2:
Bui
ldin
g th
e M
icro
econ
omic
Fou
ndat
ions
of
Pros
perit
y
Figu
re 6
: The
rela
tions
hip
betw
een
busi
ness
com
petit
iven
ess
and
GD
P pe
r cap
ita
Ango
la
Haiti
Chad
Boliv
ia
Para
guay
Ethi
opiaHo
ndur
asNic
arag
uaBa
ngla
desh
Moz
ambi
que
Mad
agas
car
Ecua
dor
Alge
ria
Sene
gal
Guat
emal
a
Vene
zuel
a
Zam
bia
Peru N
iger
ia
Serb
iaZi
mba
bwe
Bulg
aria
Rom
ania
Paki
stan
Ukra
ine
Mal
awi
Urug
uay
Arge
ntin
a
Tanz
ania
Keny
a
Russ
ian
Fede
ratio
n
Phili
ppin
es
El S
alva
dor
Croa
tia
Dom
inic
an R
epub
lic
Indo
nesi
a
Pana
ma
Egyp
t
Sri L
ankaJa
mai
ca
Nam
ibia
Bots
wan
a
Trin
idad
an
d To
bago Tu
rkey
Colo
mbi
a Viet
nam
Mor
occo
Mex
ico
Pola
nd Chin
aCost
a Ri
ca
Mau
ritiu
s
Slov
ak R
epub
lic
Mal
ta
Jord
an
Lith
uani
a
Gree
ce
Hung
ary
Indi
a
Portu
gal
Czec
h Re
publ
ic
Braz
il
Tuni
sia
Chile Th
aila
nd
Slov
enia
Latv
ia
Esto
nia
Sout
h Af
rica Mal
aysi
a
Spai
n
Italy
Kore
aNor
way
Irela
nd Isra
el
Hong
Kon
g SA
R
New
Zea
land
Aust
ria
Taiw
an
Belg
ium
Icel
and
Japa
n
Cana
daAu
stra
lia
Fran
ceNet
herla
nds
Sing
apor
e
Switz
erla
nd
Unite
d Ki
ngdo
mGerm
any
Denm
ark
Swed
en
Unite
d St
ates
Finl
and
0
5,00
0
10,0
00
15,0
00
20,0
00
25,0
00
30,0
00
35,0
00
40,0
00
–2.0
–1.5
–1.0
–0.5
00.
51.
01.
52.
02.
5
2002 GDP per capita (adjusted for purchasing power parity)
Bus
ines
s Co
mpe
titiv
enes
s In
dex
y =
2002
.2x2
+ 8
427.
7x +
951
4.9
R2
= 0.
8266
We also calculated the BCI for low-income countriesincorporating only variables with a significant relationshipto GDP per capita for this income group in order to rec-ognize the more limited set of variables that prove signifi-cant early in development.18 The rankings using this alter-native approach turn out to be highly correlated (95 per-cent) to the rankings based on the general model.Honduras, Serbia, Indonesia, and Guatemala rank slightlyhigher based on the alternative model, while Malawi,Tanzania, and Zambia rank slightly lower.
Company competitiveness versus the quality of the businessenvironmentTo gain deeper insight into the competitive position ofcountries, normalized subindexes of company sophistica-tion and the quality of the microeconomic business envi-ronment are plotted against each other in Figure 7.Countries near the line enjoy the positive interaction ofthe two subindexes, as noted previously. Countries lyingabove the 45-degree line are those whose companies aremore advanced than the state of their business environ-ment.Those below the line are countries whose businessenvironment is more advanced than their companies.
Countries whose company development is ahead ofthe business environment include Japan, Germany, France,Sweden, the Philippines,Argentina, and Venezuela.Withthe exception of the Philippines, all these countries havereported a relative weakness in the business environmentrelative to company development for some years.Significant changes in public policy are necessary in thesecountries to improve the platform for productivity. Unlessthe business environment improves, companies will beprone to move operations or make new investments outside thecountry. Japan remains the advanced economy with themost glaring weaknesses in the business environment,despite strong companies.The consequences of weaknessin the business environment for Japan’s economic growthhave been severe, as Japanese corporate investment has fledthe country.19
Countries whose business environment ranks ahead ofcurrent company sophistication include Jordan, Estonia,Australia,Tunisia, Portugal, New Zealand, and Senegal.Many leading companies in these countries still rely onnatural resource extraction (eg,Australia and NewZealand), depend heavily on OEM production, or haveprevalent local subsidiaries of foreign multinationals thatfail to compete with sophisticated enough strategies (eg,Portugal, Senegal, and Tunisia). In some countries, such asAustralia, part of the issue is that rapid improvements inthe business environment have not yet been harnessed bycompanies that remain focused on traditional ways ofcompeting. Efforts to improve entrepreneurship, strategicthinking, managerial practice, and business education arehigh priorities in these countries.
Country overperformance and underperformanceWe can gain insights into the sustainability of a country’sprosperity by looking at its level of microeconomic (busi-ness) competitiveness relative to its current per capitaincome.Table 5 lists countries in order of the divergencebetween actual GDP per capita and the expected GDPgiven microeconomic competitiveness. Countries lyingabove the regression line in Figure 6 are those whose cur-rent GDP per capita exceeds that predicted by their micro-economic competitiveness, as measured by the BCI index.This is a danger sign, because it means that a country’s percapita income may be unsustainable.Among high-incomecountries, Malta, Greece, Portugal, Italy, Ireland, and espe-cially Norway all continue to enjoy a level of prosperitythat exceeds their microeconomic fundamentals. Paraguay,Uruguay,Algeria, and Argentina are among a group ofmiddle-income countries whose levels of income appearunsustainable without substantial microeconomic reform.Angola, Ecuador, and Bolivia are low-income countries inthis precarious position.
Reasons for country overperformance seem to varyand can be either stable over time or transitory.Overperformance can persist for many years if it is basedon natural resource endowments, as in the case of Norway,as long as the natural resources are not exhausted andcommodity price levels are maintained at high enoughlevels. Large foreign aid inflows can also support otherwiseunsustainable prosperity levels, which may explain theoverperformance of a country such as Haiti.Overperformance can be more transitory if it is based ona boom in foreign investment or European StructuralFund inflows, as in Ireland, Greece, and Portugal.Overperformance can also reflect a lag in income behinddeteriorating microeconomic conditions, as in Paraguay,Uruguay,Algeria, and Argentina.We find relatively fewlow-income countries that are overperformers.This isconsistent with the higher incidence of macroeconomic,political, and social challenges among low-income coun-tries that depresses GDP per capita levels below whatcould be expected given their BCI position.
Countries lying below the regression line in Figure 6are those whose microeconomic competitiveness is strongerthan current GDP per capita.We term them underperform-ers. Underperformance bodes well for the future, becausethe platform is in place to support higher GDP per capitaif macro, political, or other constraints can be eased.
Finland, Sweden, Singapore, and the United Kingdomlead the advanced countries with upside potential. Jordan,China,Tunisia,Thailand, and Malaysia are among the mid-dle-income countries that should be able to support ahigher GDP per capita, given microeconomic fundamen-tals. India continues to head the list of low-income coun-tries with upside potential, alongside the African countriesof Tanzania, Malawi, Kenya, Nigeria, and Zambia.
47
1.2:
Bui
ldin
g th
e M
icro
econ
omic
Fou
ndat
ions
of
Pros
perit
y
48
1.2:
Bui
ldin
g th
e M
icro
econ
omic
Fou
ndat
ions
of
Pros
perit
y
Figu
re 7
: The
rela
tive
deve
lopm
ent o
f com
pani
es a
nd th
e m
icro
econ
omic
bus
ines
s en
viro
nmen
t
Vene
zuel
a
Zam
bia
Peru
Nig
eria Se
rbia
Zim
babw
e Bulg
aria
Rom
ania
Paki
stan
Ukra
ine
Mal
awi Ur
ugua
y
Arge
ntin
a
Tanz
ania
Keny
a
Russ
ian
Fede
ratio
n
Phili
ppin
esEl
Sal
vado
r
Croa
tia
Dom
inic
an R
epub
lic
Indo
nesi
aPa
nam
a
Egyp
tSr
i Lan
ka
Jam
aica
Nam
ibia
Bots
wan
a
Trin
idad
and
Toba
go
Turk
eyColo
mbi
a
Viet
nam
Mor
occo
Mex
ico
Pola
ndChin
a
Cost
a Ri
ca Mau
ritiu
s Slov
ak R
epub
licM
alta
Jord
an
Lith
uani
a
Gree
ce
Hung
ary
Indi
a Portu
gal
Czec
h Re
publ
ic
Braz
il
Tuni
sia
Chile
Thai
land
Slov
enia
Latv
ia
Esto
nia
Sout
h Af
ricaM
alay
sia
Spai
nItaly
Kore
aN
orw
ay
Irela
ndIs
rael
Hong
Kon
g SA
R
New
Zea
land
Aust
ria
Taiw
an
Belg
ium
Icel
and
Japa
n
Cana
da
Aust
ralia
Fran
ceN
ethe
rland
s
Sing
apor
e
Switz
erla
nd
Unite
d Ki
ngdo
m
Germ
any
Denm
ark
Swed
enUn
ited
Stat
es Finl
and
Guat
emal
a
Sene
gal
Alge
ria
Ecua
dor
Mad
agas
car
Bang
lade
shM
ozam
biqu
eN
icar
agua
Hond
uras
Ethi
opia
Para
guay
Boliv
iaCh
ad
Haiti
Ango
la
–2.0
–1.5
–1.0
–0.5
0.0
0.5
1.0
1.5
2.0
2.5
–2.0
–1.5
–1.0
–0.50.0
0.5
1.0
1.5
2.0
2.5
Index of the Sophistication of Company Operations and Strategy
Inde
x of
the
Qua
lity
of th
e N
atio
nal B
usin
ess
Envi
ronm
ent
y =
0.96
79x
+ 4E
-16
R2
= 0.
9367
Table 5: GDP per capita relative to business competitiveness
Reasons for country underperformance also reflect avariety of circumstances. Chronic underperformanceresults from persistent structural political, governmental, orsocial challenges. For India and China, for example, meas-ured underperformance on a per capita basis may wellresult from the sheer number of people living at the sub-sistence level outside the mainstream economy. In theseand other countries, the Survey confirms large regionaldifferences in business environment quality, while respons-es tend to come from executives in the more advancedregions.The average prosperity of such countries willremain below measured microeconomic potential untilprogress is spread throughout the country. More transitoryunderperformance can also occur in the aftermath of amacroeconomic crisis that did not lead to a deteriorationof the microeconomic fundamentals, as in Thailand,Malaysia, and Singapore. Underperformance may alsoreflect a lag in prosperity adjusting upward to improvingmicroeconomic conditions.This seems to be the case inFinland and the United Kingdom.
Regional disparitiesThis year, we included a new question on regional differ-ences in a country’s business environment. Not surprising-ly, countries such as Italy, Russia, Brazil, China, and Indiaregister high regional heterogeneity. For countries such asChina and India, this high degree of regional heterogene-ity could help explain the low level of GDP per capitarelative to the reported BCI.The Survey will tend to becompleted by companies in regions better integrated intothe world economy, which may not reflect average condi-tions in the economy.
Our data on regional differences in the business envi-ronment also hold implications for economic policy.Reducing regional disparities is revealed as one of thecritical agendas in the development process. In futureyears, we can examine the change in regional disparity toglean lessons about policy successes and failures.
Natural resources and developmentNatural resources have played a prominent role in think-ing about economic development. Historically, abundantresources were seen as the source of national prosperity.In the last decade, however, the importance of naturalresources has been called into question as the knowledgeand skill intensity of competition has risen and technologyand widening resource availability have led to generallyfalling real resource prices.20
In this year’s Report, we set out to explore the rela-tionship between resource abundance and competitiveness.For 85 countries in the sample we were able to assembledata on the size of minimally processed natural resourcesas well as overall exports.21 The largest absolute naturalresource exporters among those countries are the United
49
1.2:
Bui
ldin
g th
e M
icro
econ
omic
Fou
ndat
ions
of
Pros
perit
y
Microeconomic competitivenesswould support higher per capita income
Competitiveness and income are balanced
Per capita income is high relative to microeconomic competitiveness
High-income Middle-income Low-incomecountries countries countries
UPSIDE POTENTIAL
Finland Malaysia IndiaSweden Thailand VietnamSingapore Tunisia TanzaniaUnited Kingdom Jordan KenyaGermany China Morocco
South Africa MalawiLatvia NigeriaBrazil Sri LankaChile Indonesia
Israel Estonia SerbiaNew Zealand Korea EthiopiaDenmark Philippines MozambiqueSwitzerland El Salvador BangladeshNetherlands Colombia ChadFrance Turkey GuatemalaTaiwan Costa Rica HaitiJapan Namibia NicaraguaUnited States Panama HondurasAustralia Lithuania
Dominican RepublicUkraineMexicoPeruPolandMauritiusBotswanaRomaniaVenezuelaTrinidad and TobagoRussian Federation
CURRENT OVERACHIEVERS
Belgium Hungary BoliviaSpain Bulgaria EcuadorCanada Slovak Republic AngolaHong Kong SAR ParaguaySlovenia AlgeriaIceland CroatiaAustria Czech RepublicPortugal ArgentinaItaly UruguayMaltaGreeceIrelandNorway
States, Canada, Norway, Russia, Nigeria, and Australia.Thecountries with the highest share of natural resourcesexports to total exports are Nigeria, Ethiopia, Paraguay,Ecuador,Venezuela, Kenya, Nicaragua, and Honduras, allwith a share of greater than 50 percent. Natural resourceexports per capita as a proportion of GDP per capita areplotted on Figure 8.
Natural resources result from endowments, not eco-nomic competitiveness. Countries’ world market share ofnatural resource exports proves to be more closely relatedto their geographic size than to their share of world GDP,while non-natural resource exports are closely correlatedto a country’s share of world GDP. Natural resourceexports per capita are not related to underlying competi-tiveness, as measured by BCI, controlling for country size(we use population density, the inverse of land area percapita). In contrast, non-natural resource exports arestrongly correlated with BCI.We find that the naturalresource share of a country’s exports (and GDP) isdecreasing in GDP per capita, again controlling for coun-try size, as we might expect. Countries with lower levelsof productivity are more dependent on natural resourceexports.
Theory suggests another effect of natural resourcesthat would counteract the positive direct effect on pros-perity: abundant natural resources might bias policiestoward rent seeking and redistribution and work againstoverall competitiveness.A crude analysis of changes inBCI supports this view: a dummy variable for countrieswith high natural resource exports (more than 2 percentof GDP) is negatively and significantly correlated withchanges in the BCI rank between 1998 and 2003.22
Changing microeconomic competitiveness and prosperitygrowthWe also examined whether countries that are improvingor worsening their competitiveness ranking register corre-sponding trends in growth of GDP per capita. Changes inBCI rank should affect growth in GDP per capita as percapita income responds to a new sustainable level.Whilemacroeconomic adjustments and other shocks may alsoaffect per capita income growth, the relationship betweenshifts in BCI ranking and prosperity growth provides atentative indication of causality in the relationshipbetween BCI and prosperity.
Regressing GDP per capita growth between 1998and 2002 on BCI rank changes between 1999 and 2003yields a statistically significant relationship that explainsabout 23 percent of the total variation in growth in GDPper capita across countries.Two outliers, Ireland andZimbabwe, reduce the fit. Ireland’s foreign direct invest-ment inflows have been extraordinary and led to probablyunsustainable growth in income; the severe political crisisfor Zimbabwe has been devastating to income despite
economic fundamentals. Dropping the outliers and intro-ducing a dummy variable for low-ranked and high-rankedcountries to control for the boundedness of the rankingfrom above and below, the R2 moves up to 30 percent.The relationship is highly significant.The coefficient ofthe relationship implies that an increase of 10 BCI ranksover the five-year time period is associated with a 1.9 per-cent higher growth rate in GDP per capita.
ConclusionsNational prosperity is strongly affected by competitiveness,which is defined by the productivity with which a nationutilizes its human, capital, and natural resources.Competitiveness is rooted in a nation’s microeconomicfundamentals, as manifested in the sophistication of itscompanies and the quality of its microeconomic businessenvironment. Political stability, sound macroeconomicpolicies, market opening, and privatization have long beenconsidered the cornerstones for economic development.The results here suggest that they are necessary but notsufficient. More than 80 percent of the variation of GDPper capita across countries is accounted for by microeco-nomic fundamentals.We find strong evidence that micro-economic upgrading is a sequential process in whichcountries at different levels of development face distinctlydifferent challenges.
Importance of microeconomic reforms and other analysisresultsWhile focus has been on macro reforms and debt relief,our findings suggest that micro reforms are equally if notmore important.Without micro reforms, growth in GDPinduced by sound macro policies, market opening, andprivatization will be unsustainable or will not translateinto improvements in GDP per capita.Appropriate microreforms, which boost productivity and productivitygrowth, can greatly ease the challenge of meeting govern-ment’s fiscal obligations and reducing macroeconomic dis-tortions. Microeconomic reforms can also reduce thepolitical pressure on governments trying to defend macro-economic stabilization and market opening against vestedinterests. Citizens who see monopolies loosening theirgrip, businesses reforming themselves, and opportunitiesfor employment and entrepreneurship increasing are muchless likely to be seduced by the false promises of redistrib-ution and government intervention.
Our results once again challenge the notion thatmicroeconomic improvement is automatic if propermacroeconomic policies are instituted.Although theremay be a tendency for microeconomic conditions toimprove because GDP per capita rises, such improvementappears to be far from automatic. Moreover, the rate ofimprovement in microeconomic competitiveness can be
50
1.2:
Bui
ldin
g th
e M
icro
econ
omic
Fou
ndat
ions
of
Pros
perit
y
51
1.2:
Bui
ldin
g th
e M
icro
econ
omic
Fou
ndat
ions
of
Pros
perit
y
Figu
re 8
: Nat
ural
reso
urce
exp
orts
sha
re o
f GD
P ve
rsus
GD
P pe
r cap
ita, P
PP a
djus
ted
Sing
apor
Japa
n
Rom
ania
Mex
ico
Braz
il
Paki
stan
Jam
aica
Egyp
t
Boliv
iaEcua
dor
Ethi
opia
Guat
emal
a
Indi
a
Indo
nesi
aKe
nya
Mad
agas
car
Mor
occo
Moz
ambi
que
Nic
arag
ua
Nig
eria
Sene
gal Se
rbia
Sri L
anka
Tanz
ania
Zam
biaZi
mba
bwe
Alge
ria
Arge
ntin
a
Bots
wan
a
Bulg
aria
Chi
le
Chin
a
Colo
mbi
a
Cost
a Ri
ca
Croa
tia
Czec
h Re
publ
ic
El S
alva
dor
Esto
nia
Hung
ary
Jord
an
Kore
a
Latv
iaLi
thua
nia
Mal
aysi
a Mau
ritiu
s
Pana
ma
Para
guay
Hond
uras
Peru
Phili
ppin
esPo
land
Russ
ian
Fede
ratio
n
Slov
ak R
epub
lic
Sout
h Af
rica
Thai
land
Trin
idad
and
Tob
ago
Tuni
sia
Turk
ey
Urug
uay
Vene
zuel
a
Aust
ralia
Aust
ria
Belg
ium
Cana
daDe
nmar
k
Finl
and
Fran
ce
Germ
any
Gree
ce
Hong
Kon
g SA
R
Icel
and
Irela
nd
Isra
elIta
ly
Mal
ta
Net
herla
nds
New
Zea
land
Nor
way
Portu
gal
Slov
enia
Spai
n
Swed
enSw
itzer
land
Unite
d Ki
ngdo
m
Unite
d St
ates
0%2%4%6%8%10%
12%
14%
16%
18%
65%
05,
000
10,0
0015
,000
20,0
0025
,000
30,0
0035
,000
40,0
00
Natural resource exports share of GDP, 2001
GD
P pe
r cap
ita, P
PP a
djus
ted,
200
2
affected markedly by purposeful action in both govern-ment and the private sector.As our results reveal, micro-economic conditions can move ahead of or fall behindcurrent GDP per capita. Shifts in competitiveness have asignificant influence on future economic growth.
Our findings indicate that it is unwise to view microreforms narrowly in terms of reducing the role of govern-ment and abolishing market distortions. Such steps remaina critical challenge that many countries still must master.Yet government has a range of positive roles that are fun-damental to prosperity, such as investing in humanresources, stimulating advanced demand by setting appro-priate regulatory standards, and building innovative capaci-ty. Many nations need to move beyond first-stage reformsand address these agendas.The private sector has animportant role in improving a nation’s competitive plat-form through collective activities and cluster developmentinitiatives. Second-stage micro reforms require a new per-spective on the role of the private sector.
While clusters have an important role in competitive-ness as the results validate, our analysis also makes it clearthat microeconomic reform is much more than clusterdevelopment.The proliferating efforts to develop andenhance clusters around the world are highly encouraging.Yet countries also need to pursue improvements through-out the business environment, or cluster initiatives will beultimately stymied.
Finally, our results highlight the need to align anation’s economic priorities with its level of development.We describe the differing challenges for low-, medium-,and high-income countries, and the difficult transitionsbetween broad development stages. Countries that havebeen very successful in one mode of competing need torecognize the multifaceted adjustments necessary for man-aging the transition to the next mode.
If there is to be continued momentum for economicreform in nations around the world, there is a pressingneed to move to the next level of thinking and practiceabout economic development.Approaches centered largelyon responding to international financial markets and ced-ing choices to impersonal global forces are producing abacklash that erodes the consensus for global economicprogress and encourages populist national policies that arefundamentally self-defeating. Economic reform must movebeyond now-standard approaches and embrace the tex-tured agenda that the results here suggest.
Countries are converging on macroeconomic stabi-lization, trade opening, and privatization.The central chal-lenge to much of the world economy is now microeco-nomic reform. Progress in improving the sophistication ofcompanies and the quality of the business environment isthe only way to produce real improvements in efficiency,product quality, and new business opportunities that sup-port a rising standard of living for citizens.
Competitiveness and the role of international developmentassistanceThe results presented here not only have implications forpolicymakers in individual countries but also offer usefulguidance to international organizations active in economicdevelopment, especially in low- and middle-income countries.
A substantial number of multilateral and national aidorganizations have come to play a prominent role in eco-nomic development.The World Bank, the InternationalMonetary Fund (IMF), the United Nations, regionaldevelopment banks, and single-country organizations suchas the U.S.Agency for International Development(USAID) have provided, on average, over US$60 billion ofdevelopment assistance annually over the last decade, ormore than US$600 billion.Aid organizations have sup-ported a wide array of agendas.
The effectiveness of this aid has, on the whole, beendisappointing.23 Our data combined with data on officialdevelopment assistance (ODA) over the last decade con-firm this view (see Figure 9).The level of ODA per capitaprovided over the last decade shows no systematic rela-tionship to either GDP per capita or BCI. Controlling forinitial GDP per capita, we find that ODA inflows over thelast decade (measured either in absolute terms or relativeto GDP per capita) are not positively correlated tochanges in BCI or to growth in GDP per capita for thecountries receiving ODA. Based on these data, then, ODAinvestments have not paid off. Deducting ODA inflowsfrom GDP per capita in our model modestly increases theexplanatory power of BCI for GDP per capita; this is con-sistent with ODA being a windfall gain in prosperity withno further effect on underlying competitiveness.
The disappointing results of development assistanceare directly related to the way it has been deployed.Funding tends to be fragmented, spread over a myriad ofprograms that are costly for both aid organizations andrecipient countries to administer. Impact is blunted by lackof concentrated and consistent spending on priority areas.The projects funded are often driven as much by donororganization priorities as by the particular needs of therecipient country. Fads and politics intrude into the givingprocess.
The agendas of the numerous aid organizations arelargely uncoordinated in recipient countries except in rarecircumstances. Recipient countries face the complex chal-lenge of negotiating with the various organizations andadapting to donor priorities.
Recipient governments, on their side, have oftenfailed to deliver on their commitments, spent aid moneyunwisely, and allowed corruption to drain resources awayfrom meeting pressing needs.This had led to the creationof special institutional arrangements to reduce the risk ofdisappointments, including direct funding of projects
52
1.2:
Bui
ldin
g th
e M
icro
econ
omic
Fou
ndat
ions
of
Pros
perit
y
53
1.2:
Bui
ldin
g th
e M
icro
econ
omic
Fou
ndat
ions
of
Pros
perit
y
Figu
re 9
: Offi
cial
dev
elop
men
t ass
ista
nce
rela
tive
to G
DP
vers
us G
DP
per c
apita
Vene
zuel
aM
exic
oBr
azil
Mal
aysi
aAr
gent
ina
Trin
idad
and
Tob
ago
Chile
Turk
eyCh
ina
Colo
mbi
a
Uru
guay
Slov
enia
Croa
tiaSout
h Af
rica
Cost
a Ri
ca
Indi
aCz
ech
Repu
blic
Dom
inic
an R
epub
lic
Hun
gary
Russ
ian
Fede
ratio
n
Nig
eria
Pana
ma
Alg
eria
Slov
ak R
epub
licTh
aila
ndM
alta
Mau
ritiu
sPe
ru
Rom
ania
Lith
uani
aPo
land
Jam
aica
Latv
iaIs
rael
Indo
nesi
a
Guat
emal
a
Ecua
dor
Ukra
ine
Tuni
sia
Esto
nia
Phili
ppin
esPa
ragu
ayBu
lgar
iaBo
tsw
ana
Paki
stan
Mor
roco
El S
alva
dor
Egyp
tVi
etna
mBa
ngla
desh
Serb
iaSr
i Lan
ka
Ang
ola
Zim
babw
e
Nam
ibia
Keny
aJo
rdan
Hon
dura
s
Bol
ivia
Hai
tiM
adag
asca
r
Tanz
ania
Sene
gal
Chad
Ethi
opia
Zam
bia
22%
Nic
arag
ua 2
6%
Mal
awi 2
6%M
ozam
biqu
e 29
%
0%2%4%6%8%10%
12%
14%
16%
02,
000
4,00
06,
000
8,00
010
,000
12,0
0014
,000
16,0
0018
,000
20,0
00
ODA over 1991–2001 relative to 2001 GDP
GD
P pe
r cap
ita, P
PP a
djus
ted,
200
2
outside of the government budget and strict negotiatingstructures.The net result is even more complexity for allthe parties.
The disappointing results of past efforts suggest theneed to rethink and restructure international developmentassistance.The aims, the institutional structure, and theprocess all must be redesigned.
In the context of this Report, we focus on the aims ofdevelopment aid.The goal of poverty reduction has takenprominence among development agencies in recent years,reflecting the view that aid must benefit the poor ratherthan enrich the elites in developing countries.The WorldBank, for example, is requiring Poverty ReductionStrategies to qualify for the Bank’s concessional assistance.While this approach is laudable in many respects, it alsocarries a risk. Efforts to alleviate poverty that are unsus-tainable can gravitate to social spending and subsidies todisadvantaged groups.
A better goal is to improve income, jobs, and wealth thatis widely shared.This places the focus where it must be:on building a viable and competitive economy.Aid agen-cies must step up their attention to competitiveness rela-tive to other agendas. Improvements in macroeconomicstability, political stability, and social conditions that aresustainable all depend, in the medium and long term, onhaving a competitive economy. Otherwise, any progress in these areas is temporary, as we have learned over andover again.
New institutional structures will be necessary toadvance competitiveness.These must include not onlynational governments but also need to incorporate theroles of business, educational organizations, regional gov-ernments, and other institutions. National competitivenesscommittees including these players should have formalresponsibilities for planning and monitoring competitive-ness programs.Aid must be based on objective nationalcompetitiveness assessments, not donor priorities.
The findings in this Report can help guide and informsuch efforts. In the coming years, our aim is to work moreand more closely with country leaders to improve theobjectivity of the data collected in this Report, disseminateit more broadly, and create forums and other mechanismsto inform and catalyze local action.
Notes1 I would like to thank Christian Ketels and Weifeng Weng for their major
role in the analyses reported here. Lyn Pohl provided able supervi-sion of the final production of the chapter.
2 The proportion has grown modestly over the last several years as themodel has been improved.
3 See the Clusters of Innovation report (Porter, Council onCompetitiveness, and Monitor Group, 2001); further reports on fiveU.S. regions are available at www.compete.org.
4 The stages were first introduced in Porter (1990).
5 The notion of institutions for collaboration has been developed further injoint work with Willis Emmons, Georgetown University. See Porterand Emmons (2003).
6 One surveyed economy, Luxembourg, was not included in the calcula-tions because of its small size, functional concentration on a fewsectors, and almost complete integration into the neighboringeconomies. It is better understood as a region within theseeconomies.
7 These reasons could include larger actual heterogeneity within the coun-try, as well as greater uncertainty by respondents about appropriateinternational benchmarks.
8 For Morocco, we utilized all Survey responses, and the country rankingwas quite stable from last year, despite the within-country varianceof responses. For Romania, we utilized the average Survey respons-es from foreign companies as the country average because theyhave a high degree of within-country consensus.
9 For Egypt, Senegal, Serbia, and Zambia, we utilized the average Surveyresponses from foreign subsidiaries as the country average.
10 These countries are Cameroon, Gambia, Ghana, Macedonia, Mali, andUganda.
11 The GDP per capita (PPP adjusted) data for Norway were revised bythe World Bank, leading to a 17 percent jump in the country’s GDPper capita relative to the data available last year. Norway becomesan even more striking outlier due to this revision.
12 GDP per worker is employed as a productivity measure in some stud-ies. We used the broader measure here because GDP per workercan be increased by high unemployment or low workforce participa-tion, which do not increase wealth. Also, holders of capital, not onlyworkers, contribute to national productivity. In comparing the UnitedStates and France, for example, the United States has absorbed ahuge influx of new workers (higher workforce participation) over thelast decade, while France has maintained high GDP per workerthrough suffering high unemployment and maintaining a large stu-dent population not counted as part of the potential workforce.
13 In the case of Ireland, we used GNP instead of GDP because of thesize of dividend outflows to foreign investors. Ireland’s GDP is about20 percent higher than its GNP.
14 Statistical significance at ** = 5 percent and * = 10 percent (all two-tailed tests) is noted in the table.
15 We conducted additional bivariate regressions (not reported here) usingmacroeconomic indicators collected for the Global CompetitivenessReport. These regressions show no statistical relationship betweenGDP per capita and individual macroeconomic indicators. See alsoEasterly (2001), who finds similar results.
16 This analysis covers the Survey questions that have been commonover five years, which comprise the great majority of questions.
17 The forecast region has wider bands than a 95 percent mean confi-dence region. The mean confidence region provides a confidenceinterval for a given level of competitiveness over repeated observa-tions. The forecast region method, in contrast, reflects a higherdegree of inherent uncertainty in predicting a single observation. Asa result, interpretation of the proximity of data points to the regres-sion line should be undertaken with appropriate caveats. Note thatthe forecast region widens slightly as it moves away from the “cen-ter” of the graph. The center is the point located at the intersectionof the mean GDP per capita level and mean factor score.
54
1.2:
Bui
ldin
g th
e M
icro
econ
omic
Fou
ndat
ions
of
Pros
perit
y
18 For medium- and high-income countries, most of the individual vari-ables included in the BCI are significant.
19 For a more detailed examination of Japan’s competitive situation, seePorter and Hirotaka with Sakakibara (2000).
20 See Sala-I-Martin and Subramanian (2003).
21 Data were drawn from “Trade Analysis System on Personal Computer,1997–2001,” SITC Rev.3. A list of SITC industries included can beobtained from the author.
22 The time-series data available for this analysis unfortunately includefew low-income countries with high natural resource export share.The analysis will be expanded as more country data become avail-able over time.
23 See, for example, Boone (1995), Tsikata (1998), and Lancaster (1999).
Selected ReferencesBaumol, W. J. 2002. The Free-Market Innovation Machine: Analyzing the
Growth Miracle of Capitalism. Princeton, NJ: Princeton UniversityPress.
Barro, R. J. 1991. “Economic Growth in a Cross Section of Countries,”Quarterly Journal of Economics 106 (2): 407–443.
Boone, P. 1995. “Politics and the Effectiveness of Foreign Aid,” NBERWorking Paper No. 5308. Cambridge, MA: National Bureau ofEconomic Research.
Department of Trade and Industry. 2001. UK Competitiveness Indicators,2nd Edition. London: Department of Trade and Industry.
Easterly, W. 2001.The Elusive Quest for Growth: Economists’ Adventuresand Misadventures in the Tropics. Cambridge, MA: MIT Press.
Easterly, W. and R. Levine. 2002. “Tropics, Germs, and Crops: HowEndowments Influence Economic Development,” NBER WorkingPaper No. 9106. Cambridge, MA: National Bureau of EconomicResearch.
European Commission. 2002. European Competitiveness Report 2002.Brussels: European Commission.
Enright, M. J., A. Francés, and E. S. Saavadra. 1994. Venezuela: El Reto dela Competitividad. Caracas, Venezuela: Ediciones IESA.
Fairbanks, M. and S. Lindsay. 1997. Plowing the Sea: The Challenge ofCompetitiveness in the Developing World. Boston: Harvard BusinessSchool Press.
Hall, R. E. and C. I. Jones. 1999. “Why Do Some Countries Produce SoMuch More Output per Worker than Others?” Quarterly Journal ofEconomics 114 (1): 83 –116.
Hirschman, A. O. 1958. The Strategy of Economic Development NewHaven, CT: Yale University Press.
Lancaster, C. 1999. “Aid Effectiveness in Africa: The Unfinished Agenda,”Journal of African Economics 8(4): 487–503.
Lucas, R. E., Jr. 1988. “On the Mechanics of Economic Development,”Journal of Monetary Economics 22 (July 1988): 3–42.
Mankiw, N. G. 1995. “The Growth of Nations,” Brookings Papers onEconomic Activity 1 (1): 275–310.
Mankiw, N. G., D. Romer, and D. N. Weil. 1992. “A Contribution to theEmpirics of Economic Growth,” Quarterly Journal of Economics107(2): 407–437.
Nickell, S. 1996. “Competition and Corporate Performance,” Journal ofPolitical Economy 104 (1996): 724-746.
Nordhaus, W. D. 1994. “Climate and Economic Development.” InProceedings of the World Bank Annual Conference on DevelopmentEconomics 1993. Washington, DC: The International Bank forReconstruction and Development/The World Bank.
North, D. C. 1990. Institutions, Institutional Change and EconomicPerformance: Political Economy of Institutions and Decisions.Cambridge: Cambridge University Press.
Porter, M. E. 2003. “The Economic Performance of Regions,” RegionalStudies 37(6&7): 549–678.
———. 2000a. “Attitudes, Values, Beliefs, and the Microeconomic ofProsperity.” In L. E. Harrison and S. P. Huntington, eds., CultureMatters. New York: Basic Books, 2000: 14–28.
———. 2000b. “Locations, Clusters, and Company Strategy.” In G. L.Clark, M. P. Feldman, and M. S. Gertler, eds., The Oxford Handbookof Economic Geography. New York: Oxford University Press, 2000:253–274.
———. 1998a. “Introduction.” In The Competitive Advantage of Nations:With a New Introduction. New York: The Free Press.
———. 1998b. “Clusters and Competition: New Agendas for Companies,Governments, and Institutions.” In On Competition. Boston: HarvardBusiness School Press.
———. 1996. “What Is Strategy?” Harvard Business Review 74 (6):61–78.
———. 1995. “Comment on ‘Interaction Between Regional and IndustrialPolicies: Evidence From Four Countries,’ by J. Markusen.” InProceedings of The World Bank Annual Conference on DevelopmentEconomics 1994. Washington, DC: The International Bank forReconstruction and Development/The World Bank.
———. 1990. The Competitive Advantage of Nations. New York: The FreePress.
Porter, M. E., Council on Competitiveness, and Monitor Group. 2001.Clusters of Innovation Initiative: Regional Foundations of U.S.Competitiveness. Washington, DC: Council on Competitiveness.
Porter, M.E., and W. Emmons. 2003. “Institutions for Collaboration:Overview”. Harvard Business School case 9-703-436.
Porter, M. E. and T. Hirotaka with M. Sakakibara. 2000. Can JapanCompete? Basingstoke, England, and New York: Macmillan andBasic Books.
Porter, M. E. and C. Ketels. 2003. “UK Competitiveness: Moving to theNext Stage,” DTI Economics Paper No.3. London: Department ofIndustry and Trade & Economic and Social Research Council (ESRC).
Porter, M. E. and C. van der Linde. 1995. “Toward a New Conception ofthe Environment-Competitiveness Relationship,” Journal ofEconomic Perspectives 9(4): 97–118.
Romer, P. M. 1990. “Endogenous Technological Change,” Journal ofPolitical Economy 98(5): S71–S102.
Sachs, J. D. and A. Warner. 1995. “Economic Reform and the Process ofGlobal Integration,” Brookings Papers on Economic Activity 1(1):1–118.
Sakakibara, M. and M. E. Porter. 1998. “Competing at Home to WinAbroad: Evidence from Japanese Industry,” Harvard BusinessSchool Working Paper No. 99-036. Cambridge, MA: HarvardBusiness School Press.
Sala-i-Martin, X. and A. Subramanian. 2003. “Addressing the NaturalResource Curse: An illustration from Nigeria,” IMF Working Paper03/139, Washington, DC: International Monetary Fund.
Solow, R. M. 1956. “A Contribution to the Theory of Economic Growth,”Quarterly Journal of Economics 70(1): 65–94.
Tsikata, T.M. 1998. “Aid Effectiveness: A Survey of the Recent EmpiricalLiterature,” IMF, PPA/98/1. Washington, DC: International MonetaryFund.