26
Q 2012 Fourth quarter report 2012

Q 2012
Fourth quarter report 2012

About our reporting - discontinued operationsOn October 15 Hydro announced an agreement with Orkla ASA to combine their respective extrusion profile, building systems and tubing businesses within a new joint venture company owned 50 percent by each party. This will include all of Hydro's Extruded Products activities. Completion of the transaction is expected to take place in the first half of 2013. See note 4to the condensed consolidated financial statements later in this report for more information on the agreement. Following the agreement, operating results for Hydro's Extruded Products are presented net of financial items and tax as Income (loss) from discontinued operations and excluded from reported EBIT and underlying EBIT. All prior periods in this report are reclassified accordingly. In addition, depreciation of property, plant and equipment for Extruded Products is excluded from operating results in periods subsequent to the date of the agreement. Assets and liabilities related to Extruded Products are presented as assets held for sale in Hydro's consolidated balance sheet as of December 31, 2012. Assets and liabilities in prior periods have not been reclassified.
Contents Financial review 3
Overview 3
Market developments and outlook 5
Additional factors impacting Hydro 6
Underlying EBIT 7
Finance 10
Tax 11
Items excluded from underlying EBIT and net income 11
Pro forma information Extruded Products 13
Interim financial statements 14
Condensed consolidated statements of income (unaudited) 14
Condensed consolidated statements of comprehensive income (unaudited) 15
Condensed consolidated balance sheets (unaudited) 16
Condensed consolidated statements of cash flows (unaudited) 17
Condensed consolidated statements of changes in equity (unaudited) 18
Notes to the condensed consolidated financial statements 18
Additional information 23
Return on average Capital Employed (RoaCE) 23
Financial calendar 2013 24
page FOURTH QUARTERAbout our reporting - discontinued operations2
Overview
pageFOURTH QUARTEROverview 3
Summary underlying financial and operating results and liquidity
Key financial information
NOK million, except per share data
Fourthquarter
2012
Thirdquarter
2012
%change
priorquarter
Fourthquarter
2011
%change
prior yearquarter
Year2012
Year2011
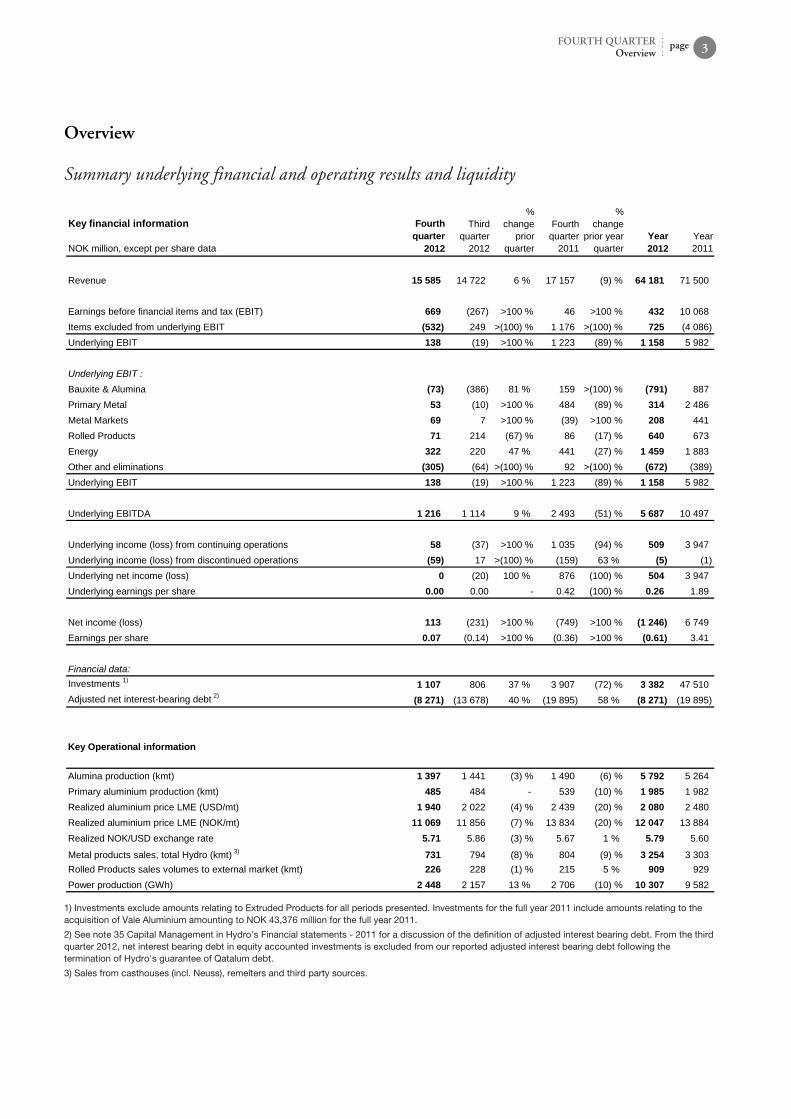
Revenue 15 585 14 722 6 % 17 157 (9) % 64 181 71 500
Earnings before financial items and tax (EBIT) 669 (267) >100 % 46 >100 % 432 10 068Items excluded from underlying EBIT (532) 249 >(100) % 1 176 >(100) % 725 (4 086)Underlying EBIT 138 (19) >100 % 1 223 (89) % 1 158 5 982
Underlying EBIT :Bauxite & Alumina (73) (386) 81 % 159 >(100) % (791) 887Primary Metal 53 (10) >100 % 484 (89) % 314 2 486Metal Markets 69 7 >100 % (39) >100 % 208 441Rolled Products 71 214 (67) % 86 (17) % 640 673Energy 322 220 47 % 441 (27) % 1 459 1 883Other and eliminations (305) (64) >(100) % 92 >(100) % (672) (389)Underlying EBIT 138 (19) >100 % 1 223 (89) % 1 158 5 982
Underlying EBITDA 1 216 1 114 9 % 2 493 (51) % 5 687 10 497
Underlying income (loss) from continuing operations 58 (37) >100 % 1 035 (94) % 509 3 947Underlying income (loss) from discontinued operations (59) 17 >(100) % (159) 63 % (5) (1)Underlying net income (loss) 0 (20) 100 % 876 (100) % 504 3 947Underlying earnings per share 0.00 0.00 0.42 (100) % 0.26 1.89
Net income (loss) 113 (231) >100 % (749) >100 % (1 246) 6 749Earnings per share 0.07 (0.14) >100 % (0.36) >100 % (0.61) 3.41
Financial data:Investments 1) 1 107 806 37 % 3 907 (72) % 3 382 47 510Adjusted net interestbearing debt 2) (8 271) (13 678) 40 % (19 895) 58 % (8 271) (19 895)
Key Operational information
Alumina production (kmt) 1 397 1 441 (3) % 1 490 (6) % 5 792 5 264Primary aluminium production (kmt) 485 484 539 (10) % 1 985 1 982Realized aluminium price LME (USD/mt) 1 940 2 022 (4) % 2 439 (20) % 2 080 2 480Realized aluminium price LME (NOK/mt) 11 069 11 856 (7) % 13 834 (20) % 12 047 13 884Realized NOK/USD exchange rate 5.71 5.86 (3) % 5.67 1 % 5.79 5.60
Metal products sales, total Hydro (kmt) 3) 731 794 (8) % 804 (9) % 3 254 3 303Rolled Products sales volumes to external market (kmt) 226 228 (1) % 215 5 % 909 929Power production (GWh) 2 448 2 157 13 % 2 706 (10) % 10 307 9 582
1) Investments exclude amounts relating to Extruded Products for all periods presented. Investments for the full year 2011 include amounts relating to the acquisition of Vale Aluminium amounting to NOK 43,376 million for the full year 2011.
2) See note 35 Capital Management in Hydro's Financial statements - 2011 for a discussion of the definition of adjusted interest bearing debt. From the third quarter 2012, net interest bearing debt in equity accounted investments is excluded from our reported adjusted interest bearing debt following the termination of Hydro's guarantee of Qatalum debt.
3) Sales from casthouses (incl. Neuss), remelters and third party sources.
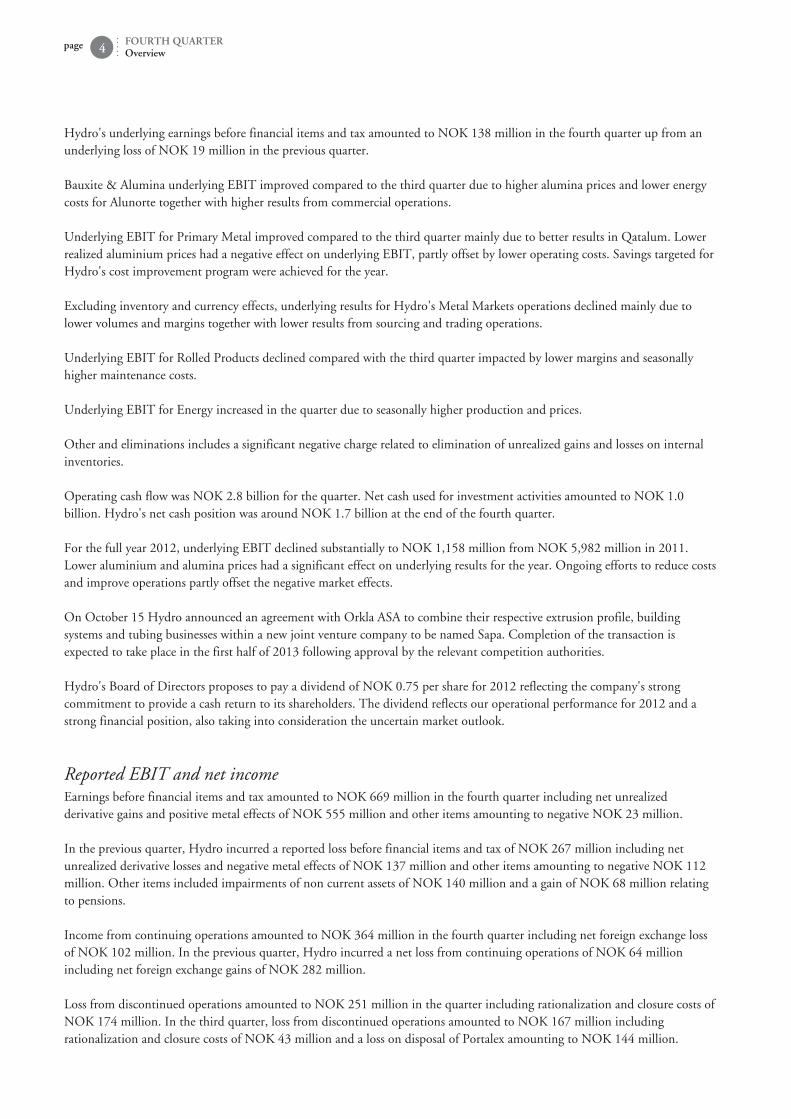
Hydro's underlying earnings before financial items and tax amounted to NOK 138 million in the fourth quarter up from an underlying loss of NOK 19 million in the previous quarter. Bauxite & Alumina underlying EBIT improved compared to the third quarter due to higher alumina prices and lower energy costs for Alunorte together with higher results from commercial operations. Underlying EBIT for Primary Metal improved compared to the third quarter mainly due to better results in Qatalum. Lower realized aluminium prices had a negative effect on underlying EBIT, partly offset by lower operating costs. Savings targeted for Hydro's cost improvement program were achieved for the year. Excluding inventory and currency effects, underlying results for Hydro's Metal Markets operations declined mainly due to lower volumes and margins together with lower results from sourcing and trading operations. Underlying EBIT for Rolled Products declined compared with the third quarter impacted by lower margins and seasonally higher maintenance costs. Underlying EBIT for Energy increased in the quarter due to seasonally higher production and prices. Other and eliminations includes a significant negative charge related to elimination of unrealized gains and losses on internal inventories. Operating cash flow was NOK 2.8 billion for the quarter. Net cash used for investment activities amounted to NOK 1.0 billion. Hydro's net cash position was around NOK 1.7 billion at the end of the fourth quarter. For the full year 2012, underlying EBIT declined substantially to NOK 1,158 million from NOK 5,982 million in 2011. Lower aluminium and alumina prices had a significant effect on underlying results for the year. Ongoing efforts to reduce costs and improve operations partly offset the negative market effects. On October 15 Hydro announced an agreement with Orkla ASA to combine their respective extrusion profile, building systems and tubing businesses within a new joint venture company to be named Sapa. Completion of the transaction is expected to take place in the first half of 2013 following approval by the relevant competition authorities. Hydro's Board of Directors proposes to pay a dividend of NOK 0.75 per share for 2012 reflecting the company's strong commitment to provide a cash return to its shareholders. The dividend reflects our operational performance for 2012 and a strong financial position, also taking into consideration the uncertain market outlook.
page FOURTH QUARTEROverview4
Reported EBIT and net incomeEarnings before financial items and tax amounted to NOK 669 million in the fourth quarter including net unrealized derivative gains and positive metal effects of NOK 555 million and other items amounting to negative NOK 23 million. In the previous quarter, Hydro incurred a reported loss before financial items and tax of NOK 267 million including net unrealized derivative losses and negative metal effects of NOK 137 million and other items amounting to negative NOK 112 million. Other items included impairments of non current assets of NOK 140 million and a gain of NOK 68 million relating to pensions. Income from continuing operations amounted to NOK 364 million in the fourth quarter including net foreign exchange loss of NOK 102 million. In the previous quarter, Hydro incurred a net loss from continuing operations of NOK 64 million including net foreign exchange gains of NOK 282 million. Loss from discontinued operations amounted to NOK 251 million in the quarter including rationalization and closure costs of NOK 174 million. In the third quarter, loss from discontinued operations amounted to NOK 167 million including rationalization and closure costs of NOK 43 million and a loss on disposal of Portalex amounting to NOK 144 million.

Market developments and outlook
Market statistics 1)
Fourthquarter
2012
Thirdquarter
2012
% changeprior
quarter
Fourthquarter
2011
% changeprior year
quarterYear2012
Year2011
NOK/USD Average exchange rate 5.68 5.91 (4) % 5.76 (1) % 5.82 5.61NOK/USD Balance sheet date exchange rate 5.57 5.70 (2) % 5.99 (7) % 5.57 5.99NOK/EUR Average exchange rate 7.37 7.39 7.76 (5) % 7.47 7.79NOK/EUR Balance sheet date exchange rate 7.34 7.37 7.75 (5) % 7.34 7.75Bauxite & Alumina:Alumina price Platts PAX FOB Australia (USD/t) 327 315 4 % 331 (1) % 319 375Global production of alumina (kmt) 23 811 23 527 1 % 23 080 3 % 93 528 90 374Global production of alumina (ex. China) (kmt) 13 685 13 829 (1) % 13 824 54 761 53 940Primary Metal and Metal Markets:LME three month average (USD/mt) 2 017 1 945 4 % 2 110 (4) % 2 050 2 420LME three month average (NOK/mt) 11 458 11 482 12 134 (6) % 11 908 13 539Global production of primary aluminium (kmt) 12 053 11 823 2 % 11 728 3 % 47 067 45 580Global consumption of primary aluminum (kmt) 11 823 11 789 11 048 7 % 46 613 44 883Global production of primary aluminium (ex. China) (kmt) 6 445 6 399 1 % 6 700 (4) % 25 694 26 370Global consumption of primary aluminum (ex. China) (kmt) 6 339 6 500 6 159 3 % 25 718 25 488Reported primary aluminium inventories (kmt) 8 173 7 893 4 % 7 445 10 % 8 173 7 445Rolled Products:Consumption Rolled Products Europe (kmt) 927 1 050 (12) % 921 1 % 4 101 4 292Consumption Rolled Products USA & Canada (kmt) 961 1 066 (10) % 947 1 % 4 174 4 139Energy:Southern Norway spot price (NO2) (NOK/MWh) 268 131 >100 % 259 3 % 218 360Nordic system spot price (NOK/MWh) 275 154 79 % 265 4 % 234 367
1) Industry statistics have been derived from analyst reports, trade associations and other public sources unless otherwise indicated. Amounts presented in prior reports may have been restated based on updated information. Currency rates have been derived from Norges Bank.
pageFOURTH QUARTERMarket developments and outlook 5
Bauxite and aluminaThe global alumina market was balanced at the end of 2012 supported by supply disruptions, mainly in India. The market is expected to remain balanced in 2013. Chinese alumina imports for 2012 amounted to 5 million mt, up from 1.9 million mt in 2011, driven by favorable price differentials and limited bauxite availability. Indonesian bauxite exports to China increased in the quarter following removal of the temporary export restrictions imposed in May 2012. China imported about 40 million mt of bauxite in 2012, of which roughly 70 percent came from Indonesia. Platts Alumina spot prices increased somewhat during the fourth quarter, from USD 325 per mt to USD 333 per mt.1) Prices ranged between 15.2 and 17.1 percent of LME due to the volatile LME. 1) Due to existing sales contracts, Hydro has limited volumes available for sale for the next few years. As a result, short-term alumina market developments have limited influence on Hydro's earnings for this period.
Primary aluminiumLME prices declined in the beginning of the fourth quarter to a level of around USD 1,900 per mt. Prices increased in December reaching around USD 2,100 per mt at the end of the year. Average prices increased compared to the third quarter. Global demand for primary aluminium (excluding China) was seasonally lower compared to the third quarter. Annualized consumption amounted to 25.1 million mt. Corresponding supply increased somewhat due to the ramp-up of disrupted capacity that was restarted in the previous quarter. Annualized production amounted to 25.6 million mt in the fourth quarter. Global demand (excluding China) is expected to grow by 2-4 percent in 2013. In China, aluminium consumption and production increased in the fourth quarter compared to the third quarter amounting to 21.8 million mt and 22.2 million mt respectively on an annualized basis.

LME stocks increased slightly to 5.2 million mt at the end of the fourth quarter compared with 5.1 million mt in the previous quarter. A large portion of the metal in warehouses continues to be owned by several large financial investors. In the fourth quarter, demand for extrusion ingot and foundry alloys in Europe softened further due to weaker underlying demand, year end stock reductions at customer warehouses and seasonal declines. European demand for sheet ingot was stable in the fourth quarter compared to the same quarter 2011. Demand for wire rod remained strong.
page FOURTH QUARTERMarket developments and outlook6
Rolled productsEuropean demand for rolled products declined in the fourth quarter of 2012 compared to the previous quarter mainly due to seasonality. Compared to the same quarter in the previous year, demand was stable. Demand in the automotive segment declined compared to the third quarter due to further reductions in production of cars with high aluminium content as well as extended maintenance shutdowns. Consumption in the building and construction segment was seasonally lower but also impacted by a further weakening in Southern European markets. Demand for foil was stable. Market demand in the general engineering and beverage can segments was seasonally lower. Demand for flat rolled products in Europe is expected to be seasonally higher in the first quarter of 2013 but to remain weak.
EnergyNordic spot prices were stable during most of the quarter but increased in December due to very cold temperatures. Reservoir inflows stabilized resulting in a normalized hydrological balance towards the end of the quarter. Reservoir levels have been impacted by continued cold and dry weather since the end of the quarter. However, decreasing coal and CO2 prices combined with weak German power prices are expected to limit the potential for further price increases. The Nordic hydrological balance was 13 TWh lower than at the end of the third quarter. Water reservoir levels in Norway were about 70 percent of full capacity at the end of the quarter, which is slightly below normal.
Additional factors impacting HydroHydro has sold forward around 60 percent of its expected primary aluminium production for the first quarter of 2013 at a price level of around USD 2,050 per mt.1) This excludes volumes from Qatalum. 1) From February 2013 we have changed our pricing formula for metal sales. Prices are now fixed mainly one month prior to production. As a result, and due to the hedging of product inventories, Hydro's realized aluminium prices lag LME spot prices by around 1.5 to 2 months.

Underlying EBIT
pageFOURTH QUARTERUnderlying EBIT 7
Bauxite & Alumina
Operational and financial information
Fourthquarter
2012
Thirdquarter
2012
% changeprior
quarter
Fourthquarter
2011
% changeprior year
quarterYear2012
Year2011
Underlying EBIT (NOK million) (73) (386) 81 % 159 >(100) % (791) 887Underlying EBITDA (NOK million) 336 42 >100 % 609 (45) % 959 2 480
Alumina production (kmt) 1 397 1 441 (3) % 1 490 (6) % 5 792 5 264Sourced alumina (kmt) 335 399 (16) % 418 (20) % 1 390 1 958Total alumina sales (kmt) 1 880 1 683 12 % 1 956 (4) % 7 227 7 278Realized alumina price (USD/mt) 1) 285 270 6 % 306 (7) % 286 333Apparent alumina cash cost (USD/mt) 2) 239 261 (8) % 261 (8) % 259 266Bauxite production (kmt) 3) 2 378 2 439 (3) % 2 317 3 % 9 221 7 104Sourced bauxite (kmt) 4) 2 543 2 166 17 % 2 073 23 % 8 692 7 435
1) Weighted average of own production and third party contracts, excluding hedge results. The majority of the alumina is sold linked to LME prices with a one month delay.
2) Calculated based on cost of produced alumina and cost of alumina sourced on contracts. Paragominas bauxite included at cost and MRN bauxite included at contract price.
3) Paragominas on wet basis.
4) 40 percent MRN off take from Vale and 5 percent Hydro share on wet basis.
Underlying EBIT for Bauxite & Alumina improved compared to the third quarter primarily due to higher LME linked alumina prices and lower energy costs for Alunorte together with higher results from commercial operations. Bauxite production at Paragominas was stable and close to the record volumes achieved in the third quarter. Production costs for Alunorte improved mainly due to lower energy costs. The reduction in energy costs was driven by the State of Para's decision to reinstate the ICMS tax exemption on fuel oil as of October 1. Underlying results for our commercial operations improved significantly as margins increased compared to the previous quarter. Underlying EBIT decreased compared with the fourth quarter of 2011, primarily due to lower LME linked alumina prices and somewhat lower volumes. Underlying EBIT for the year 2012 decreased significantly compared to 2011, primarily due to lower LME linked alumina prices and the impact of ICMS on fuel oil in the period from March until October 2012.
Primary Metal
Operational and financial information 1)
Fourthquarter
2012
Thirdquarter
2012
%change
priorquarter
Fourthquarter
2011
%change
prior yearquarter
Year2012
Year2011
Underlying EBIT (NOK million) 53 (10) >100 % 484 (89) % 314 2 486Underlying EBITDA (NOK million) 522 476 10 % 1 097 (52) % 2 311 4 671
Realized aluminium price LME (USD/mt) 2) 1 940 2 022 (4) % 2 439 (20) % 2 080 2 480Realized aluminium price LME (NOK/mt) 2) 11 069 11 856 (7) % 13 834 (20) % 12 047 13 884Realized premium above LME (USD/mt) 3) 318 296 7 % 309 3 % 298 333Realized premium above LME (NOK/mt) 3) 1 814 1 733 5 % 1 754 3 % 1 726 1 866Realized NOK/USD exchange rate 5.71 5.86 (3) % 5.67 1 % 5.79 5.60
Primary aluminium production (kmt) 485 484 539 (10) % 1 985 1 982Casthouse production (kmt) 512 548 (7) % 613 (16) % 2 248 2 463Casthouse sales (kmt) 495 548 (10) % 584 (15) % 2 266 2 451
1) Operating and financial information includes Hydro's proportionate share of underlying profit (loss), production and sales volumes in equity accounted investments. Realized prices, premiums and exchange rates exclude equity accounted investments.

2) Including effect of strategic LME hedges (hedge accounting applied). Realized aluminium prices lag the LME price developments by approximately 1.5 - 2 months.
3) Average realized premium above LME for casthouse sales from Primary Metal.
Operational and financial information Qatalum (50%)
Fourthquarter
2012
Thirdquarter
2012Year2012
Revenue (NOK million) 1 034 1 075 4 292Underlying EBIT (NOK million) 4 (79) (22)Underlying EBITDA (NOK million) 250 179 998Underlying Net income (loss) (NOK million) (39) (129) (217)Primary aluminium production (kmt) 76 76 302Casthouse sales (kmt) 81 82 320
Underlying EBIT for Primary Metal improved compared to the third quarter mainly due to better results in Qatalum. Lower realized aluminium prices had a negative effect on underlying EBIT, partly offset by lower operating costs. Realized aluminium prices declined during the quarter. Sales volumes were seasonally lower and also influenced by reduced casthouse production following the curtailment of casthouses in Kurri Kurri in Australia and in Årdal in Norway. Raw material costs declined due to lower alumina, power and carbon costs. Fixed costs were stable. Initiatives relating to our USD 300 per mt cost improvement program continued during the quarter. Targeted savings of USD 235 per mt were achieved by the end of 2012. Hydro's share of underlying results for Qatalum improved during the quarter due to higher realized aluminium prices and lower energy costs following the resumption of normal operations of the power plant at the site in November. Underlying EBIT for Primary Metal declined substantially compared to the fourth quarter of 2011 impacted by significantly lower realized aluminium prices and reduced sales volumes. Lower carbon costs had a positive impact on underlying results for the quarter. Underlying EBIT for 2012 also declined significantly compared with last year, impacted mainly by the same factors discussed above.
page FOURTH QUARTERUnderlying EBIT8
Metal Markets
Operational and financial information
Fourthquarter
2012
Thirdquarter
2012
% changeprior
quarter
Fourthquarter
2011
% changeprior year
quarterYear2012
Year2011
Underlying EBIT (NOK million) 69 7 >100 % (39) >100 % 208 441Currency effects 1) 4 (47) >100 % (119) >100 % (145) (34)
Ingot inventory valuation effects 2) 25 (49) >100 % (24) 71Underlying EBIT excl. currency and ingot inventory effects 40 104 (61) % 80 (49) % 377 404Underlying EBITDA (NOK million) 91 32 >100 % (13) >100 % 306 542
Remelt production (kmt) 119 136 (13) % 131 (9) % 548 565Metal products sales excluding ingot trading (kmt) 3) 661 717 (8) % 717 (8) % 2 941 2 902 Hereof external sales (kmt) 567 610 (7) % 617 (8) % 2 469 2 301
1) Includes the effects of changes in currency rates on sales and purchase contracts denominated in foreign currencies (mainly US dollar and Euro for our European operations) and the effects of changes in currency rates on the fair valuation of dollar denominated derivative contracts (including LME futures) and inventories mainly translated into Norwegian kroner. Hydro manages its external currency exposure on a consolidated basis in order to take advantage of offsetting positions.
2) Comprised of hedging gains and losses relating to standard ingot inventories in our metal sourcing and trading operations. Increasing LME prices result in unrealized hedging losses, while the offsetting gains on physical inventories are not recognized until realized. In periods of declining prices, unrealized hedging gains are offset by write-downs of physical inventories.
3) Includes external and internal sales from primary casthouse operations, remelters and third party metal sources. Volumes from Albras casthouse (51 percent) as of March 1, 2011.
Underlying EBIT for Metal Markets increased compared to the previous quarter impacted by positive ingot inventory valuation and currency effects. Excluding currency and ingot inventory valuation effects, underlying EBIT declined mainly due to lower volumes and margins together with lower results from sourcing and trading activities. Underlying EBIT improved from a loss in the fourth quarter of the previous year which included significant negative currency effects. For 2012, underlying EBIT declined, impacted by significant negative currency and ingot inventory effects compared to the previous year. Excluding inventory and currency effects, underlying EBIT decreased somewhat mainly due to lower sales volumes.
pageFOURTH QUARTERUnderlying EBIT 9
Rolled Products
Operational and financial information 1)
Fourthquarter
2012
Thirdquarter
2012
% changeprior
quarter
Fourthquarter
2011
% changeprior year
quarterYear2012
Year2011
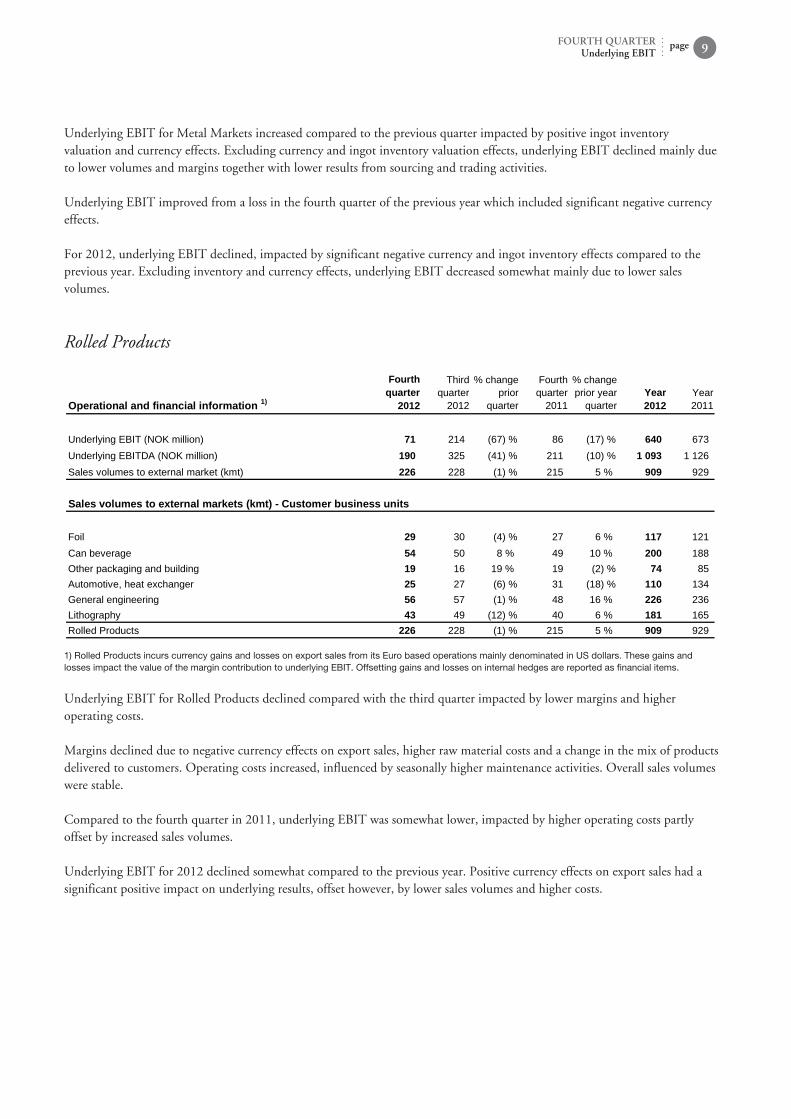
Underlying EBIT (NOK million) 71 214 (67) % 86 (17) % 640 673Underlying EBITDA (NOK million) 190 325 (41) % 211 (10) % 1 093 1 126Sales volumes to external market (kmt) 226 228 (1) % 215 5 % 909 929
Sales volumes to external markets (kmt) Customer business units
Foil 29 30 (4) % 27 6 % 117 121Can beverage 54 50 8 % 49 10 % 200 188Other packaging and building 19 16 19 % 19 (2) % 74 85Automotive, heat exchanger 25 27 (6) % 31 (18) % 110 134General engineering 56 57 (1) % 48 16 % 226 236Lithography 43 49 (12) % 40 6 % 181 165Rolled Products 226 228 (1) % 215 5 % 909 929
1) Rolled Products incurs currency gains and losses on export sales from its Euro based operations mainly denominated in US dollars. These gains and losses impact the value of the margin contribution to underlying EBIT. Offsetting gains and losses on internal hedges are reported as financial items.
Underlying EBIT for Rolled Products declined compared with the third quarter impacted by lower margins and higher operating costs. Margins declined due to negative currency effects on export sales, higher raw material costs and a change in the mix of products delivered to customers. Operating costs increased, influenced by seasonally higher maintenance activities. Overall sales volumes were stable. Compared to the fourth quarter in 2011, underlying EBIT was somewhat lower, impacted by higher operating costs partly offset by increased sales volumes. Underlying EBIT for 2012 declined somewhat compared to the previous year. Positive currency effects on export sales had a significant positive impact on underlying results, offset however, by lower sales volumes and higher costs.

Energy
Operational and financial information
Fourthquarter
2012
Thirdquarter
2012
% changeprior
quarter
Fourthquarter
2011
% changeprior year
quarterYear2012
Year2011
Underlying EBIT (NOK million) 322 220 47 % 441 (27) % 1 459 1 883Underlying EBITDA (NOK million) 363 250 45 % 484 (25) % 1 588 2 018Direct production costs (NOK million) 1) 130 104 25 % 119 9 % 493 468Power production (GWh) 2 448 2 157 13 % 2 706 (10) % 10 307 9 582External power sourcing (GWh) 2 159 2 214 (2) % 2 258 (4) % 8 608 8 675Internal contract sales (GWh) 3 164 3 163 3 202 (1) % 12 500 12 446External contract sales (GWh) 343 219 57 % 332 3 % 1 164 1 187Net spot sales (GWh) 1 099 989 11 % 1 430 (23) % 5 251 4 624
1) Includes maintenance and operational costs, transmission costs, property taxes and concession fees for Hydro as operator.
Underlying EBIT for Energy increased in the fourth quarter compared to the previous quarter due to seasonally higher production and prices, partly offset by higher maintenance costs. Underlying EBIT for Energy declined compared to the corresponding quarter of 2011 due to lower production partly offset by higher realized prices. Underlying EBIT for 2012 decreased compared to 2011 due to significantly lower prices partly offset by higher production.
page FOURTH QUARTERUnderlying EBIT10
Other and eliminations
Other and eliminationsNOK million
Fourthquarter
2012
Thirdquarter
2012
%change
priorquarter
Fourthquarter
2011
%change
prior yearquarter
Year2012
Year2011
Underlying EBIT (305) (64) >(100) % 92 >(100) % (672) (389)of which eliminations (151) 90 >(100) % 250 >(100) % (50) 190
Eliminations comprises mainly unrealized gains and losses on inventories purchased from group companies which fluctuates with product flows, volumes and margin developments throughout Hydro's value chain.
Finance Financial income (expense) Fourth Third % change Fourth % change
quarter quarter prior quarter prior year Year YearNOK million 2012 2012 quarter 2011 quarter 2012 2011
Interest income 86 60 43 % 106 (19)% 286 256Dividends received and net gain (loss) on securities 51 47 10 % 17 >100% 133 (53)Financial income 138 107 28 % 123 12 % 418 203
Interest expense (111) (102) (8)% (80) (38)% (393) (348)Capitalized interest 14 >100% (4) >100% 15 1Net foreign exchange gain (loss) (102) 282 >(100)% (27) >(100)% (280) (963)Other (20) (36) 44 % (25) 19 % (108) (141)Financial expense (219) 144 >(100)% (136) (61)% (766) (1 451)
Financial income (expense), net (82) 251 >(100)% (13) >(100)% (348) (1 248)
The net currency loss for the fourth quarter related primarily to intercompany financial balances.

TaxIncome tax expense amounted to NOK 224 million for the fourth quarter of 2012 or about 38 percent of income before tax.
pageFOURTH QUARTERTax 11
Items excluded from underlying EBIT and net incomeTo provide a better understanding of Hydro's underlying performance, the items in the table below have been excluded from EBIT and net income. Items excluded from underlying EBIT are comprised mainly of unrealized gains and losses on certain derivatives, impairment and rationalization charges, effects of disposals of businesses and operating assets, as well as other items that are of a special nature or are not expected to be incurred on an ongoing basis. Items excluded from underlying net income 1)
NOK million
Fourthquarter
2012
Thirdquarter
2012
Fourthquarter
2011Year2012
Year2011
Unrealized derivative effects on LME related contracts 2) (346) 266 338 (109) 402Derivative effects on LME related contracts (Vale Aluminium) 3) 5 (74)Unrealized derivative effects on power and raw material contracts 4) (168) (182) 37 (937) (153)Metal effect, Rolled Products 5) (41) 53 134 64 7Significant rationalization charges and closure costs 6) 151 32 37 617 97Impairment charges (PP&E and equity accounted investments) 7) (109) 140 1 091 1 215 1 147(Gains)/losses on divestments 8) (19) 6 (465) (57) (1 184)Transaction related effects (Vale Aluminium) 9) (4 328)Other effects 10) (68) (68) Items excluded from underlying EBIT (532) 249 1 176 725 (4 086)Net foreign exchange (gain)/loss 11) 102 (282) 27 280 963Calculated income tax effect 12) 124 63 (22) 222 (179)Items excluded from continuing operations (306) 30 1 181 1 227 (3 301)Items excluded from discontinued operations 193 184 444 523 500Items excluded from underlying net income (113) 214 1 625 1 750 (2 801)
1) Negative figures indicate a gain and positive figures indicate a loss.
2) Unrealized gains and losses on contracts used for operational hedging purposes where hedge accounting is not applied, as well as for LME derivatives in equity accounted investments and elimination of changes in fair value of certain internal physical aluminium contracts.
3) Realized and unrealized derivative effects on LME contracts related to the hedge of the net aluminium price exposure in Vale Aluminium not subject to hedge accounting. Realized effects recognized as of March 1, 2011 are included in underlying EBIT.
4) Unrealized gains and losses on embedded derivatives in raw material and power contracts for own use and financial power contracts used for hedging purposes, as well as financial power contracts in equity accounted investments and elimination of changes in fair value of embedded derivatives within certain internal power contracts.
5) Timing differences resulting from inventory adjustments due to changing aluminium prices during the production, sales and logistics process, as well as inventory write-downs for Rolled Products.
6) Costs that are typically non-recurring for significant individual plants or operations, for example termination benefits, plant removal costs and clean-up activities in excess of legal liabilities, etc.
7) Impairment charges reflect write-downs of assets or groups of assets to estimated recoverable amounts in the event of an identified loss in value.
8) Net gain or loss on divested businesses and individual major assets.
9) Effects related to the acquisition of Vale Aluminium on February 28, 2011 include the revaluation gain of Hydro's pre-transaction stake in Alunorte and CAP, gains and losses related to settlement of pre-existing contracts and agreements, as well as the fair value adjustment of inventory of finished goods sold.
10) Other effects include recognition of pension plan amendments and related curtailments and settlements, etc.
11) Realized and unrealized gains and losses on foreign currency denominated accounts receivable and payables, funding and deposits, and forward currency contracts purchasing and selling currencies that hedge net future cash flows from operations, sales contracts and working capital.
12) In order to present underlying net income on a basis comparable with our underlying operating performance, we have calculated an income tax effect of items excluded from underlying income before tax. In addition, we have adjusted for the write-down of deferred tax assets in fourth quarter of 2011.

Items excluded from underlying EBIT - Operating segmentsThe following includes a summary table of items excluded from underlying EBIT for each of the operating segments and for Other and eliminations. Items excluded from underlying EBIT 1)
NOK million
Fourthquarter
2012
Thirdquarter
2012
Fourthquarter
2011Year2012
Year2011
Unrealized derivative effects on currency contracts (Alunorte) (1)Derivative effects on LME related contracts (Vale Aluminium) 3 (72)Unrealized derivative effects on LME related contracts (11) 1 (8) Transaction related effects (Vale Aluminium) (4 421)(Gains)/losses on divestments (465) (465)Bauxite & Alumina (11) 1 (461) (8) (4 959)Derivative effects on LME related contracts (Vale Aluminium) 1 (1)Unrealized derivative effects on LME related contracts (Søral) 3 (3)Unrealized derivative effects on LME related contracts (151) 220 165 98 (143)Unrealized derivative effects on power contracts (Søral) 2 (1) 7 15 43Unrealized derivative effects on power contracts 61 (221) 56 (240) 139Unrealized derivative effects on raw material contracts 10 13 6 40 43Impairment charges (110) 970 1 045 970Impairment charges (Qatalum) 30 Rationalization charges and closure costs 134 32 37 600 80Transaction related effects (Vale Aluminium) 93Primary Metal (54) 44 1 244 1 588 1 221Unrealized derivative effects on LME related contracts (126) 177 148 11 (16)Impairment charges 77 76 (Gains)/losses on divestments (15) (15) Metal Markets (141) 254 148 73 (16)Unrealized derivative effects on LME related contracts (27) (179) 1 (232) 584Metal effect (41) 53 134 64 7Rationalization charges and closure costs 17 17 17Rolled Products (51) (126) 135 (151) 608Unrealized derivative effects on power contracts (1) 2 (7) 11 (8)(Gains)/losses on divestments (658)Energy (1) 2 (7) 11 (667)Unrealized derivative effects on power contracts (239) 24 (25) (764) (370)Unrealized derivative effects on LME related contracts (32) 48 22 22 (20)Impairment charges 1 63 121 64 177Pension (68) (68) (Gains)/losses on divestments (4) 6 (42) (60)Other and eliminations 2) (274) 74 118 (788) (273)Items excluded from underlying EBIT (532) 249 1 176 725 (4 086)
1) Negative figures indicate a gain and positive figures indicate a loss.
2) Unrealized derivative effects on power contracts and LME related contracts result from elimination of changes in the valuation of embedded derivatives within certain internal power contracts and elimination of changes in the valuation of certain internal aluminium contracts.
page FOURTH QUARTERItems excluded from underlying EBIT and net income12

Pro forma information Extruded Products
Operational and financial information
Fourthquarter
2012
Thirdquarter
2012
% changeprior
quarter
Fourthquarter
2011
% changeprior year
quarterYear2012
Year2011
Earnings before financial items and tax (EBIT) (261) (147) (78) % (408) 36 % (493) (240)Items excluded from underlying EBIT 187 174 7 % 318 (41) % 513 391Underlying EBIT (NOK million) (75) 27 >(100) % (90) 17 % 20 151Underlying EBITDA (NOK million) 30 151 (80) % 31 (3) % 471 655Sales volumes to external market (kmt) 112 125 (10) % 121 (7) % 508 536
European demand for extruded aluminium products remained weak compared to the previous quarter and was also impacted by further seasonal declines. Compared to the same quarter of 2011, European consumption declined by 7 percent. Weak demand in Europe is expected to continue in the first quarter of 2013. Extruded Products incurred an underlying loss in the fourth quarter mainly driven by the weak markets and seasonally lower sales volumes. Increased margins and operating cost reductions partly offset the negative market effects. Compared to the fourth quarter of 2011, underlying EBIT improved despite lower sales volumes. The positive development was mainly due to lower costs as a result of the significant improvement efforts undertaken throughout the year. Efforts to reduce costs and improve operating results will continue. Underlying EBIT for 2012 declined compared to 2011, heavily impacted by the weakening European markets.
Reconciliation of Income from discontinued operations to Underlying EBIT for Extruded Products Reconciliation of income from discontinued operations tounderlying EBITNOK million
Fourthquarter
2012
Thirdquarter
2012
% changeprior
quarter
Fourthquarter
2011
% changeprior year
quarterYear2012
Year2011
Income (loss) from discontinued operations (251) (167) (50) % (603) 58 % (528) (502)Items excluded for discontinued operations, net of tax 193 184 5 % 444 (57) % 523 500Underlying Income (loss) from discontinued operations (59) 17 >(100) % (159) 63 % (5) (1)Adjustment for depreciation, financial items and tax (16) 10 >(100) % 69 >(100) % 25 151Proforma Underlying EBIT Extruded Products (75) 27 >(100) % (90) 17 % 20 151
pageFOURTH QUARTERPro forma information Extruded Products 13
Interim financial statements
page FOURTH QUARTERInterim financial statements14
Condensed consolidated statements of income (unaudited)
Fourth quarter YearNOK million, except per share data 2012 2011 2012 2011
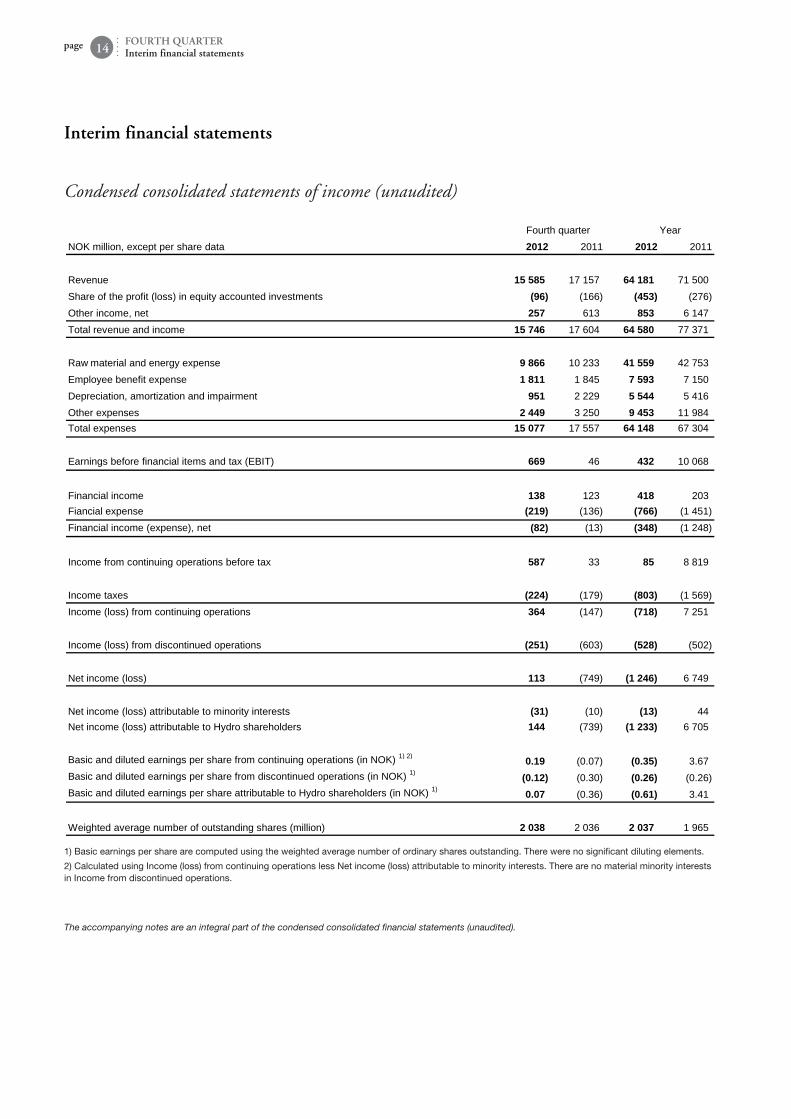
Revenue 15 585 17 157 64 181 71 500Share of the profit (loss) in equity accounted investments (96) (166) (453) (276)Other income, net 257 613 853 6 147Total revenue and income 15 746 17 604 64 580 77 371
Raw material and energy expense 9 866 10 233 41 559 42 753Employee benefit expense 1 811 1 845 7 593 7 150Depreciation, amortization and impairment 951 2 229 5 544 5 416Other expenses 2 449 3 250 9 453 11 984Total expenses 15 077 17 557 64 148 67 304
Earnings before financial items and tax (EBIT) 669 46 432 10 068
Financial income 138 123 418 203Fiancial expense (219) (136) (766) (1 451)Financial income (expense), net (82) (13) (348) (1 248)
Income from continuing operations before tax 587 33 85 8 819
Income taxes (224) (179) (803) (1 569)Income (loss) from continuing operations 364 (147) (718) 7 251
Income (loss) from discontinued operations (251) (603) (528) (502)
Net income (loss) 113 (749) (1 246) 6 749
Net income (loss) attributable to minority interests (31) (10) (13) 44Net income (loss) attributable to Hydro shareholders 144 (739) (1 233) 6 705
Basic and diluted earnings per share from continuing operations (in NOK) 1) 2) 0.19 (0.07) (0.35) 3.67Basic and diluted earnings per share from discontinued operations (in NOK) 1) (0.12) (0.30) (0.26) (0.26)Basic and diluted earnings per share attributable to Hydro shareholders (in NOK) 1) 0.07 (0.36) (0.61) 3.41
Weighted average number of outstanding shares (million) 2 038 2 036 2 037 1 965
1) Basic earnings per share are computed using the weighted average number of ordinary shares outstanding. There were no significant diluting elements.
2) Calculated using Income (loss) from continuing operations less Net income (loss) attributable to minority interests. There are no material minority interests in Income from discontinued operations.
The accompanying notes are an integral part of the condensed consolidated financial statements (unaudited).
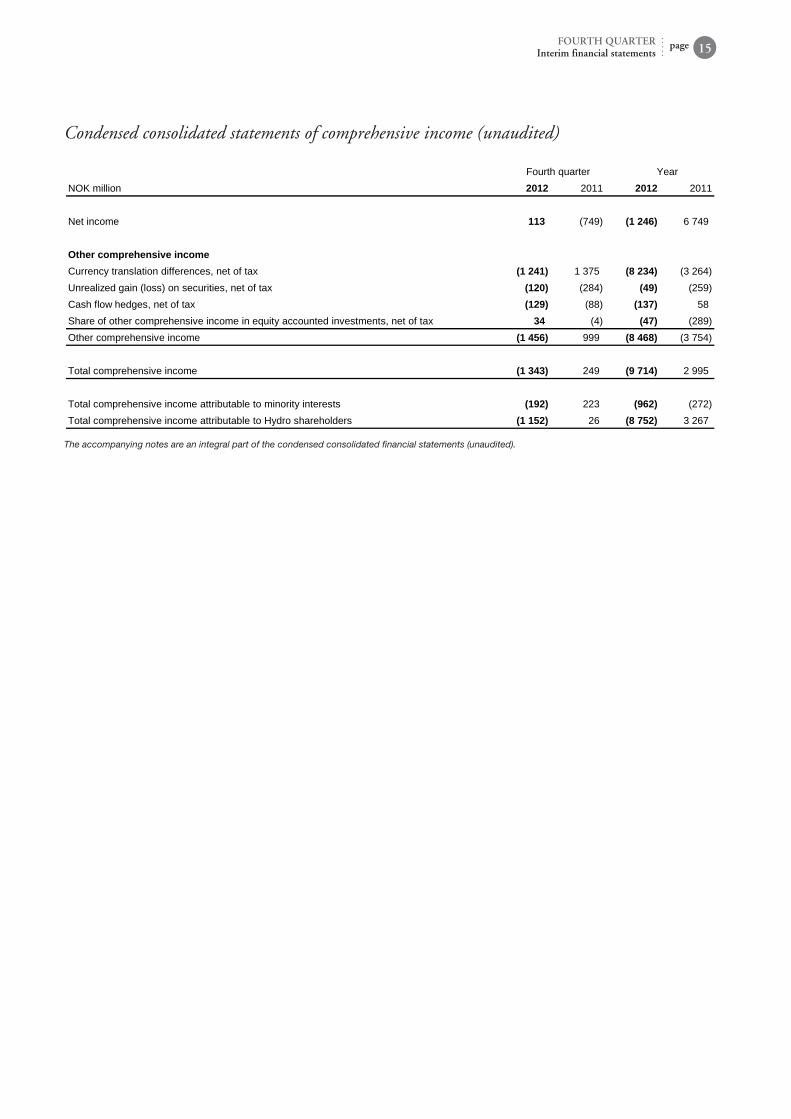
Condensed consolidated statements of comprehensive income (unaudited)
Fourth quarter YearNOK million 2012 2011 2012 2011
Net income 113 (749) (1 246) 6 749
Other comprehensive incomeCurrency translation differences, net of tax (1 241) 1 375 (8 234) (3 264)Unrealized gain (loss) on securities, net of tax (120) (284) (49) (259)Cash flow hedges, net of tax (129) (88) (137) 58Share of other comprehensive income in equity accounted investments, net of tax 34 (4) (47) (289)Other comprehensive income (1 456) 999 (8 468) (3 754)
Total comprehensive income (1 343) 249 (9 714) 2 995
Total comprehensive income attributable to minority interests (192) 223 (962) (272)Total comprehensive income attributable to Hydro shareholders (1 152) 26 (8 752) 3 267
The accompanying notes are an integral part of the condensed consolidated financial statements (unaudited).
pageFOURTH QUARTERInterim financial statements 15

Condensed consolidated balance sheets (unaudited)
December 31NOK million, except number of shares 2012 2011
AssetsCash and cash equivalents 7 034 8 365Shortterm investments 4 343 1 780Accounts receivables 8 761 13 217Inventories 9 685 14 157Other current assets 336 666Total current assets 30 159 38 185
Assets held for sale 9 435
Property, plant and equipment 52 208 64 192Intangible assets 5 716 7 930Investments accounted for using the equity method 10 295 11 442Prepaid pension 1 660 1 596Other noncurrent assets 7 080 9 208Total noncurrent assets 76 959 94 368
Total assets 116 552 132 554
Liabilities and equityBank loans and other interestbearing shortterm debt 5 956 4 248Trade and other payables 8 336 12 316Other current liabilities 3 230 4 653Total current liabilities 17 522 21 216
Liabilities included in disposal groups 3 394
Longterm debt 3 674 4 190Provisions 3 091 3 331Pension obligation 8 511 9 099Deferred tax liabilities 3 427 5 325Other noncurrent liabilities 3 089 4 225Total noncurrent liabilities 21 792 26 170
Total liabilities 42 709 47 386
Equity attributable to Hydro shareholders 68 009 78 180Minority interest 5 835 6 988Total equity 73 843 85 168
Total liabilities and equity 116 552 132 554
Total number of outstanding shares (million) 2 038 2 036
The accompanying notes are an integral part of the condensed consolidated financial statements (unaudited).
page FOURTH QUARTERInterim financial statements16

Condensed consolidated statements of cash flows (unaudited)
YearNOK million 2012 2011
Operating activities
Net income (loss) (1 246) 6 749Loss from discontinued operations 528 502Depreciation, amortization and impairment 5 544 5 416Other adjustments 608 (5 235)Net cash provided by continuing operating activities 5 434 7 432
Investing activitiesPurchases of property, plant and equipment (3 256) (3 386)Purchases of other longterm investments (158) (6 302)Purchases of shortterm investments (3 050) Proceeds from sales of property, plant and equipment 73 92Proceeds from sales of other longterm investments 99 1 302Net cash used in continuing investing activities (6 292) (8 294)
Financing activitiesLoan proceeds 9 552 3 668Principal repayments (6 815) (2 873)Net increase (decrease) in other shortterm debt (492) 130Proceeds from shares issued 72 88Dividends paid (1 741) (1 781)Net cash provided by (used in) continuing financing activities 576 (768)
Foreign currency effects on cash and bank overdraft (344) (134)
Net cash used in discontinued operations (318) (627)
Net decrease in cash, cash equivalents and bank overdraft (944) (2 391)
Cash, cash equivalents and bank overdraft classified as assets held for sale (367) Cash, cash equivalents and bank overdraft at beginning of period 8 344 10 735Cash, cash equivalents and bank overdraft at end of period 7 033 8 344
The accompanying notes are an integral part of the condensed consolidated financial statements (unaudited).
pageFOURTH QUARTERInterim financial statements 17

Condensed consolidated statements of changes in equity (unaudited)
EquityAdditional Other attributable
Share paidin Treasury Retained components to Hydro Minority TotalNOK million capital capital shares earnings of equity shareholders interests equity
January 1, 2011 1 780 9 553 (1 112) 46 616 (418) 56 418 1 025 57 443
Changes in equity for 2011Shares issued 492 19 493 19 985 19 985Treasury shares reissued to employees 11 28 39 39Dividends (1 527) (1 527) (314) (1 841)Minority interest recognized at acquisition of subsidiaries 6 470 6 470Capital contribution in subsidiaries 78 78Transactions with minority holders (1) (1) 1 Total comprehensive income for the period 6 705 (3 438) 3 267 (272) 2 995December 31, 2011 2 272 29 056 (1 084) 51 792 (3 856) 78 180 6 988 85 168
Changes in equity for 2012Treasury shares reissued to employees 37 37 37Dividends (1 528) (1 528) (240) (1 768)Capital contribution in subsidiaries 128 128Transactions with minority holders 71 71 (71) Equity interests sold (8) (8)Total comprehensive income for the period (1 233) (7 519) (8 752) (962) (9 714)December 31, 2012 2 272 29 056 (1 047) 49 102 (11 374) 68 009 5 835 73 843
Hydro's ownership interest in Alunorte has increased to 92 percent through a share issue in the fourth quarter. The accompanying notes are an integral part of the condensed consolidated financial statements (unaudited).
page FOURTH QUARTERInterim financial statements18
Notes to the condensed consolidated financial statements
Note 1: Accounting policiesAll reported figures in the financial statements are based on International Financial Reporting Standards (IFRS). Hydro's accounting principles are presented in note 1 Significant accounting policies and reporting entity and note 2 Changes in accounting principles and new pronouncements in Hydro's Financial Statements - 2011. The interim accounts are presented in accordance with IAS 34 Interim Financial Reporting. The condensed consolidated interim financial information should be read in conjunction with Hydro's Financial Statements - 2011 that are a part of Hydro's Annual Report - 2011. As a result of rounding adjustments, the figures in one or more columns may not add up to the total of that column.
Note 2: Operating segment informationHydro identifies its reportable segments and discloses segment information under IFRS 8 Operating Segments. This standard requires Hydro to identify its segments according to the organization and reporting structure used by management. See Hydro's Financial statements - 2011 note 7 Operating and geographic segment information for a description of Hydro's management model and segments, including a description of Hydro's segment measures and accounting principles used for segment reporting. The following tables include information about Hydro's operating segments, including a reconciliation of EBITDA to EBIT for Hydro's operating segments.

Fourth quarter Year
NOK million 2012 2011 2012 2011
Total revenueBauxite & Alumina 3 465 3 790 13 265 14 471
Primary Metal 5 485 7 711 26 690 34 720
Metal Markets 8 666 10 568 39 931 48 725
Rolled Products 4 885 4 906 20 080 21 297
Energy 1 240 1 461 4 691 6 393
Other and eliminations (8 157) (11 279) (40 476) (54 106)
Total 15 585 17 157 64 181 71 500
External revenueBauxite & Alumina 2 367 2 357 8 459 8 595
Primary Metal 1 043 1 210 4 479 4 462
Metal Markets 6 675 7 977 28 960 33 363
Rolled Products 4 846 4 895 20 000 21 392
Energy 586 666 2 095 3 424
Other and eliminations 68 52 187 264
Total 15 585 17 157 64 181 71 500
Internal revenueBauxite & Alumina 1 098 1 433 4 806 5 876
Primary Metal 4 442 6 501 22 210 30 258
Metal Markets 1 992 2 591 10 971 15 362
Rolled Products 39 11 80 (95)
Energy 654 795 2 595 2 969
Other and eliminations (8 225) (11 331) (40 663) (54 369)
Total
Share of the profit (loss) in equity accounted investmentsBauxite & Alumina 1 6Primary Metal (74) (17) (324) 13
Metal Markets 1 1
Rolled Products (21) (19) (67) (76)
Energy (2) 15
Other and eliminations (2) (132) (61) (235)
Total (96) (166) (453) (276)
pageFOURTH QUARTERNotes to the condensed consolidated financial statements 19

Fourth quarter Year
NOK million 2012 2011 2012 2011
Depreciation, amortization and impairmentBauxite & Alumina 409 450 1 750 1 580
Primary Metal 356 1 577 3 026 3 136
Metal Markets 22 26 174 101
Rolled Products 106 111 401 399
Energy 41 43 129 132
Other and eliminations 17 21 63 69
Total 951 2 229 5 544 5 416
Earnings before financial items and tax (EBIT) 1)
Bauxite & Alumina (62) 620 (783) 5 846
Primary Metal 107 (760) (1 275) 1 265
Metal Markets 210 (187) 135 457
Rolled Products 122 (49) 791 66
Energy 323 448 1 448 2 550
Other and eliminations (31) (25) 116 (116)
Total 669 46 432 10 068
EBITDABauxite & Alumina 347 1 070 967 7 438
Primary Metal 467 822 1 768 4 421
Metal Markets 232 (161) 309 557
Rolled Products 241 76 1 245 519
Energy 364 491 1 577 2 685
Other and eliminations (14) 109 218 109
Total 1 637 2 407 6 083 15 730
Investments 2)
Bauxite & Alumina 3) 476 4 365 1 430 36 865Primary Metal 3) 326 1 764 1 023 9 505
Metal Markets 19 51 37 103
Rolled Products 167 240 405 435
Energy 97 196 430 564Other and eliminations 3) 22 (2 708) 56 39
Total 1 107 3 907 3 382 47 510
1) Total segment EBIT is the same as Hydro group's total EBIT. Financial income and expense are not allocated to the segments. There are no reconciling items between segment EBIT to Hydro EBIT. Therefore, a separate reconciliation table is not presented.
2) Additions to property, plant and equipment (capital expenditures) plus long-term securities, intangible assets, long-term advances and investments in equity accounted investments. Excludes investments in discontinued operations.
3) Investments for Bauxite & Alumina, Primary Metal, Other and eliminations and Total include the acquisition of Vale Aluminium in the first quarter of 2011. The allocation of the purchase price was finalized and goodwill allocated in the fourth quarter of 2011. In total for 2011, investments related to the acquisition of Vale Aluminium amounted to NOK 35,321 million for Bauxite & Alumina and NOK 8,055 million for Primary Metal.
page FOURTH QUARTERNotes to the condensed consolidated financial statements20

NOK million EBIT
Depr.,amor. and
impairment 1) EBITDA
EBIT EBITDA Fourth quarter 2012Bauxite & Alumina (62) 409 347
Primary Metal 107 360 467
Metal Markets 210 22 232
Rolled Products 122 119 241
Energy 323 41 364
Other and eliminations (31) 17 (14)
Total 669 968 1 637
EBIT EBITDA YearBauxite & Alumina (783) 1 750 967
Primary Metal (1 275) 3 042 1 768
Metal Markets 135 174 309
Rolled Products 791 453 1 245
Energy 1 448 129 1 577
Other and eliminations 116 102 218
Total 432 5 651 6 083
1) Depreciation, amortization and impairment write-down of tangible and intangible assets, and amortization of excess values in equity accounted investments and impairment loss of such investments.
pageFOURTH QUARTERNotes to the condensed consolidated financial statements 21
Note 3: ContingenciesHydro is involved in or threatened with various legal and tax matters arising in the ordinary course of business. Hydro is of the opinion that resulting liabilities, if any, will not have a material adverse effect on its consolidated results of operations, liquidity or financial position.
Note 4: Discontinued operationsIn October 2012 Hydro's Board of Directors decided to combine the Extruded Products activities with the Profiles and Building System, as well as extruded and welded tubes, of Orkla's fully-owned subsidiary Sapa. The new combined company, to be named Sapa, will be a 50/50 joint venture owned by Orkla and Hydro. The units to be contributed includes Hydro's Building systems activities, the Precision tubing activities and general extrusion activities, which comprises all of the Extruded Products segment. Extruded Products have production facilities in Europe, North and South America, and China and sells such products as aluminium extrusion and semi fabricated products for the building and construction, transportation and engineered products industrial sectors. Hydro will continue to deliver metal products to Sapa at market prices after closing. The transaction is subject to clearance by competition authorities in several countries. Completion of the transaction is expected to take place in the first half of 2013. The Extruded Products business is reported as Assets held for sale and Discontinued operations as of mid October 2012. The results of operations in the businesses to be contributed to the joint venture are reported separately under the caption "Discontinued operations" for the current and all prior periods. No interest expense related to loans is allocated to discontinued operations. Cash flows from discontinued operations are presented separately. In the balance sheet as of December 31, 2012, assets in the business about to be disposed of and the related liabilities are reported as "Assets held for sale" and "Liabilities in disposal groups", respectively. Prior period balance sheets are not reclassified. Other components of equity includes negative cumulative translation differences of NOK 804 million related to assets held for sale.

Summary of financial data for discontinued operations
NOK million 2012 2011 2012 2011
Revenue and other income 3 947 4 618 17 598 20 019Share of the profit (loss) in equity accounted investments 4 2 18 16Depreciation, amortization and impairment 26 359 392 742Other expenses 4 106 4 669 17 637 19 533Earnings before financial items and tax (181) (408) (413) (240)
Financial income (expense), net (22) (12) (45) (40)Income before tax (203) (420) (458) (280)
Income tax expense (48) (183) (70) (222)
Income from discontinued operations (251) (603) (528) (502)
Net cash provided by (used in) operating activities 313 (155)Net cash used in investing activities (716) (470)Net cash provided by financing activities 123 9Foreign currency effects on cash (38) (11)Net cash used in discontinued operations (318) (627)
Fourth quarter 01.01 31.12
Asset groups held for sale
NOK million 2012 2011
Current assets 4 750 Noncurrent assets 4 684 Total assets 9 435
Current liabilities 782 Noncurrent liabilities 2 612 Assets held for sale, net 6 041
December 31
page FOURTH QUARTERNotes to the condensed consolidated financial statements22
Note 5: ImpairmentIn June Hydro decided to close the Kurri Kurri aluminium plant. Kurri Kurri was negatively influenced by a strengthened Australian dollar in addition to the industry-wide challenges related to weakening metal prices and higher raw material costs. Following the decision, the plant was tested for impairment and concluded to be fully impaired. The test was based on value in use (VIU) and an alternative fair value less cost to sell assessment. The impairment charge in the second quarter was NOK 1,128 million. In addition, a related associate operating shared infrastructure is written down by NOK 26 million in the second quarter. The plant was previously written down by NOK 970 million in the fourth quarter of 2011. During fourth quarter a reassessment of the fair value less cost to sell has been performed. The reassessment resulted in a reversal of impairment of about NOK 110 million in the fourth quarter result, leaving a total impairment charge of NOK 1,044 million for 2012 related to the Kurri Kurri plant.

Additional information
pageFOURTH QUARTERAdditional information 23
Return on average Capital Employed (RoaCE)
NOK million 2012 2011 2012 2011EBIT 1 158 5 982 432 10 068Adjusted Income tax expense 1) (594) (1 808) (900) (1 918)EBIT after tax 563 4 174 (468) 8 149
NOK million 2012 2011 2010Current assets 2) 28 216 28 040 24 567Property, plant and equipment 52 208 64 192 24 849Other assets 3) 24 751 30 176 27 122Other current liabilities (14 960) (16 968) (14 970)Other longterm liabilities 4) (18 118) (21 980) (15 108)Capital Employed 72 097 83 460 46 460
Return on average Capital Employed (RoaCE) 2012 2011 2012 2011Hydro 0.7 % 6.4 % (0.6) % 12.5 %Business areas 5)
Bauxite & Alumina (1.6) % 2.8 % (1.5) % 18.4 %Primary Metal 0.4 % 5.7 % (3.2) % 2.9 %Metal Markets 6.5 % 13.4 % 4.2 % 13.8 %Rolled Products 5.4 % 5.8 % 6.7 % 0.3 %Energy 23.2 % 29.5 % 23.0 % 50.1 %
Underlying Reported
Underlying Reported
December 31
1) Adjusted Income tax expense is based on reported and underlying tax expense adjusted for tax on financial items.
2) Excluding cash and cash equivalents and short-term investments.
3) Including deferred tax assets.
4) Including provisions for pension and deferred tax liabilities.
5) RoaCE at business area level is calculated using 30% tax rate. For Energy, 50% tax rate is used, adjusted for sale of SKS in 2011.

Financial calendar 2013
April 24, 2013 First quarter results
May 8, 2013 Annual General Meeting
July 18, 2013 Second quarter results
October 23, 2013 Third quarter results
Hydro reserves the right to revise these dates.
Cautionary note Certain statements included within this announcement contain forward-looking information, including, without limitation, those relating to (a) forecasts, projections and estimates, (b) statements of management's plans, objectives and strategies for Hydro, such as planned expansions, investments or other projects, (c) targeted production volumes and costs, capacities or rates, start-up costs, cost reductions and profit objectives, (d) various expectations about future developments in Hydro's markets, particularly prices, supply and demand and competition, (e) results of operations, (f) margins, (g) growth rates, (h) risk management, as well as (i) statements preceded by "expected", "scheduled", "targeted", "planned", "proposed", "intended" or similar statements.
Although we believe that the expectations reflected in such forward-looking statements are reasonable, these forward-looking statements are based on a number of assumptions and forecasts that, by their nature, involve risk and uncertainty. Various factors could cause our actual results to differ materially from those projected in a forward-looking statement or affect the extent to which a particular projection is realized. Factors that could cause these differences include, but are not limited to: our continued ability to reposition and restructure our upstream and downstream aluminium business; changes in availability and cost of energy and raw materials; global supply and demand for aluminium and aluminium products; world economic growth, including rates of inflation and industrial production; changes in the relative value of currencies and the value of commodity contracts; trends in Hydro's key markets and competition; and legislative, regulatory and political factors.
No assurance can be given that such expectations will prove to have been correct. Hydro disclaims any obligation to update or revise any forward-looking statements, whether as a result of new information, future events or otherwise.
page FOURTH QUARTERAdditional information24


Norsk Hydro ASANO-0240 Oslo Norway
Tel.: +47 22 53 81 00Fax: +47 22 53 85 53www.hydro.com
Design and production: Hydro/Artbox 02/2013 Print: Printbox © Hydro 2013
Hydro is a global supplier of aluminium with activities throughout the value chain, from bauxite extraction to the production of rolled and extruded aluminium products and building systems. Based in Norway, the company employs 22,000 people in more than 40 countries. Rooted in a century of experience in renewable energy production, technology development and progressive partnerships, Hydro is committed to strengthening the viability of the customers and communities we serve.


