1 Fracking – A solution to solve UK Energy Security or an unacceptable step too far? by N.Keith Tovey MA PhD, CEng, MICE, CEnv Assistant Govenor District 1080 NE District 1080 Environment Officer RIBI Environment Committee Member Institution of Civil Engineers Energy Panel Member 1. Background Energy is essential for modern society, but the supply of energy, and in particular electricity, in the UK is becoming more acute as the margin between available supply and demand is becoming increasingly critical. National Grid have warned of potential power cuts in the coming winters and have been exploring options including paying companies to reduce demand over critical periods. These issues have been known for more than the last decade, but insufficient strategies have been in place to alleviate the potential problems over the next 5 or so years before longer term plans, such as the building of new capacity of all forms, will allow a more comfortable margin to be achieved. Fracking is a relative new option which might help address some of these issues, but it must be addressed in the context of the three parts of the Energy Trilema i.e: 1) Firstly, the need to address energy security now that our traditional fossil fuels are running out. 2) Secondly, the need to ensure that any strategies provide solutions in the longer term that are affordable and financially secure. 3) Thirdly, the importance of addressing climate change and the need to decarbonise our energy sources. In this briefing, all three aspects will be considered, although the last of these will be covered briefly as this is not the forum for a discussion on Climate Change which warrants a forum on its own. However, there are many questions relating to Fracking that must be addressed: 1) Will Fracking provide Energy security for the UK particularly for Electricity? 2) If Fracking does have the potential to provide security in the longer term – i.e. from 2040/50 onwards will it help to address the critical issues in the next decade, and if not would over concentration on Fracking prevent us from dealing with more urgent issues? 3) Where in the UK might Fracking occur? 4) Can the experience of Fracking from America be directly applied in the UK? 5) Will Fracking lead to reduced energy costs as some claim, or will the different conditions of geology and regulation mean that the cost reductions in the US are less likely to be realised in the UK? 6) Will Fracking lead to earthquakes as some opponents suggest or is this scaremongering? 7) Will Fracking contaminate ground water, or once again is this scaremongering? 8) Are the dramatic videos of people lighting tap water in areas of Fracking a cause for concern? 9) What about water and transport issues associated with Fracking? Are these acceptable or not? 10) How much energy does a Fracking Well actually produce in comparison with other energy sources? 11) Is the gas from Fracking wells compatible with current UK natural gas? or will modifications be needed to avoid a major reconversion of all appliances as happened in the late 1960s and early 1970s 12) Will Fracking lead to lower carbon dioxide emissions? All the above questions will be addressed in this paper after a discussion of what Fracking is. 2. Fracking – the basics The term “Fracking” refers to “a method of mining in which cracks are created in subteranean rocks to obtain gas, oil, or other liquids”. The rocks are usually fractured using Hydraulic Fracturing in which high pressure liquids are injected to create cracks. Fracking is the slang term for Hydraulic Fracturing.
Transcript
1
Fracking –
A solution to solve UK Energy Security or an unacceptable step too far? by
N.Keith Tovey MA PhD, CEng, MICE, CEnv
Assistant Govenor District 1080 NE
District 1080 Environment Officer
RIBI Environment Committee Member
Institution of Civil Engineers Energy Panel Member
1. Background
Energy is essential for modern society, but the supply of energy, and in particular electricity, in the UK is
becoming more acute as the margin between available supply and demand is becoming increasingly critical.
National Grid have warned of potential power cuts in the coming winters and have been exploring options
including paying companies to reduce demand over critical periods. These issues have been known for
more than the last decade, but insufficient strategies have been in place to alleviate the potential problems
over the next 5 or so years before longer term plans, such as the building of new capacity of all forms, will
allow a more comfortable margin to be achieved. Fracking is a relative new option which might help
address some of these issues, but it must be addressed in the context of the three parts of the Energy Trilema
i.e:
1) Firstly, the need to address energy security now that our traditional fossil fuels are running out.
2) Secondly, the need to ensure that any strategies provide solutions in the longer term that are
affordable and financially secure.
3) Thirdly, the importance of addressing climate change and the need to decarbonise our energy
sources.
In this briefing, all three aspects will be considered, although the last of these will be covered briefly as this
is not the forum for a discussion on Climate Change which warrants a forum on its own.
However, there are many questions relating to Fracking that must be addressed:
1) Will Fracking provide Energy security for the UK particularly for Electricity?
2) If Fracking does have the potential to provide security in the longer term – i.e. from 2040/50
onwards will it help to address the critical issues in the next decade, and if not would over
concentration on Fracking prevent us from dealing with more urgent issues?
3) Where in the UK might Fracking occur?
4) Can the experience of Fracking from America be directly applied in the UK?
5) Will Fracking lead to reduced energy costs as some claim, or will the different conditions of
geology and regulation mean that the cost reductions in the US are less likely to be realised in the
UK?
6) Will Fracking lead to earthquakes as some opponents suggest or is this scaremongering?
7) Will Fracking contaminate ground water, or once again is this scaremongering?
8) Are the dramatic videos of people lighting tap water in areas of Fracking a cause for concern?
9) What about water and transport issues associated with Fracking? Are these acceptable or not?
10) How much energy does a Fracking Well actually produce in comparison with other energy sources?
11) Is the gas from Fracking wells compatible with current UK natural gas? or will modifications be
needed to avoid a major reconversion of all appliances as happened in the late 1960s and early 1970s
12) Will Fracking lead to lower carbon dioxide emissions?
All the above questions will be addressed in this paper after a discussion of what Fracking is.
2. Fracking – the basics
The term “Fracking” refers to “a method of mining in which cracks are created in subteranean rocks to
obtain gas, oil, or other liquids”. The rocks are usually fractured using Hydraulic Fracturing in which high
pressure liquids are injected to create cracks. Fracking is the slang term for Hydraulic Fracturing.
2
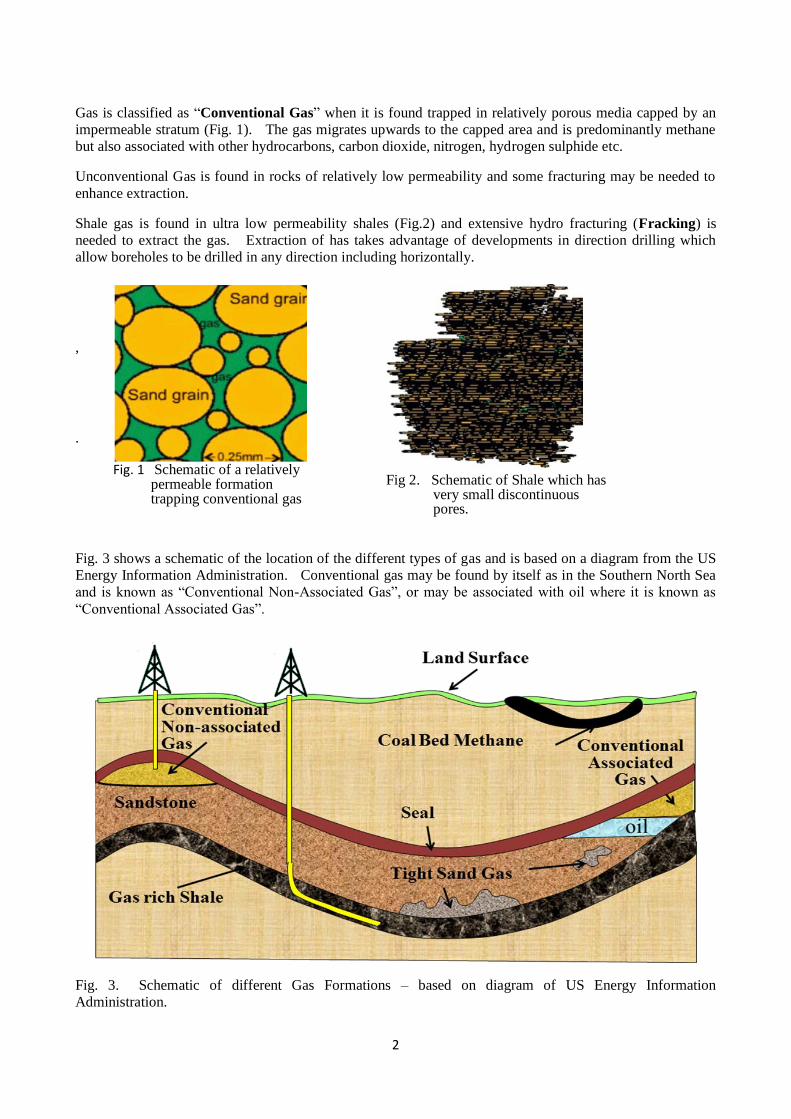
Gas is classified as “Conventional Gas” when it is found trapped in relatively porous media capped by an
impermeable stratum (Fig. 1). The gas migrates upwards to the capped area and is predominantly methane
but also associated with other hydrocarbons, carbon dioxide, nitrogen, hydrogen sulphide etc.
Unconventional Gas is found in rocks of relatively low permeability and some fracturing may be needed to
enhance extraction.
Shale gas is found in ultra low permeability shales (Fig.2) and extensive hydro fracturing (Fracking) is
needed to extract the gas. Extraction of has takes advantage of developments in direction drilling which
allow boreholes to be drilled in any direction including horizontally.
,
.
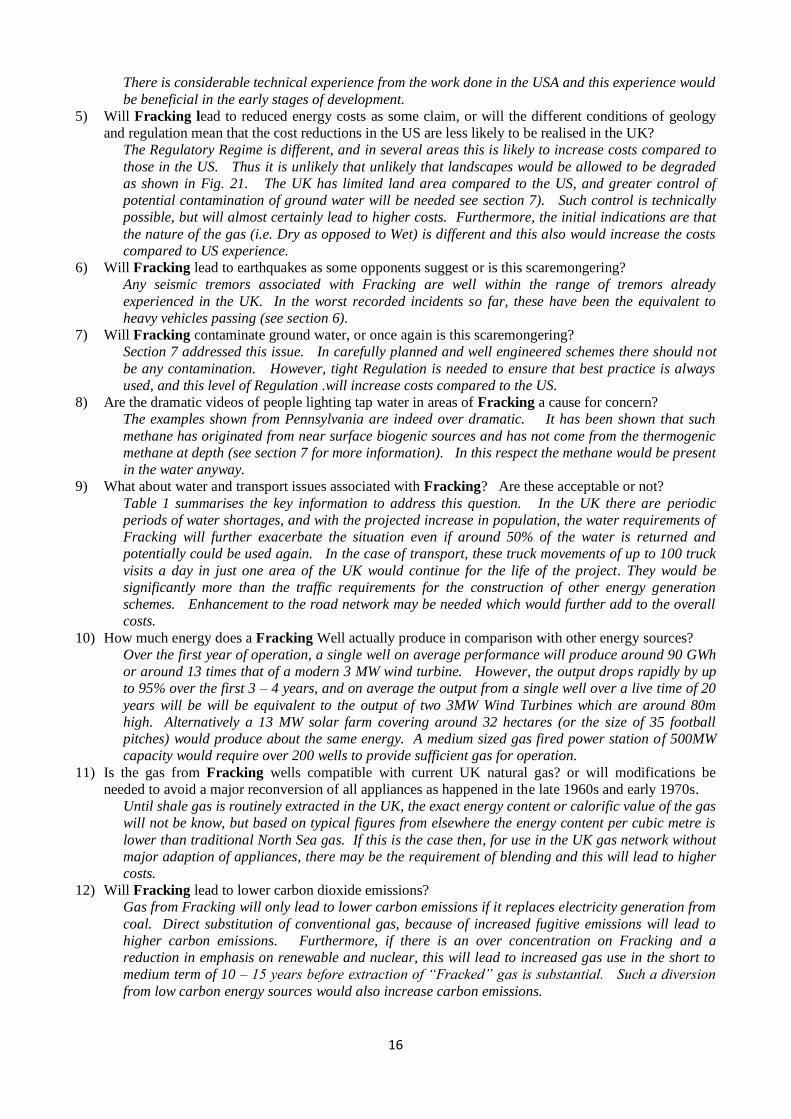
Fig. 3 shows a schematic of the location of the different types of gas and is based on a diagram from the US
Energy Information Administration. Conventional gas may be found by itself as in the Southern North Sea
and is known as “Conventional Non-Associated Gas”, or may be associated with oil where it is known as
“Conventional Associated Gas”.
Fig. 3. Schematic of different Gas Formations – based on diagram of US Energy Information
Administration.
Fig. 1 Schematic of a relatively
permeable formation trapping conventional gas
Fig 2. Schematic of Shale which has
very small discontinuous pores.
3
In addition to the above distinctions between the different types of gas, the following are also of relevance,
particularly when Fracking is concerned.
1) Dry Gas: Gas which is predominantly methane with little if any co-products such as ethane, propane
etc.
2) Wet Gas: Gas which contains appreciable proportions co-products of hydrocarbon such as ethane,
propane, and butane which may be in liquid or gaseous form.
3) Co-products may be liquefied as LPG or converted into petrol and add value to gas produced.
4) Wet Gas defined as having more than 0.1 US gal of condensate per 1000 cuft.
There are often conflicting reports on the amounts of gas available in a Reservoir, sometimes varying by a
factor of ten or more.
The Reserve of a reservoir is the total amount of gas available in a Reservoir, and it is often qualified by the
words Proven, Probable, and Possible. The first of these terms indicates that the reserve is of that
magnitude, while Possible indicates an ultimate possible, but unproven total amount. The differences
between the two figures Proven and Possible, can often be a factor of several times. Conventional wisdom
tends to favour the amount of Reserve indicated by Proven and Probable together and implies a high
likelihood that the reserve will be of that magnitude.
While the Reserve indicates the total amount available, the Resource indicates the total amount of gas which
can be technically and/or economically extracted. Typically the Resource is 10 – 20% of the Reserve.
In the debate on Fracking, there is often confusion between the use of the terms Reserve and Resource and
partly explains why there are often significant differences in the projections of the extent to which “Fracked”
Gas could play in the UK.
Fig. 4 Location of Shales in UK
Jurassic Lias Subcrop
Kimmeridge Clay outcrop
Oxford Clay outcrop
Lias outcrop
Namurian outcrop
Cambrian / Tremadoc
Conventional Gas Wells
Fig. 4 shows the location of different Shales in the
UK and also the locations of wells where
conventional gas has flowed.
Fig. 5 Vertical Section showing location of two
separate sources of methane. In Pennsylvania, the
methane contaminated tap water originated from the
Biogenic Material and was not associated with
Fracking
Biological decay of organic
at shallow depths
Biogenic methane
Biogenic and Thermogenic
methane can be distinguished by
isotopic means
Organic matter “cooked” at depth
and pressure
Thermogenic methane in Shale
4
In the UK the Shale of interest is often 1.5 – 2 km below the surface (Fig. 5) and well below any aquifer for
drinking water which may go to 400m deep. Further discussion of possible contamination by this means is
covered in section 7 which also shows that many of the dramatic internet videos of tap water igniting
because of methane present in drinking water have been shown to be not associated with Fracking.
Fig. 6 shows and overall overview of a Fracking Well together with details at the point of penetration of the
aquifer and also the end of the borehole. The penetration of the aquifer is one of the controversial parts of
the operation, but in a well engineered operation there should will be no cross contamination as is discussed
in Section 7.
Fig. 6 Schematics through a Fracking Well; a) Overview, b) penetration through aquifer, c) within shale
The borehole may extend up to 1 – 2km horizontally, and when complete the hydraulic pressure of the fluid
in the borehole causes fine holes in the casing and fractures the shale allowing the gas to flow to the surface
(Fig. 7).
Fig. 7 Fracking: a) small charges penetrate the casing and cement lining and fracture shale; b) gas flows
from fractured shale back to surface
The fluid consists of approximately 94% and the remaining 6% is made up of 5% sand and the final 1% as
additives such as acid scale inhibitors, biocides, friction reducers and surfactants. The purpose of the sand is
to prop open the cracks to promote gas flow (Fig. 8). Some of the water remains in the shale reservoir but
a)
b)
c)
Cemented Steel
Casing
Aquifer
Shale formation
Cement pumped through borehole
to surround horizontal casing
a)
b)
5
up to 80%+ returns to the surface with the gas and must be treated to deal with the added contaminants, and
also other chemical and naturally occurring radioactive material (NORM) which, depending on the reservoir,
may be washed out during gas extraction.
Fig. 8 Schematic of gas flowing from fissures created by hydro-fracturing. Sand particles prop open the
cracks to aid gas flow.
Typical Fracking sites in the US are shown in Fig. 9. A holding pond of 0.5 – 1.0 ha is needed to store the
return water before treatment. There is a remote possibility of leakage from these, and this issue is explored
further in Section 7.
Climate Change issues
Fig. 9. Typical Fracking Well Pads in the US. A holding pond of 0.5 – 1.0 ha is needed to store the return
water before treatment.
Fig. 10 shows the complexity of the surface equipment at each Fracking Well Pad. In the USA it is
common to drill around 6 wells on each pad, but in the UK there are proposals from Cuadrilla to have up to
10 wells per pad.
Fig. 10 View of surface equipment at a typical Fracking Well installation
6
Schematically a well pad with up to 10 wells is shown in Fig 11 together with a schematic of the situation in
the US with four pads each with 6 wells. Note the horizontal distance form the base of the well may extend
horizontally up to 1 – 2km.
Fig. 11 Schematics of Fracking Wells and Well Pads: a) horizontal area covered by a single well pad. b)
3D schematic of a cluster of wells and well pads.
3. Physical Resource and extent Fracking might satisfy UK Energy Security needs.
Fig. 12 Energy produced by different Wells in US.
The output from a single Fracking Well varies
depending on the specifics of the Shale concerned,
but experience from the US shows that the output
drops of rapidly after the first 3 years of operation
and has typically dropped by up to 95% by year 5.
There after the output is low. Cumulatively over
the lifespan of an average well, the energy output is
equivalent to the output of approximately two 3
MW Wind Turbines. This places in context the
answer to question 11.
The estimated gas production for the Bowland-Hodder Shale in Lancashire, one of the first which is likely to
be exploited over the period 2014–2040 is shown in Table 1. The figures are based on the High. Medium,
and Low Scenarios as projected by Cuadrilla, the main developer and reported in the Tyndall (2011b) report.
The Maximum Cumulative Production from Blackpool Area over the 25 years would thus be around ~76
bcm or approximately 10 months supply under the current UK consumption.
What is apparent is the quantity of water required, and also the number of truck visits needed over the period.
In the case of water, up to half may be recovered for reuse, but the major part of this water is needed in the
initial stages of well development. To put the water volumes into context, the average household water
consumption is around 180 m3 per year. In areas where water supply is limited, Fracking operations could
impose further stress on supplies, although other possibilities such as using sea water might be an option in
some locations.
Fig. 13 shows three scenarios for the total extraction of gas from Fracking in the UK as reported in the
Tyndall Report (2011). The lowest is from the Department of Energy and Climate Change (DECC) while
the middle estimate is from the International Energy Agency (EIA), while the most optimistic is from
7
Cuadrilla the developer. It is noticeable that the production of gas only really becomes significant from
around 2025-2030, and that will have little impact on energy security in the next decade.
Scenario
Low Medium High
Cumulative Production (bcm) 19.7 40.3 76.7
Wells 190 400 810
Well Pads 19 40 81
Average annual production (bcm) 0.73 1.49 2.84
Average annual production as a percentage
of UK consumption (91bcm) 0.8% 1.7% 3.2%
Water volume (m3) 1,679,800 3,359,600 6,719,200
Flowback Water (m3) – for treatment 785,838 1,571,675 3,143,350
Truck Visits 181,750 363,500 720,000
Average Truck Visits per weekday 26 53 106
Production in single year (bcm) 0.29 -2.12 0.58 -3.57 0.58 -4.90
Table 1. Physical Data relating to exploitation of the Bowland-Hodder Shale in the North West – from
Tyndall Report(2011b).
In the analysis that follows it is assumed that the production will follow the most optimistic of the three
projections, i.e. Cuadrilla which reaches a peak of nearly 50 billion cubic metres a year by 2040 – 2045.
The critical situation for the UK with regards to energy, is in the next 10 – 15 years and particularly for
electricity generation and the subsequent analysis will explore the extent to which Fracking might help
towards energy security up to 2030.
Fig. 13 Production of gas from Fracking in the UK according to three different projections.
In the analysis it is assumed that there will be an overall improvement in the efficiency of electricity
generation from gas by 5% over the period, and that the proportion of gas consumed for electricity and non-
electricity demands will remain approximately similar. On this basis and using the Cuadrilla data from Fig.
13, “Fracked”-gas will provide around 36.5 TWh of electricity demand by 2030, or around 7.5-10% of
demand. By 2040 – 2050 – this figure would rise to 20+%.
The production of gas from UK sources, and also UK demand for gas is shown in Fig. 14. Until 2004, the
UK was a net exporter of gas indicated by the green area. In 2004, projections for both production and
demand were made shown by the dotted lines with up to 90% being required from imports by 2020. The
actual production has closely followed the 2004 projection as shown by the blue line. However, the actual
demand has fallen noticeably in the last 2 – 3 years – partly as a result of the recession, but more importantly
from the fact that since 2011, there was a switch away from electricity from gas generation back to coal.
8
This has arisen as gas is now, unlike previously, increasingly purchased on the international markets became
increasing costly compared to coal. In 2014 with more coal generation reaching end of its economic life,
there will be a reversion to more gas generation, and demand will rise.
Fig. 14 Gas Demand and Production in the UK 1998 - 2020
a)
b)
Fig. 15. Details of Gas Imports and Exports in 2012; a) Total Values, b) Percentage Imports from
different countries.
As can be seen in Fig. 15, the dominant imports come from Norway and the Middle East. The imports from
the Netherlands include the increasing amounts coming indirectly to Europe from Russia.
The impact of the increasing dependence of imported gas on the wholesale price of electricity may be seen in
Fig. 16. In 2003, the UK Government made a projection that the wholesale price of electricity would be 2p
per kWh in 2020 as they predicted that any increases in the cost of gas would be offset by efficiency gains.
However, since 2004 when the UK has become dependent on imported gas the wholesale price has become
much more unpredictable but has seen an increase to over 5p by 2014 or an increase of 150% while actual
retail prices have increased by 100%. During that same time the support for renewables only accounts for
10% of the rise in domestic prices. Thus contrary to often cited comments, the support for renewable is not
the cause of increased electricity prices. In 2011 and 2012, as Fig. 14 demonstrates, there has been a shift
9
away from gas and this has helped to stabilise the wholesale price in the last 2 years. However, as more and
more gas is likely to be consumed in the next two years with the closure of the aging coal generation,
wholesale prices will rise, and if “Fracked” Gas is indeed cheaper as some claim then this could help to
offset any rise. However, as will be shown, even with cheaper “Fracked” Gas, this is unlikely have much, if
any impact on wholesale prices much before around 2030.
Fig. 16 Variation in Wholesale Electricity Prices
4. Impact of Gas from Fracking on UK Electricity Supply to 2030.
Several assumptions must be made on likely future demand for electricity, and the following assumptions
follow the Climate Change Committee (2011) estimates where there is a significant growth in electricity
demand for both electric vehicles and heat pumps. The deployment of the latter will significantly save
energy overall, but will instead see an increase in electricity demand. Part of the thinking of the Climate
Change Committee centred around the need to decarbonise energy supply, something that is easier with
electricity than other forms of energy demand – e.g. fossil fuels for heating and transport.
An alternative scenario will assume that there is limited growth in either electric vehicles or heat pumps.
Whichever scenario ultimately turns out to be more appropriate, because of largely ineffective strategic
planning over the last 15 – 20 years, gas will play an increasing part in our electricity mix in the next decade
or so and it is here that Fracking might provide a potential benefit in terms of energy security.
As indicated above in the discussion relating to Fig. 13, the projections will use the most optimistic
projections for gas production from Fracking. In the case of existing nuclear and coal fired stations, these
will close according to the dates published on 9th September 2013.
Any new nuclear generation will not come on line until 2021 – 2022 and thereafter it is assumed that
one such station is completed each year up to 2030.
At the same time, no new coal generation will be ordered until carbon capture and sequestration on
the size required has been demonstrated which is not likely much before 2020. With relatively long
construction times the extent to which new coal generation will impact on the electricity mix is
limited. The projections assume an increase in such new coal capacity at the rate of 300 MW per
year in the early 2020s and 1000MW per year in the mid and late 2020s.
• Oil generation has been at a very low level for the last 20 years and will remain so for the remainder
of the time up to 2030
UK Government Projection in 2003 for 2020
10
• Renewable electricity generation in the projections takes the current capacity and that under
construction and based on previous experience 70% of the schemes consented and 25% of those yet
to be approved. The load factor for renewables does vary from year to year as do the load factors
for nuclear and fossil fuel generation, but it is assumed that the weighted average load factor for the
last 5 years will be representative up to 2030.
• In the case of renewable technologies other than wind the following assumptions are made:
• Solar: the installation rate increases to 1 million houses a year from 2020 – 40%
houses fitted by 2030 and there is a continued expansion of large scale schemes
• Tidal and Wave: – up to 2 GW installed by 2020 and significant expansion
thereafter with Severn Barrage completed by 2025.
• In the case of wind, the following data were used to inform the projections.
Current Status (May 2014)
2030 Current
Under
Construction Consented
Onshore 15000 MW 7181 MW 1764 MW 4422 MW
Offshore 24000 MW 3653 MW 1401MW 4312 MW
• Any shortfall in electricity generation between projected demand and that supplied by nuclear,
renewables, and coal will inevitably come from gas, of which gas from Fracking could play a part.
Both the historic electricity generation mix from 1970 and the future such mix up to 2030 are shown in Fig.
17. There are several points to note about this diagram:
1) The top line shows the projected demand when electric vehicles and heat pumps are promoted, while
the dashed blue line represents the situation where there is little enthusiasm for such technologies.
2) Both nuclear and coal generation show a significant decline in output from around 2010 – 2015
onwards. By 2023 it is expected that only Sizewell B of the existing nuclear fleet will be operating,
with all other such stations closed, several having significantly exceeded their original design life. In
the case of coal, regulations to cut particulate and acid rain pollutions due to come into force fully at
the end of 2015 will mean that those fossil fired stations not fitted will be closed. Many of these are
close to 50 years old and beyond their original design life. Further the expenses of spending up to
0.5 billion pounds on an upgrade can hardly be justified for plants which will only have 5 – 10 years
life still remaining. Such an expenditure would inevitably increase consumer bills. Contrary to
some popular believe, these pollution control regulations from the EU are not to address carbon
emissions and climate change. Indeed retrospectively fitting such pollution devices to existing fossil
fuel stations will actually increase the emissions of carbon dioxide, even though there will be health
benefits from less particulates and sulphur dioxide in the atmosphere.
3) Any new nuclear or coal generation completed in the 2020s will not even cover the loss of older
generation capacity in the 20 years up to 2025.
4) The upward king in the “Other Renewables” represents the impact of the Severn Barrage coming on
stream in 2025 which is far from certain.
5) The Offshore and onshore wind projections follow the assumption given earlier.
6) The balance of the generation is provided by gas which increases significantly after 2015 before
reducing again in the late 2025. As UK gas is running out, this will inevitably mean greater
reliance on imported gas at volatile prices, particularly when China and other developing countries
have declared they intend to significantly increase their consumption of gas with imports from the
Middle East and Russia.
7) Gas from Fracking will only contribute a small proportion of the demand whether we promote heat
pumps and electric vehicles or not, and so will not be a significant player up to 2030. On the other
hand, beyond 2030, the impact of “Fracked” Gas could become more significant rising to around
20-25% by 2040-2050.
11
Gas from Fracking, however, will not help the critical situation in the next 5 – 10 years, and only
more renewables or an increased reliance on imported gas which is becoming increasingly expensive
will provide the UK with the needed Energy Security in the short term.
Fig. 17 Electricity Scenarios for the UK to 2030. Even with significant deployment of renewables the UK
will become increasing reliant on gas in the next 10 years, much of which will be imported. At best
Fracking will only provide 7.5 – 10% of the requirement and will not solve the short term generation issues.
5. Economic Issues of Fracking
While the technology of Fracking is now becoming well established, a question mark hangs over the extent
to which the economic viability of the shale gas as seen in the USA can be used to model the impact in the
UK. The viability of a Shale Gas Well is defined by its Economic Ultimate Recovery (EUR) or the total
amount of gas that can be economically extracted. In US wells have been drilled with EURs of 0.04 to 2.60
bcf (billion cubic feet). As the price has dropped in recent years, those less than 2 bcf have become less
economic. According to recent research conducted last year (Bloomberg, 2013) “The cost of shale gas
extraction in the UK is likely to be significantly higher than in the US”. The cost of gas produced is
reduced if high value co-products such as higher hydro-carbons are present in “WET” gas. Many wells in
US are “WET”. This advantage is unlikely to be significant in UK where much of gas is likely to be
“DRY”. Comments such as: "We will continue to drill to hold leases, and will continue to drill in the wet
gas. But there will be little if any drilling in the dry gas areas“ (DeMarco, 2012) are becoming increasingly
common in US. More recently the Financial Times (11th
May 2014) reported that $1 trillion of new oil and
gas projects are uneconomic. “The cost of developing many new unconventional oil and gas assets is well
over $100 per barrel. In the current environment many projects do not make sense from a cost
perspective.”
Claims are frequently made by proponents that Fracking will reduce cost of gas in UK using evidence from
the US. However, this analogy is questionable given the above statements. Furthermore, nowhere has the
price of exactly how much “Fracked” Gas will cost been indicated. Claims such as this are unethical as
without such information it is not possible to verify that UK “Fracked” Gas will indeed be cheaper than the
current prices. The different nature of the UK Shale gas, as explained above, coupled with likely tighter
0
100
200
300
400
500
600
1970 1980 1990 2000 2010 2020 2030
TW
H (
bil
lion
s of
un
its
(kW
h))
Existing Coal
Existing Nuclear
Oil
UK GasImported Gas
New Nuclear?
Other Renewables
Offshore Wind
Onshore Wind
Fracked Gas
New Coal?
• Limited electric cars or heat pumps
12
regulation to check ground water contamination and correct effluent treatment will increase costs above
those in the US. However, even if it will ultimately become cheaper in the long term post 2040 as implied
by Cuadrilla figures in Fig. 13, the supply of “Fracked” Gas will NOT be significant until after 2030 (Fig.
17). Over concentration on Fracking will diverting attention from the pressing issues of the Electricity
Supply issues looming post 2015.
This section has addressed Questions 4 and 5 from the initial list i.e:
• Can the experience of Fracking from America be directly applied in the UK?
• Will Fracking lead to reduced energy costs as some claim, or will the different conditions of
geology and regulation mean that the cost reductions in the US are less likely to be realised in the
UK?
The answer to the first is unlikely, and the answer to the second is maybe, but the companies need to be
much more careful about the statements they make.
6. Environmental Impacts – Seismicity.
Concern has been expressed that “Fracking” causes
earthquakes and opponents argue that this in itself
is a reason to reject the technology. Seismicity is
measured on the Richter Scale which is a
logarithmic scale and thus increasing the Richter
Scale Number by 1.0 implies an amplitude increase
by a factor of 10. In the UK moderate traffic
causes vibrations which would measure 0.5 – 1.0
and sometimes more on the Richter Scale, and there
are suggestions that this should be set as the
threshold for reporting “Fracking” incidents. Two
incidents were reported in the exploratory drilling
in Lancashire and measured 1.5 and 2.3 on the
Richter Scale. These represent amplitude levels 3
and 20 times the threshold. For a comparison the
Christchurch Earthquake in 2011 was 640 thousand
times larger in amplitude terms, and the Fukushima
Earthquake of the same year was 400 million times
larger.
There was evidence of a small amount of damage to
the drill string at depth in the shale during the
above mentioned events, but importantly, the
integrity of the casing as it passed through the
aquifer was not compromised.
Fig. 18 displays the earthquakes from both natural
events and coal mining incidents recorded in the
UK from 1382 to 2012. Earthquakes with
magnitudes of above 5 have been recorded or
10000 times the proposed amplitude threshold.
Fig. 18 Incidence of Earthquakes in the UK 1382
– 2012. The red dots refer to naturally
occuring incidents, while the blue dots are
associated with mining.
Table 2 shows the frequency of earthquakes of given magnitude in the UK and their impact. Even the
Fracking event with the highest magnitude is unlikely to have been felt.
In the UK, many of the Shales are at greater depth than in the US, and since any effect will occur only once
per well at the time of initial fracturing seismicity is not by itself a cause for concern or a reason, by itself to
reject Fracking. In answering the question 6 it would appear that there have been over dramatic claims
about the impact of Fracking.
13
Magnitude UK frequency Impact at surface
1.0 100s per year Not felt, except by a very few under especially favourable conditions similar to moderate traffic
2.0 ~ 25 per year Not felt, except by a very few under favourable conditions.
3.0 ~ 3 per year Felt by few people at rest or in the upper floors of buildings;
similar to the passing of a very heavy truck.
4.0 ~ 1 every 3–4 years Felt by many people, often up to tens of kilometres away;
some dishes broken; pendulum clocks may stop.
5.0 1 every 20+ years Felt by all people nearby; damage negligible in buildings of
good design and construction; few instances of fallen plaster;
some chimneys broken.
Table 2. Frequency and impact of earthquakes in the UK.
7. Environmental Impact: Ground Water Contamination
Question 7 and 8 are related to this. Most of the issues have been addressed already in different sections
above, but are summarised together here with relevant cross references. There are four very different aspects
to address here:
1. The return fluids do include chemicals injected into the circulating water and may also include
chemicals and naturally occurring radioactive material leached out during Fracking. Between 20%
and 80% of the injected water is returned and held in the return water holding pond (Fig. 9). Some
opponents argue that these ponds could be the source of contamination if there are leaks through the
lining; if heavy rain causes an overflow of water. If such ponds are adequately engineered through
good regulation, particularly using adequately thick smectite lining layers, such contamination can
be avoided. Smectite has excellent properties with self sealing capabilities and extremely low
permeabilities of the order of 1m per million years. Ensuring that the surrounding surface water
hydrology is also fully understood before design of the ponds should avoid any contamination from
overtopping.
2. The return fluids also have to pass through the aquifer (Fig. 6b). This is a potential point of
weakness, and failures of the casing at this point, though rare have occurred. In a well-engineered
system, there should be no concern at this critical point of penetration by the well of the aquifer.
However, if there is a failure of the well casing at this point then contamination will occur. Precise
information of evidence of well casing failures are difficult to find, but there are implications that the
failure rate is well less than 1%. However, even if the failure rate is just 0.05% and with a projected
several tens of thousands of wells to be drilled up to 20 wells might be suspect. If adequate
regulatory measures are in place to immediately detect contamination in the aquifer, the appropriate
measure can be taken before any contamination enters the drinking water supply. In the tougher
Regulation that is being discussed in the UK there might be the requirement that each borehole
should have a second borehole drilled to the aquifer a short distance away from the production well
to provide an early warning of casing failure. This additional measure would increase the cost of
Fracking.
3. The third point relates to the separation of the shale layer and the aquifer. In the UK the depth of the
Shale is often much deeper than in the US, and at the distances of separation between the shale and
aquifer of ~1.5 km, any cracking associated with Fracking will not penetrate over this distance and
cause cross contamination. Recently, the British Geological Survey has been surveying the
separation between the two, and are producing maps to indicate areas where the separation is small
and Fracking should not be permitted. With this information cross contamination from Fracking
should not be of concern.
4. Question 8 relates to the dramatic videos of people lighting tap water. However, as demonstrated in
the discussion to Fig. 5, naturally occurring biogenic methane from near surface layers can
contaminate drinking water, and would have occurred whether Fracking had taken place or not. It is
readily possible to differentiate between the biogenic methane and thermogenic methane from
Fracking and this clearly needs to be part of any Regulatory Regime.
14
Credance for methane contamination of drinking water from Fracking was given in the scientific
paper by Osborne et al (2011). However, Molofsky et al. (2013) demonstrated that the original
findings were suspect and that the source of methane was naturally occurring biogenic methane, and
not a result of Fracking.
8. Climate Change impacts
The following two images show the extent of ice cover on the north pole in 1979 (Fig 19a) and 2012 (Fig
19b) and demonstrate a 51% reduction in the area covered. The minimum ice cover occurs in September
and in 1979 it was 7.01 million sqkm, while in 2012 it was 3.44 million sqkm, a loss of 51% in 33 years.
The actual extent does vary from year to year and the cover in 2013 was slightly larger but the overall trend
is a consistent reduction with time.
a)
b)
Fig. 19. The ice cover over the North Pole in (a) 1979, and (b) 2012. The red line on both images outlines
the extent in 1979 for easy comparison.
There are both natural and anthropogenic causes for climatic change, but as time progresses, more and more
convincing evidence is emerging that man made causes are the dominant effect with 70+% and may be as
much as 90% of the causes attributed to man.
The impacts of such change will be a generally warming world, but with paradoxically some regions
possibly becoming cooler. However, as is already being seen, there will be an increased likelihood of more
extreme and severe events.
The dominant impact from man are the so called greenhouse gases of which carbon dioxide is the dominant
cause followed by methane which, though more potent in greenhouse gas terms, has significantly lower total
emissions in terms of green house gas potential.
The majority of the carbon dioxide emissions come from the burning of fossil fuels and the following table
gives the approximate carbon dioxide emissions for each unit (kWh) of energy produced. [1 kWh is the
approximate amount of energy consumed by boiling 9.5 litres of water, an average washing machine cycle,
one quarter of a tumble dryer cycle, or a one bar electric fire running for one hour]. According to Mackay &
Stone (DECC, 2013), the fugitive emissions from gas from extraction through Fracking are larger than those
from conventional sources. This means that in any use, “Fracked” Gas will have higher overall emissions.
Energy Use Using Conventional Gas Using “Fracked Gas”
Direct use of gas in heating etc. 199 – 207 g/kWh* 200 – 253 g/kWh
* depending on regulation
Electricity Generation
Gas using CCGT 360 – 430 g/kWh 423 – 535 g/kWh *
depending on regulation
Coal 837 – 1130g/kWh *
Table 3. Carbon Emission factors for different types of energy use. The data denoted by * were obtained
from Mackay & Stone and reported in DECC (2013). Each use has a range of values depending on the
actual efficiency of the end use appliance (e.g. the combined cycle gas turbine in the case of electricity
generation from gas.
“Fracked” gas would help in decarbonising electricity supply in comparison to coal, but not in comparison
with conventional gas. As Fig. 17 demonstrates, there will be a significant increase in gas generation long
before gas from Fracking has an impact. Furthermore use of “Fracked” Gas as opposed to low carbon
technologies such as nuclear and renewable would cause an increase in emissions.
15
9. Other Impacts
Economic pressures in the US are resulting in large numbers of Fracking Wells, and Fig 20 shows the extent
of Fracking Wells in Texas in 2009, an area about half the size of East Anglia. The number of wells
increased to over 6000 my mid 2012, and this is the extent of exploitation that might be expected in the UK.
It is interesting to note that Fracking is also occurring in some of the urban areas particularly in the area of
DFW International Airport.
Fig. 20 Extent of Fracking Wells in Dallas – Fort
Worth Area of Texas.
The impact on the landscape after Fracking may
also be judged from an area in Wyoming (Fig. 21).
This has left a derelict landscape which is
landscape much worse degraded than the claims of
“industrial landscape” levelled against wind power.
In the UK we would almost certainly insist on
landscape restoration and this additional Regulation
would further add to the costs of extracting gas by
Fracking.
Fig. 21. The landscape in Wyoming following
extensive Fracking operations.
10. Answering the Key Questions
Answers to all of the Key Questions posed in Section 1 have been addressed in various sections of this paper,
but these are summarised together here for convenience for the reader and to provide a focus for discussion.
1) Will Fracking provide Energy security for the UK particularly for Electricity?
There is the potential to provide perhaps 25% of our electricity and maybe more also a similar
proportion for non-electricity uses by 2040 (Fig. 13 and related discussion is relevant here). This
resource would be important for UK Energy Security.
2) If Fracking does have the potential to provide security in the longer term – i.e. from 2040/50 onwards
will it help to address the critical issues in the next decade, and if not would over concentration on
Fracking prevent us from dealing with more urgent issues?
As Fig. 17 demonstrates that in the short term, at best, Fracking will only provide a maximum of
10% of that required for electricity generation by 2030 even with optimistic scenarios for the
deployment of renewable and nuclear. In this respect concentrating on this and ignoring
opportunities from renewable and nuclear will detract from tacking the critical supply issues in the
short term (i.e. the next 5 -10 years).
3) Where in the UK might Fracking occur?
There are many areas which are potential sources of “Fracked” Gas in the UK (Fig. 4 is relevant
here).
4) Can the experience of Fracking from America be directly applied in the UK?
16
There is considerable technical experience from the work done in the USA and this experience would
be beneficial in the early stages of development.
5) Will Fracking lead to reduced energy costs as some claim, or will the different conditions of geology
and regulation mean that the cost reductions in the US are less likely to be realised in the UK?
The Regulatory Regime is different, and in several areas this is likely to increase costs compared to
those in the US. Thus it is unlikely that unlikely that landscapes would be allowed to be degraded
as shown in Fig. 21. The UK has limited land area compared to the US, and greater control of
potential contamination of ground water will be needed see section 7). Such control is technically
possible, but will almost certainly lead to higher costs. Furthermore, the initial indications are that
the nature of the gas (i.e. Dry as opposed to Wet) is different and this also would increase the costs
compared to US experience.
6) Will Fracking lead to earthquakes as some opponents suggest or is this scaremongering?
Any seismic tremors associated with Fracking are well within the range of tremors already
experienced in the UK. In the worst recorded incidents so far, these have been the equivalent to
heavy vehicles passing (see section 6).
7) Will Fracking contaminate ground water, or once again is this scaremongering?
Section 7 addressed this issue. In carefully planned and well engineered schemes there should not
be any contamination. However, tight Regulation is needed to ensure that best practice is always
used, and this level of Regulation .will increase costs compared to the US.
8) Are the dramatic videos of people lighting tap water in areas of Fracking a cause for concern?
The examples shown from Pennsylvania are indeed over dramatic. It has been shown that such
methane has originated from near surface biogenic sources and has not come from the thermogenic
methane at depth (see section 7 for more information). In this respect the methane would be present
in the water anyway.
9) What about water and transport issues associated with Fracking? Are these acceptable or not?
Table 1 summarises the key information to address this question. In the UK there are periodic
periods of water shortages, and with the projected increase in population, the water requirements of
Fracking will further exacerbate the situation even if around 50% of the water is returned and
potentially could be used again. In the case of transport, these truck movements of up to 100 truck
visits a day in just one area of the UK would continue for the life of the project. They would be
significantly more than the traffic requirements for the construction of other energy generation
schemes. Enhancement to the road network may be needed which would further add to the overall
costs.
10) How much energy does a Fracking Well actually produce in comparison with other energy sources?
Over the first year of operation, a single well on average performance will produce around 90 GWh
or around 13 times that of a modern 3 MW wind turbine. However, the output drops rapidly by up
to 95% over the first 3 – 4 years, and on average the output from a single well over a live time of 20
years will be will be equivalent to the output of two 3MW Wind Turbines which are around 80m
high. Alternatively a 13 MW solar farm covering around 32 hectares (or the size of 35 football
pitches) would produce about the same energy. A medium sized gas fired power station of 500MW
capacity would require over 200 wells to provide sufficient gas for operation.
11) Is the gas from Fracking wells compatible with current UK natural gas? or will modifications be
needed to avoid a major reconversion of all appliances as happened in the late 1960s and early 1970s.
Until shale gas is routinely extracted in the UK, the exact energy content or calorific value of the gas
will not be know, but based on typical figures from elsewhere the energy content per cubic metre is
lower than traditional North Sea gas. If this is the case then, for use in the UK gas network without
major adaption of appliances, there may be the requirement of blending and this will lead to higher
costs.
12) Will Fracking lead to lower carbon dioxide emissions?
Gas from Fracking will only lead to lower carbon emissions if it replaces electricity generation from
coal. Direct substitution of conventional gas, because of increased fugitive emissions will lead to
higher carbon emissions. Furthermore, if there is an over concentration on Fracking and a
reduction in emphasis on renewable and nuclear, this will lead to increased gas use in the short to
medium term of 10 – 15 years before extraction of “Fracked” gas is substantial. Such a diversion
from low carbon energy sources would also increase carbon emissions.
17
11. Concluding Remarks
There is no one energy source which is the magic bullet to solve all the energy issues affecting the UK. It is
important that all three parts of the energy trilema: energy security, energy affordability, and climate change
are addressed equally.
“Fracked” Gas would undoubtedly help in providing energy security in the longer term from 2035 onwards
but will have limited impact before 2025 – 2030. Over concentration on Fracking in the short term to the
expense of low carbon technologies of nuclear and renewable will result in an increasing reliance in the short
term before substantial quantities of “Fracked” Gas are available from increasing variable and costly imports
from overseas.
The claims that “Fracked” Gas will result in cheaper energy bills are questionable, and unethical. If indeed,
“Fracked” will be cheaper than the current wholesale price, then the developers should declare what it is so
that a true comparison can be made. Evidence from the USA cannot be used as has been shown the likely
higher preponderance of “Dry” Gas in the UK is less economically viable to extract than the predominantly
“Wet” Gas in the USA. Furthermore stricter Regulation likely in the UK will lead to higher prices than in
the US. Finally, the impact of “Fracked” Gas will be small until post 2030, and in the meantime, if there is a
diversion away from renewable, the price of generation from which is now on a downward trend, there will
be the need for increased imports of more costly overseas gas in the short term leading to a short term
increase in bills even though the longer term after 10 – 15 years they might be cheaper.
Some in the industry suggest that electricity generated from “Fracked” Gas will be as cheap, and possible
marginally cheaper than the proposed strike price for new nuclear of £92.50 per MWh, but this figure is
nearly 80% higher than the current wholesale price as witnessed in Fig. 16. By saying that “Fracked” Gas
will be cheaper, developers are bribing the public into supporting something they cannot deliver. Who
would pay if “Fracked” Gas does not result in cheaper wholesale prices in both the short and longer term:
the consumer or the tax payer. Developers would increase their credibility by not suggesting that the gas
will be cheaper as that cannot be proved at present.
Some of the actions of the anti-Fracking lobby are also inaccurate and misleading. The seismic hazards are
largely no existent, and the claims of methane in drinking water have been shown to be false at least in
Pennsylvania. Concern over water contamination needs to be addressed with careful planning, good
engineering solutions and tight regulation, but all of these will lead to increased costs.
The resources of water needed are of concern, particularly in areas where water restrictions already take
place, and alternative solution may be needed such as using sea water for near coastal Fracking sites.
Transport movements may require additional infrastructure improvement further adding to the costs.
The output from a single well is relatively small, and once drilling has taken place in an area there will be
pressure to increase the number of wells to benefit from the already installed infrastructure in the area.
Fracking will, in some situations, improve the move towards a low carbon energy supply in countries
dominated by electricity generation by coal such as China, India, and Poland. In the UK, however, the
reverse could happen if attention is diverted from low carbon energy sources. The impact on the landscape
could be much more significant than other forms of energy such as wind, and tight regulation will be needed
to ensure this does not happen.
The UK needs a diverse energy mix which will include “Fracked” Gas in the longer term alongside
expansion of renewables in the short term and nuclear in the medium term. Gas generation from “Fracking”
is a technically sound solution, but it is very questionable whether it will be a cheaper solution. By itself it
will only definitely help address one part of the energy trilema – the question of energy security. It is
questionable whether “Fracked” Gas will assist in either the affordability or climate change parts.
12. References
Bloomberg (2013) U.K. Shale Will Fail to Unleash U.S.-Style Price Drop