AAPG Bulletin, v. 86, no. 11 (November 2002), pp. 1921–1938 1921 Fractured shale-gas systems John B. Curtis ABSTRACT The first commercial United States natural gas production (1821) came from an organic-rich Devonian shale in the Appalachian ba- sin. Understanding the geological and geochemical nature of organic shale formations and improving their gas producibility have sub- sequently been the challenge of millions of dollars worth of research since the 1970s. Shale-gas systems essentially are continuous-type biogenic (predominant), thermogenic, or combined biogenic-ther- mogenic gas accumulations characterized by widespread gas satu- ration, subtle trapping mechanisms, seals of variable lithology, and relatively short hydrocarbon migration distances. Shale gas may be stored as free gas in natural fractures and intergranular porosity, as gas sorbed onto kerogen and clay-particle surfaces, or as gas dis- solved in kerogen and bitumen. Five United States shale formations that presently produce gas commercially exhibit an unexpectedly wide variation in the values of five key parameters: thermal maturity (expressed as vitrinite re- flectance), sorbed-gas fraction, reservoir thickness, total organic car- bon content, and volume of gas in place. The degree of natural fracture development in an otherwise low-matrix-permeability shale reservoir is a controlling factor in gas producibility. To date, unstimulated commercial production has been achievable in only a small proportion of shale wells, those that intercept natural fracture networks. In most other cases, a successful shale-gas well requires hydraulic stimulation. Together, the Devonian Antrim Shale of the Michigan basin and Devonian Ohio Shale of the Appalachian basin accounted for about 84% of the total 380 bcf of shale gas produced in 1999. However, annual gas production is steadily increasing from three other major organic shale formations that subsequently have been explored and developed: the Devonian New Albany Shale in the Illinois basin, the Mississippian Barnett Shale in the Fort Worth basin, and the Cretaceous Lewis Shale in the San Juan basin. In the basins for which estimates have been made, shale-gas resources are substantial, with in-place volumes of 497–783 tcf. The estimated technically recoverable resource (exclusive of the Lewis Shale) ranges from 31 to 76 tcf. In both cases, the Ohio Shale ac- counts for the largest share. Copyright 2002. The American Association of Petroleum Geologists. All rights reserved. Manuscript received June 21, 2001; revised manuscript received June 6, 2002; final acceptance June 6, 2002. AUTHOR John B. Curtis Department of Geology and Geological Engineering, Colorado School of Mines, Golden, Colorado 80401; [email protected]John B. Curtis is associate professor and director, Petroleum Exploration and Production Center/Potential Gas Agency at the Colorado School of Mines. He is an associate editor for the AAPG Bulletin and The Mountain Geologist. As director of the Potential Gas Agency, he works with a team of 145 geologists, geophysicists, and petroleum engineers in their biennial assessment of remaining United States natural gas resources. ACKNOWLEDGEMENTS It has been my pleasure and a continuing education for the last 25 years to work with many excellent scientists and engineers on the challenges presented by shale-gas systems. United States shale-gas production and future world opportunities certainly would be limited without the insights gained from the Eastern Gas Shales Project of the U.S. Department of Energy and from research sponsored by the Gas Research Institute/Gas Technology Insti- tute. I particularly acknowledge the enthusi- asm and vision of the late Charles Branden- burg and of Charles Komar. Thoughtful reviews by Kent Bowker, Robert Cluff, and Da- vid Hill significantly improved this manuscript. I also thank Daniel Jarvie for his review of my Barnett Shale discussion. Ira Pasternack pro- vided helpful discussions concerning the An- trim Shale. The technical editing and graphic skills of Steve Schwochow are greatly appreci- ated. Finally, I thank Ben Law for his energy and patience in completion of this project.
Transcript
AAPG Bulletin, v. 86, no. 11 (November 2002), pp. 1921–1938 1921
Fractured shale-gas systemsJohn B. Curtis
ABSTRACT
The first commercial United States natural gas production (1821)came from an organic-rich Devonian shale in the Appalachian ba-sin. Understanding the geological and geochemical nature of organicshale formations and improving their gas producibility have sub-sequently been the challenge of millions of dollars worth of researchsince the 1970s. Shale-gas systems essentially are continuous-typebiogenic (predominant), thermogenic, or combined biogenic-ther-mogenic gas accumulations characterized by widespread gas satu-ration, subtle trapping mechanisms, seals of variable lithology, andrelatively short hydrocarbon migration distances. Shale gas may bestored as free gas in natural fractures and intergranular porosity, asgas sorbed onto kerogen and clay-particle surfaces, or as gas dis-solved in kerogen and bitumen.
Five United States shale formations that presently produce gascommercially exhibit an unexpectedly wide variation in the valuesof five key parameters: thermal maturity (expressed as vitrinite re-flectance), sorbed-gas fraction, reservoir thickness, total organic car-bon content, and volume of gas in place. The degree of naturalfracture development in an otherwise low-matrix-permeabilityshale reservoir is a controlling factor in gas producibility. To date,unstimulated commercial production has been achievable in only asmall proportion of shale wells, those that intercept natural fracturenetworks. In most other cases, a successful shale-gas well requireshydraulic stimulation. Together, the Devonian Antrim Shale of theMichigan basin and Devonian Ohio Shale of the Appalachian basinaccounted for about 84% of the total 380 bcf of shale gas producedin 1999. However, annual gas production is steadily increasing fromthree other major organic shale formations that subsequently havebeen explored and developed: the Devonian New Albany Shale inthe Illinois basin, the Mississippian Barnett Shale in the Fort Worthbasin, and the Cretaceous Lewis Shale in the San Juan basin.
In the basins for which estimates have been made, shale-gasresources are substantial, with in-place volumes of 497–783 tcf. Theestimated technically recoverable resource (exclusive of the LewisShale) ranges from 31 to 76 tcf. In both cases, the Ohio Shale ac-counts for the largest share.
Copyright �2002. The American Association of Petroleum Geologists. All rights reserved.
Manuscript received June 21, 2001; revised manuscript received June 6, 2002; final acceptance June 6,2002.
AUTHOR
John B. Curtis � Department of Geologyand Geological Engineering, Colorado Schoolof Mines, Golden, Colorado 80401;[email protected]
John B. Curtis is associate professor anddirector, Petroleum Exploration andProduction Center/Potential Gas Agency at theColorado School of Mines. He is an associateeditor for the AAPG Bulletin and TheMountain Geologist. As director of thePotential Gas Agency, he works with a teamof 145 geologists, geophysicists, andpetroleum engineers in their biennialassessment of remaining United States naturalgas resources.
ACKNOWLEDGEMENTS
It has been my pleasure and a continuingeducation for the last 25 years to work withmany excellent scientists and engineers on thechallenges presented by shale-gas systems.United States shale-gas production and futureworld opportunities certainly would be limitedwithout the insights gained from the EasternGas Shales Project of the U.S. Department ofEnergy and from research sponsored by theGas Research Institute/Gas Technology Insti-tute. I particularly acknowledge the enthusi-asm and vision of the late Charles Branden-burg and of Charles Komar. Thoughtfulreviews by Kent Bowker, Robert Cluff, and Da-vid Hill significantly improved this manuscript.I also thank Daniel Jarvie for his review of myBarnett Shale discussion. Ira Pasternack pro-vided helpful discussions concerning the An-trim Shale. The technical editing and graphicskills of Steve Schwochow are greatly appreci-ated. Finally, I thank Ben Law for his energyand patience in completion of this project.
1922 Fractured Shale-Gas Systems
ProvedReserves
~4 tcf
EconomicRecoverable 31-76 tcf
Undiscovered 131.3 tcf
Produced~4 tcf
Increasing development costs,
technology needs, and uncertainty
215 tcf Total ProducibleGas Shale Resource Base
Figure 2. Resource pyramid depicting total shale-gas resourcebase (after Hill and Nelson, 2000, reprinted with permissionfrom Hart Publications).
Monument at Fredonia, New York“The Site of the First Gas Well in the United States.
Lighted in Honor of General Lafayette’s Visit,June 4, 1825”
AntrimShale
OhioShale
New AlbanyShale
BarnettShale
LewisShale
MichiganBasin
IllinoisBasin
Appalachian Basin
San JuanBasin
Fort WorthBasin
Lake Erie
L. Ontario
Lake Superior
Lake Huron
La
keM
ichi
gan
Established gas-productive area
Fredonia, New York
Figure 1. Geographic distribution of five shale-gas systems in the lower 48 United States (modified from Hill and Nelson, 2000).
INTRODUCTION AND DEFINIT ION OF THESYSTEM
Gas-productive shale formations occur in Paleozoicand Mesozoic rocks in the continental United States(Figure 1). Typical of most unconventional or contin-uous-type accumulations (U.S. Geological Survey Na-tional Oil and Gas Resource Assessment Team, 1995;Curtis, 2001), these systems represent a potentiallylarge, technically recoverable gas resource base, withsmaller estimates for past production and proved re-serves (Figure 2). The concept of the resource pyramiddepicted in Figure 2 was first used in the late 1970s foranalyzing natural gas accumulations in low-permeabil-ity reservoirs (Sumrow, 2001). If exploration and de-velopment companies are to access the gas resourcestoward the base of the pyramid, some combination ofincrementally higher gas prices, lower operating costs,and more advanced technology will be required tomake production economical. Production of gas deeperwithin the resource pyramid is required to fully realizethe potential of this type of petroleum system.
More than 28,000 shale-gas wells have been drilledin the United States since the early 1800s (Hill andNelson, 2000). That no gas-productive shales presentlyare known outside the United States (T. Ahlbrandt,
2001, personal communication) may be attributablemore to uneconomical flow rates and well payback pe-riods than to the absence of potentially productiveshale-gas systems.
These fine-grained, clay- and organic carbon–richrocks are both gas source and reservoir rock compo-
Curtis 1923
nents of the petroleum system (Martini et al., 1998).Gas is of thermogenic or biogenic origin and stored assorbed hydrocarbons, as free gas in fracture and inter-granular porosity, and as gas dissolved in kerogen andbitumen (Schettler and Parmely, 1990; Martini et al.,1998). Trapping mechanisms are typically subtle, withgas saturations covering large geographic areas (Roen,1993). Postulated seal-rock components are variable,ranging from bentonites (San Juan basin) to shale (Ap-palachian and Fort Worth basins) to glacial till (Michi-gan basin) to shale/carbonate facies changes (Illinoisbasin) (Curtis and Faure, 1997; Hill and Nelson, 2000;Walter et al., 2000).
Thermogenic and biogenic gas components arepresent in shale-gas reservoirs; however, biogenic gasappears to predominate in the Michigan and Illinoisbasin plays (Schoell, 1980; Martini et al., 1998; Walteret al., 2000; Shurr, 2002).
Economical production typically, if not univer-sally, requires enhancement of the inherently low ma-trix permeability (�0.001 d) of gas shales (Hill andNelson, 2000). Well completion practices employ hy-draulic fracturing technology to access the natural frac-ture system and to create new fractures. Less than 10%of shale-gas wells are completed without some form ofreservoir stimulation. Early attempts to fracture theseformations employed nitroglycerin, propellants, and avariety of hydraulic fracturing techniques (Hill andNelson, 2000).
This article reviews the five principal shale-gas sys-tems in the United States (Figure 1), with particularemphasis on the Antrim and Ohio shales as end mem-bers of the range of known shale-gas systems: (1) An-trim Shale, (2) Ohio Shale, (3) New Albany Shale, (4)Barnett Shale, and (5) Lewis Shale.
HISTORICAL PERSPECTIVE
The earliest references to black (organic-rich) shaleunits of the Appalachian basin are descriptions byFrench explorers and missionaries from the period1627–1669. They noted occurrences of oil and gas nowbelieved to be sourced by Devonian shales in westernNew York (Roen, 1993). The year 1821 generally isregarded as the start of the commercial natural gas in-dustry in the young United States (Peebles, 1980). Thefirst well was completed in the Devonian DunkirkShale in Chautauqua County, New York. The gas wasused to illuminate the town of Fredonia (Figure 1)(Roen, 1993). This discovery anticipated the more fa-
mous Drake oil well at Oil Creek, Pennsylvania, bymore than 35 yr. Peebles (1980, p. 51–52) docu-mented this historic event as follows:
The accidental ignition by small boys of a seepageof natural gas at the nearby Canadaway Creekbrought home to the local townspeople the poten-tial value of this “burning spring.” They drilled awell 27 feet deep and piped the gas through smallhollowed-out logs to several nearby houses forlighting. These primitive log pipes were later re-placed by a three-quarter inch lead pipe made byWilliam Hart, the local gunsmith. He ran the gassome 25 feet into an inverted water-filled vat,called a “gasometer” and from there a line to AbelHouse, one of the local inns, where the gas wasused for illumination. In December 1825 the Fre-donia Censor reported: “We witnessed last eveningburning of 66 beautiful gas lights and 150 lightscould be supplied by this gasometer. There is nowsufficient gas to supply another one [gasometer] aslarge.” Fredonia’s gas supply was acclaimed as: “un-paralleled on the face of the globe.” This first prac-tical use of natural gas in 1821 was only five yearsafter the birth of the manufactured gas industry inthe United States, which most commentatorsagree was marked by the founding of the Gas LightCompany of Baltimore in 1816.
Shale-gas development spread westward along thesouthern shore of Lake Erie and reached northeasternOhio in the 1870s. Gas was discovered in Devonianand Mississippian shales in the western Kentucky partof the Illinois basin in 1863. By the 1920s, drilling forshale gas had progressed into West Virginia, Kentucky,and Indiana. By 1926, the Devonian shale gas fields ofeastern Kentucky and West Virginia comprised thelargest known gas occurrences in the world (Roen,1993).
The U.S. Department of Energy’s Eastern GasShales Project was initiated in 1976 as a series of geo-logical, geochemical, and petroleum engineering stud-ies that emphasized stimulation treatment develop-ment. The Gas Research Institute (GRI; now the GasTechnology Institute [GTI]) built on this workthrough the 1980s and early 1990s to more completelyevaluate the gas potential and to enhance productionfrom Devonian and Mississippian shale formations ofthe United States.
The Devonian Antrim Shale of the Michigan basin,the most active United States natural gas play in the
1924 Fractured Shale-Gas Systems
Late Devonian paleoequator
Northwest Africa
NorthAmerican
Craton
Williston Basin
MichiganBasin
IllinoisBasin
AnadarkoBasin
Ea
st e
rn
Inte
rio
rS
ea
wa
y
Catskil
l Delta
Figure 4. Reconstruction of Late Devonian paleogeography(modified from Walter et al., 1995).
Figure 3. United States shale-gas production, in bcf, 1979–1999, for the five shale-gas sys-tems under consideration (afterHill and Nelson, 2000, reprintedwith permission from HartPublications).
0
50
100
150
200
250
300
350
400
999897969594939291908988878685848382818079
Gas Production (bcf)
LewisBarnettNew AlbanyAntrimOhio
Year
1990s, became commercially productive in the 1980s,as did the Mississippian Barnett Shale of the FortWorth basin and the Cretaceous Lewis Shale of the SanJuan basin (Figure 1) (Hill and Nelson, 2000). Shale-gas production has increased more than sevenfold be-tween 1979 and 1999 (Figure 3). In 1998, shale-gasreservoirs supplied 1.6% of total United States dry gasproduction and contained 2.3% of proved natural gasreserves (Energy Information Administration, 1999).
GEOLOGICAL FRAMEWORK
Antrim Shale of the Michigan Basin
The Antrim Shale is part of an extensive, organic-richshale depositional system that covered large areas ofthe ancestral North American continent in the Middle–Late Devonian (Figure 4). The intracratonic Michiganbasin was one of several depocenters situated along theEastern Interior Seaway. The basin has been filled withmore than 17,000 ft (5182 m) of sediment, 900 ft (274m) of which comprise the Antrim Shale and associatedDevonian–Mississippian rocks. The base of the Antrim,near the center of the modern structural basin, is ap-proximately 2400 ft (732 m) below sea level (Mat-thews, 1993).
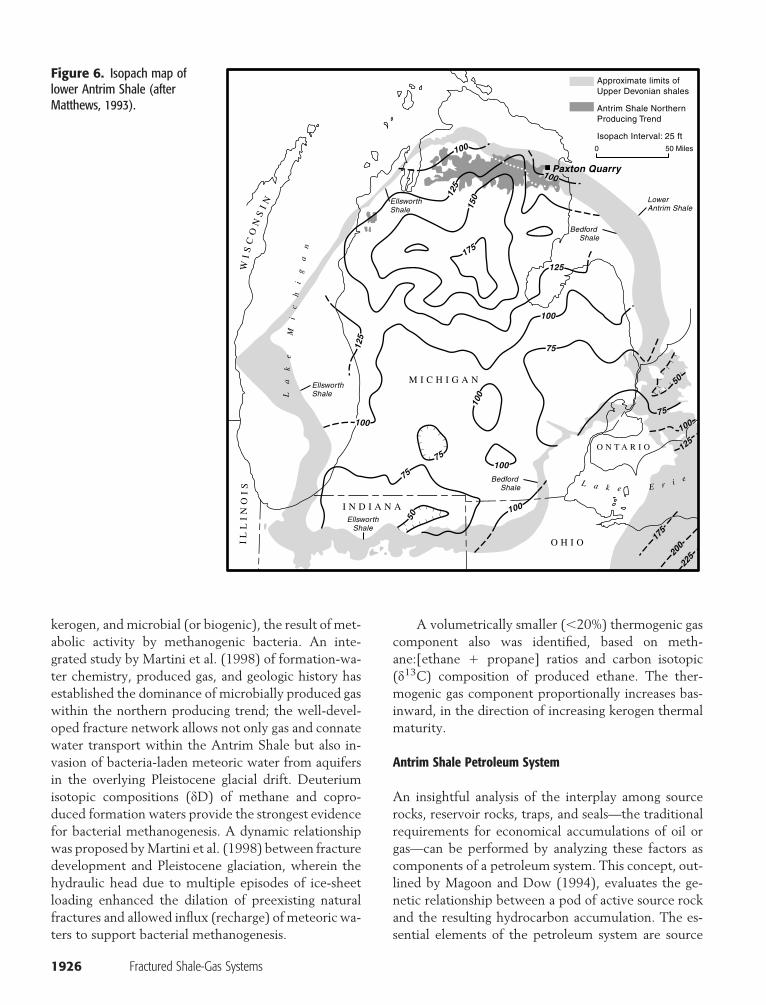
Antrim stratigraphy is relatively straightforward(Figure 5). Wells are typically completed in the La-chine and Norwood members of the lower Antrim,whose aggregate thickness approaches 160 ft (49 m)
(Figure 6). Total organic carbon (TOC) content of theLachine and Norwood ranges from 0.5 to 24% byweight. These black shales are silica rich (20–41% mi-crocrystalline quartz and wind-blown silt) and containabundant dolomite and limestone concretions and car-bonate, sulfide, and sulfate cements. The remaininglower Antrim unit, the Paxton, is a mixture of limemudstone and gray shale lithologies (Martini et al.,1998) containing 0.3–8% TOC and 7–30% silica. Cor-relation of the fossil alga Foerstia has established timeequivalence among the upper part of the Antrim Shale,the Huron Member of the Ohio Shale of the Appala-chian basin (Figure 7), and the Clegg Creek Member
Curtis 1925
0
10
20
30
40
50
60
70
80
90
100
110
Ground Elev.708 ft est.GR
UpperMember
LachineMember
PaxtonMember
NorwoodMember
Squaw BayLimestone
Core Gamma LogA
ntr
im S
ha
le
Figure 5. Antrim Shale gamma-ray log from the PaxtonQuarry, Alpena County, Michigan (Sec. 30, T31N, R7E, MichiganMeridian). Figure modified from Matthews (1993) and Deckeret al. (1992).
of the New Albany Shale of the Illinois basin (Roen,1993).
The large-scale structure of the lower Antrim isrelatively simple (Figure 8). Trap and seal componentsof the Antrim Shale petroleum system are subtle, asdiscussed in a following section.
Table 1 summarizes key geological, geochemical,and engineering parameters for the Antrim and thefour other United States gas shale systems under dis-cussion. The wide range of these parameters is typicalof unconventional reservoirs. Specialized techniquesfor laboratory and field measurement of required ex-ploration and production data and practical formationevaluation techniques for low-porosity, ultralow-per-meability reservoirs were developed by the U.S. De-partment of Energy and Gas Technology Institute (e.g.,Luffel et al., 1992; Lancaster et al., 1996; Frantz et al.,
1999). Figure 9 depicts the range of values for five keyparameters: (1) vitrinite reflectance (as % Ro), a mea-sure of thermal maturity of the kerogen; (2) fractionof gas present as adsorbed gas; (3) reservoir thickness;(4) TOC; and (5) gas-in-place resource per acre-footof reservoir. These five parameters are normalized to amaximum value of 5 and a minimum of 0 for a givenbasin. Inspection of Figure 9 indicates that parameterswidely different from those of the Antrim Shale stillpermit commercial gas production from other frac-tured, organic-rich shales. Note that only the Antrimand New Albany shales produce significant amounts ofwater. This coproduced water is similar to that typicalof coalbed methane production (Ayers, 2002), exceptthat no significant reservoir dewatering is requiredprior to initiation of shale-gas production.
Antrim Shale gas production may have slightly lev-eled off, at least for the short term, in 1998 at 195 bcf(Hill and Nelson, 2000). In 1999, when 6500 wellswere on production, 190 bcf were produced, approx-imately 2% less than the previous year. Most producinggas wells are located in the northern third of the basin,termed the northern producing trend (Figures 1, 6).The average well there produces 116 mcf/day with 30bbl/day of water.
Two dominant sets of natural fractures have beenidentified in the northern producing trend, one ori-ented toward the northwest and the other to the north-east and both exhibiting subvertical to vertical incli-nations. These fractures, generally uncemented orlined by thin coatings of calcite (Holst and Foote, 1981;Decker et al., 1992; Martini et al., 1998), have beenmapped for several meters in the vertical direction andtens of meters horizontally in surface exposures. At-tempts to establish production in the Antrim outsidethis trend have commonly encountered organic, gas-rich shale but minimal natural fracturing and, hence,permeability (Hill and Nelson, 2000).
No discrete fields are recognized for Antrim Shaleproduction. However, as with other so-called contin-uous-type natural gas accumulations, shale-gas satura-tions exist over a relatively wide area, where commer-cial production is possible by stimulation enhancementof existing natural fractures (Milici, 1993; Hill and Nel-son, 2000). Anecdotal evidence from deeper AntrimShale wells drilled in the early 1990s south and east ofthe northern producing trend (Figure 6) encounteredmethane saturations but only limited permeability,which precluded production.
Antrim Shale gas appears to be of dual origin,thermogenic, resulting from thermal maturation of
kerogen, and microbial (or biogenic), the result of met-abolic activity by methanogenic bacteria. An inte-grated study by Martini et al. (1998) of formation-wa-ter chemistry, produced gas, and geologic history hasestablished the dominance of microbially produced gaswithin the northern producing trend; the well-devel-oped fracture network allows not only gas and connatewater transport within the Antrim Shale but also in-vasion of bacteria-laden meteoric water from aquifersin the overlying Pleistocene glacial drift. Deuteriumisotopic compositions (dD) of methane and copro-duced formation waters provide the strongest evidencefor bacterial methanogenesis. A dynamic relationshipwas proposed by Martini et al. (1998) between fracturedevelopment and Pleistocene glaciation, wherein thehydraulic head due to multiple episodes of ice-sheetloading enhanced the dilation of preexisting naturalfractures and allowed influx (recharge) of meteoric wa-ters to support bacterial methanogenesis.
A volumetrically smaller (�20%) thermogenic gascomponent also was identified, based on meth-ane:[ethane � propane] ratios and carbon isotopic(d13C) composition of produced ethane. The ther-mogenic gas component proportionally increases bas-inward, in the direction of increasing kerogen thermalmaturity.
Antrim Shale Petroleum System
An insightful analysis of the interplay among sourcerocks, reservoir rocks, traps, and seals—the traditionalrequirements for economical accumulations of oil orgas—can be performed by analyzing these factors ascomponents of a petroleum system. This concept, out-lined by Magoon and Dow (1994), evaluates the ge-netic relationship between a pod of active source rockand the resulting hydrocarbon accumulation. The es-sential elements of the petroleum system are source
Curtis 1927
MIS
S.
DE
VO
NIA
N
MID
DL
EU
PP
ER
FA
ME
NN
IAN
FR
AS
NIA
NG
IVE
-T
IAN
EIF
E-
LIA
N
Sunbury Shale
Berea Sandstone
Lower
Angola Shale
Rhinestreet Shale
Cashaqua Shale
Middlesex Shale
Middle
Upper
Upper Devonianundifferentiated
Java Formation
Genesee Group
Hamilton Group
Onondaga Limestone
Oh
io S
ha
leS
ony
ea
Gro
up
We
st F
alls
Gro
up
Hu
ron
Me
mb
er
Ch
agr
in M
em
be
r
W E
Figure 7. Middle Devonian–Lower Mississippian strata in thewestern part of the Appalachian basin (modified from Moodyet al., 1987).
rock, reservoir rock, seal rock, and overburden rock.Processes that must be considered include trap for-mation and generation-migration-accumulation of hy-drocarbons, all appropriately placed in time and space.Central to the application of this concept is the deter-mination of the critical moment, that is, the time thatbest represents hydrocarbon generation, migration,and accumulation.
In common with other unconventional petro-leum systems discussed in this volume, fracturedshale-gas systems do not possess all the individualcomponents defined by Magoon and Dow (1994).
Organic-rich shale formations such as the Lachineand Norwood members of the lower Antrim Shale,for example, constitute both source and reservoirrock. Fracturing, which results in the creation or ex-pansion of reservoir capacity and permeability, mayarise from pressures generated either internally by thethermal maturation of kerogen to bitumen, or exter-nally by tectonic forces, or by both. Furthermore,these events may occur at decidedly different times.In any event, hydrocarbon migration distances withinthe shale are relatively short. Conventional reservoirssituated upsection or downsection of the shale alsomay be concurrently charged with hydrocarbons gen-erated by the same shale source rocks (Cole et al.,1987).
Figure 10 is an events chart (Magoon and Dow,1994) that depicts the timing of critical events in thehistory of the lower Antrim Shale. Although hydro-carbon generation probably has occurred at varioustimes in the geologic past, the gas currently producedlikely is only several tens of thousands of years old(Martini et al., 1998). The thermogenic gas chargemay have leaked from the shale reservoir throughgeologic time. The association of this more geologi-cally recent gas generation with Pleistocene glaciationlogically extends both to trap formation by the over-lying till and to fracturing induced by ice-sheet load-ing/unloading (Martini et al., 1998; Hill and Nelson,2000). Petroleum system preservation time, whichcommences after hydrocarbon generation, migration,and accumulation (Magoon and Dow, 1994), is,therefore, nearly zero, inasmuch as the system maystill be generating microbial gas.
Ohio Shale
The Ohio Shale of the Appalachian basin (Figure 1)differs in many respects from the Antrim Shale petro-leum system. As discussed in a preceding section, thispetroleum system provided the first commercial gasproduction in the United States.
Figure 7 is a stratigraphic section of the Devonianshale formations in the gas-productive parts of centraland western West Virginia. Locally, the stratigraphy isconsiderably more complex than shown here as a resultof variations in depositional setting across the basin(Kepferle, 1993; Roen, 1993). The Middle and UpperDevonian shale formations underlie approximately128,000 mi2 (331,520 km2) and crop out around therim of the basin. Subsurface formation thicknesses ex-ceed 5000 ft (1524 m), and organic-rich black shales
1928 Fractured Shale-Gas Systems
Figure 8. Structure map con-toured on the base of the lowerAntrim Shale (modified fromMatthews, 1993).
500SL
-500
500
SL
-500
-1000
-1000
-2000
-1500
-1500
0 50 Miles
I N D I A N A
M I C H I G A N
O N T A R I O
IL
LI
NO
IS
O H I O
WI
SC
ON
SI
N
L a k e E r i e
La
ke
Mi
ch
ig
an
La
ke
Hu
ro
n
Approximate limits ofUpper Devonian shales
Contour Interval: 500 ft
LowerAntrim Shale
Bedford Shale
Bedford Shale
EllsworthShale
EllsworthShale
EllsworthShale
exceed 500 ft (152 m) in net thickness (Figure 11)(deWitt et al., 1993).
The enormous wedge of Paleozoic sedimentaryrocks in the Appalachian basin reflects gross cyclicaldeposition of organic-rich rocks (mainly carbonaceousshales), other clastics (sandstones, siltstones, and silty,organic-poor shales), and carbonates (Roen, 1993,1984). These rocks were deposited in an asymmetrical,eastward-deepening foreland basin that evolved withthe transition of the Laurentian paleocontinent from apassive-margin to convergent-margin setting. At leastthree major Paleozoic depositional cycles occurred,each consisting of a basal carbonaceous shale overlainby clastics and capped by carbonates. The Devonianblack shale formations are part of the second youngestcycle. The shale formations themselves can be furthersubdivided into five cycles of alternating carbonaceousshales and coarser grained clastics (Ettensohn, 1985).These five shale cycles developed in response to the
dynamics of the Acadian orogeny and westward pro-gradation of the Catskill delta (Figure 4).
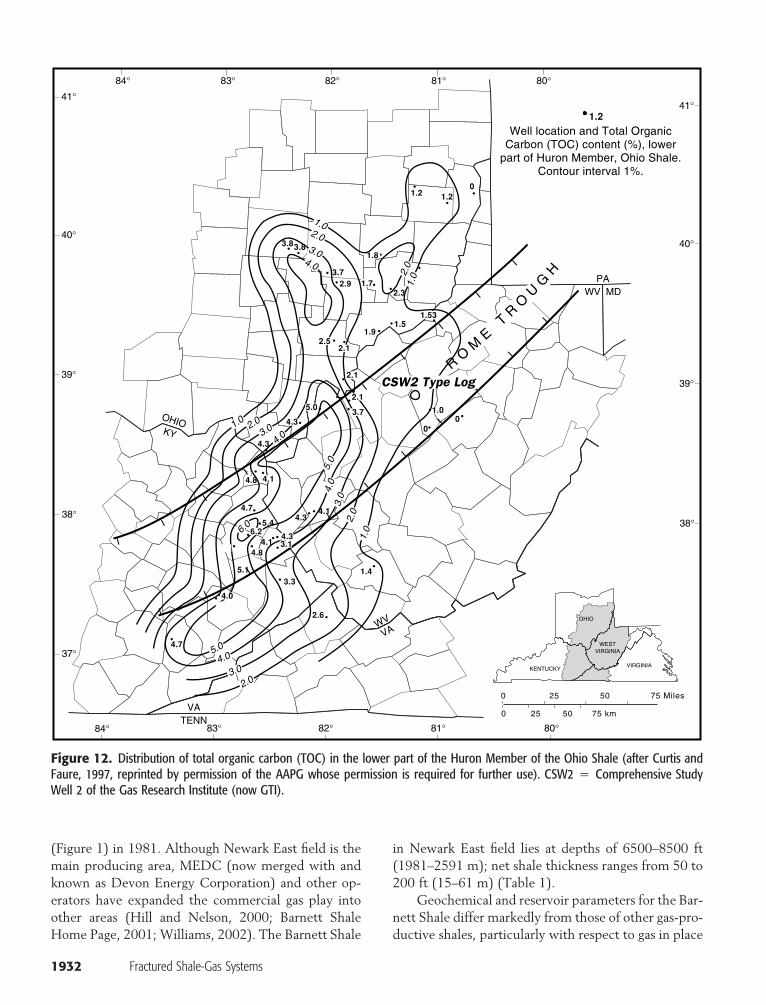
The Rome trough (Figure 12) is a complex grabensystem created during Late Proterozoic passive conti-nental-margin rifting that formed the Iapetus Ocean.During the subsequent Taconic, Acadian, and Allegha-nian orogenies, the faults that define the grabens werereactivated (Coogan, 1988; Shumaker, 1993), formingtopographic depressions on the floor of the shallow in-land sea in the Late Devonian. Curtis and Faure (1997,1999) postulated that fault-bounded subbasins associ-ated with these depressions controlled the preservationof alga-derived organic matter in the lower HuronMember of the Ohio Shale and in the RhinestreetShale Member of the West Falls Formation (Figure 7).These subbasins may have been anoxic because theirpoorly circulating waters limited oxygen recharge.Preservation of organic matter also was enhanced byperiodic blooms of Tasmanites and similar algae in the
Curtis 1929
Table 1. Geological, Geochemical, and Reservoir Parameters for Five Shale-Gas Systems*
*Modified from Hill and Nelson (2000); data cited by those authors were compiled from Gas Technology Institute/Gas Research Institute research reports and operatorsurveys.
waters above the local basins. These algal blooms cre-ated such large concentrations of organic matter thatthey exhausted the supply of molecular oxygen,thereby preserving the algal material, even in sedi-ments beyond the subbasin boundaries.
Figure 12 depicts the distribution of kerogen, asTOC, within the lower Huron Member, the mainsource bed of the Ohio Shale. Essentially all the organicmatter contained in the lower Huron is thermally ma-ture for hydrocarbon generation, based on vitrinite re-flectance studies. The organic matter is predominantlytype II (liquid- and gas-prone) kerogen (Curtis andFaure, 1997, 1999). The area enclosed by the TOCcontours in Figure 12 encompasses the majority of thegas-productive areas in West Virginia, eastern Ken-tucky, and southern Ohio (Gas Research Institute,2000). In the Calhoun County, West Virginia, area,the lower section of the lower Huron Member is gasproductive, coinciding with maximum gamma-ray logreadings, as illustrated in Figure 13, a type log from a
GRI (now GTI) study well. Overall, the section con-tains 1% TOC; however, up to 2% TOC occurs in thegas-productive lower section.
The proportion of black shale, TOC content, andgas productivity increases to the west (Figure 12) tomaxima in the Big Sandy field complex of Kentucky,near the West Virginia border. This also approximatelycoincides with the maximum measured TOC and re-sulting kerogen content. The Big Sandy field complex,which has produced shale gas since 1921 (Hunter andYoung, 1953), historically is the greatest contributorof shale-gas production in the Appalachian basin.
Hunter and Young’s (1953) study provides insightinto the Ohio Shale petroleum system. Of 3400 wellsstudied, 6% were completed without stimulation.These nonstimulated wells, which presumably inter-cept natural fracture networks, had an average open-flow rate of 1055 mcf/day. The remaining wells didnot flow appreciably after drilling, averaging only 61mcf/day. The latter were subsequently stimulated by
1930 Fractured Shale-Gas Systems
5
4
3
2
1
GIPmcf/acre-ft
TOC % Thickness
AbsorbedGas %
% RoLewis Shale
5
4
3
2
1
GIPmcf/acre-ft
TOC % Thickness
AbsorbedGas %
% RoAntrim Shale
5
4
3
2
1
GIPmcf/acre-ft
TOC % Thickness
AbsorbedGas %
% RoBarnett Shale
5
4
3
2
1
GIPmcf/acre-ft
TOC % Thickness
AbsorbedGas %
% RoOhio Shale
5
4
3
2
1
GIPmcf/acre-ft
TOC % Thickness
AbsorbedGas %
% RoNew Albany Shale
Figure 9. Comparison of gas-shale geological and geochem-ical properties (after Hill and Nelson, 2000, reprinted with per-mission from Hart Publications). GIP � gas in place.
the early oilfield technique of shooting, whereby 3000–7000 lb of nitroglycerine typically were detonateddownhole. After stimulation, the wells averaged about285 mcf/day, a greater than fourfold improvement.Hunter and Young (1953) concluded that shooting hadenhanced fracture porosity and permeability, allowingcommercial volumes of gas to be produced. Currentstimulation practices, although not as visually impres-sive as shooting, are more effective and certainly lessdamaging to the reservoir. Today wells commonly arefracture stimulated with liquid nitrogen foam and asand proppant (Milici, 1993).
Prior to 1994, the Ohio Shale produced the ma-jority of United States shale gas, until the drilling boomin Michigan elevated the Antrim Shale to the top po-sition (Figure 3).
New Albany Shale
The New Albany Shale of the Illinois basin (Figures 1,4) is correlative in part to the Ohio Shale and AntrimShale (Roen, 1993). New Albany Shale units range inthickness from 100 to 400 ft (30–122 m) and lie atdepths of 600–4900 ft (182–1494 m) (Hassenmuellerand Comer, 1994). Similar to the other black shalesunder consideration, gas in the New Albany Shale isstored both as free gas in fractures and matrix porosityand as gas adsorbed onto kerogen and clay-particle sur-faces (Walter et al., 2000). Studies have shown thatcommercial production may be associated with frac-turing related to faults, folds, and draping of the shaleover carbonate buildups (Hassenmueller and Zup-pann, 1999).
Most natural gas production from the New Albanycomes from approximately 60 fields in northwesternKentucky and adjacent southern Indiana. However,past and current production is substantially less thanthat from either the Antrim Shale or Ohio Shale (Fig-ure 3). Exploration and development of the New Al-bany Shale was spurred by the spectacular develop-ment of the Antrim Shale play in Michigan, but resultshave not been as favorable (Hill and Nelson, 2000).Production of New Albany Shale gas, which is consid-ered to be biogenic, is accompanied by large volumesof formation water (Walter et al., 2000). The presenceof water would seem to indicate some level of forma-tion permeability. The mechanisms that control gas oc-currence and productivity are not as well understoodas those for the Antrim and Ohio shales (Hill and Nel-son, 2000) but are the subject of ongoing studies byconsortia of basin operators.
Curtis 1931
PALEOZOIC MESOZOIC CENO.
TIME (Ma)
C O S D M P P T J K E MR
500 400 300 200 100 0
PETROLEUMSYSTEM EVENT
Source rock
Reservoir rock
Seal rock
Overburden
Trap formation
Generation-migration-accumulation
Preservation time
Critical moment(Microbial gas)
Deposition
Thermogenic gas
Fracturing due to HCmaturation & regional
loading/unloading? ?
?
? ?
Figure 10. Antrim Shaleevents chart depicting the criti-cal moment for Antrim Shalegas generation.
|
| |
|
|
| |
|
||
|
||
|
|
||
|||
|
|
|
||
|
|
|
|
100
100
100
100
100
200
200
200
200
200
200
200
300
300
300
300
300
400
400
400
500
500
400
80°
82°84°
86°38°
40°
42°
44°78° 76° 74°
O H I O
K E N T U C K Y V I R G I N I A
N E W Y O R K
P E N N S Y L V A N I A
M A R Y L A N D
W E S T V I R G I N I A
L a k e O n t a r i o
L a k e E r i e
0 100 200 Miles
Isopach showing thickness, in feet; hachures indicate direction of thinning. Contour interval 100 ft. Compiled from isopach maps of net thickness of radioactive black shale of the Middle and Upper Devonian series.
200
| |
|||
100
Figure 11. Total net thicknessof radioactive black shale inMiddle–Upper Devonian rocks(after deWitt et al. 1993).
A GTI-sponsored consortium recently completedan investigation into natural fracturing, water produc-tion, well completion practices, and requisite econom-ics as factors in New Albany Shale gas production (Hill,2001). This effort included work by Walter et al.(2000) on possible hydrochemical controls on gas pro-duction. Although the potential of the New AlbanyShale has not yet been realized, exploration and drilling
have accelerated with recent increases in wellhead gasprices (Hill, 2001).
Barnett Shale
Mitchell Energy and Development Corporation(MEDC) initiated commercial gas production from theMississippian Barnett Shale in the Fort Worth basin
1932 Fractured Shale-Gas Systems
RO
ME
TR
O
UG
H
5.0
4.0
6.0
4.0
3.0
3.0
2.0
2.0
1.0
1.0
5.04.0
3.0
2.0
4.0
3.0
2.0
2.0
1.0
1.0
1.2
1.8
2.93.7
3.83.8
1.72.3
1.531.5
1.92.5
2.1
2.1
5.0
4.3
4.3
4.8 4.1
4.3
4.34.1
4.7
5.44.1
1.4
2.6
4.7
4.8
4.8
4.0
3.3
6.2
3.1
5.1
5.1
2.1
3.7 1.0
00
1.20
PAWV MD
OHIOKY
VATENN
WVVA
1.2
Well location and Total OrganicCarbon (TOC) content (%), lower
part of Huron Member, Ohio Shale.Contour interval 1%.
37°
38°
39°
40°
41°80°81°82°83°84°
38°
39°
40°
41°
80°81°82°83°84°
OHIO
KENTUCKYVIRGINIA
WESTVIRGINIA
7
0 25 50 75 Miles
0 25 50 75 km
CSW2 Type Log
Figure 12. Distribution of total organic carbon (TOC) in the lower part of the Huron Member of the Ohio Shale (after Curtis andFaure, 1997, reprinted by permission of the AAPG whose permission is required for further use). CSW2 � Comprehensive StudyWell 2 of the Gas Research Institute (now GTI).
(Figure 1) in 1981. Although Newark East field is themain producing area, MEDC (now merged with andknown as Devon Energy Corporation) and other op-erators have expanded the commercial gas play intoother areas (Hill and Nelson, 2000; Barnett ShaleHome Page, 2001; Williams, 2002). The Barnett Shale
in Newark East field lies at depths of 6500–8500 ft(1981–2591 m); net shale thickness ranges from 50 to200 ft (15–61 m) (Table 1).
Geochemical and reservoir parameters for the Bar-nett Shale differ markedly from those of other gas-pro-ductive shales, particularly with respect to gas in place
Curtis 1933
2200
2300
2400
2500
2600
2700
2800
2900
3000
3100
3200
3300
3400
3500
3600
3700
3800
3900
4000
4100
4200
4300
4400
4500
4600
4700
4800
4900
5000
5100
5200
5300
GR (API units) Density (g/cm2)2.0 2.5 3.00 200
GR (API units) Density (g/cm2)
2.0 2.5 3.00 200FORMATION
Depth(ft)
Upper Devonian (undivided)mostly gray shale with minorinterbedded siltstone
Sunbury Shale
Rhinestreet Memberinterbedded gray and darkgray or black shale
Angola Membermostly gray shale with minorinterbedded siltstone
Java Formationmostly gray shale with minorinterbedded siltstone
Figure 13. Type log from the GTI CSW 2 well, CalhounCounty, West Virginia (after Lowry et al., 1988, reprinted withpermission from the Gas Technology Institute). CSW2 � Com-prehensive Study Well 2 of the Gas Research Institute (now GTI).
(Figure 9). For example, Barnett Shale gas is thermo-genic in origin. According to the model depicted inFigure 14, hydrocarbon generation began in the LatePaleozoic, continued through the Mesozoic, andceased with uplift and cooling during the Cretaceous(Jarvie et al., 2001). In addition, organic matter in the
Barnett Shale has generated liquid hydrocarbons. Jar-vie et al. (2001) identified Barnett-sourced oils in 13other formations, ranging from Ordovician to Penn-sylvanian in age, in the western Fort Worth basin.Cracking of this oil may have contributed to the gas-in-place resource.
Jarvie et al. (2001) also postulated that, whereasthe Barnett Shale petroleum system exhibits world-class petroleum potential, two factors have combinedto inhibit oil and gas productivity: (1) episodic expul-sion of hydrocarbons when other elements of the pe-troleum system (migration paths, reservoir rocks, trap)were less than optimum in time and space and (2) pe-riodically leaking seals.
Nevertheless, Barnett Shale gas production is onthe increase; annual production exceeds 400 mcf/dayfrom more than 900 wells (Williams, 2002). Expansionof the Barnett play beyond the historical productionarea is accelerating but is limited (particularly for morerecent participants) by market, infrastructure consid-erations, and proximity to the Dallas–Fort Worthmetroplex.
Lewis Shale
The Lewis Shale of the central San Juan basin of Col-orado and New Mexico (Figure 1) is the youngestshale-gas play, both in geologic terms and in terms ofcommercial development.
The Lewis Shale is a quartz-rich mudstone withTOC contents ranging from about 0.5 to 2.5% (Table1). It is believed to have been deposited as a lowershoreface to distal offshore sediment in the LateCretaceous.
On the type log for the Lewis Shale, shown in Fig-ure 15, four intervals and a conspicuous, basinwidebentonite marker are recognizable. The greatest per-meability is found in the lowermost two-thirds of thesection. This enhanced permeability may be the resultof an increase in grain size and microfracturing asso-ciated with the regional north-south/east-west fracturesystem (Hill and Nelson, 2000).
Inspection of Figure 9 and Table 1 shows that theLewis Shale has the greatest net thickness and highestthermal maturity of the five petroleum systems underdiscussion. Adsorbed gas content also is the highest ofany of the shale-gas plays.
The late 1990s marked the startup of the LewisShale gas play. Operators target the Lewis as either asecondary completion zone in new wells or a recom-pletion zone in existing wellbores (Hill and Nelson,
1934 Fractured Shale-Gas Systems
Figure 14. Burial history dia-gram and stratigraphic column,Fort Worth basin (after Jarvie etal., 2001, figure used with per-mission from D. M. Jarvie).
0
2000
4000
6000
8000
10000
12000500 400 300 200 100 0
TIME (Ma)
DEPTH(ft)
Early generation10 to 25%
Main phase25 to 65%
Late generation65 to 90%
90°F
120°F
150°F
180°F
210°F
240°F
270°F
300°F
PALEOZOIC MESOZOIC CENO.O S D M P P T J K E MR
FORMATION
Strawn Gp. (Penn.)
Canyon Gp. (Penn.)
Barnett Fm. (Miss.)
Ellenburger Gp. (Ord.)
t = 0
2000). These completion strategies result in incremen-tal reserves-addition costs of about $0.30/mcf (Wil-liams, 1999). Figure 3 indicates that, although still vol-umetrically small compared to Ohio and Antrimproduction, Lewis Shale gas production is increasingquickly from year to year.
This play should not be confused with the Creta-ceous Lewis Shale gas play under way in the Washakie,Great Divide, and Sand Wash basins of Wyoming andColorado. Lewis gas production in those basins comesfrom turbidite sands encased in marine shales, whichare not age equivalent to the San Juan basin LewisShale.
FORMATION EVALUATIONCONSIDERATIONS
A wide range of reservoir properties (Figure 9; Table1) apparently controls both the rate and volume ofshale-gas production from these five petroleum sys-tems, notably thermal maturity, gas in place, TOC,reservoir thickness, and proportion of sorbed gas (Hilland Nelson, 2000). As discussed previously, naturalfracture networks are required to augment the ex-tremely low shale-matrix permeabilities. Therefore,geology and geochemistry must be considered to-gether when evaluating a given shale system both be-fore and after drilling. Several such integrated modelshave been developed to evaluate shale-gas systemsmore completely.
The Devonian Shale Specific Log model of GTI(Luffel et al., 1992) has been successfully applied tothe Ohio Shale. The Antrim Shale Reservoir model ofGTI-Holditch (Frantz, 1995; Lancaster et al., 1996) isa more recent development. As a result of studies ofthe Antrim Shale and the New Albany Shale systems,Martini et al. (1998) and Walter et al. (2000) proposedexploration models for the biogenic components of therecoverable gas.
RESOURCES AND CURRENT PRODUCTION
For the five shale-gas systems considered here, theoverall magnitude of published gas-in-place resourceestimates (summarized in Table 2) net of proved re-serves is quite large, as high as 783 tcf, as is the rangefor individual systems. For comparison, in 2000 theUnited States produced approximately 19.3 tcf of nat-ural gas and imported an additional 3.4 tcf, mainlyfrom Canada (Energy Information Administration,2001).
Additional gas resource data come from the Poten-tial Gas Committee (PGC). Although PGC’s biennialassessments are not published at the formation level,and thus are excluded from Table 2, the committeehas increased substantially its estimates of technicallyrecoverable gas in the Michigan and San Juan basins inthe last 6 yr as a result of E & P activity in the Antrimand Lewis shales, respectively (Potential Gas Commit-tee, 1995, 1997, 1999, 2001).
Curtis 1935
Figure 15. Lewis Shale type log, San Juan basin (after Hilland Nelson, 2000, reprinted with permission from HartPublications).
In evaluating these estimates, consideration mustbe given as to whether the estimates are geologicallyplay based (U.S. Geological Survey) or derived fromsophisticated computer models that evaluate both sup-ply and demand aspects of the gas resource base (Na-tional Petroleum Council, GTI). The latter approachtends to yield considerably larger values (Curtis, 2001).Additionally, recoverable gas resources most likelyconstitute only a small percentage of total gas in place(31–76 tcf out of 400–686 tcf in place for the estimatesin Table 2, exclusive of the Lewis Shale). For example,Devon Energy Corporation estimates that only 8% of
an estimated 147 bcf (equivalent) in place is recovered(Williams, 2002).
A comparison of Table 2 and Figure 3 indicatesthat whereas the Ohio Shale holds both the greatestin-place and technically recoverable resources, its shareof total shale-gas production has been declining since1994, although yearly production continues to in-crease. In 1994, annual production of Antrim Shale gassurpassed total Appalachian basin shale-gas produc-tion. Barnett Shale production is now approximatelyone-third the magnitude of Appalachian shale-gas pro-duction; note, however, that MEDC required approx-imately 20 yr to commercialize Barnett Shale gas.Lewis Shale gas potential is currently unknown butpromising, based both on production trends in the last4 yr and on the fact that wellhead economics do notrely solely on Lewis Shale production.
ECONOMICS OF EXPLORATION ANDPRODUCTION
Table 1 compares typical well costs, completion costs,gas and water production rates, and gas reserves perwell for the five shale-gas systems. Due perhaps todepth considerations, the Barnett Shale has the highestwell costs. The Antrim and New Albany shales havelower well costs, and the Ohio and Lewis Shale wellsare intermediate. Completion costs for the three east-ern shale-gas petroleum systems are significantly lowerthan those for the Barnett and Lewis shales. Disposalof produced water is a consideration only for the An-trim and New Albany shales.
DOMESTIC AND INTERNATIONALOUTLOOK
When one considers the magnitude of the resourcebase (Table 2), extending the production trends shownin Figure 3 out 10–20 yr strongly suggests that shalegas will become a domestic gas supply of regional, ifnot national, importance. Projections by industry andgovernment researchers indicate that, to meet growingdomestic natural gas demand, annual United States gassupply requirements must grow from the current 22�
to 30–35 tcf (Gas Research Institute, 2000; Energy In-formation Administration, 2001), which includes only5 tcf from imports. The growth in production of totalunconventional gas has been modeled through 2020(Energy Information Administration, 2001); however,
1936 Fractured Shale-Gas Systems
Tabl
e2.
Unite
dSt
ates
Gas-
Bear
ing
Shal
eRe
sour
ces
inHi
stor
ically
Prod
uctiv
ePl
ays*
Maj
orSh
ale-
Bear
ing
Basin
Area
TOC
Ther
mal
Mat
urity
Shal
eGa
s-In
-Pla
ceRe
sour
ceEs
timat
edRe
cove
rabl
eSh
ale-
Gas
Reso
urce
Estim
ated
Tota
lUn
disc
over
edSh
ale-
Gas
Reso
urce
Basin
Stat
e(s)
Unit
(mi2 )
(%)
(%R o
)(tc
f)Re
fere
nce(
s)(tc
f)Re
fere
nce(
s)(tc
f)**
Appa
lach
ian
Ohi
o,Ke
ntuc
ky,
New
York
,Pe
nnsy
lvan
ia,
Virg
inia
,Wes
tVi
rgin
ia
Ohi
oSh
ale
160,
000
0–4.
50.
4–1.
322
5–24
8†N
PC(1
980,
1992
)14
.5–2
7.5
NPC
(198
0,19
92)
90.7
Mich
igan
Mich
igan
,Ind
iana
,O
hio
Antri
mSh
ale
122,
000
1–20
0.4–
0.6
35–7
6N
PC(1
980,
1992
)11
–18.
9N
PC(1
992)
;USG
S(1
995)
40.6
Ilino
isIll
inoi
s,In
dian
a,Ke
ntuc
kyN
ewAl
bany
Shal
e53
,000
1–25
0.4–
1.0
86–1
60N
PC(1
980,
1992
)1.
9–19
.2N
PC(1
992)
;USG
S(1
995)
NA
Fort
Wor
thTe
xas
Barn
ettS
hale
4,20
0††4.
51.
0–1.
354
–202
Jarv
ieet
al.(
2001
)3.
4–10
.0Sc
hmok
eret
al.
(199
6);K
uusk
raa
etal
.(19
98)
NA
San
Juan
Colo
rado
,New
Mex
icoLe
wis
Shal
e1,
100††
0.45
–2.5
1.6–
1.88
96.8
1997
estim
ate
byBu
rling
ton
Reso
urce
s
NA
—N
A
*Mod
ified
from
Hill
and
Nel
son
(200
0),w
ithad
ditio
nald
ata
from
Jarv
ieet
al.(
2001
)an
dth
em
anus
crip
trev
iew
ers.
NPC
�N
atio
nalP
etro
leum
Coun
cil;U
SGS
�U.
S.Ge
olog
icalS
urve
yN
atio
nalO
ilan
dGa
sRe
sour
ceAs
sess
men
tTea
m.
**20
00Ga
sRe
sear
chIn
stitu
teBa
selin
ePr
ojec
tion
ofU.
S.En
ergy
Supp
lyan
dDe
man
dto
2015
(GRI
-00/
0002
.2)(
Gas
Rese
arch
Inst
itute
,200
0).
† Blac
ksh
ales
only
.††
Play
area
only
.
Curtis 1937
shale gas is not specifically projected. In terms of itsrecoverable resource base and production potential,shale gas probably will remain third in importance aftertight sands and coalbed methane (Curtis, 2001).
Commercial shale-gas production outside theUnited States most likely will occur where an optimumrange of values of key geological and geochemical pa-rameters of the petroleum system (Figure 9) exists un-der favorable economic conditions with respect to ex-ploration, drilling and completion costs, and proximityto a gas transmission infrastructure.
CONCLUSIONS
United States natural gas production began from or-ganic shale formations, and, given the large, technicallyrecoverable resource base and long life of a typical well,shale gas may represent one of the last, large onshorenatural gas sources of the lower 48 states.
The occurrence and production of natural gas fromfractured, organic-rich Paleozoic and Mesozoic shaleformations in the United States may be better under-stood by considering source rock, reservoir, seal, trap,and generation-migration processes within the frame-work of a petroleum system. The system concept mustbe modified, however, inasmuch as organic shales areboth source and reservoir rocks and, at times, seals.Additional consideration must be given to the origin ofthe gas, whether biogenic or thermogenic, in definingthe critical moment in the evolution of potentially pro-ducible hydrocarbons.
The five shale-gas systems discussed in this articleexhibit wide ranges of key geological and geochemicalparameters, but each system produces commercialquantities of natural gas. Still, operators face consid-erable challenges in bringing substantially more of thisgas to market. For example, the controls on gas gen-eration and reservoir producibility must be better un-derstood. Although fracture and matrix permeability,enhanced by application of appropriate well stimula-tion treatments, are key to achieving economical gasflow rates, sufficient amounts of organic matter (eitherfor generation of thermogenic gas or as a microbialfeedstock) must initially have been present to havegenerated the reservoired gas. Therefore, decipheringthe thermal history of the organic matter within theshales and analyzing the rock mechanics response ofthe shale matrix and organic matter to local and re-gional stresses are critical steps in establishing theircomplex relationship to gas producibility. The poor
quality of one factor (e.g., low adsorbed gas) may becompensated for by another factor (e.g., increasedreservoir thickness); however, shale-gas productioncannot always be achieved even where optimum com-binations of geological and geochemical factors appar-ently are present.
REFERENCES CITED
Ayers Jr., W. B., 2002, Coalbed gas systems, resources, and productionand a review of contrasting cases from the San Juan and PowderRiver basins: AAPG Bulletin, v. 86, no. 11, p. 1853–1890.
Barnett Shale Home Page, 2001, �http://www.barnettshale.com�Accessed December 13, 2001.
Cole, G. A., R. J. Drozd, R. A. Sedivy, and H. I. Halpern, 1987,Organic geochemistry and oil-source correlations, Paleozoic ofOhio: AAPG Bulletin, v. 71, no. 7, p. 788–809.
Coogan, A. H., 1988, Fault-related Silurian Clinton sandstone de-position in Ohio (abs.): AAPG Bulletin, v. 72, no. 8, p. 959.
Curtis, J. B., 2001, Comparison of estimates of recoverable naturalgas estimates in the United States: Colorado School of Mines,Potential Gas Agency, Gas Resource Studies 8, 16 p.
Curtis, J. B., and G. Faure, 1997, Accumulation of organic matterin the Rome trough of the Appalachian basin and its subsequentthermal history: AAPG Bulletin, v. 81, no. 3, p. 424–437.
Curtis J. B., and G. Faure, 1999, Accumulation of organic matter inthe Rome trough of the Appalachian basin and its subsequentthermal history—reply: AAPG Bulletin, v. 83, no. 4, p. 668–669.
Decker, D., J-M. P. Coates, and D. E. Wicks, 1992, Stratigraphy, gasoccurrence, formation evaluation and fracture characterizationof the Antrim Shale, Michigan basin: Gas Research InstituteTopical Report GRI-92/0258, 101 p.
deWitt Jr., W., J. B. Roen, and L. G. Wallace, 1993, Stratigraphy ofDevonian black shales and associated rocks in the Appalachianbasin, in J. B. Roen and R. C. Kepferle, eds., Petroleum geologyof the Devonian and Mississippian black shale of eastern NorthAmerica: U.S. Geological Survey Bulletin 1909, p. B1–B57.
Energy Information Administration, 1999, U.S. crude oil, naturalgas, and natural gas liquids reserves—1998 annual report: U.S.Department of Energy, Energy Information Administration Re-port DOE/EIA-0216 (98), 150 p.
Energy Information Administration, 2001, U.S. natural gas mar-kets—recent trends and prospects for the future: U.S. Depart-ment of Energy, Energy Information Administration ReportSR/OIAF/2001-02, 39 p.
Ettensohn, F. R., 1985, The Catskill delta complex and the Acadianorogeny—a model, in D. L. Woodrow and W. D. Sevon, eds.,The Catskill delta: Geological Society of America Special Paper201, p. 39–49.
Frantz Jr., J. H., 1995, Technology applications improve AntrimShale well recoveries and economics: GasTIPS, v. 2., no. 1, p. 5–11.
Frantz Jr., J. H., N. R. Fairchild Jr., H. G. Dube, S. M. Campbell,G. E. Christiansen, and A. J. Olszewski, 1999, Evaluating res-ervoir production mechanisms and hydraulic fracture geometryin the Lewis Shale, San Juan basin: Society of Petroleum En-gineers Annual Technical Conference and Exhibition, SPE Pa-per 56552, 8 p.
Gas Research Institute, 2000, GRI baseline projection data book,2000 ed.: Gas Research Institute Report GRI-00/0002.2,241 p.
1938 Fractured Shale-Gas Systems
Hassenmueller, N. R., and J. B. Comer, 1994, Gas potential of theNew Albany Shale (Devonian and Mississippian) in the Illinoisbasin: Gas Research Institute Topical Report GRI-92/0391,83 p.
Hassenmueller, N. R., and C. W. Zuppann, 1999, Exploratory drill-ing in the New Albany Shale in southern Indiana: PetroleumTechnology Transfer Council and Illinois State Geological Sur-vey website summary, �http://www.isgs.uiuc.edu/isgsroot/oilgas/nalban.html� Accessed December 2, 2001.
Hill, D. G., 2001, Consortium project results guide development ofNew Albany Shale: GasTIPS, v. 7, no. 2, p. 11–16.
Hill, D. G., and C. R. Nelson, 2000, Gas productive fracturedshales—an overview and update: GasTIPS, v. 6, no. 2, p. 4–13.
Holst, T. B., and G. R. Foote, 1981, Joint orientation in Devonianrocks in the northern portion of the lower peninsula of Michi-gan: Geological Society of America Bulletin, v. 92, no. 2, p. 85–93.
Hunter, C. D., and D. M. Young, 1953, Relationship of natural gasoccurrence and production in eastern Kentucky (Big Sandy gasfield) to joints and fractures in Devonian bituminous shales:AAPG Bulletin, v. 37, no. 2, p. 282–299.
Jarvie, D. M., B. L. Claxton, F. Henk, and J. T. Breyer, 2001, Oiland shale gas from the Barnett Shale, Ft. Worth basin, Texas(abs.): AAPG Annual Meeting, Program with Abstracts,p. A100.
Kepferle, R. C., 1993, A depositional model and basin analysis forthe gas-bearing black shale (Devonian and Mississippian) in theAppalachian basin, in J. B. Roen and R. C. Kepferle, eds., Pe-troleum geology of the Devonian and Mississippian black shaleof eastern North America: U.S. Geological Survey Bulletin1909, p. F1–F23.
Kuuskraa, V. A., G. Koperna, J. W. Schmoker, and J. C. Quinn,1998, Barnett Shale rising star in Fort Worth basin: Oil & GasJournal, v. 96, no. 21, p. 67–68, 71–76.
Lancaster, D. E., B. A. Cain, D. G. Hill, V. A. Jochen, and W. M.Parks, 1996, Production from fractured shales, in D. E. Lan-caster, ed., Production from fractured shales: Society of Petro-leum Engineers Reprint Series 45, p. 4–5.
Lowry, P. H., T. Hamilton-Smith, and R. M. Peterson, 1988, Iden-tification of geologic controls on gas production from prelimi-nary geological analysis of the GRI CSW No. 2: Gas ShalesTechnology Review, v. 5, no. 2/3, p. 17–27.
Luffel, D. L., F. K. Guidry, and J. B. Curtis, 1992, Evaluation ofDevonian shale with new core and log analysis methods: Journalof Petroleum Technology, v. 44, no. 11, p. 1192–1197.
Magoon, L. B., and W. G. Dow, 1994, The petroleum system, inL. B. Magoon and W. G. Dow, eds., The petroleum system—from source to trap: AAPG Memoir 60, p. 3–24.
Martini, A. M., L. M. Walter, J. M. Budai, T. C. W. Ku, C. J. Kaiser,and M. Schoell, 1998, Genetic and temporal relations betweenformation waters and biogenic methane—Upper Devonian An-trim Shale, Michigan basin, USA: Geochimica et Cosmochim-ica Acta, v. 62, no. 10, p. 1699–1720.
Matthews, R. D., 1993, Review and revision of the Devonian–Mis-sissippian stratigraphy in the Michigan basin, in J. B. Roen andR. C. Kepferle, eds., Petroleum geology of the Devonian andMississippian black shale of eastern North America: U.S. Geo-logical Survey Bulletin 1909, p. D1–D85.
Milici, R. C., 1993, Autogenic gas (self sourced) from shales—anexample from the Appalachian basin, in D. G. Howell, ed., Thefuture of energy gases: U.S. Geological Survey Professional Pa-per 1570, p. 253–278.
Moody, J. R., J. R. Kemper, I. M. Johnston, and R. R. Elkin, 1987,The geology and the drilling and production history of the Up-per Devonian shale of Whitley, Knox, Bell, and Harlan coun-ties, southeastern Kentucky: Kentucky Geological Survey, pub-lication prepared for the Gas Research Institute, 30 p.
National Petroleum Council, 1980, Devonian shale gas, in Uncon-ventional gas sources: Washington, D.C., National PetroleumCouncil, v. 3, p. D1–D2.
National Petroleum Council, 1992, Source and supply, in The po-tential for natural gas in the United States: Washington, D.C.,National Petroleum Council, v. 1, p. 5.
Peebles, M. W. H., 1980, Evolution of the gas industry: New York,New York University Press, 235 p.
Potential Gas Committee, 1995, Potential supply of natural gas inthe United States—report of the Potential Gas Committee (De-cember 31, 1994): Colorado School of Mines, Potential GasAgency, 130 p.
Potential Gas Committee, 1997, Potential supply of natural gas inthe United States—report of the Potential Gas Committee (De-cember 31, 1996): Colorado School of Mines, Potential GasAgency, 130 p.
Potential Gas Committee, 1999, Potential supply of natural gas inthe United States—report of the Potential Gas Committee (De-cember 31, 1998): Colorado School of Mines, Potential GasAgency, 195 p.
Potential Gas Committee, 2001, Potential supply of natural gas inthe United States—report of the Potential Gas Committee (De-cember 31, 2000): Colorado School of Mines, Potential GasAgency, 346 p.
Roen, J. B., 1984, Geology of the Devonian black shales of theAppalachian basin: Organic Geochemistry, v. 5, no. 4, p. 241–254.
Roen, J. B., 1993, Introductory review—Devonian and Mississippianblack shale, eastern North America, in J. B. Roen and R. C.Kepferle, eds., Petroleum geology of the Devonian and Missis-sippian black shale of eastern North America: U.S. GeologicalSurvey Bulletin 1909, p. A1–A8.
Schettler, P. D., and C. R. Parmely, 1990, The measurement of gasdesorption isotherms for Devonian shale: Gas Shales Technol-ogy Review, v. 7, no. 1, p. 4–9.
Schmoker, J. W., J. C. Quinn, R. A. Crovelli, V. F. Nuccio, and T. C.Hester, 1996, Production characteristics and resources assess-ments of the Barnett Shale continuous (unconventional) gas ac-cumulation, Fort Worth basin, Texas: U.S. Geological SurveyOpen-File Report OF-96-254, 20 p.
Schoell, M., 1980, The hydrogen and carbon isotopic compositionof methane from natural gases of various origins: Geochimicaet Cosmochimica Acta, v. 44, no. 5, p. 649–661.
Schumaker, R. C., 1993, Structural parameters that affect Devonianshale gas production in West Virginia and eastern Kentucky, inJ. B. Roen and R. C. Kepferle, eds., Petroleum geology of theDevonian and Mississippian black hale of eastern North Amer-ica: U.S. Geological Survey Bulletin 1909, p. K1–K38.Shurr,G. W., and J. L. Ridgley, 2002, Unconventional shallow bio-genic gas systems: AAPG Bulletin, v. 86, no. 11, p. 000–000.
Sumrow, M. H., 2001, Petroleum resource, careers: Oil & Gas Jour-nal, v. 99, no. 38, p. 17.
U.S. Geological Survey National Oil and Gas Resource AssessmentTeam, 1995, 1995 national assessment of United States oil andgas resources: U.S. Geological Survey Circular 1118, 20 p.
Walter, L. M., J. M. Budai, L. M. Abriola, C. H. Stearns, A. M.Martini, and T. C. W. Ku, 1995, Hydrogeochemistry of theAntrim Shale, northern Michigan basin: Gas Research InstituteTopical Report GRI-95/0251, 253 p.
Walter L. M., J. C. McIntosh, J. M. Budai, and A. M. Martini, 2000,Hydrogeochemical controls on gas occurrence and productionin the New Albany Shale: GasTIPS, v. 6, no. 2, p. 14–20.
Williams, P., 1999, San Juan basin: Oil and Gas Investor, v. 19, no. 6,p. 26–34.
Williams, P., 2002, The Barnett Shale: Oil and Gas Investor, v. 22,no. 3, p. 34–45.