Page 1
Accepted to Journal of Biophotonics, ©2018 Wiley
1
Stained-free interferometric phase microscopy correlation with DNA 1
fragmentation stain in human spermatozoa 2
3
Itay Barnea1, Lidor Karako
1, Simcha K. Mirsky
1, Mattan Levi
1, Michal Balberg
1,2 4
Natan T. Shaked1,*
5
6
Affiliations: 7
1- Department of Biomedical Engineering, Tel Aviv University, Tel Aviv, Israel. 8
2- Faculty of Electrical Engineering, Holon Institute of technology, Holon, Israel. 9
10
* Corresponding author: Prof. Natan T. Shaked, PhD. Department of Biomedical 11
Engineering, Tel Aviv University, Tel Aviv, Israel. Email: [email protected] 12
13
14
15
16
17
Page 2
Accepted to Journal of Biophotonics, ©2018 Wiley
2
Abstract 18
Acridine orange (AO) staining is one of the methods used to diagnose the DNA 19
fragmentation status in sperm cells. Interferometric phase microscopy (IPM) is a an 20
optical imaging method based on digital holographic microscopy that provides 21
quantitative morphological and refractive index imaging of cells in vitro without the 22
need for staining. We have imaged sperm cells using stain-free IPM in order to 23
estimate different cellular parameters, such as acrosome dry mass and size, in addition 24
to an embryologist evaluation according to the WHO-2010 criteria. Following this, 25
the same sperm cells were stained by AO, imaged using a fluorescence confocal 26
microscope and assessed by the AO-emitted color, forming five DNA fragmentation 27
groups. These DNA fragmentation groups were correlated with the embryologist- 28
based classification and the IPM-based morphological parameters. Our results 29
indicate on significant differences in IPM-based parameters between groups with 30
different fragmentation levels. Specifically, the size of the acrosome, as measured 31
from stain-free IPM, is a good predictor for the presence of intact DNA. Based on the 32
validation with AO, we conclude that stain-free IPM images analyzed digitally may 33
assist in selecting sperm cells with intact DNA prior to intracytoplasmic sperm 34
injection (ICSI). This information may potentially increase percentage of successful 35
pregnancies. 36
37
Keywords: Digital holographic microscopy; Quantitative phase imaging; Label-free 38
imaging; Sperm analysis; Fertility. 39
Page 3
Accepted to Journal of Biophotonics, ©2018 Wiley
3
1. Introduction 40
DNA fragmentation in sperm, has long been associated with an impaired ability for 41
spontaneous pregnancy [1], as well as with difficulties in achieving live births after 42
artificial reproductive technology (ART) procedure. It has been shown that couples 43
undergoing conventional in vitro fertilization (IVF) and intracytoplasmic sperm 44
injection (ICSI) where the sperm donor is diagnosed with high percentage of DNA 45
fragmented sperms experience low pregnancy rates, abnormal embryo development 46
and increase miscarriages [2,3]. A meta-analysis summarizing results of over 8000 47
treatment cycles in 41 independent reports has shown that men with higher sperm 48
DNA fragmentation, exhibit a 1.9-2.3 fold increase in the likelihood for failure to 49
achieve clinical pregnancy [4]. DNA fragmentation is not only an important factor in 50
the failure of ICSI cycles involving men with fertility problems, but also those 51
involving men with normal sperm. Reports have shown that in normal semen samples 52
between 20% – 30% of sperm cells have fragmented DNA [5]. Moreover, as fertility 53
treatments are becoming more frequent in men in their forties and fifties, the quality 54
of sperm decreases compared to the sperm of younger men, as it has been shown that 55
DNA fragmentation increases with age [6]. 56
There are several methods for the evaluation of DNA fragmentation. These include: 57
the transferase dUTP nick end labeling (TUNEL) test [7], which evaluates DNA 58
fragmentation by staining the terminal end of nucleic acids; the Comet test [8], which 59
evaluates DNA strand breaks by electrophoresis of the cell content; and the sperm 60
chromatin dispersion assay (SCD), which evaluate DNA fragmentation by the 61
presence or absence of halo around the cell head [9]. In the present work, we choose 62
to use the acridine orange (AO) method [10], which differentiates between double 63
stranded (dsDNA) and single-stranded DNA (ssDNA) or RNA. In this method, 64
Page 4
Accepted to Journal of Biophotonics, ©2018 Wiley
4
dsDNA emits green fluorescence and single-stranded DNA or RNA emits red 65
fluorescence, and fluorescent microscopy or flow cytometry is used to evaluate the 66
different colors. 67
The fact that most of the methods for the evaluation of DNA fragmentation listed 68
above require killing of the cells renders them irrelevant for the assessment of the 69
DNA integrity of the individual live sperm cells used in ICSI [11]. Thus, today, the 70
selection of sperm cells for ICSI is performed using the limited capabilities of 71
relatively low-magnification bright-field microscopy (BFM), usually with 200-400× 72
total magnification. This tool enables the embryologist to select motile sperm on the 73
basis of basic morphological characteristics, such as the sperm head size [12]. 74
Another recent method for sperm selection is intracytoplasmic morphologically 75
selected sperm injection (IMSI). In this method the sperm is imaged using mostly 76
digital magnifications of 6300× or higher, where the cells are imaged without staining 77
using differential interference contrast (DIC) [13]. Due to the higher magnification 78
and enhanced contrast of the IMSI systems, the embryologist can observe 79
morphological characteristics such as cytoplasmic vacuoles. Evidence suggests that 80
these vacuoles are associated with defected chromatin packaging and DNA 81
fragmentations [14,15]. 82
The benefits of IMSI in comparison to ICSI are controversial: one meta-analysis has 83
shown that the use of IMSI significantly improves the percentage of high-quality 84
embryos, implantation and pregnancy rates, and significantly reduces miscarriage 85
rates in comparison to ICSI [16]. In contrast, the critics note that there are not enough 86
randomized trials to confirm the benefits of IMSI, thus this method should be 87
Page 5
Accepted to Journal of Biophotonics, ©2018 Wiley
5
employed only after the failure of several ICSI cycles and confirmation of male-factor 88
infertility [17]. 89
Interferometric phase microscopy (IPM) is a stain-free imaging technique also known 90
as digital holographic microscopy (DHM), or quantitative phase microscopy (QPM), 91
which can capture both the amplitude and phase profiles of the light that passes 92
through transparent biological cells. IPM provides a quantitative measurement of the 93
optical path delay (OPD) at each point in the sample. OPD is defined as the difference 94
between the refractive index of the sample and that of the surrounding medium 95
multiplied by the sample thickness [18-20] (see Equation 1). Thus, OPD has positive 96
correlation both with the thickness and with the density on the sperm cell. The 97
resulting OPD map is a visualization of a quantified contrast based on the thickness 98
and density at all points of the cell, in contrast to DIC, the basis of IMSI, which 99
records OPD gradient and thus provides contrast only near the cell and organelle 100
edges. Past work done in our group showed agreement between the label-free IPM 101
images and stained cells [11] The particular IPM module used in this work is the τ 102
interferometer, which is a compact external module that can be positioned at the exit 103
of a microscope and thus makes IPM much more accessible to fertility clinics [21]. 104
The quantitative phase measured is defined by 𝜑(𝑥, 𝑦) = 2𝜋/𝜆 ⋅ 𝑂𝑃𝐷(𝑥, 𝑦), where 𝜆 105
is the illumination wavelength and OPD is defined as follows: 106
𝑂𝑃𝐷(𝑥, 𝑦) = [𝑛𝑐(𝑥, 𝑦) − 𝑛𝑚] × ℎ𝑐(𝑥, 𝑦) , (1) 107
where 𝑂𝑃𝐷(𝑥, 𝑦) is the OPD at point (𝑥, 𝑦), 𝑛𝑐(𝑥, 𝑦) is the integral refractive index 108
of the sperm cells at point (𝑥, 𝑦), nm is the refractive index of the medium and 109
ℎ𝑐(𝑥, 𝑦) is the thickness of the cell at point (𝑥, 𝑦). 110
Page 6
Accepted to Journal of Biophotonics, ©2018 Wiley
6
111
Our group has demonstrated the agreement between the information obtained by 112
stain-free IPM of fixed unstained sperm cells and the information obtained by BFM of 113
stained sperm cells [11], in connection with the measurement of key morphological 114
parameters using the WHO guidelines. The fact that the IPM and BFM results are in 115
agreement enabled us to assess the OPD maps in accordance to the WHO-2010 116
criteria [22], but without the use of staining. 117
In this work, we compare the information obtained by morphological assessment of 118
stain-free IPM images of sperm cells to categorization of DNA fragmentation by AO 119
staining of the same cells. The ultimate aim is to determine whether stain-free IPM 120
can be used to indicate DNA integrity of the individual sperm cells used in ICSI. 121
122
Page 7
Accepted to Journal of Biophotonics, ©2018 Wiley
7
2. Methods 123
2.1 Sample preparation 124
The study was approved by the institutional ethics committee of Tel Aviv University. 125
All sperm donor signed a written Informed consent form. 126
Semen samples were obtained from six childless sperm donors in their twenties. After 127
ejaculation, the semen was liquefied at room temperature for 30 minutes and then 128
spermatozoa were isolated using the PureCeption Bi-layer kit (Origio, Målov, 129
Denmark) in accordance with manufacturer instructions. The upper phases were 130
discarded and the pellet was re-suspended in 5 ml of modified human tubal fluid 131
(HTF) medium (Irvine Scientific, CA, USA) and centrifuged again at 500 ×g for 5 132
minutes. Next, the supernatant was discarded and the pelleted sperm cells were 133
resuspended in 0.1 ml HTF. Sperm cells are motile and dynamic. Since the same cells 134
were measured by two microscopy systems (IPM and later, after staining, in BFM), 135
the sperm cells were fixed, which kept their morphology unchanged between the 136
imaging cycles. This is done using drop by drop addition of 10 ml of 3:1 methanol to 137
acetic acid solution. After 5 minutes at room temperature, the cells were centrifuged 138
at 800 ×g for 5 minutes, the supernatant was discarded, and the pellet was re- 139
suspended in 0.2 ml of fixative solution. 140
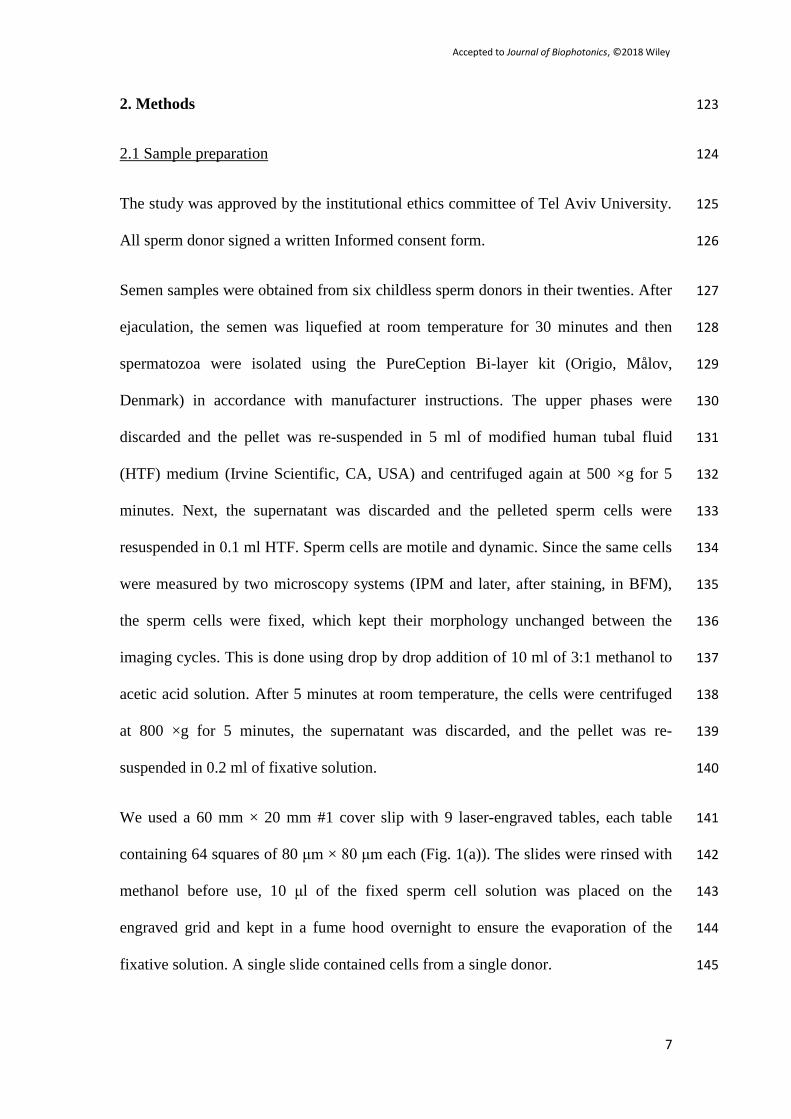
We used a 60 mm × 20 mm #1 cover slip with 9 laser-engraved tables, each table 141
containing 64 squares of 80 μm × 80 μm each (Fig. 1(a)). The slides were rinsed with 142
methanol before use, 10 μl of the fixed sperm cell solution was placed on the 143
engraved grid and kept in a fume hood overnight to ensure the evaporation of the 144
fixative solution. A single slide contained cells from a single donor. 145
Page 8
Accepted to Journal of Biophotonics, ©2018 Wiley
8
2.2 IPM imaging and analysis of sperm cells 146
The fixed sperm cells were imaged using 63×, 1.4 numerical aperture, oil-immersion 147
objective. The illumination source was a supercontinuum fiber-laser source (SC400-4, 148
Fianium), connected to a computer-controlled acousto-optical tunable filter (SC– 149
AOTF, Fianium), tuned to a central wavelength of 633 nm and a full-width-at-half 150
maximum bandwidth of 6.7 nm. We used the IPM system designed by our group and 151
previously described in [11,21]. The camera in the output of the IPM system captures 152
an interferogram that is digitally processed into an OPD map of the sample by digital 153
spatial filtering and phase unwrapping algorithm [21]; a stain-free quantitative image 154
of the sperm representing a cell average refractive index of the cell and thickness at 155
all spatial points. 156
2.3 Embryologist evaluation 157
The stain-free OPD images of each cell were evaluated by an expert embryologist 158
(M.L.) in accordance with the WHO 2010 guidelines [22]. The embryologist 159
evaluated and individually graded each sperm cell by head shape, acrosome size, 160
cytoplasmic vacuole and cytoplasmic droplet presence, and midpiece form. 161
2.4 Computer assisted evaluation of sperm cell morphological parameters 162
The isolation and evaluation of sperm cells was performed using a Matlab algorithm 163
that our group had previously designed for this purpose, and was fully presented in 164
Ref. [23]. 165
The output of this procedure was the OPD map of the cell head, nucleus and 166
acrosome, in addition to many parameters that can be calculated based on the OPD, 167
such as dry mass, mean anterior-posterior difference, head, acrosome, and nucleus 168
Page 9
Accepted to Journal of Biophotonics, ©2018 Wiley
9
areas, and head OPD variance. The OPD variance has a strong connection to the 169
presence or lack of a nucleus, and acrosome area is significant as it is the basis for one 170
of the WHO criteria. Nucleus area is significant as a smaller nucleus may indicate a 171
well-packed nucleus with less DNA fragmentation. The mean anterior-posterior 172
difference was calculated by dividing the isolated head OPD image into two equal 173
halves lengthwise, the anterior and posterior halves of the head. Following this, the 174
mean OPD values of these halves were calculated and the mean posterior OPD was 175
subtracted from the mean anterior OPD in order to get the final mean anterior- 176
posterior difference. 177
2.5 Dry mass calculation 178
The dry mass of the cell corresponds primarily to the protein concentration [24]. It 179
can be determined from the OPD using the following parameters. In Ref. [25], we 180
determined that the average dry mass of a sperm head was DM=7.51±1.03∙10-12
gram, 181
and the average refractive index of a sperm head was nc= 1.515±0.046. This was 182
achieved by comparing the OPD maps with the exact height measurements of the 183
same cells using an atomic force microscope (AFM). Based on Equation 2, we can 184
extract the volume (V) of the cells by: 185
𝑉 = 𝐴𝑟𝑒𝑎 ∗ 𝑇ℎ𝑖𝑐𝑘𝑛𝑒𝑠𝑠 = 𝐴𝑟𝑒𝑎 ∗𝑂𝑃𝐷
𝑛𝑐−𝑛𝑚 . (2) 186
From the AFM measurements obtained in Ref. [25], we can also obtain the average 187
volume of the cells and calculate the average concentration of dry mass density in 188
sperm cells; = M/V=1.013∙10-21
gram/nm3=1.013∙10
3 gram/liter. This value was then 189
used to calculate the dry mass of each cell or its compartment by multiplying the 190
volume calculated by Equation 2 by . 191
Page 10
Accepted to Journal of Biophotonics, ©2018 Wiley
10
𝐷𝑀 = 𝐴𝑟𝑒𝑎 ⋅ 𝑂𝑃𝐷 ⋅ 𝜌 . (3) 192
Acridine orange staining: 193
The fixed sperm cells, previously imaged by IPM, were then stained by AO using the 194
Tejada’s method [26]. In short, the slides were exposed to AO (0.19 mg/ml, pH 2.5) 195
for 5 minutes. Staining solution was prepared daily from a stock solution consisting of 196
1 mg AO (Sigma-Aldrich, Rehovot, Israel) in 1 L of deionized water, and stored in 197
the dark at 4 °C. To prepare the staining solution, 10 mL of the stock solution was 198
added to 40 mL of 0.1 M citric acid and 2.5 mL of 0.3 M Na2HPO4 7H2O (all from 199
Sigma-Aldrich, Rehovot, Israel). No loss of sperm cells was detected after staining 200
with AO. 201
After staining, the slides were rinsed in a stream of deionized water for 5 minutes, air 202
dried and imaged within two hours by a confocal fluorescence microscope (Zeiss 203
LSM 510-META). Each engraved table of 8 × 8 squares was imaged using a 25×, 1.4 204
numerical aperture microscope objective. The cells were excited using light at 205
wavelengths 477 – 488 nm, and emission was filtered between 572 – 668 nm for the 206
red and 505 – 550 nm for green. Each arbitrary fluorescent cell was blindly evaluated 207
by the experimentalist (L.K.) in a color scale of 1 (red) to 5 (green), and the color was 208
incorporated into the database obtained by the algorithm and the embryologist. 209
2.6 Statistical analysis 210
For each parameter, determined either by the algorithm (e.g. cell area, dry mass) or 211
the embryologist (e.g. head shape), the sperm cells were divided into groups 212
according to their AO colors. For the quantitative parameters, determined by the 213
Page 11
Accepted to Journal of Biophotonics, ©2018 Wiley
11
algorithm, the mean of each of the parameters was calculated and presented in a 214
column chart with error bars representing the standard error. 215
For the embryologist-determined information (binary classification), we calculated 216
the percentage of normal cells, as determined by the embryologist in this particular 217
parameter in each of the AO groups. In this experiment the significance of the 218
differences between the groups was established by the χ2 test. 219
In computer assisted evaluation of sperm cell morphological parameters, the 220
differences between groups was examined using analysis of variance (ANOVA), 221
complimented by Tukey's multiple comparisons test for comparison between the 222
different groups. The differences between groups were considered statistically 223
significant if the probability, p, for the associated value was smaller than 0.05. Slope 224
analysis was conducted wherever the changes in a particular parameter were 225
consistent over 4 fragmentation groups. The slope was calculated by linear regression. 226
The significance of the direction of the slope is shown by the 95% confidence 227
interval. All calculations were performed using IBM SPSS STATISTICS 24.0.0.1. 228
The statistical analysis was generated by IBM SPSS STATISTICS 24.0.0.1. The 229
charts were generated by the GraphPad Prism v.7 software. 230
231
Page 12
Accepted to Journal of Biophotonics, ©2018 Wiley
12
3. Results 232
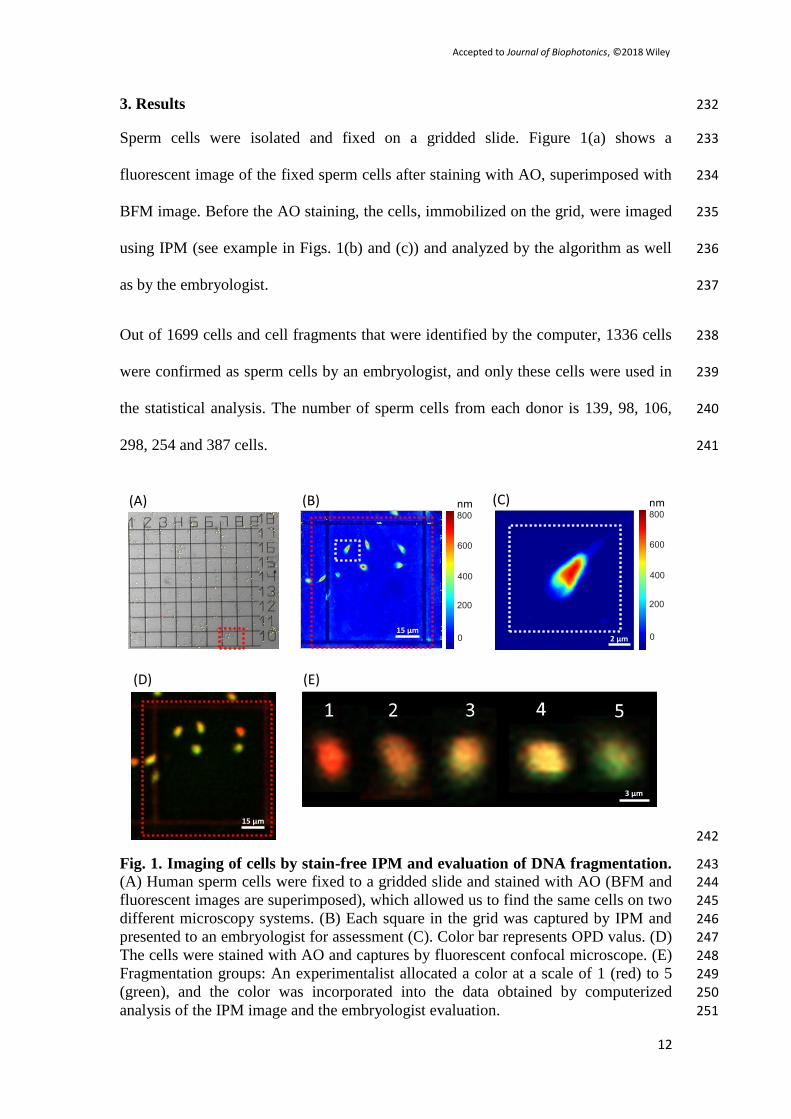
Sperm cells were isolated and fixed on a gridded slide. Figure 1(a) shows a 233
fluorescent image of the fixed sperm cells after staining with AO, superimposed with 234
BFM image. Before the AO staining, the cells, immobilized on the grid, were imaged 235
using IPM (see example in Figs. 1(b) and (c)) and analyzed by the algorithm as well 236
as by the embryologist. 237
Out of 1699 cells and cell fragments that were identified by the computer, 1336 cells 238
were confirmed as sperm cells by an embryologist, and only these cells were used in 239
the statistical analysis. The number of sperm cells from each donor is 139, 98, 106, 240
298, 254 and 387 cells. 241
242
Fig. 1. Imaging of cells by stain-free IPM and evaluation of DNA fragmentation. 243 (A) Human sperm cells were fixed to a gridded slide and stained with AO (BFM and 244 fluorescent images are superimposed), which allowed us to find the same cells on two 245
different microscopy systems. (B) Each square in the grid was captured by IPM and 246 presented to an embryologist for assessment (C). Color bar represents OPD valus. (D) 247
The cells were stained with AO and captures by fluorescent confocal microscope. (E) 248 Fragmentation groups: An experimentalist allocated a color at a scale of 1 (red) to 5 249 (green), and the color was incorporated into the data obtained by computerized 250
analysis of the IPM image and the embryologist evaluation. 251
(A)
(E)(D)
(C)(B)
15 μm
2 μm
nm
nm
15 μm
3 μm
Page 13
Accepted to Journal of Biophotonics, ©2018 Wiley
13
After the cells were imaged using IPM, the same slides were stained by AO and 252
imaged using the confocal fluorescence microscope (see example in Fig. 1(e)). We 253
then determined the color of each cell, with the color scale being from 1 – 5, with red 254
being 1 and green being 5 (see scale in Fig. 1(f)). Because the overall color of the cell 255
is determined by the sum of the green and red colors, we can regard the color of the 256
cells as a scale that reflects the proportion between dsDNA to ssDNA (single stranded 257
or fragmented DNA) and RNA, as well the overall amount of nucleic acids. The 258
number (and the percentage) of cells in each color group, from the most fragmented 259
to the least fragmented was – group 1: 84 cell (6.3%), group 2: 152 cells (11.4%), 260
group 3: 349 cells (26.1%), group 4: 624 cells (46.7%) and 5 group: 127 cells (9.5%). 261
Figure 2 shows examples of the same sperm cells, while imaged with label-free 262
qualitative Zernike’s phase contrast microscopy (left), label-free quantitative IPM 263
(center), and BFM after AO staining (right), where the colors in the latter indicate the 264
level of fragmentation in respect to Fig. 1(e). As can be seen, a simple visual 265
morphological evaluation cannot predict the level of fragmentation without staining, 266
and computational analysis has to be performed on the IPM images to detect the 267
fragmentation group. 268
Page 14
Accepted to Journal of Biophotonics, ©2018 Wiley
14
269
Fig. 2. Examples of sperm cells imaged with Zernike’s phase contrast (left), IPM 270 (center), and BFM after AO staining, and categorized by fragmentation groups. 271 Color bar represents OPD values. White scale bars represent 3 μm on the sample. 272
AO Group 1Zernike’s600
500
400
300
200
100
600
500
400
300
200
100
AO Group 2IPMZernike’s
600
500
400
300
200
100
Zernike’s IPM AO Group 5
600
500
400
300
200
100
IPMZernike’s AO Group 4
AO Group 3600
500
400
300
200
100
IPM
IPMZernike’s
Zernike’s
nm
nm
nm
nm
nm
Page 15
Accepted to Journal of Biophotonics, ©2018 Wiley
15
3.1 Distribution of DNA fragmentation level in comparison to WHO parameters 273
According to the WHO 2010 guidelines [22] for the morphological evaluation of 274
smeared and stained semen, there are 5 criteria by which a sperm is determined as 275
having "normal morphology". In order for a semen sample to be considered normal, at 276
least 4% of the sperm cells must have a normal morphology. The criteria are: an 277
acrosome that composes of 40% to 70% of the sperm head area, typical head shape, 278
no excessively large external cytoplasmic droplets, no more than 2 small cytoplasmic 279
vacuoles (<20% of head area) and only in the acrosome area, and a straight and 280
smooth midpiece. Since we have already shown that stain-free IPM and stain-based 281
BFM yield comparable results in sperm analysis [11], these parameters were 282
evaluated by an embryologist examining the stain-free IPM images, and the fraction 283
of cells that were found to be normal in each criterion, respectively, were classified 284
according to the color group, in order to determine the number of cells at each of the 285
five different levels of DNA fragmentation (Fig. 3). 286
287 Fig. 3. Evaluation of sperm morphology using WHO criteria for the different 288 DNA fragmentation groups. In each fragmentation group, the percentages of cells 289
Page 16
Accepted to Journal of Biophotonics, ©2018 Wiley
16
with "normal" morphology in the categories of: (A) head morphology, (B) acrosome 290 size, (C) midpiece, (D) cytoplasmic vacuoles, and (E) cytoplasmic droplets. χ
2 test 291
shows a statistically significant difference in the distribution of normal cells between 292 different fragmentation groups. Statistically significant difference was found only in 293
"acrosome size" category (p<0.001). 294
295
As can be seen in Fig. 3, the percentage of cells presenting normal morphology in the 296
categories "acrosome size" rises gradually from group 3 to group 5, the differences in 297
the frequency of normal cells in these categories is statistically significant (p<0.001). 298
According to all other additional criteria evaluated – Head morphology, midpiece, 299
cytoplasmic vacuoles and cytoplasmic droplets, it was found that the differences 300
between the percentage of normal cells in each color group are not statistically 301
significant. 302
3.2 Distribution of DNA fragmentation levels in comparison to IPM analysis 303
2D (Fig. 4) and 3D (Fig. 5) criteria were calculated based on the isolated cell OPD 304
maps using our algorithm. 305
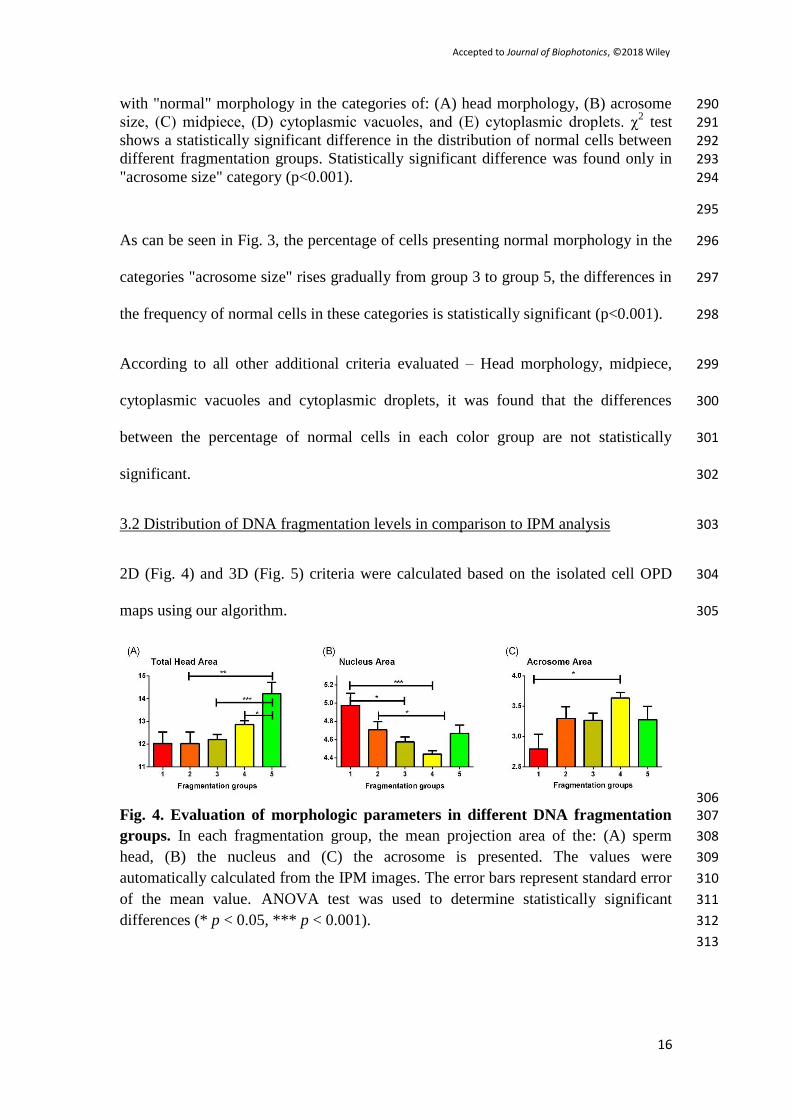
306 Fig. 4. Evaluation of morphologic parameters in different DNA fragmentation 307
groups. In each fragmentation group, the mean projection area of the: (A) sperm 308
head, (B) the nucleus and (C) the acrosome is presented. The values were 309
automatically calculated from the IPM images. The error bars represent standard error 310
of the mean value. ANOVA test was used to determine statistically significant 311
differences (* p < 0.05, *** p < 0.001). 312
313
Page 17
Accepted to Journal of Biophotonics, ©2018 Wiley
17
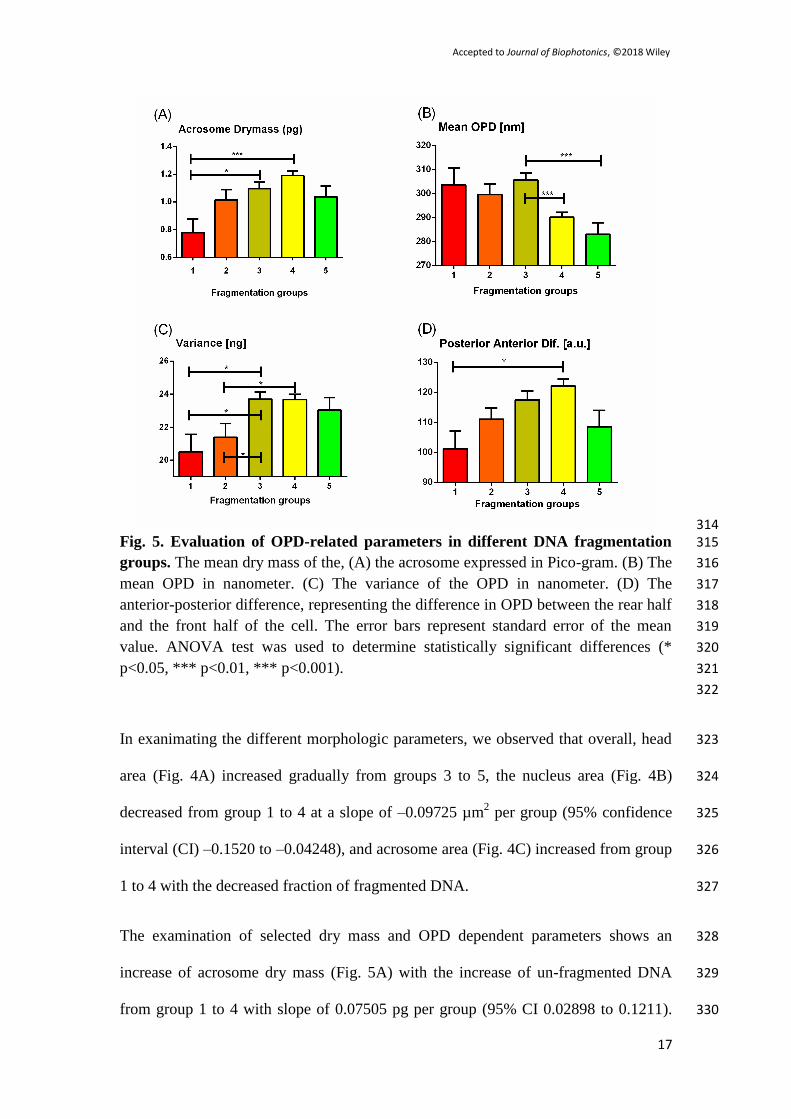
314 Fig. 5. Evaluation of OPD-related parameters in different DNA fragmentation 315
groups. The mean dry mass of the, (A) the acrosome expressed in Pico-gram. (B) The 316
mean OPD in nanometer. (C) The variance of the OPD in nanometer. (D) The 317
anterior-posterior difference, representing the difference in OPD between the rear half 318
and the front half of the cell. The error bars represent standard error of the mean 319
value. ANOVA test was used to determine statistically significant differences (* 320
p<0.05, *** p<0.01, *** p<0.001). 321
322
In exanimating the different morphologic parameters, we observed that overall, head 323
area (Fig. 4A) increased gradually from groups 3 to 5, the nucleus area (Fig. 4B) 324
decreased from group 1 to 4 at a slope of –0.09725 µm2 per group (95% confidence 325
interval (CI) –0.1520 to –0.04248), and acrosome area (Fig. 4C) increased from group 326
1 to 4 with the decreased fraction of fragmented DNA. 327
The examination of selected dry mass and OPD dependent parameters shows an 328
increase of acrosome dry mass (Fig. 5A) with the increase of un-fragmented DNA 329
from group 1 to 4 with slope of 0.07505 pg per group (95% CI 0.02898 to 0.1211). 330
Page 18
Accepted to Journal of Biophotonics, ©2018 Wiley
18
The mean OPD representing the mean thickness of the cells (Fig. 5B) declines from 331
group 3 to 5. 332
Many other criteria are useful to distinguish between the different fragmentation 333
groups. We chose to present the OPD variance (Fig. 5C) and the mean anterior- 334
posterior (Fig. 5D). OPD variance is obtained by calculating the statistical variance of 335
the OPD values on the entire cell area. OPD variance is highest in groups 3 and 4. The 336
mean anterior-posterior difference (Fig. 5D) is a metric developed by us and 337
compares the average OPD (Fig. 5B) of the anterior and posterior (Fig. 5D) halves of 338
the sperm head, it shows a gradual increase from group 1 to 4 with slope of 3.282 339
(95% CI 0.3677 to 6.197). This trend is reversed in group 5, emphasizing the 340
difference of these cells from group 4. 341
To summarizing the results, we conclude that sperm cells in the most fragmented 342
groups (groups 1 and 2) are characterized by a large nuclear area (Fig. 4B) and small 343
acrosomes (Fig. 4C). The medium fragmented groups (groups 3 and 4) are 344
characterized by a small and compressed nucleus (Fig. 4B). Group 4 is distinguished 345
from group 3 by its larger acrosomes (Fig. 4C) and lower mean OPD (Fig. 5B). Group 346
5 is characterized by the largest head area (Fig. 4A) and a large acrosome (Fig. 5A) 347
similar to that of cells in group 4. However, cells in group 5 have a smaller mean 348
OPD (Fig. 5B) than cells in group 4. Overall, we determine that there is no single 349
criteria that can distinguish between the different fragmentation groups, thus only a 350
combination of the different criteria can reliably predict the fragmentation status. 351
4. Discussion and Conclusions 352
In this paper, we used AO staining as a verification method to IPM. There are several 353
direct methods to test DNA fragmentation in sperm (reviewed in Ref. [27]). The two 354
Page 19
Accepted to Journal of Biophotonics, ©2018 Wiley
19
most prevalent methods in the clinical setting are sperm chromatin structure assay 355
(SCSA) and the TUNEL assay. For the routine diagnosis of patients, these methods 356
are used with flow cytometry. SCSA uses AO staining [28], resulting in DNA 357
fragmentation index (DFI), which corresponds to the presence of sperm cells that 358
show high levels of red staining. The current threshold for abnormal DFI is 25% of 359
sperm cells. SCSA also identifies a subpopulation of cells that emits high level of 360
green light, which possesses high DNA stainability (HDS), but this population has no 361
effect on the DFI and thus it is not used in clinical decisions. In this work, we have 362
chosen to use Tejada’s method [26], rather than an SCSA test. In this case, the emitted 363
fluorescence from the AO-stained sperm cells enabled us to divide the cells into 5 364
different groups, including group #5 that we attribute as the HDS group, which is 365
characterized by dsDNA but with impered DNA packing [29]. 366
Although the different DNA fragmentation assays are efficient in diagnosing patients 367
with high percentage of defective sperm cells, they are not applicable in the selection 368
of sperm for ICSI. An indirect indication for the DNA fragmentation is the lack of 369
acrosome reaction [30] or morphological deformities in sperm head such as 370
globozoospermia (a condition characterized by abnormal sperm morphology, 371
including small or absent acrosome) [31]. Indeed, our results indicate that 372
fragmentation groups 3 and 4 showed a larger acrosome compared to groups 1 and 2. 373
The correlation between DNA fragmentation and acrosomal deficiencies is explained 374
by defects during the late spermatogenesis. During that stage in sperm development, 375
somatic cell histones are replaced by protamines: proteins necessary for the 376
condensed DNA packaging as well as the protection from DNA damage. 377
Concurrently, during spermatogenesis, the acrosome is formed. Thus, sperm cells that 378
underwent defected spermiogenesis are likely to present both defected DNA and 379
Page 20
Accepted to Journal of Biophotonics, ©2018 Wiley
20
defected acrosomes [31-33]. The apparent link between defected DNA and defected 380
acrosomes may have an evolutionary reason: to prevent the useless fertilization of an 381
egg by a defective sperm. However, in the context of ICSI, the acrosome has no role 382
in penetrating the ovule during fertilization, thus this evolutionary mechanism is 383
neutralized. Moreover, current ICSI practice is often conducted under relatively weak 384
magnification such as 20×. Under this magnification, the embryologist responsible for 385
selecting the sperm to be used in the fertilization can evaluate only observable 386
characters of the sperm cells such as motility or major defects in morphology. 387
In our results, we demonstrate no statistical link between midpiece morphology and 388
DNA fragmentation. The midpiece is the organelle responsible for cell motility, an 389
abnormal midpiece is correlated with impaired motility and reduced fertilization rate 390
during IVF [34]. In general, it has been long shown that sperm motility is correlated 391
to DNA fragmentation [35]; however, DNA fragmentation was reported as a better 392
predictor for conception than progressive morphology in the context of ICSI [36], 393
making the selection process prone to error. 394
In our results, we did not observe statistically significant differences in the prevalence 395
of cytoplasmic vacuoles in sperm cells with different DNA fragmentation levels. 396
Cytoplasmic vacuoles in sperm cells are subtle morphological nuclear malformations 397
caused by DNA condensation defects in the nucleus [33], and is one of the structures 398
that can easily be observed using IMSI [34]. In that method, sperm cells are examined 399
under a high-magnification (at least 6000x, most of which is a digital magnification, 400
which is convenient for view by the observer on a screen) DIC microscope. Using 401
IMSI, several cellular characteristics, which cannot be observed using a regular ICSI 402
microscope, are distinguished. These include the presence of cytoplasmic vesicles and 403
the head detailed shape. The acrosome can also be viewed in this method; however, 404
Page 21
Accepted to Journal of Biophotonics, ©2018 Wiley
21
its exact size and mass cannot be quantified using DIC microscopy. In any case, the 405
clinical significance of cytoplasmic vesicles is a topic of debate in the clinical 406
community. In some reports, it has been shown that there is a positive correlation 407
between fractions of sperm with cytoplasmic vacuoles and those with DNA 408
fragmentation [35,36], while different conclusions are drawn by other investigators 409
that claim cytoplasmic vacuoles do not correlate with a significant difference in DNA 410
fragmentation or with aneuploidy [14,37]. Overall, IMSI was found by meta-analysis 411
to increase implantation and pregnancy rates as well as to decrease the chances of 412
miscarriage in couples that had at least one failed ICSI attempt [16]. 413
The moderate improvement in fertilization and pregnancy rates using the IMSI 414
method suggests that improved sperm visualization can improve overall results. Thus, 415
we expect that the use of IPM, which is a fully quantitative imaging method for sperm 416
evaluation, will further improve the selection of fertile sperm cells when staining is 417
not possible. In our results, we did not observe statistically significant differences in 418
the prevalence of cytoplasmic vacuoles in sperm cells with different DNA 419
fragmentation levels; however, the low number of cytoplasmic vacuoles observed this 420
cohort of donors is sufficient to draw conclusions on the validity of cytoplasmic 421
vacuoles as a marker for DNA fragmentation. 422
In this work, we demonstrate a trend-correlation between various parameters that can 423
be accurately quantified only by IPM and the ratio of ssDNA to dsDNA in sperm cells 424
as observed under fluorescent microscopy after staining the same cells with AO. 425
Unlike other works utilizing AO [26], we did not use a single color as a threshold 426
between sperm cells with fragmented or un-fragmented DNA. The benefit in dividing 427
the cells to five different groups by color is that it enables us to examine the 428
morphologic characteristics of each group separately. 429
Page 22
Accepted to Journal of Biophotonics, ©2018 Wiley
22
After an embryologist examined the OPD maps of the different groups using the 430
various WHO criteria: head morphology, acrosome size, cytoplasmic vacuoles, 431
midpiece integrity and cytoplasmic droplets, we observed a gradual increase in the 432
percentage of "normal" cells from group 3 to 5 in the category of acrosome size. All 433
other morphological criteria, the distribution of normal head morphology; midpiece 434
integrity and cytoplasmic vacuoles, did not present clear changes in their occurrence 435
between the different fragmentation groups. 436
Following the digital examination of the spermatozoa OPD maps and their 437
comparison to the different fragmentation groups, we observed differences in the 438
values of parameters that can only be calculated by IPM, such as the mean OPD, the 439
size of the acrosome or the mean posterior anterior difference, amongst the different 440
groups. In examining the cells by IPM, we observed that sperm cells in group 5, the 441
cells that emit bright green fluorescence, are distinct from all other cell groups. These 442
cells present larger head area and nucleus compared to groups 3 and 4 with lower 443
density. We presume that this population of cells are HDS, a population of sperm cells 444
with defected DNA arrangement [38]. Interestingly, an embryologist examination of 445
group 5 sperm cells shows a small increase in the percentage of normal cells in the 446
categories of head morphology and acrosome size, in comparison with fragmentation 447
groups 3 and 4. Further research will determine the clinical significance of the 448
difference between fragmentation groups and its effect on ICSI outcomes. Although 449
HDS cells are a clearly defined population of cells [28], to the best of our knowledge 450
no attempt has ever been performed to use these cells ether as a diagnostic tool or as a 451
population to avoid in the selection of sperm in ICSI. 452
Although thousands of cells were analyzed, possible limitations of this work are the 453
relatively small number of donors (six) and the fact that the donors are not known to 454
Page 23
Accepted to Journal of Biophotonics, ©2018 Wiley
23
have fertility problems, making them unrepresentative of men in need of ARTs. 455
However, note that even in healthy donors, only 4% of the cells are defined as normal. 456
Therefore, our sample had enough abnormal sperm cells for the analysis performed. 457
In addition, in order to image the same cells with two microscopy systems (IPM and 458
confocal fluorescence microscopy), we fixed the cells. However, IPM can also be 459
performed for live unfixed cells, as we demonstrated previously [39]. Since the 460
fixation procedure did not visually change the cell morphology, we hypothesize that 461
IPM imaging of live cells in medium will yield similar results in detecting DNA 462
fragmentation. 463
We conclude that IPM imaging can produce a detailed and quantitative morphological 464
map of sperm cells. Computerized analysis of these images produces a set to 465
quantitative measurements for morphological parameters. A combination of these 466
parameters with an associated classifier might be able to automatically predict the 467
DNA fragmentation levels of individual living cells without staining. If the IPM 468
method is to be utilized in the selection process for ICSI, it might improve the 469
selection of sperm and thus increase the odds for successful fertilization. 470
471
List of References 472
1. D. P. Evenson, Z. Darzynkiewicz, M. R. Melamed. Relation of mammalian 473
sperm chromatin heterogeneity to fertility. Science 1980, 210(4474), 1131. 474
2. L. Robinson, I. D. Gallos, S. J. Conner, M. Rajkhowa, D. Miller, S. Lewis, J. 475
Kirkman-Brown, A. Coomarasamy. The effect of sperm DNA fragmentation on 476
miscarriage rates: a systematic review and meta-analysis. Hum Reprod 2012, 477
27(10), 2908. 478
3. R. Henkel, E. Kierspel, M. Hajimohammad, T. Stalf, C. Hoogendijk, C. Mehnert, 479
C. Hoogendijk. DNA fragmentation of spermatozoa and assisted reproduction 480
technology. Reprod Biomed Online 2003, 7(4), 477. 481
4. L. Simon, A. Zini, A. Dyachenko, A. Ciampi, D. T. Carrell. A systematic review 482
and meta-analysis to determine the effect of sperm DNA damage on in vitro 483
Page 24
Accepted to Journal of Biophotonics, ©2018 Wiley
24
fertilization and intracytoplasmic sperm injection outcome. Asian J Androl 2016, 484
19, 80. 485
5. K. R. Chohan, J. T. Griffin JT, D. T. Carrell. Evaluation of chromatin integrity in 486
human sperm using acridine orange staining with different fixatives and after 487
cryopreservation. Andrologia 2004, 36(5), 321. 488
6. N. P. Singh, C. H. Muller, R. E. Berger. Effects of age on DNA double-strand 489
breaks and apoptosis in human sperm. Fertil Steril 2003, 80(6), 1420. 490
7. A. Ahmadi, S. C. Ng. Fertilizing ability of DNA-damaged spermatozoa. J Exp 491
Zool. 1999, 284(6), 696. 492
8. G. Barroso, M. Morshedi, S. Oehninger. Analysis of DNA fragmentation, plasma 493
membrane translocation of phosphatidylserine and oxidative stress in human 494
spermatozoa. Hum Reprod 2000, 15(6), 1338. 495
9. J. L. Fernández, L. Muriel, M. T. Rivero, V. Goyanes, R. Vazquez, J. G. Alvarez. 496
The sperm chromatin dispersion test: a simple method for the determination of 497
sperm DNA fragmentation. J Androl 2013, 24(1), 59. 498
10. K. L. Larson, C. J. DeJonge, A. M. Barnes, L. K. Jost, D. P. Evenson. Sperm 499
chromatin structure assay parameters as predictors of failed pregnancy following 500
assisted reproductive techniques. Hum Reprod 2000, 15(8), 1717. 501
11. M. Haifler, P. Girshovitz, G. Band, G. Dardikman, I. Madjar, N. T. Shaked. 502
Interferometric phase microscopy for label-free morphological evaluation of 503
sperm cells. Fertil Steril 2015, 104(1), 43. 504
12. M. Simopoulou, L. Gkoles, P. Bakas, P. Giannelou, T. Kalampokas, K. Pantos, 505
M. Koutsilieris. Improving ICSI: A review from the spermatozoon perspective. 506
Syst Biol Reprod Med 2016, 62(6), 359. 507
13. B. Bartoov, A. Berkovitz, F. Eltes. Selection of spermatozoa with normal nuclei 508
to improve the pregnancy rate with intracytoplasmic sperm injection. N Engl J 509
Med 2001, 345(14), 1067. 510
14. F. Boitrelle, F. Ferfouri, J. M. Petit, D. Segretain, C. Tourain, M. Bergere, M. 511
Bailly, F. Vialard, M. Albert, J. Selva. Large human sperm vacuoles observed in 512
motile spermatozoa under high magnification: nuclear thumbprints linked to 513
failure of chromatin condensation. Hum Reprod 2011, 26(7), 1650. 514
15. N. G. Cassuto, A. Hazout, I. Hammoud, R. Balet, D. Bouret, Y. Barak Y, S. 515
Jellada, J. M. Ploucharta, J. Selva, C. Yazbeckde. Correlation between DNA 516
defect and sperm-head morphology. Reprod Biomed Online 2012, 24(2), 211. 517
16. A. S. Setti, D. P. A. F. Braga, R. C. S. Figueira, A. Iaconelli, E. Borges. 518
Intracytoplasmic morphologically selected sperm injection results in improved 519
clinical outcomes in couples with previous ICSI failures or male factor infertility: 520
a meta-analysis. Eur J Obstet Gynecol Reprod Biol 2014, 183, 96. 521
17. F. Boitrelle, B. Guthauser, L. Alter, M. Bailly, M. Bergere, R. Wainer, F. 522
Vialard, M. Albert, J. Selva, High-magnification selection of spermatozoa prior 523
to oocyte injection: confirmed and potential indications. Reprod Biomed Online 524
2014, 28(1), 6. 525
18. P. Girshovitz, N. T. Shaked. Generalized cell morphological parameters based on 526
interferometric phase microscopy and their application to cell life cycle 527
characterization. Biomed Opt Express 2012, 3(8), 1757. 528
19. G. Popescu. Quantitative phase imaging of cells and tissues: McGraw Hill 529
Professional; 2011. 530
Page 25
Accepted to Journal of Biophotonics, ©2018 Wiley
25
20. K. Lee, K. Kim, J. Jung, J. Heo, S. Cho, S. Lee, G. Chang, Y. Jo, H. Park, Y. 531
Park. Quantitative phase imaging techniques for the study of cell 532
pathophysiology: from principles to applications. Sensors 2013, 13(4), 4170. 533
21. P. Girshovitz, N. T. Shaked. Compact and portable low-coherence interferometer 534
with off-axis geometry for quantitative phase microscopy and nanoscopy. Opt 535
Express 2013, 21(5), 5701. 536
22. WHO laboratory manual for the examination and processing of human semen. 537
World Health Organization 2010. 538
23. S. K. Mirsky, I. Barnea, M. Levi, H. Greenspan, N. T. Shaked. Automated 539
analysis of individual sperm cells using stain-free interferometric phase 540
microscopy and machine learning. Cytometry A 2017, 91(9), 893. 541
24. G. Popescu, Y. Park, N. Lue, C. Best-Popescu, L. Deflores, R. R. Dasari, M. S. 542
Feld, K. Badizadegan. Optical imaging of cell mass and growth dynamics. 543
American Journal of Physiology-Cell Physiology 2008, 295(2), C538. 544
25. M. Balberg, M. Levi, K. Kalinowski, I. Barnea, S. K. Mirsky, N. T. Shaked. 545
Localized measurements of physical parameters within human sperm cells 546
obtained with wide-field interferometry. J Biophotonics 2017, 10, 1305. 547
26. R. I. Tejada, J. C. Mitchell, A. Norman, J. J. Marik, S. Friedman. A test for the 548
practical evaluation of male fertility by acridine orange (AO) fluorescence. Fertil 549
Steril 1984, 42(1), 87. 550
27. A. Agarwal, A. Majzoub, S. C. Esteves, E. Ko, R. Ramasamy, A. Zini. Clinical 551
utility of sperm DNA fragmentation testing: practice recommendations based on 552
clinical scenarios. Transl Androl Urol 2016, 5(6), 935. 553
28. D. P. Evenson. Sperm Chromatin Structure Assay (SCSA). In: Methods in 554
molecular biology (Clifton, NJ) 2013, 147. 555
29. D. Domínguez-Fandos, M. I. Camejo, J. L. Ballescà, R. Oliva. Human sperm 556
DNA fragmentation: Correlation of TUNEL results as assessed by flow 557
cytometry and optical microscopy. Cytometry A 2007, 71(12), 1011. 558
30. B. Ozmen, G. S. Caglar, F. Koster, B. Schopper, K. Diedrich, S. Al-Hasani. 559
Relationship between sperm DNA damage, induced acrosome reaction and 560
viability in ICSI patients. Reprod Biomed Online 2007, 15(2), 208. 561
31. S. Brahem, M. Mehdi, H. Elghezal, A. Saad. Analysis of sperm aneuploidies and 562
DNA fragmentation in patients with globozoospermia or with abnormal 563
acrosomes. Urology 2011, 77(6), 1343. 564
32. F. G. Iranpour. The effects of protamine deficiency on ultrastructure of human 565
sperm nucleus. Adv Biomed Res 2014, 3(1), 24. 566
33. A. Perdrix, A. Travers, M. H. Chelli, D. Escalier, J. L. Do Rego, J.P. Milazzo N. 567
Mousset-Siméon, B. Macé, N. Rives. Assessment of acrosome and nuclear 568
abnormalities in human spermatozoa with large vacuoles. Hum Reprod 2011, 569
26(1), 47. 570
34. A. Berkovitz, F. Eltes F, Yaari S, Katz N, Barr I, Fishman A, B. Bartoov. The 571
morphological normalcy of the sperm nucleus and pregnancy rate of 572
intracytoplasmic injection with morphologically selected sperm. Hum Reprod 573
2005, 20(1), 185. 574
35. J. B. A. Oliveira, F. C. Massaro, R. L. R. Baruffi, A. L. Mauri, C. G. Petersen, L. 575
F. I. Silva, D. Vagnini, J. G. Franco. Correlation between semen analysis by 576
Page 26
Accepted to Journal of Biophotonics, ©2018 Wiley
26
motile sperm organelle morphology examination and sperm DNA damage. Fertil 577
Steril 2010, 94(5), 1937. 578
36. A. Garolla, D. Fortini, M. Menegazzo, L. De Toni, V. Nicoletti, A. Moretti, R. 579
Selice, B. Engl, C. Foresta. High-power microscopy for selecting spermatozoa 580
for ICSI by physiological status. Reprod Biomed Online 2008, 17(5), 610. 581
37. A. Fortunato, R. Boni, R. Leo, G. Nacchia, F. Liguori, S. Casale, P. Bonassisa, E. 582
Tosti. Vacuoles in sperm head are not associated with head morphology, DNA 583
damage and reproductive success. Reprod Biomed Online 2016, 32(2), 154. 584
38. D. P. Evenson, L. K. Jost, M. Corzett, R. Balhorn. Characteristics of human 585
sperm chromatin structure following an episode of influenza and high fever: a 586
case study. J Androl 2000, 21(5), 739. 587
39. P. Jacob Eravuchira, S. K. Mirsky, I. Barnea, M. Levi, M. Balberg, N. T. Shaked. 588
Individual sperm selection by microfluidics integrated with interferometric phase 589
microscopy. Methods 2018, 136, 152. 590
591
592
593
Page 27
Accepted to Journal of Biophotonics, ©2018 Wiley
27
Acknowledgements 594
This research was supported by Momentum fund from Ramot at Tel Aviv University. 595
596
Graphical Abstract 597
We imaged sperm cells using stain-free interferometric phase microscopy, a 598
quantitative phase imaging method. Next, the same sperm cells were stained by 599
acridine orange (AO), a DNA fragmentation indicator, and imaged using a 600
fluorescence confocal microscope. Our results indicate on significant differences in 601
IPM-based parameters between the AO fragmentation groups. We conclude that stain- 602
free IPM may assist in selecting sperm cells with intact DNA, potentially increasing 603
percentage of successful pregnancies. 604
605
606


![Osmotic tolerance of rat spermatozoa - NISTJBenson/website/Publications_files...in different mouse strains [Thornton et al., 1999], rat spermatozoa cryopreservation was not reported](https://static.documents.pub/doc/80x56/5ecf254c24359c0e2b5de382/osmotic-tolerance-of-rat-spermatozoa-nist-jbensonwebsitepublicationsfiles.jpg)


